
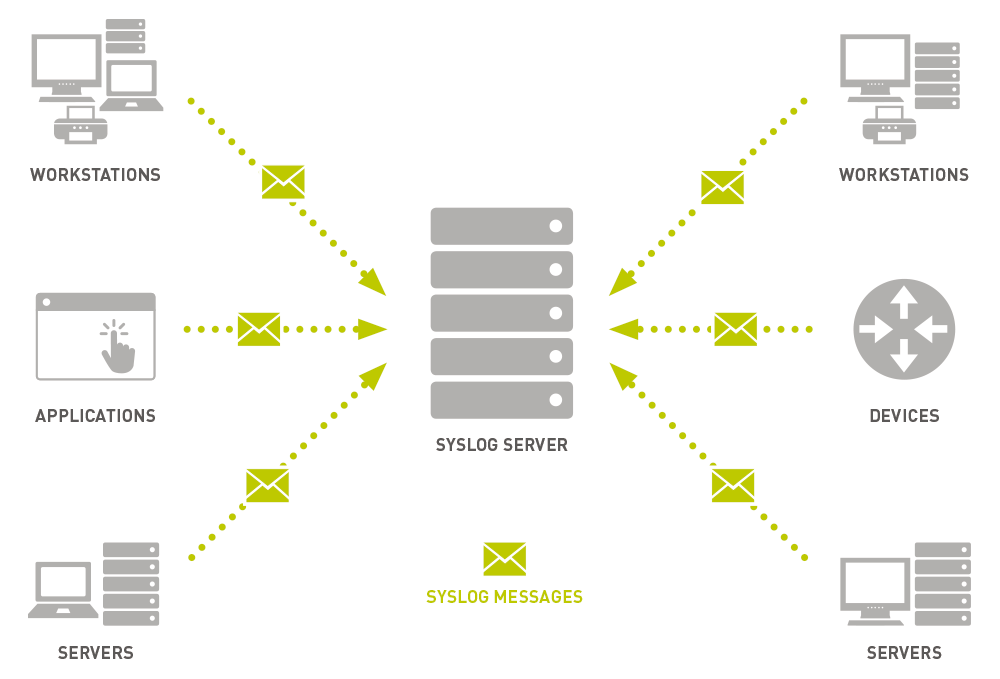
Протокол Syslog — это способ для сетевых устройств отправлять сообщения о событиях на сервер регистрации — обычно известный как Syslog сервер. Этот протокол поддерживается широким спектром устройств и может использоваться для регистрации различных типов событий. Например, маршрутизатор может отправлять сообщения о том, что пользователи подключаются через консоль, а веб-сервер может регистрировать события, в которых отказано в доступе.

Большинство сетевых устройств, таких как маршрутизаторы и коммутаторы, могут отправлять сообщения системного журнала. Кроме того, серверы *nix также могут генерировать данные системного журнала, как и большинство брандмауэров, некоторые принтеры и даже веб-серверы, такие как Apache. Серверы на базе Windows изначально не поддерживают Syslog, но большое количество сторонних инструментов позволяет легко собирать данные журнала событий Windows или IIS и пересылать их на сервер Syslog.
В отличие от SNMP, Syslog не может использоваться для «опроса» устройств для сбора информации. Например, SNMP имеет сложную иерархическую структуру, которая позволяет станции управления запрашивать у устройства информацию о таких вещах, как данные о температуре или доступное дисковое пространство. Это невозможно с Syslog — он просто отправляет сообщения в центральное место, когда инициируются определенные события.

Syslog серверы
Syslog — отличный способ объединить логи из нескольких источников в одном месте. Как правило, большинство серверов Syslog имеют несколько компонентов, которые делают это возможным.
- Syslog слушатель: Syslog сервер должен получать сообщения, отправленные по сети. Процесс прослушивания собирает данные системного журнала, отправленные через 514 UDP порт. Как мы знаем UDP-сообщения не подтверждаются или не гарантируются, поэтому имейте в виду, что некоторые сетевые устройства будут отправлять данные Syslog через 1468 TCP порт для обеспечения доставки сообщений.
- База данных: большие сети могут генерировать огромное количество данных syslog’а . Хорошие серверы будут использовать базу данных для хранения логов для быстрого поиска.
- Программное обеспечение для управления и фильтрации: из-за больших объемов данных иногда бывает сложно найти конкретные записи в журнале. Решение состоит в том, чтобы использовать syslog сервер, который автоматизирует часть работы и позволяет легко фильтровать и просматривать важные сообщения журнала. Серверы должны иметь возможность генерировать оповещения, уведомления и алерты в ответ на выбранные сообщения, чтобы администраторы сразу узнавали, когда возникла проблема, и могли предпринять быстрые действия
Syslog сообщения
Сообщения системного журнала обычно содержат информацию, помогающую определить основную информацию о том, где, когда и почему был отправлен лог: IP-адрес, отметка времени и фактическое сообщение.
Системный журнал использует концепцию, называемое “facility”, чтобы идентифицировать источник сообщения на любом компьютере. Например, facility “0” будет сообщением ядра, а facility «11» будет сообщением FTP. Это восходит своими корнями к syslog’а UNIX. В большинстве сетевых устройств Cisco используются коды объектов «Local6» или «Local7».
Syslog сообщения также имеют поле уровня серьезности. Уровень серьезности указывает, насколько важным считается сообщение. Серьезность «0» является чрезвычайной ситуацией, «1» — это предупреждение, которое требует немедленных действий, а шкала продолжается вплоть до «6» и «7» — информационных и отладочных сообщений.
| 0 | Emergency | Система не работоспособна |
|---|---|---|
| 1 | Alert | Система требует немедленного вмешательства |
| 2 | Critical | Состояние системы критическое |
| 3 | Error | Сообщения об ошибках |
| 4 | Warning | Предупреждения о возможных проблемах |
| 5 | Notice | Сообщения о нормальных, но важных событиях |
| 6 | Informational | Информационные сообщения |
| 7 | Debug | Отладочные сообщения |
Недостатки syslog
У протокола syslog есть несколько недостатков.
Во-первых, проблема согласованности. Протокол Syslog не определяет стандартный способ форматирования содержимого сообщения — и существует столько же способов форматирования сообщения, сколько существует разработчиков. Некоторые сообщения могут быть удобочитаемыми, а некоторые нет. Syslog это не волнует — он просто предоставляет способ передачи сообщения.
Есть также некоторые проблемы, которые возникают из-за того, что syslog использует UDP в качестве транспорта — поэтому возможно потерять сообщения из-за перегрузки сети или потери пакетов.
Наконец, есть некоторые проблемы безопасности. В сообщениях syslog’а нет аутентификации, поэтому один компьютер может выдать себя за другой компьютер и отправить ложные события журнала. Он также подвержен повторным атакам.
Несмотря на это, многие администраторы считают, что syslog является ценным инструментом, и что его недостатки относительно незначительны.
Syslog, is a standardized way (or Protocol) of producing and sending Log and Event information from Unix/Linux and Windows systems (which produces Event Logs) and Devices (Routers, Firewalls, Switches, Servers, etc) over UDP Port 514 to a centralized Log/Event Message collector which is known as a Syslog Server.
One of the main reasons Syslog was so widely accepted throughout the industry was because of its simplicity – There is little to no uniformity or standardization when it comes to the content that a Device, Server or Operating system is written and sends log information.
It simply sends and transports messages over Syslog protocol with no acknowledgement of receipt (hence the use of UDP).
Furthermore, there is no complex requirements between the Sending device and Receiving/Collecting Server, as Syslog messages are simply just sent regardless if there is a Receiver configured on the other end or not.
The Basics
- Definition and Overview
- Ports and OSI Layer
- Collector and Server
- Syslog Message/Packet Parts
Definition and Overview
Syslog stands for “System Logging Protocol,” and is used on Devices such as routers, switches, firewalls, wifi access points, Unix/Linux Servers (Windows servers use Event Logs, which can be used in conjunction with a Syslog server) and other network devices.
It is used to store events or log messages locally within the device and send the Event/Log Information to a Collector (otherwise known as a Syslog Server) to collect, organize and filter all the logs and data.
Simply, a Server or other Network device on your network can be Configured to generate Syslog/Event Messages and forward them to a Syslog Server (or Daemon), which then allows network administrators to track and monitor those networked devices of any issues or problems that need to be attended to immediately.
A message/event is sent from the Device to a collector (or Server) using UDP, which is a connection-less protocol.
Messages are usually text and usually no larger than 1024 bytes.
Since they are sent using UDP, no receipt of transmission or arrival is sent to the originator, which means that if a packet gets lost during transmission, its gone!
A Server/Daemon allows you to collect, filter, organize, setup alerts for certain events from one location within your network.
Having all the log information data in one place also gives you the ability to create elaborate reports, diagrams and charts to visualize certain aspects of your systems and infrastructure.
Port and OSI Layer
Syslog is part of the Transport layer in the OSI Model, using User Datagram Protocol (UDP) to transport/transfer information across the network.
Syslog Port Number: UDP 514
Syslog Server/Daemon or Collector
The Server/Daemon listens for Syslog messages being sent to it, but unlike other monitoring protocols, such as SNMP, the server cannot Request information to be sent from a Device, as the protocol does not support that type of behavior.
Simply, its like watching Live Television, what they show you on Live TV is what you get, you cannot request for them to show you anything else, its a one-way broadcast.
Its recommended that Syslog Servers be heavily equipped with large amounts of Disk space, CPU and Memory for running larger reports and having a lengthy history of logs from multiple devices, as well as keeping older events/logs for historical purposes.
Collecting, compiling and calculating large amounts of data, along with configuring alerts and monitors is a very important part of making sure you know the status of your network and the components that make it up.
What Makes a Syslog Message/Packet
A Syslog Packet is made up of 3 parts and cannot exceed 1,204 bytes (or 1 Kb):
- PRI – Priority Value
- HEADER – Header
- MSG – Message
PRI – Priority Value
The Priority Value is the first part of the Syslog Message, spanning exactly either 3, 4 or 5 characters and bound by Angle Brackets (“<” and “>”), and represents the Facility and theSeverity of the message.
Priority Values are calculated as follows: Facility Value * 8 + Severity Value = Priority Value
For example: if you get a “Mail System” Facility, the value is 2, and a Severity Value of 1 (Alert: action must be taken immediately), then the Priority Value = <17> (priority values are enclosed in Angle brackets, or in between less-than and greater-than brackets).
Facility and Severity values are coded Numerically with Decimal Values and have the following values assigned to them.
Facility Codes
Facility Codes is a component of either an application or operating system that generates a Log/Event Message from the table below:
| Numerical Code | Facility |
|---|---|
| 0 | kernel messages |
| 1 | user-level messages |
| 2 | mail system |
| 3 | system daemons |
| 4 | security/authorization messages |
| 5 | messages generated internally by syslogd |
| 6 | line printer subsystem |
| 7 | network news subsystem |
| 8 | UUCP subsystem |
| 9 | clock daemon |
| 10 | security/authorization messages |
| 11 | FTP daemon |
| 12 | NTP subsystem |
| 13 | log audit |
| 14 | log alert |
| 15 | clock daemon |
| 16 | local use 0 |
| 17 | local use 1 |
| 18 | local use 2 |
| 19 | local use 3 |
| 20 | local use 4 |
| 21 | local use 5 |
| 22 | local use 6 |
| 23 | local use 7 |
Reference: http://www.ietf.org/rfc/rfc3164.txt
Severity Codes
Severity Codes is a numerical code or number that tranlates into a Severity Level or message. A list of Numerical Codes and its corresponding message are highlighted in the table below:
| Numerical Code | Severity |
|---|---|
| 0 | Emergency: System is Unusable |
| 1 | Alert: Action must be taken immediately |
| 2 | Critical: Critical Conditions |
| 3 | Error: Error Conditions |
| 4 | Warning: Warning Conditions |
| 5 | Notice: Normal but Significant Condition |
| 6 | Informational: Informational messages |
| 7 | Debug: Debug-Level messages |
Reference: http://www.ietf.org/rfc/rfc3164.txt
Header
The header portion of a Syslog packet contains the following informatin:
- Timestamp – the Combination of the DATE and TIME that the message was initially generated (based on each individuals systems’ time). Be sure that each system’s time is in sync in order to maintain proper timestamps.
- Hostname or IP Addresss of the Network Device
MSG – (Message portion of the Packet)
The last part of the Syslog packet is the MSG, which will use the remainder of the available space of a packet. The MSG will contain information generated by the device with information regarding the log or event. The MSG contains 2 fields as well:
- TAG – indicates the Process or Program that has triggered or generated the message.
- CONTENT – contains details of the message.
Checkout our related articles here:
Event Log Forwarding (Windows)
Kiwi Syslog Server Review
PRTG Syslog Server Review
SNMP Syslog Watcher Review
6 Free Syslog Servers for Windows/Linux
Журнал событий Windows Server — это инструмент, без которого администраторы не смогут контролировать состояние целой системы. В статье рассказали, как посмотреть журнал событий Windows Server и разобрали методы работы с логами сервера.
Журнал событий Windows Server — это инструмент, который помогает администраторам контролировать состояние системы, выявлять проблемы и диагностировать ошибки. Этот компонент является важной частью управления сервером, позволяя отслеживать действия пользователей, работу приложений и состояние оборудования.
По сути, это чёрный ящик системы, где фиксируются все действия, ошибки и изменения, происходящие на сервере. Однако в отличие от авиационных чёрных ящиков, журнал событий Windows Server предоставляет возможность не только ретроспективного анализа, но и проактивного мониторинга, что делает его важным инструментом для предотвращения сбоев.
Каждое событие в системе записывается в виде структурированных данных, включая такие параметры, как дата и время события, источник, уникальный идентификатор и уровень серьёзности (например, «Информация», «Предупреждение» или «Ошибка»). Это позволяет администраторам быстро находить важные события среди тысяч записей, которые могут накапливаться ежедневно в больших системах.
Ранее в блоге рассказали, как установить Windows Server.
Структура журнала событий
Windows Server организует данные в логах по категориям, что делает их использование интуитивно понятным. Вот ключевые категории и их значение:
- Системные события. Эта категория фиксирует все события, связанные с работой самого Windows Server, включая запуск и остановку служб, обновления системы, ошибки оборудования или драйверов. Например, если служба DNS перестала работать, системный журнал покажет причину сбоя.
- Приложения. Этот раздел хранит события, связанные с установленным на сервере ПО. Логи из этой категории помогают понять, почему приложение, например, SQL Server или «1С», работает некорректно.
- Безопасность. Категория «Безопасность» содержит информацию о попытках входа в систему, изменении учётных записей или прав доступа. Это важнейший раздел для отслеживания несанкционированного доступа и построения аудита безопасности.
Эти три категории — основа, но в Windows Server 2019 появились дополнительные инструменты, такие как каналы «Перенаправленные события», которые нужны для агрегирования событий с нескольких серверов для централизованного анализа.
Как журнал событий помогает в работе
Представьте себе ситуацию: сервер внезапно перестал отвечать на сетевые запросы. Вместо того чтобы слепо пытаться перезагрузить систему или искать проблему вручную, администратор может сразу открыть журнал событий и посмотреть, не было ли предупреждений в разделе «Система». Записи могут указать, например, на сбой сетевого драйвера или перегрузку аппаратного оборудования.
Другой пример — анализ неудачных попыток входа в систему. Если кто-то неоднократно вводит неправильный пароль для учётной записи администратора, события в разделе «Безопасность» покажут IP-адрес источника и время каждой попытки. Эти данные помогут быстро идентифицировать возможную атаку.
Для крупных организаций журнал событий часто становится частью политики соответствия стандартам, таким как ISO 27001 или GDPR. Все записи можно экспортировать в syslog-системы для централизованного хранения и анализа.
В ИТ-инфраструктуре отказоустойчивость и безопасность являются приоритетами, и журнал событий Windows Server создаёт фундамент для их достижения. Он не только позволяет восстанавливать систему после сбоя, но и помогает предупреждать проблемы, выявляя аномалии в работе служб или аппаратного обеспечения.
Для мониторинга и анализа логов на высоконагруженных серверах важно иметь стабильное оборудование. Например, провайдер AdminVPS предлагает аренду выделенных серверов, которые обеспечивают высокую производительность и надёжность для управления системой.
Возможности журнала событий
Windows Server можно интегрировать с системой уведомлений и автоматизации. Например, используя PowerShell, администратор может настроить автоматическое создание предупреждений, если в журнале появляется определённое событие. Допустим, если сервер регистрирует высокую загрузку процессора, система может отправить уведомление на электронную почту или создать задачу в системе мониторинга.
Каналы событий (Event Channels) — это специализированные журналы для отдельных служб или приложений, например, событий, связанных только с Hyper-V или Windows Firewall. Работа с этими каналами даёт возможность получать точечную информацию, избегая перегруженности основного журнала.
Начиная с Windows Server 2019, журнал событий получил поддержку более гибких методов фильтрации и экспорта. Например, администратор может экспортировать только события, связанные с определённым периодом или источником, и использовать их для углублённого анализа. Вместе с этим поддержка формата XML позволяет интегрировать данные из Windows Server с различными BI-инструментами для визуализации.
Услуга аренды VPS/VDS с опцией «Всё включено» у хостера AdminVPS избавит вас от необходимости администрирования — её на себя возьмут наши специалисты.
Инструкция по работе с журналом событий Windows Server
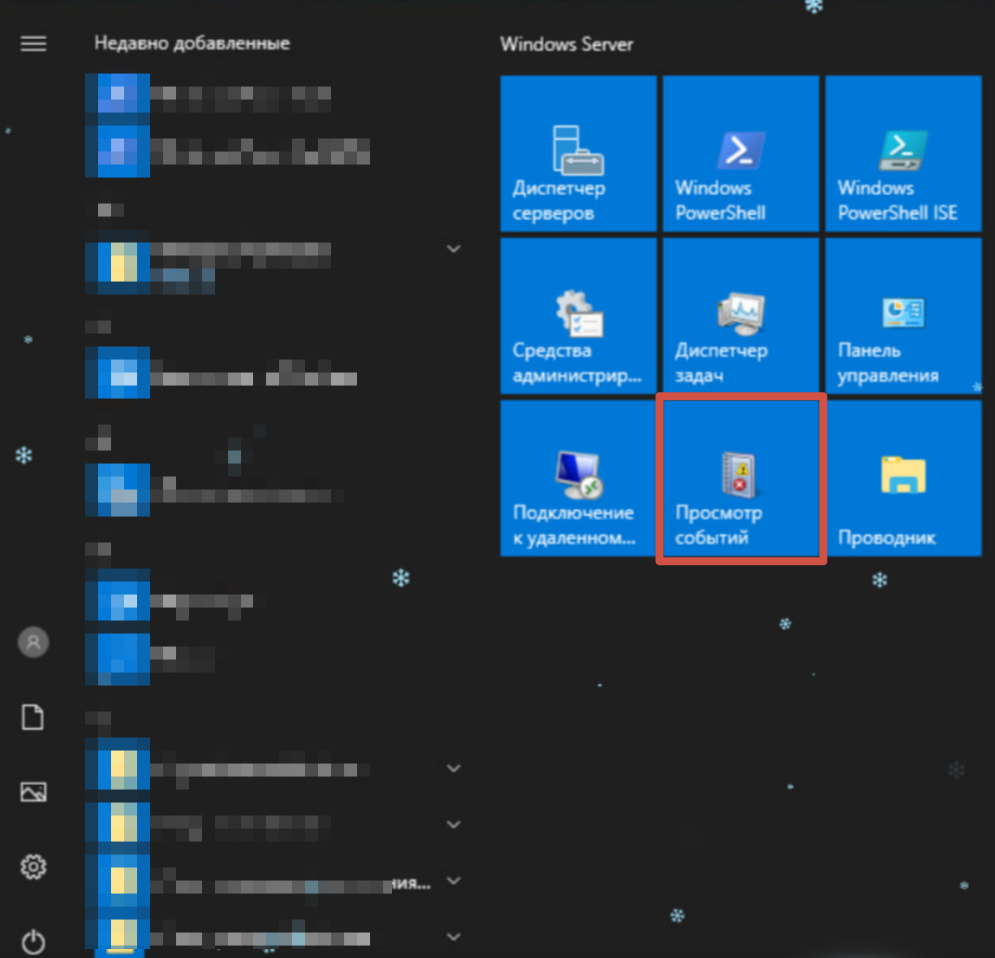
Для просмотра журнала событий в Windows Server используется встроенное приложение «Просмотр событий». Оно доступно во всех версиях сервера, включая Windows Server 2019.
Шаг 1. Откройте меню «Пуск» на сервере и найдите приложение «Просмотр событий». Вы также можете запустить его с помощью команды eventvwr через окно «Выполнить» (сочетание клавиш Win+R).
В окне «Просмотр событий» вы увидите иерархическое меню, где логи сервера Windows разделены на основные категории: «Приложение», «Безопасность», «Установка», «Система» и «Перенаправленные события».
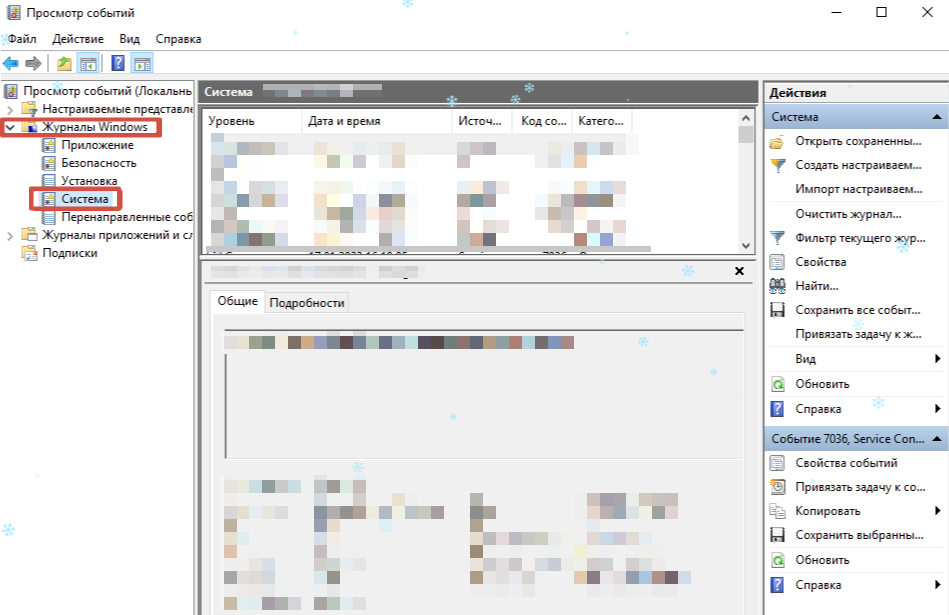
Шаг 2. Для анализа выберите интересующий вас раздел и откройте его. Здесь вы найдёте список событий с такими параметрами, как дата и время, уровень серьёзности (ошибка, предупреждение или информация), источник и идентификатор события.
Если вы работаете с сервером Windows Server 2019, вы можете воспользоваться дополнительными функциями фильтрации, чтобы быстрее найти интересующую информацию. Например, для поиска конкретной ошибки можно использовать параметры «Источник» или «Идентификатор события». Это значительно упрощает работу с большими объёмами данных.
Логи сервера Windows и их использование
Логи сервера Windows — это не просто набор текстовых записей, а ценный источник информации для мониторинга и анализа. Они отражают запуск и остановку служб, проблемы с оборудованием, сетевые подключения и другие события, которые помогают выявлять неполадки и предотвращать сбои.
Например, если вы хотите проверить, почему сервер Windows работает нестабильно, достаточно посмотреть события Windows Server за определённый промежуток времени. Ошибки или предупреждения, записанные в логи, могут указать на проблемы с драйверами, недоступность файлов или некорректные настройки безопасности.
Для продвинутых пользователей доступен экспорт логов в формат .evtx или .txt для последующего анализа. Это позволяет загружать файлы в специализированные программы, такие как syslog-серверы, которые помогают автоматизировать сбор и обработку данных.
Автоматизация сбора данных с помощью syslog
Если вы администрируете крупную сеть серверов или несколько экземпляров Windows Server, использование syslog поможет значительно упростить управление логами. Хотя Windows Server по умолчанию не использует протокол syslog, сторонние утилиты, такие как NxLog, позволяют настроить интеграцию.
Протокол syslog необходим для централизованного сбора данных с разных серверов и устройств, что особенно полезно в распределённых системах. Вы можете настроить отправку событий из журнала Windows Server на syslog-сервер, где данные будут обработаны и визуализированы. Это ускоряет диагностику и позволяет оперативно реагировать на проблемы.
Типичные ошибки и как их исправить
Работа с журналом событий Windows Server — это не анализ состояния системы, но и процесс, который может сопровождаться своими проблемами. Знание типичных ошибок и способов их исправления помогает администраторам поддерживать бесперебойную работу серверной инфраструктуры и минимизировать время простоя. Рассмотрим наиболее распространённые проблемы, которые возникают при использовании журнала событий.
Одной из наиболее частых проблем является переполнение журнала событий. В крупных системах с активным сетевым взаимодействием количество событий может быстро нарастать, что приводит к исчерпанию доступного пространства для хранения логов. Когда это происходит, система перестаёт записывать новые события, что создаёт риск упустить важную информацию, например, о сбое службы или попытке взлома. Чтобы избежать этого, администратор должен заранее настроить автоматическое удаление старых записей. В Windows Server это можно сделать через настройки журнала событий, выбрав опцию «Перезаписывать события». Альтернативным решением является увеличение максимального размера файла журнала, что позволит хранить больше записей перед началом перезаписи.
Ещё одной распространённой проблемой является отсутствие прав доступа к просмотру определённых логов. Это может произойти, если пользователь, пытающийся открыть журнал событий, не имеет соответствующих прав. Например, системный администратор может столкнуться с ситуацией, когда учётная запись не имеет доступа к журналу безопасности, где хранятся данные о попытках входа или изменении прав пользователей. Для исправления этой ситуации необходимо убедиться, что учётная запись пользователя включена в группу администраторов сервера. Если же доступ требуется предоставить отдельному пользователю, можно настроить делегирование прав через групповые политики (Group Policy), разрешив доступ к нужным разделам журнала.
Кроме этих типичных случаев встречаются ошибки, связанные с повреждением файлов журнала событий. Это может произойти из-за сбоев в работе дисковой подсистемы или некорректного завершения работы сервера. При повреждении файлов логов система может перестать записывать новые события или выдавать ошибки при попытке открыть журнал. Для восстановления работы в таком случае рекомендуется очистить повреждённый журнал через консоль «Просмотр событий» или команду PowerShell Clear-EventLog. Однако перед этим важно создать резервную копию файла журнала, если это возможно, так как он может содержать ценные данные для анализа.
Также следует учитывать возможность пропуска важных событий из-за неправильной настройки фильтров. Например, администратор может случайно исключить из отображения определённые источники событий или уровни серьёзности. Это приводит к тому, что важные предупреждения остаются незамеченными. Чтобы исправить ситуацию, необходимо пересмотреть настройки фильтрации в «Просмотре событий» или использовать PowerShell для экспорта всех записей в отдельный файл и их последующего анализа.
Ещё одна ошибка — это проблемы с интеграцией журнала событий Windows Server с внешними системами мониторинга, такими как syslog. Если события из Windows Server не поступают на syslog-сервер, причиной может быть неправильная конфигурация отправки данных или проблемы с сетевым подключением. В таком случае важно проверить настройки программы-коннектора, например, NxLog или SolarWinds, и убедиться, что порты, используемые для передачи данных, открыты на брандмауэре.
Заключение
Журнал событий Windows Server — это незаменимый инструмент для диагностики и мониторинга, который позволяет поддерживать стабильную работу сервера.
Встроенное приложение «Просмотр событий» обеспечивает удобный доступ к логам сервера Windows, включая системные ошибки, предупреждения и информационные сообщения. Для более сложных систем стоит рассмотреть использование syslog, который позволяет автоматизировать сбор данных и управлять логами в масштабах всей сети.
Читайте в блоге:
- Автоматическая загрузка Windows Server: способы настройки
- Установка Windows Server: комплексный подход к сетевой инфраструктуре и защите данных
- Настройка DFS на Windows Server
- Устанавливаем бесплатный сертификат Let’s Encrypt на IIS с Windows Server 2016/2012 R2
- Популярные способы защиты VPS/VDS на Windows Server
IT Explained:
What is Syslog?
Syslog stands for System Logging Protocol and is a standard protocol used to send system log or event messages to a specific server, called a syslog server. It is primarily used to collect various device logs from several different machines in a central location for monitoring and review.
The protocol is enabled on most network equipment such as routers, switches, firewalls, and even some printers and scanners. In addition, syslog is available on Unix and Linux based systems and many web servers including Apache. Syslog is not installed by default on Windows systems, which use their own Windows Event Log. These events can be forwarded via third-party utilities or other configurations using the syslog protocol.
Syslog is defined in RFC 5424, The Syslog Protocol, which obsoleted the previous RFC 3164.
Syslog components
On any given device various events are generated by the system in response to changing conditions. These events are typically logged locally where they can be reviewed and analyzed by an administrator. However, monitoring numerous logs over an equally numerous number of routers, switches, and systems would be time consuming and impractical. Syslog helps solve this issue by forwarding those events to a centralized server.
Syslog transmission
Traditionally, Syslog uses the UDP protocol on port 514 but can be configured to use any port. In addition, some devices will use TCP 1468 to send syslog data to get confirmed message delivery.
Syslog packet transmission is asynchronous. What causes a syslog message to be generated is configured within the router, switch, or server itself. Unlike other monitoring protocols, such as SNMP, there is no mechanism to poll the syslog data. In some implementations, SNMP may be used to set or modify syslog parameters remotely.
The syslog message format
The syslog message consists of three parts: PRI (a calculated priority value), HEADER (with identifying information), and MSG (the message itself).
The PRI data sent via the syslog protocol comes from two numeric values that help categorize the message. The first is the Facility value. This value is one of 15 predefined values or various locally defined values in the case of 16 to 23. These values categorize the type of message or which system generated the event.
| Number | Facility description |
| 0 | Kernel messages |
| 1 | User-level messages |
| 2 | Mail System |
| 3 | System Daemons |
| 4 | Security/Authorization Messages |
| 5 | Messages generated by syslogd |
| 6 | Line Printer Subsystem |
| 7 | Network News Subsystem |
| 8 | UUCP Subsystem |
| 9 | Clock Daemon |
| 10 | Security/Authorization Messages |
| 11 | FTP Daemon |
| 12 | NTP Subsystem |
| 13 | Log Audit |
| 14 | Log Alert |
| 15 | Clock Daemon |
| 16 — 23 | Local Use 0 — 7 |
The second label of a syslog message categorizes the importance or severity of the message in a numerical code from 0 to 7.
| Code | Severity | Description |
| 0 | Emergency | System is unusable |
| 1 | Alert | Action must be taken immediately |
| 2 | Critical | Critical conditions |
| 3 | Error | Error conditions |
| 4 | Warning | Warning conditions |
| 5 | Notice | Normal but significant condition |
| 6 | Informational | Informational messages |
| 7 | Debug | Debug-level messages |
The values of both labels do not have hard definitions. Thus, it is up to the system or application to determine how to log an event (for example, as a warning, notice, or something else) and on which facility. Within the same application or service, lower numbers should correspond to more severe issues relative to the specific process.
The two values are combined to produce a Priority Value sent with the message. The Priority Value is calculated by multiplying the Facility value by eight and then adding the Severity Value to the result. The lower the PRI, the higher the priority.
(Facility Value * 8) + Severity Value = PRI
In this way, a kernel message receives lower value (higher priority) than a log alert, regardless of the severity of the log alert. Additional identifiers in the packet include the hostname, IP address, process ID, app name, and timestamp of the message.
The actual verbiage or content of the syslog message is not defined by the protocol. Some messages are simple, readable text, others may only be machine readable.
Syslog messages are typically no longer than 1024 bytes.
Example of a syslog message
<165>1 2017-05-11T21:14:15.003Z mymachine.example.com appname[su] - ID47 [exampleSDID@32473 iut="3" eventSource=" eventID="1011"] BOMAn application log entry...
Parts of the syslog message:
| Part | Value | Information |
| PRI | 165 | Facility = 20, Severity = 5 |
| VERSION | 1 | Version 1 |
| TIMESTAMP | 2017-05-11T21:14:15.003Z | Message created on 11 May 2017 at 09:14:15 pm, 3 milliseconds into the next second |
| HOSTNAME | mymachine.example.com | Message originated from host «mymachine.example.com» |
| APP-NAME | su | App-Name: «su» |
| PROCID | — | PROCID unknown |
| MSGID | ID47 | Message-ID: 47 |
| STRUCTURED-DATA | [exampleSDID@32473 iut=»3″ eventSource=» eventID=»1011″] | Structured Data Element with a non-IANA controlled SD-ID of type «exampleSDID@32473», which has three parameters |
| MSG | BOMAn application log entry… | BOM indicates UTF-8 encoding, the message itself is «An application log entry…» |
The Syslog Server
The Syslog Server is also known as the syslog collector or receiver.
Syslog messages are sent from the generating device to the collector. The IP address of the destination syslog server must be configured on the device itself, either by command-line or via a conf file. Once configured, all syslog data will be sent to that server. There is no mechanism within the syslog protocol for a different server to request syslog data.
While most Unix implementations and network vendors, like Cisco, have their own barebones syslog collectors, there are several others available as well.
Paessler’s PRTG monitoring software offers a built-in Syslog Receiver Sensor. The receiver collects all Syslog messages delivered. To use the function, the administrator needs to add the Syslog Receiver and then configure the IP address of that server as the destination server for syslog data on all devices to be monitored.
Once gathered, the dashboard shows:
- The number of received syslog messages per second.
- The number of messages categorized as “warning” per second.
- The number of messages categorized as “error” per second.
- The number of dropped packets per second.
The syslog protocol can generate a lot of messages. Syslog simply forwards messages as quickly as it generates them. As a result, the most important ability for a syslog server is the ability to properly filter and react to incoming syslog data.
The PRTG Syslog Receiver Sensor offers the ability to set filtering rules. These rules allow syslog messages to be included or excluded as warnings or errors, regardless of how they were originally generated on the device. This filtering ensures that administrators get notified about all the errors they want to know about without being overwhelmed by less important errors.
Security
The syslog protocol offers no security mechanism. There is no authentication built-in to ensure that messages are coming from the device claiming to be sending them. There is no encryption to conceal what information is being sent to the server. It is particularly susceptible to so-called “playback attacks” where an attacker generates a previous stream of warnings to illicit a response.
Syslog design
Device configuration
Most syslog implementations are configurable with respect to which facilities and which severity numbers will generate syslog events that are forwarded to the syslog server. It is important to configure this properly to avoid flooding the server (and the network) with unnecessary traffic. For example, Debug should never be set to send messages except during testing.
It is advisable to set the syslog parameters to require the highest possible (lowest numbered) facility and severity to minimize traffic. While a router error might indicate that an interface is down and thus definitely needs to be reported, a less important network printer might be configured to only generate syslog traffic for critical events.
Windows
Windows systems do not implement syslog within the standard Event Log system. The events generated within the Windows logging system can be gathered and forwarded to a syslog server using third-party utilities. These utilities monitor the Event Log, use the information to create a syslog formatted event, and forward the events using the standard syslog protocol.
Limitations
One major limitation of the syslog protocol is that the device being monitoring must be up and running and connected to the network to generate and send a syslog event. A critical error from the kernel facility may never send an error at all as the system goes offline. In other words, syslog is not a good way to monitor the up and down status of devices.
Syslog usage
While syslog is not a good way to monitor the status of networked devices, it can be a good way to monitor the overall health of network equipment. While network monitoring software like PRTG offers a suite of utilities to watch over a network, nothing tells an administrator that there is a problem faster than an event log filling up with warnings. Properly configured syslog monitoring will detect the sudden increase in event volume and severity, possibly providing notice before a user-detectable problem occurs.
Security/authorization/auditing
The average corporate network contains numerous devices that no one should be trying to gain access to on an average day. If a remote switch that only gets logged into once per audit cycle suddenly has daily login attempts (successful or otherwise), it bears checking out. On these types of devices, syslog can be set to forward authentication events to a syslog server, without the overhead of having to install and configure a full monitoring agent.
Syslog also provides a way to ensure that critical events are logged and stored off the original server. An attacker’s first effort after compromising a system is to cover the tracks left in the log. Events forwarded via syslog will be out of reach.
Application monitoring
There are plenty of ways to monitor how an application is running on a server. However, those monitors can overlook how the application is affecting other processes on the server. While high CPU or memory utilization is easy enough to detect with other monitors, logged events can help show more possible issues. Is an application continuously trying to access a file that is locked? Is there an attempted database write generating an error? Events like these may go undetected when caused by applications that do a good job of working around errors, but they shouldn’t be ignored. Syslog will make sure those logged events get the attention they deserve.
Syslog as part of overall network monitoring
Complete network monitoring requires using multiple tools. Syslog is an important pillar in network monitoring because it ensures that events occurring without a dramatic effect do not fall through the cracks. Best practice is to use a software that combines all the tools to always have an overview of what is happening in the network.

References
From Wikipedia, the free encyclopedia
| Original author(s) | Eric Allman |
|---|---|
| Initial release | 1980s |
| Operating system | Unix-like |
| Type | System logging |
| Website | datatracker |
In computing, syslog () is a standard for message logging. It allows separation of the software that generates messages, the system that stores them, and the software that reports and analyzes them. Each message is labeled with a facility code, indicating the type of system generating the message, and is assigned a severity level.
Computer system designers may use syslog for system management and security auditing as well as general informational, analysis, and debugging messages. A wide variety of devices, such as printers, routers, and message receivers across many platforms use the syslog standard. This permits the consolidation of logging data from different types of systems in a central repository. Implementations of syslog exist for many operating systems.
When operating over a network, syslog uses a client-server architecture where a syslog server listens for and logs messages coming from clients.
Syslog was developed in the 1980s by Eric Allman as part of the Sendmail project.[1] It was readily adopted by other applications and has since become the standard logging solution on Unix-like systems.[2] A variety of implementations also exist on other operating systems and it is commonly found in network devices, such as routers.[3]
Syslog originally functioned as a de facto standard, without any authoritative published specification, and many implementations existed, some of which were incompatible. The Internet Engineering Task Force documented the status quo in RFC 3164 in August 2001. It was standardized by RFC 5424 in March 2009.[4]
Various companies have attempted to claim patents for specific aspects of syslog implementations.[5][6] This has had little effect on the use and standardization of the protocol.[citation needed]
The information provided by the originator of a syslog message includes the facility code and the severity level. The syslog software adds information to the information header before passing the entry to the syslog receiver. Such components include an originator process ID, a timestamp, and the hostname or IP address of the device.
A facility code is used to specify the type of system that is logging the message. Messages with different facilities may be handled differently.[7] The list of facilities available is described by the standard:[4]: 9
| Facility code | Keyword | Description |
|---|---|---|
| 0 | kern | Kernel messages |
| 1 | user | User-level messages |
| 2 | Mail system | |
| 3 | daemon | System daemons |
| 4 | auth | Security/authentication messages |
| 5 | syslog | Messages generated internally by syslogd |
| 6 | lpr | Line printer subsystem |
| 7 | news | Network news subsystem |
| 8 | uucp | UUCP subsystem |
| 9 | cron | Cron subsystem |
| 10 | authpriv | Security and authentication messages |
| 11 | ftp | FTP daemon |
| 12 | ntp | NTP subsystem |
| 13 | security | Log audit |
| 14 | console | Log alert |
| 15 | solaris-cron | Scheduling daemon |
| 16–23 | local0 – local7 | Locally used facilities |
The mapping between facility code and keyword is not uniform in different operating systems and syslog implementations.[8]
The list of severities of issues is also described by the standard:[4]: 10
| Value | Severity | Keyword | Deprecated keywords | Description | Condition |
|---|---|---|---|---|---|
| 0 | Emergency | emerg |
panic[9] |
System is unusable | A panic condition.[10] |
| 1 | Alert | alert |
Action must be taken immediately | A condition that should be corrected immediately, such as a corrupted system database.[10] | |
| 2 | Critical | crit |
Critical conditions | Hard device errors.[10] | |
| 3 | Error | err |
error[9] |
Error conditions | |
| 4 | Warning | warning |
warn[9] |
Warning conditions | |
| 5 | Notice | notice |
Normal but significant conditions | Conditions that are not error conditions, but that may require special handling.[10][11] | |
| 6 | Informational | info |
Informational messages | Confirmation that the program is working as expected. | |
| 7 | Debug | debug |
Debug-level messages | Messages that contain information normally of use only when debugging a program.[10] |
The meaning of severity levels other than Emergency and Debug are relative to the application. For example, if the purpose of the system is to process transactions to update customer account balance information, an error in the final step should be assigned Alert level. However, an error occurring in an attempt to display the ZIP code of the customer may be assigned Error or even Warning level.
The server process that handles display of messages usually includes all lower (more severe) levels when the display of less severe levels is requested. That is, if messages are separated by individual severity, a Warning level entry will also be included when filtering for Notice, Info and Debug messages.[12]
In RFC 3164, the message component (known as MSG) was specified as having these fields: TAG, which should be the name of the program or process that generated the message, and CONTENT which contains the details of the message.
Described in RFC 5424,[4] «MSG is what was called CONTENT in RFC 3164. The TAG is now part of the header, but not as a single field. The TAG has been split into APP-NAME, PROCID, and MSGID. This does not totally resemble the usage of TAG, but provides the same functionality for most of the cases.» Popular syslog tools such as NXLog, Rsyslog conform to this new standard.
The content field should be encoded in a UTF-8 character set and octet values in the traditional ASCII control character range should be avoided.[13][4]
Generated log messages may be directed to various destinations including console, files, remote syslog servers, or relays. Most implementations provide a command line utility, often called logger, as well as a software library, to send messages to the log.[14]
To display and monitor the collected logs one needs to use a client application or access the log file directly on the system. The basic command line tools are tail and grep. The log servers can be configured to send the logs over the network (in addition to the local files). Some implementations include reporting programs for filtering and displaying of syslog messages.
When operating over a network, syslog uses a client-server architecture where the server listens on a well-known or registered port for protocol requests from clients. Historically the most common transport layer protocol for network logging has been User Datagram Protocol (UDP), with the server listening on port 514.[15] Because UDP lacks congestion control mechanisms, Transmission Control Protocol (TCP) port 6514 is used; Transport Layer Security is also required in implementations and recommended for general use.[16][17]
Since each process, application, and operating system was written independently, there is little uniformity to the payload of the log message. For this reason, no assumption is made about its formatting or contents. A syslog message is formatted (RFC 5424 gives the Augmented Backus–Naur form (ABNF) definition), but its MSG field is not.
The network protocol is simplex communication, with no means of acknowledging the delivery to the originator.
Various groups are working on draft standards detailing the use of syslog for more than just network and security event logging, such as its proposed application within the healthcare environment.[18]
Regulations, such as the Sarbanes–Oxley Act, PCI DSS, HIPAA, and many others, require organizations to implement comprehensive security measures, which often include collecting and analyzing logs from many different sources. The syslog format has proven effective in consolidating logs, as there are many open-source and proprietary tools for reporting and analysis of these logs. Utilities exist for conversion from Windows Event Log and other log formats to syslog.
Managed Security Service Providers attempt to apply analytical techniques and artificial intelligence algorithms to detect patterns and alert customers to problems.[19]
Internet standard documents
[edit]
The Syslog protocol is defined by Request for Comments (RFC) documents published by the Internet Engineering Task Force (Internet standards). The following is a list of RFCs that define the syslog protocol:[20]
- The BSD syslog Protocol. RFC 3164. (obsoleted by The Syslog Protocol. RFC 5424.)
- Reliable Delivery for syslog. RFC 3195.
- The Syslog Protocol. RFC 5424.
- TLS Transport Mapping for Syslog. RFC 5425.
- Transmission of Syslog Messages over UDP. RFC 5426.
- Textual Conventions for Syslog Management. RFC 5427.
- Signed Syslog Messages. RFC 5848.
- Datagram Transport Layer Security (DTLS) Transport Mapping for Syslog. RFC 6012.
- Transmission of Syslog Messages over TCP. RFC 6587.
- Audit trail
- Common Log Format
- Console server
- Data logging
- Log management and intelligence
- Logparser
- Netconf
- NXLog
- Rsyslog
- Security Event Manager
- Server log
- Simple Network Management Protocol (SNMP)
- syslog-ng
- Web counter
- Web log analysis software
- ^ «Eric Allman». Internet Hall of Fame. Retrieved 2017-10-30.
- ^ «3 great engineering roles to apply for this week». VentureBeat. 2021-08-06. Retrieved 2021-08-16.
- ^ Zhang, Shenglin; Liu, Ying; Meng, Weibin; Bu, Jiahao; Yang, Sen; Sun, Yongqian; Pei, Dan; Xu, Jun; Zhang, Yuzhi; Song, Lei; Zhang, Ming (2020). «Efficient and Robust Syslog Parsing for Network Devices in Datacenter Networks». IEEE Access. 8: 30245–30261. doi:10.1109/ACCESS.2020.2972691.
- ^ a b c d e Gerhards, Rainer. The Syslog Protocol. doi:10.17487/RFC5424. RFC 5424.
- ^ «LXer: Patent jeopardizes IETF syslog standard».
- ^ «IETF IPR disclosure on HUAWEI’s patent claims».
- ^ «Syslog Facility». Retrieved 22 November 2012.
- ^ «The Ins and Outs of System Logging Using Syslog». SANS Institute.
- ^ a b c «syslog.conf(5) — Linux man page». Retrieved 2017-03-29.
The keywords error, warn and panic are deprecated and should not be used anymore.
- ^ a b c d e «closelog, openlog, setlogmask, syslog — control system log». Retrieved 2017-03-29.
LOG_NOTICE Conditions that are not error conditions, but that may require special handling.
- ^ «The GNU C Library: syslog, vsyslog». Retrieved 2024-07-19.
LOG_NOTICE The message describes a normal but important event.
- ^ «Severity Levels for Syslog Messages». cd.delphix.com. Retrieved 2024-10-02.
- ^ «Transmission of Syslog Messages over TCP». www.ipa.go.jp. Retrieved 2021-08-16.
- ^ «logger Command». www.ibm.com. Retrieved 2021-08-16.
- ^ «Syslog Server». www.howtonetwork.com. Retrieved 2021-08-16.
- ^ Gerhards, Rainer (March 2009). «RFC 5424 — The Syslog Protocol». tools.ietf.org. doi:10.17487/RFC5424.
- ^ Fuyou, Miao; Yuzhi, Ma; Salowey, Joseph A. (March 2009). Miao, F; Ma, Y; Salowey, J (eds.). «RFC 5425 — TLS Transport Mapping for Syslog». tools.ietf.org. doi:10.17487/RFC5425.
- ^ «ATNA + SYSLOG is good enough». Healthcare Exchange Standards. 2 January 2012. Retrieved 2018-06-06.
- ^ Yamanishi, Kenji; Maruyama, Yuko (2005-08-21). «Dynamic syslog mining for network failure monitoring». Proceedings of the eleventh ACM SIGKDD international conference on Knowledge discovery in data mining. KDD ’05. Chicago, Illinois, USA: Association for Computing Machinery. pp. 499–508. doi:10.1145/1081870.1081927. ISBN 978-1-59593-135-1. S2CID 5051532.
- ^ «Security Issues in Network Event Logging (syslog)». IETF.
- Internet Engineering Task Force: Datatracker: syslog Working Group (concluded)
- National Institute of Standards and Technology: «Guide to Computer Security Log Management» (Special Publication 800-92) (white paper)
- Network Management Software: «Understanding Syslog: Servers, Messages & Security»
- Paessler IT Explained — Syslog
- MonitorWare: All about Syslog