
Zabbix Monitor Windows using SNMP
Zabbix Monitor Windows using SNMP
Would you like to learn how to monitor a Windows computer using SNMP? In this tutorial, we are going to show you how to install SNMP on Windows and how to configure the Zabbix server to monitor a Windows computer without the need to install the Zabbix agent.
• Zabbix version: 3.4.12
• Windows version: 2012 R2
Hardware List:
The following section presents the list of equipment used to create this Zabbix tutorial.
Every piece of hardware listed above can be found at Amazon website.
Zabbix Playlist:
On this page, we offer quick access to a list of videos related to Zabbix installation.
Don’t forget to subscribe to our youtube channel named FKIT.
Zabbix Related Tutorial:
On this page, we offer quick access to a list of tutorials related to Zabbix installation.
Tutorial — SNMP Installation on Windows
First, we need to install and configure the SNMP service on Windows.
Open the Server Manager application.
Access the Manage menu and click on Add roles and features.

Access the features screen, select the SNMP service option and finish the installation.

On the following screen, click on the Add features button.

The SNMP feature was installed on your computer but we still need to configure the SNMP service.
Open the Windows service management screen and access the SNMP service properties.

Access the Agent tab, select all the options and enter the device contact information.

Access the Security tab and select the Accept SNMP packets from any host option.

You need to create a Read-only SNMP community.
Here is a summary of our configuration example:
The GokuBlack Community has read-only permission on the Windows server.
The contact person responsible for this Windows computer was configured as Zamasu.
The location of the equipment was configured as the IT Room of Universe 10.
You have successfully installed the Windows SNMP service.
You have successfully configured the Windows SNMP service.
To test your SNMP configuration, use the following commands on a computer running Ubuntu Linux.
# apt-get install snmp
# snmpwalk -v2c -c GokuBlack 192.168.0.50
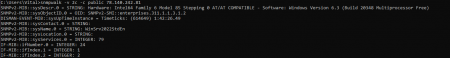
Here is a small sample of the SNMPWALK output.
iso.3.6.1.2.1.1.1.0 = STRING: «Hardware: Intel64 — Software: Windows Version 6.3
iso.3.6.1.2.1.1.2.0 = OID: iso.3.6.1.4.1.311.1.1.3.1.3
iso.3.6.1.2.1.1.3.0 = Timeticks: (614928) 1:42:29.28
iso.3.6.1.2.1.1.4.0 = STRING: «Zamasu <zamasu@dbsuper.com>»
iso.3.6.1.2.1.1.5.0 = STRING: «TECH-DC01.TECH.LOCAL»
iso.3.6.1.2.1.1.6.0 = STRING: «Universe10 — IT Room»
Congratulations! you have installed the SNMP service on a computer running Windows.
Keep in mind that your Windows firewall application needs to accept connections from the Zabbix server.
The Windows firewall should accept network packets on UDP port: 161
You can now use the Zabbix server dashboard to add this computer to the network monitoring service.
Tutorial — Zabbix Monitor Windows using SNMP
Now, we need to access the Zabbix server dashboard and add the Windows computer as a Host.
Open your browser and enter the IP address of your web server plus /zabbix.
In our example, the following URL was entered in the Browser:
• http://35.162.85.57/zabbix
On the login screen, use the default username and default password.
• Default Username: Admin
• Default Password: zabbix
After a successful login, you will be sent to the Zabbix Dashboard.

On the dashboard screen, access the Configuration menu and select the Host option.

On the top right of the screen, click on the Create host button.
On the Host configuration screen, you will have to enter the following information:
• Host Name — Enter a Hostname to identify the Windows server.
• Visible Hostname — Repeat the hostname.
• New group — Enter a name to identify a group of similar devices.
• Agent Interface — Click on the Remove option.
• SNMP Interface — Enter the IP address of the Windows server.
Here is the original image, before our configuration.

Here is the new image with our configuration.

Next, we need to configure the SNMP community that Zabbix will use to connect on the Windows computer.
Access the Macros tab on the top of the screen.
Create a macro named: {$SNMP_COMMUNITY}
The {$SNMP_COMMUNITY} macro value should be the Windows Computer SNMP community.

Next, we need to associate the host with a specific network monitor template.
By default, Zabbix comes with a large variety of monitoring templates.
Access the Templates tab on the top of the screen.
Click on the Select button and locate the template named: TEMPLATE OS Windows SNMPv2.

Click on the Add button (1).
Click on the Add button (2).
After a few minutes, you will be able to see the initial result on the Zabbix Dashboard.
The final result will take at least one hour.
By default, Zabbix will wait 1 hour to discover the number of interfaces available on the Windows computer.
By default, Zabbix will wait 1 hour before collect information from the network interfaces.
In order to test your configuration, access the Monitoring menu and click on the Graphs option.

On the top right of the screen, select the group named ALL.
Select your Windows computer host name.
Select the graph named: MEMORY UTILIZATION
You should be able to see the graphic of Memory utilization.

Congratulations! You have configured the Zabbix server to monitor a Windows computer.
VirtualCoin CISSP, PMP, CCNP, MCSE, LPIC22019-06-11T10:40:07-03:00
Related Posts
Page load link
Ok
Let’s look into other interfaces. Sometimes you will need to monitor something that doesn’t work with an agent: printer, router, etc. SNMP can help you with that.
First, you will need is to find the variable’s OID (Object Identifier) the numeric code that will help the server to request the specific things we will monitor.
To do so you can look it up in the device’s manual or discover it with snmpwalk utility or use any MIB browser you like. For this article we will look into using snmpwalk.
snmpwalk
Let’s look into getting OIDs with snmpwalk.
Install the SNMP package: you’ll need to install the SNMP package. On Debian-based systems, you can install it with:
sudo apt-get install snmp
On Red Hat-based systems, you can use:
sudo yum install net-snmp
On Windows system, you can use the Net-SNMP package for Windows, which is available at Net-SNMP website (https://www.net-snmp.org/download.html).
Check the IP address or hostname of the device you want to query, as well as the SNMP version this device supports (usually SNMPv1 or SNMPv2c).
You’ll also need to find out the SNMP community for the device. This works like a password that allows to access the SNMP data on this host. You should be able to find this in the device’s documentation or configuration, the usual default option is ‘public’.
If you learned the OID you need from manual, run the snmpwalk command to check if everything’s fine. The basic syntax for snmpwalk is the same on Windows as on Linux or Unix:
snmpwalk -v [SNMP version] -c [community string] [device IP/hostname] [OID or MIB name]
for example
snmpwalk -v2c -c public 192.168.1.1 .1.3.6.1.2.1.1.5.0
Here, the OID .1.3.6.1.2.1.1.5.0 specifies the hostname, and the snmpwalk command will return the MIB name along with the current value and the variable type.
To discover an OID with snmpwalk you could run it without an OID or MIB name to search the one you interested in manually.
After finding out its name run the same command adding — On
Note that some variables have more than one port the last number in OID shows this port.
Hosts
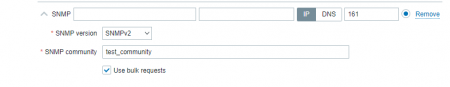
Next, we will need to add a host with an SNMP interface configured and enter your device’s IP, SNMP version, and SNMP community. SNMP templates can be handy, but compatibility is not granted. Otherwise it’s a usual host creation.
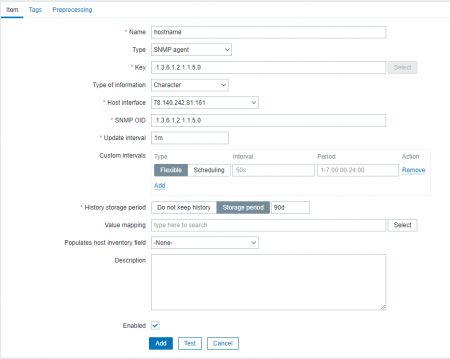
Items
The only thing left is to create an SNMP item: Go to Configuration > Hosts and click on the device you want to monitor. Go to the Items tab and click on the «Create item» button. Fill in the necessary information: item name, type (for our example, SNMPv2 agent), information type, and OID. Fill the Key line with OID number.
Press test to see if it works.
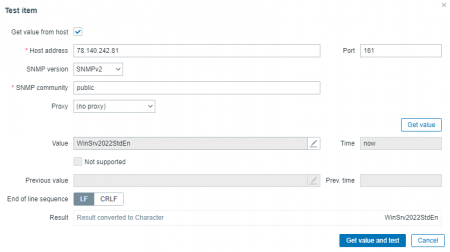
Once everything is set up, you should start seeing data from the device in Zabbix. You can use Zabbix’s graphs, triggers, and other features to monitor the device and be alerted if there are any issues.
Conclusion
We learned how to get the OIDs we need, and how to create SNMP hosts and items to monitor them with Zabbix.
1101
CT Amsterdam
The Netherlands, Herikerbergweg 292
+31 20 262-58-98
700
300
ITGLOBAL.COM NL
1101
CT Amsterdam
The Netherlands, Herikerbergweg 292
+31 20 262-58-98
700
300
ITGLOBAL.COM NL
Как установить стандартную службу SNMP в Windows и настроить мы разобрали тут Установка и настройка службы SNMP в Windows
Стандартный Шаблон ОС Windows SNMPv2
Теперь перейдем к пункту как получать с нее данные.
Неполный список MIB, которые поставляются с системой.
Они устанавливаются вместе со службой SNMP в каталоге %systemroot%\system32
Полный список баз MIB см. в наборе ресурсов Windows.
В моем случае были следующие MIB: Для Windows 10 x64 и один в один Server 2008 R2
accserv.mib 14кб
authserv.mib 15кб
dhcp.mib 4кб
ftp.mib 6кб
hostmib.mib 48кб
http.mib 21кб
inetsrv.mib 1кб
ipforwd.mib 15кб
lmmib2.mib 26кб
mcastmib.mib 30кб
mib_ii.mib 107кб
msft.mib 1кб
msipbtp.mib 13кб
msiprip2.mib 34кб
rfc2571.mib 22кб
smi.mib 4кб
wins.mib 26кб
Скачать
Зависимости
FROM SNMPv2-SMI
FROM SNMPv2-TC
FROM SNMPv2-CONF
FROM RFC-1212
FROM SNMP-FRAMEWORK-MIB +
FROM RFC1155-SMI +
FROM RFC1213-MIB +
FROM MSFT-MIB +
FROM INTERNETSERVER-MIB +
FROM WINS-MIB +
Переименовал для удобства если выходит какая ошибка.
Стало — было
RADIUS-ACC-SERVER-MIB.mib — accserv.mib 14кб
RADIUS-AUTH-SERVER-MIB.mib — authserv.mib 15кб
DHCP-MIB.mib — dhcp.mib 4кб
FTPSERVER-MIB.mib — ftp.mib 6кб
HOST-RESOURCES-MIB-WIN бы такая но внутри разные HOST-RESOURCES-MIB.mib — hostmib.mib 48кб
HTTPSERVER-MIB.mib — http.mib 21кб
INTERNETSERVER-MIB.mib — inetsrv.mib 1кб
RFC1354-MIB.mib — ipforwd.mib 15кб
LanMgr-Mib-II-MIB.mib — lmmib2.mib 26кб
IPMROUTE-MIB.mib — mcastmib.mib 30кб
RFC1213-MIB.mib — mib_ii.mib 107кб
MSFT-MIB.mib — msft.mib 1кб
MSIPBOOTP-MIB.mib — msipbtp.mib 13кб
MSIPRIP2-MIB.mib — msiprip2.mib 34кб
SNMP-FRAMEWORK-MIB.mib — rfc2571.mib 22кб
RFC1155-SMI.mib — smi.mib 4кб
WINS-MIB.mib — wins.mib 26кб
Скачать:
Описание для некоторых Mib
lmmib2.mib — это частный MIB для серверов Windows.
dhcp.mib — Определенная Microsoft MIB, содержащая типы объектов для мониторинга сетевого трафика между удаленными узлами и DHCP-серверами.
hostmib.mib — Содержит типы объектов для мониторинга и управления ресурсами хоста.
lmmib2.mib — Охватывает службы рабочих станций и серверов
mib_ii.mib — Содержит информационную базу управления (MIB-II), которая обеспечивает простую работоспособную архитектуру и систему для управления Интернетом на основе TCP/IP.
wins.mib — Определенная Microsoft MIB для службы имен Интернета Windows (WINS)
База сведений об управлении SNMP (MIB)
Дополнительная информация:
Windows NT: обычно можно скопировать MIB из агента расширения SNMP, который поддерживает конкретный MIB. Некоторые дополнительные базы MIB доступны в комплекте ресурсов Windows NT 4.0.
Библиотеки DLL агента расширения для MIB-II, LAN Manager MIB-II и MIB ресурсов хоста устанавливаются вместе со службой SNMP. Библиотеки DLL агента расширения для других MIB устанавливаются при установке соответствующих служб. Во время запуска службы служба SNMP загружает все библиотеки DLL агента расширения, перечисленные в реестре.
Пользователи могут добавлять другие библиотеки DLL агента расширения, которые реализуют дополнительные MIB. Для этого они должны добавить запись реестра для новой библиотеки DLL в службе SNMP. Они также должны зарегистрировать новую MIB в приложении консоли управления SNMP. Дополнительные сведения см. в документации, прилагаемой к вашему приложению консоли управления.
Microsoft назначено пространство имен 1.3.6.1.4.1.311, определенное в MSFT.MIB. Microsoft имеет право назначать имена объектам в любом месте ниже этого пространства имен.
Идентификатор объекта в иерархии записывается как последовательность субидентификаторов, начинающаяся с корня и заканчивающаяся на объекте. Подидентификаторы разделяются точкой.
Возьмем пример: Мониторить состояние запущенных в Windows служб через SNMP
используя MIB, кажется, что вы можете получить статус каждой службы, обратившись к LanMgr-Mib-II-MIB::svSvcOperatingState, Я боролся с доступом к OID, который включал «строку имени службы».
Сразу напишу такое
Сама функция агента SNMP является услугой, официально предоставляемой MS. (—> Когда я обратился на форум MS, мне ответили, что «работа по SNMP не рекомендуется»…)
Изначально я нашел очень много инфы на такой вид запроса
Код: Выделить всё
snmpwalk -v 2c -c public IP:Port LanMgr-Mib-II-MIB::svSvcOperatingState["index","LanMgr-Mib-II-MIB::svSvcName","Имя Службы"]Пример:
Код: Выделить всё
snmpwalk -v 2c -c public 192.168.150.3:161 LanMgr-Mib-II-MIB::svSvcOperatingState["index","LanMgr-Mib-II-MIB::svSvcName","Zabbix Agent"]Или по OID
Код: Выделить всё
snmpwalk -v 2c -c public 192.168.150.3:161 1.3.6.1.4.1.77.1.2.3.1.3[index,1.3.6.1.4.1.77.1.2.3.1.1,"Zabbix Agent"]И в ответ я должен был получить статус запрошенной службы
Рабочий статус сетевой службы:
активный(1)
ожидающий продолжения(2)
ожидающий паузы(3)
приостановленный(4)
Но приходил все к ошибке, разберем более детально:
Используем файл mib для запроса: LanMgr-Mib-II-MIB
Параметр: SvSvcOperatingState — Вы можете получить статус службы
LanMgr-Mib-II-MIB::svSvcOperatingState — объект, возвращающий рабочее состояние службы.
LanMgr-Mib-II-MIB::svSvcName — который возвращает имя службы.
По раздельности запросы выполнялись
Код: Выделить всё
snmpwalk -v 2c -c public 192.168.150.3:161 LanMgr-Mib-II-MIB::svSvcOperatingStateКод: Выделить всё
snmpwalk -v 2c -c public 192.168.150.3:161 LanMgr-Mib-II-MIB::svSvcNameполучаем ответ
LanMgr-Mib-II-MIB::svSvcName.»Zabbix Agent» = STRING: «Zabbix Agent»
LanMgr-Mib-II-MIB::svSvcName.»…………» = Hex-STRING: D0 A1 D0 B5 D1 80 D0 B2 D0 B5 D1 80
Русские символы в Hex формате.
Так же можно запросить данные по всем mib и выгрузить их в файл:
Код: Выделить всё
snmpwalk -v 2c -c public 192.168.150.3:161 >> Host3.logНаткнулся на японскую статью по запросам служб windows snmp Японский Вариант статьи
Оказалось что имя службы не воспринимается для Английского языка имя службы нужно преобразовать в Десятичную систему ASCII
И синтаксис команды запроса будет другим.
Однако кажется, что часть символьной строки необходимо преобразовать в код ASCII. ( Я использовал этот сайт Преобразователь кода ASCII)
Видео подробно о кодировках
В десятичное число переводим имя
Skype for Business Server XMPP Translating Gateway
Получаем в 10тичной
83 107 121 112 101 32 102 111 114 32 66 117 115 105 110 101 115 115 32 83 101 114 118 101 114 32 88 77 80 80 32 84 114 97 110 115 108 97 116 105 110 103 32 71 97 116 101 119 97 121
Когда строка символов преобразуется
svSvcOperatingState.○.83.107.121.112.101.32.102.111.114.32.66.117.115.105.110.101.115.115.32.83.101.114.118.101.114.32.88.77.80.80.32.84.114.97.110.115.108.97.116.105.110.103.32.71.97.116.101.119.97.121
становится
Вам нужно ввести длину этой строки символов в начале получаем 50
Итак, в итоге будет следующее.
svSvcOperatingState.50.83.107.121.112.101.32.102.111.114.32.66.117.115.105.110.101.115.115.32.83.101.114.118.101.114.32.88.77.80.80.32.84.114.97.110.115.108.97.116.105.110.103.32.71.97.116.101.119.97.121
Для имени Службы: APC PBE Agent
APC PBE Agent — 65 80 67 32 80 66 69 32 65 103 101 110 116
Когда строка символов преобразуется
65.80.67.32.80.66.69.32.65.103.101.110.116
Кол-во чисел 13
Получаем OID
13.65.80.67.32.80.66.69.32.65.103.101.110.116
Пробуем запросить
Код: Выделить всё
snmpwalk -v 2c -c public 192.168.150.3:161 LanMgr-Mib-II-MIB::svSvcOperatingState.13.65.80.67.32.80.66.69.32.65.103.101.110.116Ответ:
LanMgr-Mib-II-MIB::svSvcOperatingState.»APC PBE Agent» = INTEGER: active(1)
Запрос
Код: Выделить всё
snmpwalk -v 2c -c public 192.168.150.3:161 LanMgr-Mib-II-MIB::svSvcName."Zabbix Agent"В ответ ошибка
LanMgr-Mib-II-MIB::svSvcName.Zabbix Agent: Unknown Object Identifier (Index out of range: Zabbix Agent (svSvcName))
Если имя переведем в десятичную систему сформируем OID
Zabbix Agent — 12.90.97.98.98.105.120.32.65.103.101.110.116
Запрос
Код: Выделить всё
snmpwalk -v 2c -c public 192.168.150.3:161 LanMgr-Mib-II-MIB::svSvcName."12.90.97.98.98.105.120.32.65.103.101.110.116"Ответ
LanMgr-Mib-II-MIB::svSvcName.»Zabbix Agent» = STRING: «Zabbix Agent»
И ответ пришел.
Запрос
Код: Выделить всё
snmpwalk -v 2c -c public 192.168.150.3:161 LanMgr-Mib-II-MIB::svSvcOperatingState."12.90.97.98.98.105.120.32.65.103.101.110.116"или
Код: Выделить всё
snmpwalk -v 2c -c public 192.168.150.3:161 1.3.6.1.4.1.77.1.2.3.1.3.12.90.97.98.98.105.120.32.65.103.101.110.116Ответ
LanMgr-Mib-II-MIB::svSvcOperatingState.»Zabbix Agent» = INTEGER: active(1)
Ради эксперимента попробуем первый запрос с OID
Код: Выделить всё
snmpwalk -v 2c -c public 192.168.150.3:161 LanMgr-Mib-II-MIB::svSvcOperatingState["index","LanMgr-Mib-II-MIB::svSvcName","12.90.97.98.98.105.120.32.65.103.101.110.116"]Ответ
LanMgr-Mib-II-MIB::svSvcOperatingState[index,LanMgr-Mib-II-MIB::svSvcName,12.90.97.98.98.105.120.32.65.103.101.110.116]: Unknown Object Identifier
Запрос полностью в OID
Код: Выделить всё
snmpwalk -v 2c -c public 192.168.150.3:161 1.3.6.1.4.1.77.1.2.3.1.3["index","1.3.6.1.4.1.77.1.2.3.1.1","12.90.97.98.98.105.120.32.65.103.101.110.116"]Ответ
.1.3.6.1.4.1.77.1.2.3.1.3[index,1.3.6.1.4.1.77.1.2.3.1.1,12.90.97.98.98.105.120.32.65.103.101.110.116]: Unknown Object Identifier (Sub-id not found: svSvcEntry -> 3[index,1)
Еще попробуем так:
Код: Выделить всё
snmpwalk -v 2c -c public 192.168.150.3:161 LanMgr-Mib-II-MIB::svSvcOperatingState."Zabbix Agent"Ответ
LanMgr-Mib-II-MIB::svSvcOperatingState.Zabbix Agent: Unknown Object Identifier (Index out of range: Zabbix Agent (svSvcName)
И везде получаем ОШИБКИ
Для других языков
Однако если имя службы содержит японский язык, на него нельзя будет сослаться, даже если оно будет преобразовано в код ASCII.
Ниже описана процедура подтверждения SNMP OID японской службы.
Поскольку значение, возвращаемое Snmpwalk, представляет собой шестнадцатеричное число,
Веб-конференции Skype для бизнеса Server (Hex)
Hex-STRING: 53 6B 79 70 65 20 66 6F 72 20 42 75 73 69 6E 65 73 73 20 53 65 72 76 65 72 20 57 65 62 20 E4 BC 9A E8 AD B0
↑ Возвращаемое значение для запроса имени службы.
Исследуйте только «встречную» часть строки.
↓
Часть «Встреча» → Раскрыт код символа → UTF-8 (шестнадцатеричный)
E4 BC 9A E8 AD B0
Преобразовать в двоичный
Стандарт преобразования сайта 32 символа (1 символ полной ширины считается за 1 символ) 32.83.101.114.118.101.114.32.87.101.98.32.228.188.154.232.173.176
→ НГ
Стандарт преобразования сайта 34 символа (1 символ полной ширины считается за 2 символа) 32.83.101.114.118.101.114.32.87.101.98.32.228.188.154.232.173.176
→ НГ
Стандарт конверсии сайта 36 символов (считается по количеству элементов, а не по количеству символов) 115.115.32.83.101.114 .118.101.114.32.87.101.98.32.228.188.154.232.173.176
→ Успех
Возвращаемое значение: LanMgr-Mib-II-MIB :: svSvcOperatingState.»Skype for Business Server Web ……» = ЦЕЛОЕ ЧИСЛО : активно (1 )
Теперь вы можете получить рабочее состояние служб Windows по SNMP, но когда служба выходит из строя, она не возвращает код, например стоп, в качестве возвращаемого значения.
По-видимому, когда служба не запущена, доступ к самому OID недоступен, и сторона диспетчера SNMP выдает ошибку «Такого OID нет». (Нет такого экземпляра в настоящее время не существует с этим OID)
Кроме того, похоже, что с момента остановки (запуска) службы проходит около 2 минут, пока статус не может быть обнаружен SNMP.
Вывод:
Мониторить состояние работы службы Windows можно прямо из SNMP-менеджера, но, похоже, потребуется некоторая изобретательность.
Немного из другой оперы но так же про кодировки в snmp
Аналогично например с антеннами microtik при обнаружении элементов вместо одного значения дает целую строку в шестнадцатеричных числах. Их необходимо преобразовать и получить 1 значение.
Что то вроде предобработки на JAVA
Код: Выделить всё
//разбиваем на части по разделителю "точка"
var a = value.split('.');
//последний элемент разбиваем на части по разделителю "двоеточие"
var b = a[a.length-1].split(':');
//и в цикле каждый его компонент преобразуем из HEX в DEC
for (var i=0; i<b.length; i++) {
b[i] = parseInt(b[i], 16)
}
//после чего собираем всё обратно
a[a.length-1] = b.join('.');
return a.join('.');
«Code:
.1.3.6.1.4.1.14988.1.1.1.2.1.3.c4:ad:34:50:3a:4c
При использовании в правилах LLD на входе будет не одна строка такого вида, а сгенерированный Zabbix-ом JSON, где строка такого вида — лишь одно из полей.
Поэтому логично, что скрипт ломается.»
Если в вашей среде есть старые SNMP-устройства, и их время безотказной работы отображается как дата и время в шестнадцатеричных числах. Это требует многого, чтобы фактически преобразовать эти данные во что-то более понятное.
«используйте строго»; var str = значение; alert(«str: » + str); var y256 = str.slice(0,2); var y = str.slice(3,5); var m = str.slice(6,8); var d = str.slice(9,11); var h = str.slice(12,14); var min = str.slice(15,17); var y256Base10 = +(«0x» + y256); var yBase10 = +(«0x» + y); var Год = 256*y256Base10 + yBase10; var mBase10 = +(«0x» + m); var dBase10 = +(«0x» + d); var hBase10 = +(«0x» + h); var minBase10 = +(«0x» + min); var YR = String(Year); var MM = String(mBase10); var DD = String(dBase10); var HH = String(hBase10); var MIN = String(minBase10); если (mBase10 < 10) MM = «0» + MM; если (dBase10 < 10) DD = «0» + DD; если (hBase10 < 10) HH = «0» + HH; если (minBase10 < 10) MIN = «0» + MIN; var Date = YR + «-» + MM + «-» + DD + » » + HH + «:» + MIN; Дата возврата;
С помощью предварительной обработки JavaScript вы можете получить более читаемые значения.
Преобразование SNMP «DateandTime» в метку времени
- HEX в DEC
Problem to convert a data Hex-string in Zabbix Item Value
We come to it at last the great tutorial of our time! Oh, boy, SNMP traps and Zabbix. I avoided this topic because it’s one of those features in Zabbix that is not implemented in a very user-friendly way. Therefore, I need to put in extra effort to properly explain how SNMP traps work on Zabbix
Even though it’s easy to configure when you know what you are doing, for beginners, this topic is just painful and nothing more! I mean, I really like Zabbix, but to say that SNMP implementation is great would be a lie.
But don’t worry! I will do my best to introduce you to SNMP traps in Zabbix step by step with lots of examples while we wait for the Zabbix team to improve this feature. Don’t know what is SNMP protocol? Learn step by step: MIB, OID, Agent, Manager
This tutorial should work on any Linux system: Debian, Ubuntu, Raspberry Pi OS, RHEL, CentOS, Oracle Linux, Alma Linux, or Rocky Linux.
So without further ado let’s get started!
Note: You need to log in as a root user with “su -” or use “sudo” to successfully execute commands used in this tutorial.
Table of Contents
- Step 1: Install SNMP packages
- Step 2: Configure Snmptrapd Service
- Step 3: Setup Script for SNMP Trap Processing
- Step 4: Restart and Enable Snmptrapd to Start on Boot
- Step 5: Configure Firewall to permit SNMP traps
- Step 6: Testing SNMP v3, v2 and v1 Traps
- Step 7: Enable SNMP Traps on Zabbix Server / Proxy
- Step 8: Create Zabbix items and triggers for SNMP traps
- a) Create a Template and Host in Zabbix for testing purposes
- b) Create Zabbix SNMP trap item using a Template
- c) Create Zabbix Triggers for SNMP traps using a Template
- Step 9: Learn more about SNMP Traps in Zabbix
- How do SNMP Traps work in Zabbix?
- How to Configure Logrotate for SNMP Trap File?
- How to add MIB Support for Human-Readable SNMP Traps?
- How to Troubleshoot SNMP Trap problems (snmptrapd)?
- How to Enable SNMP v2 / v1 Autorization?
- How to Configure a Python or Perl Script for Handling SNMP Traps?
- Using Additional Scripts in Snmptrapd for Specific SNMP Traps
- Filtering / Blocking SNMP Traps from Specific Hosts (blacklist)
- Learn about SNMP Traps and Zabbix Proxy Server Design issues
- Zabbix SNMP Trap Case Studies and Practical Examples
Step 1: Install SNMP packages
First, we need to install a collection of packages associated with the SNMP protocol:
RHEL / CentOS / Oracle Linux / Alma Linux / Rocky Linux
yum install -y net-snmp-utils net-snmp

Debian / Ubuntu / Raspberry Pi OS
sudo apt install -y snmptrapd snmp snmp-mibs-downloader
Step 2: Configure Snmptrapd Service
Edit the snmptrapd.conf configuration file using the following command:
nano /etc/snmp/snmptrapd.conf
And make the necessary changes so that the final configuration resembles this (you can delete everything else):
# Disables authorization for SNMP v1 and v2 traps, allowing all incoming traps without authentication.
disableAuthorization yes

# Creates two SNMPv3 user with authentication and encryption for testing purposes
createUser -e 0x80000009030038FD myuser MD5 authpass AES mypassword
authUser log,execute,net myuser priv

createUser -e 0x8000000001020304 traptest SHA mypassword AES
authUser log,execute traptest
Save and exit file (ctrl+x, followed by y and enter).
Note that on Ubuntu/Debian systems, the loading of MIBs is disabled by default. You can enable it with the following command:
sed -i 's/^mibs\s*:/# mibs :/' /etc/snmp/snmp.conf && systemctl restart snmptrapd
Nice job! This will enable the Linux system to receive traps, but where are they stored and in what format? To address this, we need to set up a script for SNMP trap processing, so let’s move on to the next step.
Step 3: Setup Script for SNMP Trap Processing
The easiest and simplest way to process traps is by using a shell script, as it eliminates the need to install any dependent packages. However, if you prefer to install a Python or Perl script (which is the default for Zabbix), you can do so by following the instructions provided at the end of this tutorial.
Please use the commands below to download ‘snmpparser.sh’ from github and set execution permissions:
curl -o /usr/bin/snmpparser.sh https://raw.githubusercontent.com/TheAldin/scripts/main/snmpparser.sh
chmod +x /usr/bin/snmpparser.sh
Now, update Snmptrapd configuration file to use that script:
echo 'traphandle default /usr/bin/bash /usr/bin/snmpparser.sh' >> /etc/snmp/snmptrapd.conf
The script will write traps to file ‘/var/log/snmptrap/zabbix_traps.tmp‘ so we need to create a directory with appropriate permissions:
mkdir -p /var/log/snmptrap
chmod a+rX /var/log/snmptrap
Step 4: Restart and Enable Snmptrapd to Start on Boot
Use the following command to restart the Snmptrapd service:
systemctl restart snmptrapd
And make sure to enable it to start on boot so that the Snmpd service starts automatically when the system reboots:
systemctl enable snmptrapd
Check the status of the snmptrapd process with command:
systemctl status snmptrapd
Step 5: Configure Firewall to permit SNMP traps
If you have firewall enabled then you need to permin UDP port 162 to receive SNMP traps.
Use these commands to open UDP port 162 on RHEL / CentOS / Oracle Linux / Alma Linux / Rocky Linux OS:
firewall-cmd --permanent --add-port=162/udp
firewall-cmd --reload
And if you have an UFW firewall installed on Ubuntu / Debian / Raspberry Pi OS, you can use this command to permit SNMP traps:
ufw allow 162/udp
Step 6: Testing SNMP v3, v2 and v1 Traps
Okay, keep our fingers crossed and hope that we’ve configured everything correctly. Let’s test SNMP traps for each SNMP version. Run these commands in the terminal:
# Testing SNMP v1 traps
snmptrap -v1  -c public 127.0.0.1 '.1.3.6.1.6.3.1.1.5.4' '0.0.0.0' 6 33 '55' .1.3.6.1.6.3.1.1.5.4 s "testSNMPv1"

# Testing SNMP v2 traps
snmptrap -v 2c -c secret 127.0.0.1 0 linkUp.0  .1.3.6.1.6.3.1.1.5.4 s "testSNMPv2"

# Testing SNMP v3 traps with MD5
snmptrap -e 0x80000009030038FD -v 3 -l authPriv -u myuser -a MD5 -A  authpass -x AES -X mypassword 127.0.0.1 0 linkUp.0  .1.3.6.1.6.3.1.1.5.4 s "testSNMPv3_MD5"

# Testing SNMP v3 traps with AES
snmptrap -v 3 -n "" -a SHA -A mypassword -x AES -X mypassword -l authPriv -u traptest -e 0x8000000001020304 localhost 0 linkUp.0  .1.3.6.1.6.3.1.1.5.4 s "testSNMPv3_AES"
Now, we need to check the ‘zabbix_traps.tmp‘ file, to see if the script has processed those traps, using this command:
cat /var/log/snmptrap/zabbix_traps.tmp
If everything was done correctly, you should have four SNMP traps that look like this:
[root@localhost ~]# cat /var/log/snmptrap/zabbix_traps.tmp

20230909.210230 ZBXTRAP 127.0.0.1
UDP: [127.0.0.1]:48749->[127.0.0.1]:162
DISMAN-EVENT-MIB::sysUpTimeInstance = 0:0:00:00.55
SNMPv2-MIB::snmpTrapOID.0 = IF-MIB::linkUp.0.33
IF-MIB::linkUp = "testSNMPv1"
SNMP-COMMUNITY-MIB::snmpTrapCommunity.0 = "public"
SNMPv2-MIB::snmpTrapEnterprise.0 = IF-MIB::linkUp
20230909.210234 ZBXTRAP 127.0.0.1
UDP: [127.0.0.1]:58439->[127.0.0.1]:162
DISMAN-EVENT-MIB::sysUpTimeInstance = 0:0:00:00.00
SNMPv2-MIB::snmpTrapOID.0 = IF-MIB::linkUp.0
IF-MIB::linkUp = "testSNMPv2"
20230909.210241 ZBXTRAP 127.0.0.1
UDP: [127.0.0.1]:55130->[127.0.0.1]:162
DISMAN-EVENT-MIB::sysUpTimeInstance = 0:0:00:00.00
SNMPv2-MIB::snmpTrapOID.0 = IF-MIB::linkUp.0
IF-MIB::linkUp = "testSNMPv3_MD5"
20230909.210245 ZBXTRAP 127.0.0.1
UDP: [127.0.0.1]:58096->[127.0.0.1]:162
DISMAN-EVENT-MIB::sysUpTimeInstance = 0:0:00:00.00
SNMPv2-MIB::snmpTrapOID.0 = IF-MIB::linkUp.0
IF-MIB::linkUp = "testSNMPv3_AES"
Please tell me if you see them so that we can move on. Yes? Great job, then! If not, you need to troubleshoot the problem. Check the chapter that deals with troubleshooting and debugging SNMP trap problems.
Step 7: Enable SNMP Traps on Zabbix Server / Proxy
All the setup we’ve done so far has nothing to do with Zabbix. That was the standard procedure for enabling traps on Linux. Now, we need to configure Zabbix to start the SNMP trapper process and point it to the trap file that the scripts generates. In our case, trap file would be ‘/var/log/snmptrap/zabbix_traps.tmp’.
Open ‘zabbix_server.conf’ file with command:
nano /etc/zabbix/zabbix_server.conf
and add this configuration anywhere in file:
StartSNMPTrapper=1
SNMPTrapperFile=/var/log/snmptrap/zabbix_traps.tmp
Save and exit file (ctrl+x, followed by y and enter). And restart Zabbix server afterwards:
systemctl restart zabbix-server
Note: In case of Zabbix proxy, follow similar steps: edit ‘zabbix_proxy.conf’ and restart the ‘zabbix-proxy’ service
Step 8: Create Zabbix items and triggers for SNMP traps
Great job! Now, all SNMP traps are accessible in Zabbix, allowing us to create items and triggers for them. The syntax for SNMP trap items in Zabbix is quite simple. The table below explains it all there is to SNMP trap options in Zabbix (item key).
| snmptrap[regexp] | Catches all SNMP traps that match the regular expression specified in regexp. If regexp is unspecified, catches any trap. This item can be set only for SNMP interfaces. User macros and global regular expressions are supported in the parameter of this item key. Examples: snmptrap[LineVoltageProblem] snmptrap[“IF-MIB::(linkDown|linkUp)”] snmptrap[“@coldStart trap”] |
| snmptrap.fallback | Catches all SNMP traps that were not caught by any of the snmptrap[] items for that interface. This item can be set only for SNMP interfaces. |
If you don’t understand these options, that’s okay. The best way to learn is by trying it out. Let’s dedicate 20 minutes to creating a lab and testing SNMP traps, and after that, everything will become clearer.
a) Create a Template and Host in Zabbix for testing purposes
Create a Template for SNMP traps
To create a template called ‘Template SNMP Traps’, follow these steps:
- Go to ‘Templates’ under the ‘Configuration’ section.
- Click on the upper left button ‘Create template’
- Define ‘Template name’ as ‘Template SNMP Traps’
- Set ‘Groups’ as ‘Templates’
- Click on the ‘Add’ button when you are finished.
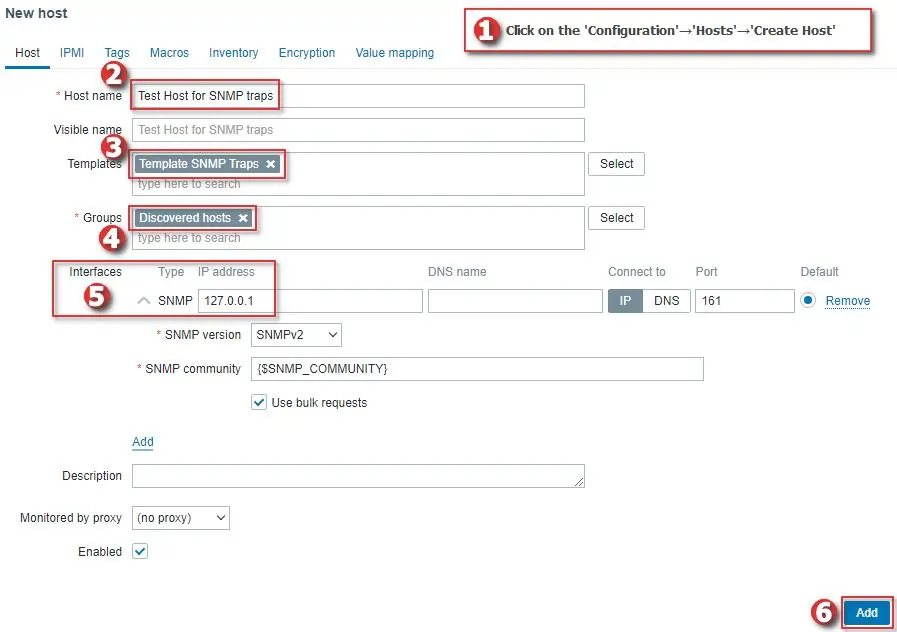
Create a Host for SNMP traps
Now, let’s create a host called ‘Test Host for SNMP traps’, with SNMP interface 127.0.0.1 and link it to the newly created ‘Template SNMP traps’, just as shown in the image below.
b) Create Zabbix SNMP trap item using a Template
Using ‘snmptrap[<regex>]’ allows you to filter any traps that you want. However, to keep things simple, we will create an ‘SNMP trap‘ item type with the key ‘snmptrap[]‘ on our test host.
Because we are not using regex, each host in Zabbix will receive all the traps that belong to them. Zabbix knows which host is associated with each trap because it compares the sender’s IP addresses from traps with the IP addresses on Zabbix hosts.
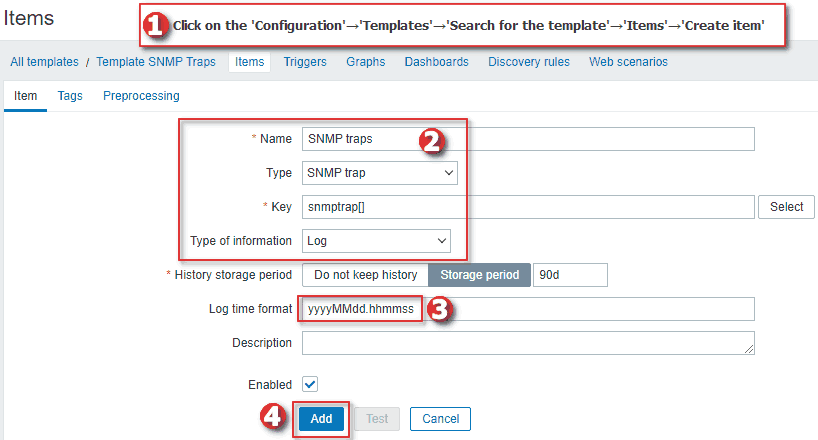
You can create the item directly on the host, but I recommend using the newly created template so that you can apply it to any host for better management.
When creating an item in the template, set ‘Name’ to ‘SNMP traps’, ‘Type’ to ‘SNMP trap’, ‘Key’ to ‘snmptrap[]’, ‘Type of information’ to ‘log’ and the ‘Log time format’ to ‘yyyyMMdd.hhmmss’, just as shown in the image below.
Now, I will use these Snmptrap commands to simulate interface up and down SNMP traps:
# This will send IF-MIB::linkDown SNMP trap for network interface eth0
snmptrap -v 1 -c public 127.0.0.1 '.1.3.6.1.6.3.1.1.5.3' '0.0.0.0' 6 33 '55' .1.3.6.1.6.3.1.1.5.3 s "eth0"

# This will send IF-MIB::linkUp SNMP trap for network interface eth0
snmptrap -v 1 -c public 127.0.0.1 '.1.3.6.1.6.3.1.1.5.4' '0.0.0.0' 6 33 '55' .1.3.6.1.6.3.1.1.5.4 s "eth0"
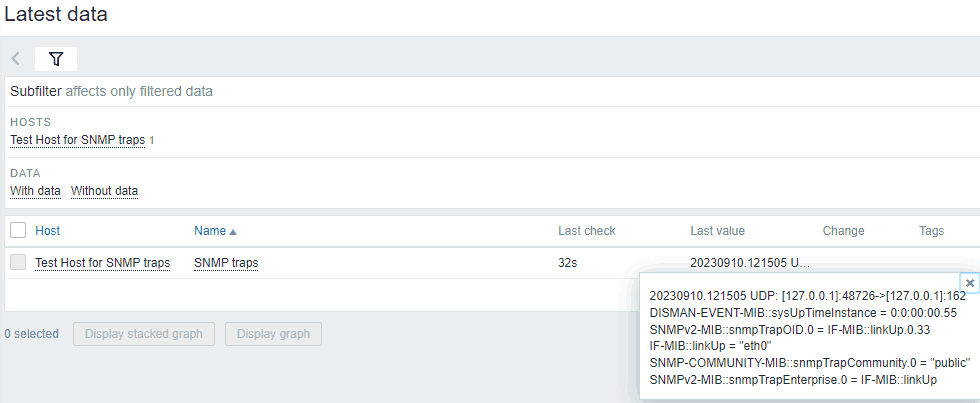
Those Snmptrap commands will generate the following SNMP traps in Zabbix:
[root@localhost ~]# cat /var/log/snmptrap/zabbix_traps.tmp

20230909.221844 ZBXTRAP 127.0.0.1
UDP: [127.0.0.1]:35776->[127.0.0.1]:162
DISMAN-EVENT-MIB::sysUpTimeInstance = 0:0:00:00.55
SNMPv2-MIB::snmpTrapOID.0 = IF-MIB::linkDown.0.33
IF-MIB::linkDown = "eth0"
SNMP-COMMUNITY-MIB::snmpTrapCommunity.0 = "public"
SNMPv2-MIB::snmpTrapEnterprise.0 = IF-MIB::linkDown

20230909.221849 ZBXTRAP 127.0.0.1
UDP: [127.0.0.1]:44550->[127.0.0.1]:162
DISMAN-EVENT-MIB::sysUpTimeInstance = 0:0:00:00.55
SNMPv2-MIB::snmpTrapOID.0 = IF-MIB::linkUp.0.33
IF-MIB::linkUp = "eth0"
SNMP-COMMUNITY-MIB::snmpTrapCommunity.0 = "public"
SNMPv2-MIB::snmpTrapEnterprise.0 = IF-MIB::linkUp
And on our host ‘Test Host for SNMP traps’ under the ‘Latest data’ section, you should see those SNMP traps.
Nice job! Let’s move on to trigger creation for SNMP traps.
c) Create Zabbix Triggers for SNMP traps using a Template
Example 1: Create a trigger for ONE network interface (down / up)
In this example, we will create a trigger that fires when it receives SNMP trap reporting that “eth0” is down (IF-MIB::linkDown = “eth0”) and clears when “eth0” is up (IF-MIB::linkUp = “eth0”).
Please create the trigger on the template ‘Template SNMP Traps’ with the following options:
Name: Interface eth0 is down on {HOST.HOST}
Severity: Warning
Problem expression: find(/Template SNMP Traps/snmptrap[],,"regexp","linkDown.*eth0\"")=1
Recovery expression: find(/Template SNMP Traps/snmptrap[],,"regexp","linkUp.*eth0\"")=1
Allow manual close: yes
As you can see, we are using regular expressions to match “linkDown.*eth0\”” for problem expression and “linkUp.*eth0\”” for recovery. Zabbix requires some time to update its configuration, so please wait for 30 seconds before proceeding to the next task.
Now, when you run the ‘snmptrap’ command with the option ‘IF-MIB::linkDown’ (1.3.6.1.6.3.1.1.5.3):
snmptrap -v 1 -c public 127.0.0.1 '.1.3.6.1.6.3.1.1.5.3' '0.0.0.0' 6 33 '55' .1.3.6.1.6.3.1.1.5.3 s "eth0"
An alarm will fire and you can see it on the Zabbix ‘Problems’ section:

To clear the alarm run the ‘snmptrap’ command with the option ‘IF-MIB::linkUp’ (1.3.6.1.6.3.1.1.5.4):
snmptrap -v 1 -c public 127.0.0.1 '.1.3.6.1.6.3.1.1.5.4' '0.0.0.0' 6 33 '55' .1.3.6.1.6.3.1.1.5.4 s "eth0"
Alright, that wasn’t too difficult. Let’s move on to the next example to learn about more complex concepts!
Example 2: Create a trigger for ANY network interface (down / up)
In our last example, we created an alarm for the network interface “eth0”. However, what if your network switch has 48 interfaces, and you want to receive alarms for every interface on that device? Creating 48 triggers individually can be quite labor-intensive. So, why go through all that when we have the powerful features of Zabbix to help us?
Let’s create a single trigger that sets off an alarm for every SNMP trap indicating an interface is down and clears it when the interface is up, and this will do for every interface: eth0, eth1, eth2, and so on.
Please create the trigger on the template ‘Template SNMP Traps’ with the following options:
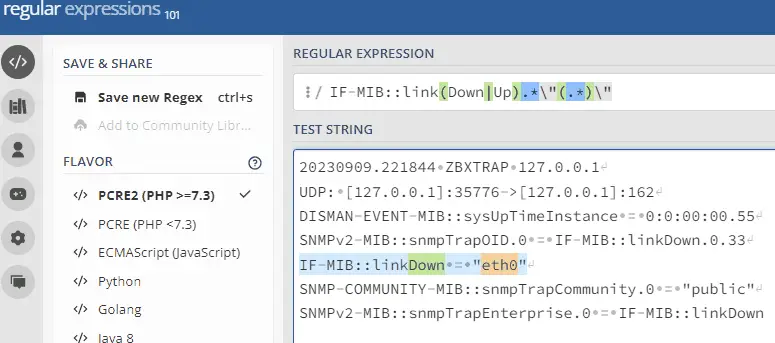
Name: Interface {{ITEM.VALUE}.regsub("IF-MIB::link(Down|Up).*\"(.*)\"", "\2")} is down on {HOST.HOST}
Severity: Warning
Problem expression: find(/Template SNMP Traps/snmptrap[],,"regexp","linkDown")=1
Recovery expression: find(/Template SNMP Traps/snmptrap[],,"regexp","linkUp")=1
PROBLEM event generation mode: Multiple
OK event closes: All problems if tag values match
Tag for matching: interface
Allow manual close: yes

Tags→Trigger tags:
    Name: interface
    Value: {{ITEM.VALUE}.regsub("IF-MIB::link(Down|Up).*\"(.*)\"", "\2")}
Now let’s see the magic in action. Run the ‘snmptrap’ command with the option ‘IF-MIB::linkDown’ for interfaces eth1 and eth2:
snmptrap -v 1 -c public 127.0.0.1 '.1.3.6.1.6.3.1.1.5.3' '0.0.0.0' 6 33 '55' .1.3.6.1.6.3.1.1.5.3 s "eth1"
snmptrap -v 1 -c public 127.0.0.1 '.1.3.6.1.6.3.1.1.5.3' '0.0.0.0' 6 33 '55' .1.3.6.1.6.3.1.1.5.3 s "eth2"
And two alarms will fire for both interfaces:

Since we are using our ‘interface’ tag, we can send a clear alarm for a specific interface, and Zabbix will only clear the alarm for that particular interface:
snmptrap -v 1 -c public 127.0.0.1 '.1.3.6.1.6.3.1.1.5.4' '0.0.0.0' 6 33 '55' .1.3.6.1.6.3.1.1.5.4 s "eth1"
So how does this work?
Zabbix uses the ‘regsub‘ function for the macro {ITEM.VALUE}. This macro represents the last item value, in our case, that would be the SNMP trap. By using ‘regsub’ we can employ regex to extract the interface name from the long trap string.
Our ‘interface’ tag was also extracted using the ‘regsub’ feature, and because of that, Zabbix can distinguish one alarm from another. This enables Zabbix to track only the words ‘linkDown’ and ‘linkUp’ for alarm activation and clearing without the need for complex regex.
I encourage you to try using regex on the website regex101.com to better understand these functions.
Now that we have a single trigger for all interfaces, you can go ahead and delete the trigger we created in the previous step.
If you need more examples and case studies, go to the chapter: Zabbix SNMP Trap Case Studies and Practical Examples
CONGRATULATIONS!
You have successfully configured SNMP traps on Zabbix monitoring system!
No need to change anything else as other steps are optional.
CONTINUE TO LEARN MORE:
How do SNMP Traps work in Zabbix?
How to Configure Logrotate for SNMP Trap File?
How to add MIB Support for Human-Readable SNMP Traps?
How to Troubleshoot SNMP Trap problems (snmptrapd)?
How to Enable SNMP v2 / v1 Autorization?
Using Additional Scripts in Snmptrapd for Specific SNMP Traps
How to Configure a Python or Perl Script for Handling SNMP Traps?
Filtering / Blocking SNMP Traps from Specific Hosts (blacklist)
Learn about SNMP Traps and Zabbix Proxy Server Design issues
Zabbix SNMP Trap Case Studies and Practical Examples
Step 9: Learn more about SNMP Traps in Zabbix
How do SNMP Traps work in Zabbix?
In a nutshell, the end-to-end SNMP trap processing goes like this:

- The device sends a trap to the Linux server, where it is received by the Snmptrapd service.
- Snmptrapd passes the trap, which translates the trap into the format that is suitable for the Zabbix server.
- After translation, the trap is saved to ‘/var/log/snmptrap/zabbix_traps.tmp’.
- Zabbix SNMP trapper process reads and parses the trap file
- For each trap Zabbix finds all “SNMP trap” items with host interfaces matching the received trap address
- For each found item, the trap is compared to regexp in “snmptrap[regexp]”. The trap is set as the value of all matched items
- If no matching item is found and there is an “snmptrap.fallback” item, the trap is set as the value of that
- If the trap was not set as the value of any item, Zabbix by default logs the unmatched trap (Administration > General > Other)
How to Configure Logrotate for SNMP Trap File?
The ‘zabbix_traps.tmp’ file can become quite large, so it would be a good idea to periodically compress it. Let’s create a logrotate configuration for the ‘/var/log/snmptrap/zabbix_traps.tmp’ file.
Create a new file with this command:
nano /etc/logrotate.d/zabbix_traps
And write these lines into that file:
# Specify the log file that this configuration applies to.
/var/log/snmptrap/zabbix_traps.tmp {
    # Rotate when log file reaches 50MB
    size 50M
    # Keep up to 10 rotated log files.
    rotate 10
    # Compress rotated log files.
    compress
    # Delay compression until the next rotation.
    delaycompress
    # Do not report errors if the log file is missing.
    missingok
    # Avoid rotating empty log files.
    notifempty
}
How to add MIB Support for Human-Readable SNMP Traps?
Later in this tutorial, you will learn how to create SNMP trap support for the Cisco UCS system. In those examples, SNMP trap look like this:
.1.3.6.1.4.1.9.9.719.1.1.1.1.11.1788684 value=STRING: "Config backup may be outdated"
.1.3.6.1.4.1.9.9.719.1.1.1.1.13.1788684 value=Counter64: 1788683
It would be helpful to have SNMP object IDs in a human-readable form, like this:
CISCO-UNIFIED-COMPUTING-FAULT-MIB::cucsFaultDescription.1790835 value=STRING: "Config backup may be outdated"
CISCO-UNIFIED-COMPUTING-FAULT-MIB::cucsFaultId.1790835 value=Counter64: 1788683
To achieve that, you need to download the correct MIB files and enable the Snmptrapd service to load all SNMP MIB modules.
a) Download SNMP MIB Files
Search the MIB database for the MIB that you would like to import into Zabbix. Download that MIB and every MIB listed under the ‘Imports’ section. Change the extension of all the downloaded MIB, replacing ‘.mib’ with ‘.txt’, and copy them to the correct directory path. By default, it is ‘/usr/share/snmp/mibs‘. Afterward, you need to reset the Snmpd service, and that’s it!
Read more about this in How to Import MIB to Zabbix: A Step-by-Step Guide.
b) Edit the Snmptrapd Service to Load all SNMP MIB Modules
You may have correct MIB files in the MIB directory (‘/usr/share/snmp/mibs’) but Snmptrapd will not load them by default!
To enable this, you need to edit the Snmptrapd service with the option ‘-m ALL‘ which means it will load and make available all SNMP MIB modules configured on the system:
nano /usr/lib/systemd/system/snmptrapd.service
Add the option ‘-m ALL’ so that the ‘ExecStart’ line looks like this (note that this line differs on RHEL from Debian-based OS):
RHEL / CentOS / Oracle Linux / Alma Linux / Rocky Linux
ExecStart=/usr/sbin/snmptrapd $OPTIONS -f -m ALL

Debian / Ubuntu / Raspberry Pi OS
ExecStart=/usr/sbin/snmptrapd -LOw -f -m ALL -p /run/snmptrapd.pid
Save and exit file (ctrl+x, followed by y and enter), then reload the daemon and restart the Snmptrapd service afterward:
systemctl daemon-reload
systemctl restart snmptrapd
How to Troubleshoot SNMP Trap problems (snmptrapd)?
Below you will find guidance on how to troubleshoot SNMP traps on Zabbix.
a) Review Steps
Read the tutorial carefully from the beginning to see if you have missed any steps.
b) Firewall
If you have firewall enabled then you need to permit UDP port 162 to receive SNMP traps.
c) SElinux
Check the SELinux if you are on an RHEL-based OS.
d) Snmptrapd Status
Check the status of the snmptrapd process with command:
systemctl status snmptrapd
e) Logs
Check system logs with the command:
journalctl
f) Run Debug
Stop the Snmptrapd service and start it manually in debug mode to check traps live as they come in.
systemctl stop snmptrapd
snmptrapd -f -Lo -Dusm
g) Tcpdump
Install TCP dump with these command:
RHEL / CentOS / Oracle Linux / Alma Linux / Rocky Linux
yum install tcpdump

Debian / Ubuntu / Raspberry Pi OS
 apt-get install tcpdump
To view SNMP traps as they come in on the network interface use this command (check your interface name with ‘ip a’):
tcpdump -i <interface> -n -X -s 0 'udp port 162'
How to Enable SNMP v2 / v1 Autorization?
Earlier in this tutorial, we set the ‘disableAuthorization’ option, allowing SNMP v1 and SNMP v2 traps to be received without a community string.
If you wish to enable authorization, you should comment out the ‘disableAuthorization’ line and add your SNMP communities. Edit the snmptrapd.conf configuration file using the following command:
nano /etc/snmp/snmptrapd.conf
Update the configuration:
#disableAuthorization
authCommunity execute public
authCommunity execute private
authCommunity execute MySnmpCommunity
Save and exit file (ctrl+x, followed by y and enter). And restart Snmptrapd service afterwards:
systemctl restart snmptrapd
How to Configure a Python or Perl Script for Handling SNMP Traps?
Depending on your specific situation, you may consider replacing that Shell script with either a Python or Perl script.
Option 1: Perl Script for SNMP traps (default)
From the beginning, Zabbix has recommended a Perl script (and still does) as the default script for trap processing in Zabbix.
Install a Perl package on Linux:
RHEL / CentOS / Oracle Linux / Alma Linux / Rocky Linux
yum install -y net-snmp-perl


Debian / Ubuntu / Raspberry Pi OS
sudo apt install -y libsnmp-perl
Download the ‘zabbix_trap_receiver.pl’ script from github, save it to ‘/usr/bin’ and grant it executable permissions:
curl -o /usr/bin/zabbix_trap_receiver.pl https://raw.githubusercontent.com/TheAldin/scripts/main/zabbix_trap_receiver.pl
chmod +x /usr/bin/zabbix_trap_receiver.pl
Disable the current traphandles with this command:
sed -i '/^traphandle/ s/^/# /' /etc/snmp/snmptrapd.conf
Add this line to the SNMP configuration file so that Snmptrapd knows it needs to send each trap to Perl script for processing:
echo 'perl do "/usr/bin/zabbix_trap_receiver.pl"' >> /etc/snmp/snmptrapd.conf
And don’t forget to restart the Snmptrapd service
systemctl restart snmptrapd
Option 2: Python Script for SNMP traps
Credit for this Python script goes to Opensource ICT Solutions B.V.
Install a Python package on Linux:
RHEL / CentOS / Oracle Linux / Alma Linux / Rocky Linux
yum install -y python3 python3-setuptools


Debian / Ubuntu / Raspberry Pi OS
apt install -y python3 python3-setuptools
Download the ‘snmptrap-parser.py’ script from github, save it to ‘/usr/bin’ and grant it executable permissions:
curl -o /usr/bin/snmptrap-parser.py https://raw.githubusercontent.com/TheAldin/scripts/main/snmptrap-parser.py
chmod +x /usr/bin/snmptrap-parser.py
Disable the current traphandles with this command:
sed -i '/^traphandle/ s/^/# /' /etc/snmp/snmptrapd.conf
Add this line to the SNMP configuration file so that Snmptrapd knows it needs to send each trap to python script for processing:
echo 'traphandle default /usr/bin/python /usr/bin/snmptrap-parser.py' >> /etc/snmp/snmptrapd.conf
Set the correct Python path in snmptrapd.conf:
sed -i "s|/usr/bin/python|$(whereis python | awk '{print $2}')|g" /etc/snmp/snmptrapd.conf
And don’t forget to restart the Snmptrapd service
systemctl restart snmptrapd
Using Additional Scripts in Snmptrapd for Specific SNMP Traps
What if you have already set up Shell or Perl scripts that are highly performance-efficient, and now you need to process or enrich data in a trap with a specific OID? That could slow down the whole trap process, and we don’t want that.
For example, many log systems can send crucial logs as a trap to Zabbix, but they use the IP address of the syslog server as the origin instead of the host that generated that syslog. In that case, you can leave everything as is in the Snmptrapd configuration file but add another trap handler that will be used only when a trap with a specific OID arrives.
Here is an example of an Snmptrap configuration that has a special script for traps with OID 1.3.6.1.4.1.700.1.1.0:
traphandle default /usr/bin/bash /usr/bin/snmpparser.sh
traphandle 1.3.6.1.4.1.700.1.1.0 /usr/bin/bash /usr/bin/SnmpparserSyslog.sh
That way, your default trap processing remains intact, and all the traps with the ‘1.3.6.1.4.1.700.1.1.0’ OID will be processed with another script.
Filtering / Blocking SNMP Traps from Specific Hosts (blacklist)
So what if some device is spamming your Zabbix server with tons of SNMP traps? You have the option to block that host. In this section, we will discuss how to filter SNMP traps from specific hosts using a blacklist approach. By configuring the snmptrapd.conf file as shown below, you can effectively block SNMP traps originating from the specific IP address.
Edit the snmptrapd.conf configuration file using the following command:
nano /etc/snmp/snmptrapd.conf
Add something like this in the file, but change the IP address to your IP address that you wish to block:
sourceFilterType blacklist
sourceFilterAddress 192.168.1.100
sourceFilterAddress 10.10.10.222
Save and exit file (ctrl+x, followed by y and enter). And restart Snmptrapd service afterwards:
systemctl restart snmptrapd
Learn about SNMP Traps and Zabbix Proxy Server Design issues
Zabbix traps work great when there aren’t too many Zabbix proxy servers. However, there is a design issue when dealing with a large number of proxy servers.
Each device that sends SNMP traps needs to send them to the proxy servers to which that device belongs. This means that if you configure all the devices in the network to send traps to the IP address of a specific Zabbix proxy, only devices assigned to that proxy will receive the traps. If you move a host to another proxy, it will stop receiving traps.
This situation can be problematic in large environments where multiple proxy servers serve the same purpose. For example, if you have 10 proxy servers in one location, and each proxy server handles 1000 devices, you have two options to make traps work. You can either configure each device to send traps to all proxy servers (which is not recommended), or you can configure each device to send traps to the appropriate proxy (which can be error-prone and difficult to manage).
What can be done about this?
You can use any of the SNMP trap scripts from this tutorial to develop new functionality, allowing it to identify which IP address belongs to which proxy server. This way, you can have only one IP address (Zabbix server) that devices will use to send SNMP traps, and the script will forward the trap to the correct proxy server.
However, this is beyond the scope of this tutorial.
Zabbix SNMP Trap Case Studies and Practical Examples
Earlier in this tutorial, we have learned how to configure a trigger for SNMP traps that activate and clear alarms for each network interface “down” and “up” status. Here, I will share additional examples to assist you in configuring traps.
Also, if you need more examples, please add comment with your trap data and describe what you need to do with it, and I will attempt to create regex and triggers for that trap.
Case Study 1: Creating Support for Fault Traps from Cisco UCS System
Cisco UCS systems use the MIB CISCO-UNIFIED-COMPUTING-FAULT-MIB to send system faults as traps to other systems. We will use three SNMP OIDs from the trap. The first OID is called cucsFaultDescription (1.3.6.1.4.1.9.9.719.1.1.1.1.11) and it contains the fault description.
The second OID is called CucsFaultSeverity (1.3.6.1.4.1.9.9.719.1.1.1.1.20), and it contains the status of the trap, which can be one of the following: cleared(0), info(1), warning(3), minor(4), major(5), or critical(6).
The last OID is called cucsFaultId (1.3.6.1.4.1.9.9.719.1.1.1.1.13), and it will enable Zabbix to know which trigger to clear when multiple traps arrive.
Here are examples of a few clear SNMP traps that UCS can send:
.1.3.6.1.4.1.9.9.719.1.1.1.1.11.1790835 type=4  value=STRING: "Local Internal backup failed while upgrade. Please re-trigger a manual backup."
.1.3.6.1.4.1.9.9.719.1.1.1.1.4.1790835 type=6  value=OID: .1.3.6.1.4.1.9.9.719.1.31.4.1.2.1769833
.1.3.6.1.4.1.9.9.719.1.1.1.1.5.1790835 type=4  value=STRING: "sys/backup-10.7.69.59"
.1.3.6.1.4.1.9.9.719.1.1.1.1.10.1790835 type=4  value=Hex-STRING: 07 E2 02 0B 0D 26 29 28
.1.3.6.1.4.1.9.9.719.1.1.1.1.14.1790835 type=4  value=Hex-STRING: 07 E2 02 0C 09 14 0B 33
.1.3.6.1.4.1.9.9.719.1.1.1.1.9.1790835 type=2  value=INTEGER: 1672
.1.3.6.1.4.1.9.9.719.1.1.1.1.22.1790835 type=2  value=INTEGER: 9
.1.3.6.1.4.1.9.9.719.1.1.1.1.7.1790835 type=2  value=INTEGER: 820
.1.3.6.1.4.1.9.9.719.1.1.1.1.20.1790835 type=2  value=INTEGER: 0
.1.3.6.1.4.1.9.9.719.1.1.1.1.16.1790835 type=65 value=Counter32: 65
.1.3.6.1.4.1.9.9.719.1.1.1.1.13.1790835 type=70 value=Counter64: 1790834
.1.3.6.1.4.1.9.9.719.1.1.1.1.11.1788684 type=4  value=STRING: "Config backup may be outdated"
.1.3.6.1.4.1.9.9.719.1.1.1.1.4.1788684 type=6  value=OID: .1.3.6.1.4.1.9.9.719.1.31.43.1.2.31644
.1.3.6.1.4.1.9.9.719.1.1.1.1.5.1788684 type=4  value=STRING: "sys/bkup-policy-cfg"
.1.3.6.1.4.1.9.9.719.1.1.1.1.10.1788684 type=4  value=Hex-STRING: 07 E2 02 08 0D 3B 1F 28
.1.3.6.1.4.1.9.9.719.1.1.1.1.14.1788684 type=4  value=Hex-STRING: 07 E2 02 0C 09 14 0B 39
.1.3.6.1.4.1.9.9.719.1.1.1.1.9.1788684 type=2  value=INTEGER: 1392
.1.3.6.1.4.1.9.9.719.1.1.1.1.22.1788684 type=2  value=INTEGER: 9
.1.3.6.1.4.1.9.9.719.1.1.1.1.7.1788684 type=2  value=INTEGER: 654
.1.3.6.1.4.1.9.9.719.1.1.1.1.20.1788684 type=2  value=INTEGER: 0
.1.3.6.1.4.1.9.9.719.1.1.1.1.16.1788684 type=65 value=Counter32: 1
.1.3.6.1.4.1.9.9.719.1.1.1.1.13.1788684 type=70 value=Counter64: 1788683
Now, we must create a trigger in Zabbix that will actvate an alarm and parse the description of the trap when statuses 3 – 6 arrive, and clear the traps when status 0 arrives. The fault description will end up as the name of the trigger. In my example, I will configure a trigger to ignore status ‘info (1)’ because it does not represent a fault.
Name: Cisco UCS fault: {{ITEM.VALUE}.regsub(".719.1.1.1.1.11.*\"(.*)\"", "\1")}
Severity: Warning
Problem expression: find(/Template UCS SNMP Traps/snmptrap[],,"regexp","719.1.1.1.1.20.*?INTEGER:.[34567]")=1
Recovery expression: find(/Template UCS SNMP Traps/snmptrap[],,"regexp","719.1.1.1.1.20.*?INTEGER:.0")=1
PROBLEM event generation mode: Multiple
OK event closes: All problems if tag values match
Tag for matching: ucsfaultid
Allow manual close: yes

Tags→Trigger tags:
    Name: ucsfaultdescription
    Value: {{ITEM.VALUE}.regsub(".719.1.1.1.1.11.*\"(.*)\"", "\1")}

    Name: ucsfaultid
    Value: {{ITEM.VALUE}.regsub(".719.1.1.1.1.13.*?Counter64:.(.*)", "\1")}
Well, this is the basic trap, but it can be improved. For example, you could create a trigger for each severity and in the regex you could put ‘719.1.1.1.1.20.*?INTEGER:.[4]’ to be warning severity (yellow), ‘719.1.1.1.1.20.*?INTEGER:.[5]’ major (orange) etc.
Note that I did not implement CISCO-UNIFIED-COMPUTING-FAULT-MIB on Linux, so the traps in this example have OIDs in numeric format instead of human-readable names. Replace the OIDs inside the regex with object names if you are using the MIB: ‘719.1.1.1.1.20’ to ‘cucsFaultSeverity’, ‘719.1.1.1.1.11’ to ‘cucsFaultDescription’, and ‘719.1.1.1.1.13’ to ‘cucsFaultId’.
And that’s all. If you have configured everything correctly, you should receive Cisco UCS alarms in Zabbix.
Case Study 2: Creating ‘Tag for matching’ by Combining Different OID Values from Multiple Lines in SNMP Traps
Previously, we have created alarms for interface UP and DOWN statuses using a single OID (represented by one line in the trap message) to generate a matching tag.
But what if you need to use two lines from traps for recovery, and you want to place them inside the ‘Tag for matching’? Do we use two tags? No, we need to craft two regexes in one tag. Let me explain.
Below is an SNMP trap that will trigger an alarm in Zabbix because it contains the string ‘STARENT-MIB::starPortDown’:
21:08:17 2023/10/19 ZBXTRAP 172.16.35.67
PDU INFO:
  community                      public
  errorindex                     0
  receivedfrom                   UDP: [172.16.35.67]:60030->[10.39.250.82]:162
  errorstatus                    0
  transactionid                  192
  messageid                      0
  notificationtype               TRAP
  version                        1
  requestid                      258800841
VARBINDS:
  DISMAN-EVENT-MIB::sysUpTimeInstance type=67 value=Timeticks: (0) 0:00:00.00
  SNMPv2-MIB::snmpTrapOID.0      type=6  value=OID: STARENT-MIB::starPortDown
  STARENT-MIB::starPortSlot      type=4  value=STRING: "5"
  STARENT-MIB::starPortNum       type=4  value=STRING: "6"
  STARENT-MIB::starPortType      type=2  value=INTEGER: 0
  STARENT-MIB::starSlotSerialNumber type=4  value=""
But when the clear alarm comes with ‘STARENT-MIB::starPortUp‘ how will Zabbix determine that only the alarm for an interface that has ‘starPortSlot’ equal to 5 and ‘starPortType’ equal to 6 needs to be cleared?
21:10:54 2023/10/19 ZBXTRAP 172.16.35.67
PDU INFO:
  errorstatus                    0
  transactionid                  193
  notificationtype               TRAP
  messageid                      0
  requestid                      258800842
  version                        1
  community                      public
  errorindex                     0
  receivedfrom                   UDP: [172.16.35.67]:63004->[10.39.250.82]:162
VARBINDS:
  DISMAN-EVENT-MIB::sysUpTimeInstance type=67 value=Timeticks: (0) 0:00:00.00
  SNMPv2-MIB::snmpTrapOID.0      type=6  value=OID: STARENT-MIB::starPortUp
  STARENT-MIB::starPortSlot      type=4  value=STRING: "5"
  STARENT-MIB::starPortNum       type=4  value=STRING: "6"
  STARENT-MIB::starPortType      type=2  value=INTEGER: 0
  STARENT-MIB::starSlotSerialNumber type=4  value=""
The solution is to create a tag for matching that is composed of two OID values, ‘starPortSlot’ and ‘starPortNum,’ like this:
Name: Interface {{ITEM.VALUE}.regsub("starPortSlot.+\"(.+)\"", "\1")} / {{ITEM.VALUE}.regsub("starPortNum.+\"(.+)\"", "\1")} is down on {HOST.HOST}
Severity: Warning
Problem expression: find(/Template SNMP Traps/snmptrap[],,"regexp","starPortDown")=1
Recovery expression: find(/Template SNMP Traps/snmptrap[],,"regexp","starPortUp")=1
PROBLEM event generation mode: Multiple
OK event closes: All problems if tag values match
Tag for matching: interface
Allow manual close: yes

Tags→Trigger tags:
    Name: interface
    Value: {{ITEM.VALUE}.regsub("starPortSlot.+\"(.+)\"", "\1")} / {{ITEM.VALUE}.regsub("starPortNum.+\"(.+)\"", "\1")}
Using the trigger configuration above, you will receive an alarm in Zabbix called ‘Interface 5 / 6 is down on HostXY‘ with an ‘interface‘ tag having both values ‘5 / 6′.
Мониторинг сервера Windows позволяет отслеживать его работоспособность и оперативно реагировать на любые отклонения. Перезагрузки, заполнение дисков, нехватка оперативной памяти, высокая нагрузка на процессор, потеря связи или чрезмерное потребление трафика — всё это можно держать под контролем, если вы используете правильные инструменты.
В этом материале мы рассмотрим, как установить и настроить Zabbix-сервер и агент на Windows, а также какие моменты особенно важны для стабильной работы мониторинга.
Онлайн-курс: Zabbix 6. Мониторинг IT инфраструктуры предприятия.
Курс предлагает глубокое изучение Zabbix 6 и охватывает все ключевые аспекты: от установки и конфигурации до продвинутого мониторинга и автоматизации. Курс подходит как для начинающих, так и для опытных администраторов.
Содержание:
- Проверка версии Zabbix-сервера
- Загрузка агента Zabbix
- Установка агента Zabbix
- Настройка хоста в Zabbix-сервере
- Мониторинг и визуализация
- Заключение
Проверка версии Zabbix-сервера
Перед началом убедитесь, какую версию Zabbix-сервера вы используете. Эту информацию можно найти в веб-интерфейсе Zabbix, перейдя в раздел Reports > System information.
В нашем примере используется версия 7.0.9.

Перед установкой агента на Windows-сервере необходимо определить его архитектуру и имя.

Эти данные критичны при выборе подходящего инсталляционного пакета.
Загрузка агента Zabbix
Перейдите на официальный сайт Zabbix и скачайте соответствующую версию агента.
При выборе версии обратите внимание на следующие параметры:
- Операционная система: Windows
- Архитектура: 64-bit
- Совместимость по версии: должна соответствовать версии вашего Zabbix-сервера
- Метод шифрования: рекомендуется выбрать OpenSSL
- Формат установки: файл формата MSI

Выберите актуальную версию релиза агента и загрузите инсталлятор.

Установка агента Zabbix
Запустите установку агента Zabbix на вашем сервере Windows.

Примите условия лицензионного соглашения.

На следующем этапе выберите компоненты, которые необходимо установить. По умолчанию требуется около 8,70 МБ свободного пространства.

Путь установки — C:\Program Files\Zabbix Agent\.
Инсталлятор автоматически определит имя машины. Далее нужно указать IP-адрес сервера Zabbix, с которым агент будет связываться.
Также на этом этапе можно настроить защищённое соединение с использованием предустановленного ключа. Подробнее об этом методе читайте на официальной странице: Использование pre-shared ключей

Начните установку и дождитесь её завершения.


Настройка хоста в Zabbix-сервере
Чтобы добавить хост для мониторинга в системе Zabbix, откройте веб-интерфейс и перейдите в Data collection > Hosts.
Нажмите Create host (в правом верхнем углу) и укажите следующие параметры:
- Имя хоста: например, DESKTOP-D75R1IG
- Отображаемое имя: например, Windows Server
- Шаблон: выберите Windows by Zabbix Agent — он включает в себя ключевые метрики Windows-систем
- Группа: определяет логическое размещение сервера (например, Windows Servers)
- Интерфейс: выберите тип Agent, укажите IP-адрес целевого сервера

Мониторинг и визуализация
Как только хост будет добавлен, вы начнёте получать информацию о состоянии сервера в режиме реального времени:
- Общая производительность: загрузка CPU, использование памяти и состояние дисков


- Работа служб Windows и подробная информация о системе

- Потребление сетевого трафика

Кроме того, можно отслеживать отказоустойчивость, продолжительность аптайма и другие важные параметры.
Заключение
Zabbix предоставляет мощные инструменты для мониторинга серверов Windows, предлагая готовые шаблоны и гибкие возможности настройки. Это делает его незаменимым решением для построения системы централизованного наблюдения за ИТ-инфраструктурой.
Вдобавок к базовому мониторингу вы можете расширить функциональность, подключив контроль логов, событий безопасности, конкретных портов, отслеживание неудачных попыток входа в систему и многое другое. Всё это помогает оперативно реагировать на инциденты и минимизировать простои.
А если вы хотите углубиться в тему и освоить Zabbix на профессиональном уровне — обратите внимание на курс Zabbix 6. Мониторинг IT инфраструктуры предприятия. Это практическое и структурированное обучение, созданное с учётом реальных задач, с которыми сталкиваются системные администраторы и инженеры мониторинга.
Вам понравилась эта статья? Тогда вам, скорее всего, будет интересна другая полезная статья Основы Zabbix: хосты, элементы данных и триггеры.
Интересуешься IT и системным администрированием? Подпишись на SysAdminHub в телеграмм, чтобы узнавать обо всем первым — t.me/SysAdminHub
Статья была полезна? Поддержи автора, и благодаря твоей помощи новые материалы будут выходить еще чаще: