Инструменты мониторинга IT-инфраструктуры позволяют полностью отслеживать ее состояние: собирать данные, анализировать и визуализировать их, оповещать о сбоях и т.д. В этой статье рассмотрим платформы Zabbix, Icinga и Prometheus.
Что это за инструменты?
Zabbix
Начну со старшего поколения (2001 г.) – Zabbix. Решение с открытым исходным кодом, впрочем как и все остальные, основанное на GPL (стандартная общественная лицензия). Это делает его бесплатным для использования.
На данный момент у программы множество версий. Самая популярная версия — 5.0 LTS с пятилетней долгосрочной поддержкой, которая подходит для производственной среды. А недавно была выпущена версия 6.0 LTS. В плане развития компании сообщается о возможности выпуска и дополнительных версий — вплоть до 7.0 LTS.

Icinga
icinga представляет из себя модульную систему мониторинга с открытым исходным кодом, изначально созданная как ответвление от Nagios. Позволяет наблюдать за состоянием серверной инфраструктуры, сервисов, роутеров и т.д. Icinga 2 предлагает как прямой мониторинг, так и поддержку SNMP для серверов и других устройств. Ее используют для снятия метрик и алертов по хостам и их сервисам.
В отличии от первой версии Icinga, во второй – было переписано ядро. Структура Icinga оптимизирована для развертывания распределенных систем мониторинга, при которой возможно создание нескольких агентов мониторинга, осуществляющих проверки и направляющих результаты на основной узел.

Prometheus
Prometheus – это система, выпущенная в 2012 году бывшими сотрудниками Google. Изначально она предназначался для мониторинга контейнерных сред, но со временем ее возможности расширились до приложений, серверов, баз данных и виртуальных машин.
Все компоненты Prometheus доступны по лицензии Apache 2 на GitHub. Это не мешает крупным компаниям использовать эту систему в качестве ключевого элемента инфраструктуры (среди клиентов есть, например, DigitalOcean, Docker, Showmax или SoundCloud).

Чтобы наблюдать и анализировать графики в полной мере, лучше установить полноценный инструмент визуализации. Часто для этого используют интеграцию с Grafana, тем более она включает встроенную поддержку Prometheus.
Grafana подключается ко всем возможным источникам данных таким, как Graphite, Prometheus (об этом сочетании поговорим далее), Influx DB, Elastic Search, MySQL, PostgreSQL и т. д.
Grafana предоставляет список панельных модулей, позволяющих создавать красивые визуализации с такими параметрами, как карты мира, тепловые карты, гистограммы, круговые и линейные диаграммы.

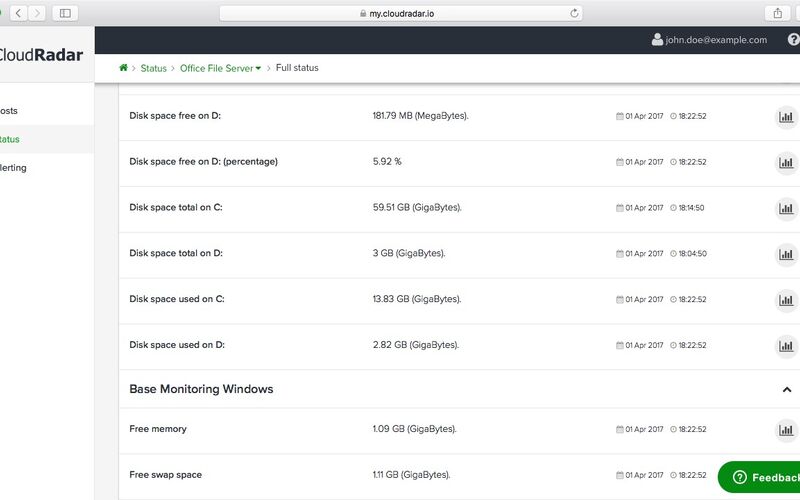
Мы в Serverspace сами используем Grafana для отслеживания состояния нашей инфраструктуры. В офисе у нас висят информационные экраны, на которых транслируется вся информация: выручка, скорость создания серверов, какие операционные системы используются чаще всего, на каких создано больше серверов и т.д. Для сбора данных используем Microsoft SQL.
Например, на скриншоте отображена метрика: скорость создания VM. По этим графикам определяем, что есть проблема с Windows и немного с CentOS (средняя скорость должна быть 40 секунд, а сейчас 52,4), поэтому отправляем задачу на решение нашему саппорту.

В чем же отличия инструментов мониторинга?
Zabbix, Icinga и Prometheus выполняют функции мониторинга серверной инфраструктуры и оповещения. Настроить можно для разных устройств и систем. Они отличаются технологиями и инструментами. Разбираем по основным критериям.
Архитектура и сбор данных
Zabbix
С точки зрения архитектуры Zabbix состоит из нескольких программных компонентов: сервер, база данных, веб-интерфейс, прокси и агенты.

Zabbix сервер является центральным компонентом, которому агенты сообщают статистику и информацию о доступности и целостности. Он отвечает за прием, агрегацию и обработку данных, а также за генерацию событий и обнаружение аномалий. Для любых событий можно использовать различные виды обработки – e-mail, webhook, скрипты и т.д. В базе данных хранится вся информация о конфигурации, а также данные, собранные Zabbix.
Агенты Zabbix локально собирают метрики ОС. Они могут работать как в пассивном, так и в активном режимах. В пассивном режиме агенты обрабатывают запрос от сервера вместе со списком параметров, которые он должен контролировать, и возвращает ему собранные данные. В активном режиме агент первым устанавливает связь с сервером и регулярно отправляет ему данные.
Дополнительный элемент – прокси-сервер Zabbix, обеспечивающий связь между агентами и сервером Zabbix.Такое решение целесообразно применять в геораспределенной сети, например, между отделами компании, местами с плохой связью. Прокси Zabbix и агенты Zabbix, как и сервер, написаны на языке C.
В случаях, когда нет возможности установить агент, Zabbix предлагает безагентный мониторинг. С его помощью можно проверять доступность сетевых устройств (маршрутизаторы, коммутаторы), а также выполнять удаленные команды.
Icinga
Icinga2 написана на C++ и имеет модульную архитектуру с отдельным ядром, пользовательским интерфейсом и базой данных, в которые можно интегрировать различные дополнения и расширения. Управляет задачами по мониторингу, запускает проверки служб, занимается отправкой уведомлений.
Изначально Icinga является ответвлением от Nagios, поэтому отличается от него переработанной архитектурой, переведенной на использование прослоек IDOMOD и IDO2DB, позволяющих организовать хранение данных мониторинга и конфигурационной информации в СУБД MySQL, Oracle или PostgreSQL.

В состав Icinga входит модульный web-интерфейс, написанный на языке PHP, активно использующий AJAX и и предоставляющий статистику в виде графиков. Для обеспечения интеграции с внешними сервисами предусмотрено несколько API: XML, JSON, SOAP.

Prometheus
Архитектура Prometheus состоит из сервера, считывающего, агрегирующего и анализирующего данные и сохраняющего их в базе, push шлюза для приёма метрик, клиентских библиотек, менеджера уведомлений AlertManager, инструментов для экспорта данных из сторонних приложений, клиента командной строки для выполнения запросов к данным. Большинство из этих компонентов написаны на Go, и взаимодействуют по протоколу HTTP.

Prometheus собирает метрики на основе методов push и pull. В первом методе отслеживаемое приложение отвечает за отправку метрик в систему мониторинга с помощью Push шлюза. В методе pull приложение подготавливает метрики, а Prometheus решает, когда их скачивать, исходя из правил. Prometheus имеет эффективную встроенную базу данных временных рядов, поэтому информация о метриках хранится с отметкой времени, когда они были записаны.
В Prometheus используется язык PromQL (Prometheus Query Language), используемый для запросов и агрегирования данных мониторинга в режиме реального времени с использованием операторов и функций. Для автоматизации мониторинга используется Alertmanager, которое генерирует и отправляет оповещения при соблюдении определенных условий.
Prometheus не имеет возможности визуализировать собранные данные. Поэтому часто его устанавливают в купе с Grafana. Информационные панели подключаются к источникам данных для визуализации метрик. Специалисты обоих решений сотрудничают друг с другом, развивая интеграцию с Prometheus в Grafana и предоставляя клиентам Grafana доступ к нужным им функциям Prometheus.
В этом сочетании Prometheus будет основным уровнем для очистки и хранения данных, тогда как Grafana отвечает за получение данных с сервера Prometheus с помощью источника данных.
Хранение данных
Zabbix
Zabbix использует внешнюю базу данных для хранения инфы. БД Zabbix нужно создавать во время его установки. Поддерживаются: MySQL, PostgreSQL, Oracle, IBM DB2 и SQLite.
Zabbix может из коробки дать базовые функции для хранения некоторых текстовых значений, их анализа и настройки триггеров. Например, объем диска через системные утилиты.
Icinga
Icinga Data Out Database (IDODB) является точкой хранения данных мониторинга для надстроек или веб-интерфейса и предназначен для вывода всех данных системы мониторинга в базу данных. Поддерживает такие БД, как MySQL, Oracle Database, PostgreSQL.
Prometheus
Prometheus хранит данные в виде time-series database. Имея локальную БД, он может получать и обрабатывать больше метрик, чем другие системы.
Prometheus не подходит для текста, журналов или журналов событий. Если вы используете свой Prometheus с Grafana (является наиболее распространенным сочетанием), вы можете найти обходной путь, используя Loki Grafana. Хотя для логов лучше использовать специализированные продукты.
Запросы
Zabbix
В Zabbix есть item keys, которые используют связь с агентом Zabbix для сбора данных и получения метрик. Различают пассивные и активные проверки агентов. При настройке элемента можно выбрать необходимый тип: Zabbix агент – для пассивных проверок или Zabbix агент (активный) — для активных проверок. Поддерживаемые item keys можно увидеть здесь. Для работы с базой данных используется SQL.
Icinga
Как и в Zabbix здесь используется язык запросов SQL.
Prometheus
Более гибок. Prometheus предоставляет собственный язык для запросов, который называется PromQL. Он может применять функции и операторы к запросам метрик, фильтровать, группировать по меткам и использовать регулярные выражения для улучшения сопоставления и фильтрации. Результат выражения можно отобразить в виде графика, просмотреть в виде табличных данных в браузере или использовать внешние системы через HTTP API.
UI
Zabbix
У Zabbix есть собственный веб-интерфейс с гибкими настройками. Можно настроить информационные панели на основе виджетов, сделать графики, карты сети, слайд-шоу и детализированные отчеты. По умолчанию интерфейс Zabbix предоставляет несколько предопределенных тем, но можно создавать свои собственные дашборды.

Icinga
У Icinga довольно простой web-интерфейс, написанный на PHP. Это доступная панель для отслеживания данных, позволяющая расширять функции с помощью дополнительных модулей. Можно настроить интеграцию с помощью Grafana. Однако, если говорить про ux он не совсем удобен, поэтому лучше настроить интеграцию.

Prometheus
У Prometheus есть Expression Browser. Но он не является полноценной панелью визуализации. Его можно использовать для выполнения углубленных запросов к сохраненным метрикам. Работает как консоль, позволяя вам делать запросы к базе данных, изменять запрос и узнавать ответы на свои вопросы.

Если хочется полноценно наблюдать и анализировать графики, лучше использовать полноценный инструмент визуализации, например Grafana.

Оповещение
Zabbix
В Zabbix функцию оповещения встроена, что позволяет управлять событиями различными способами: отправка сообщений, выполнение удаленных команд и т.д. Также можно настраивать сообщения в зависимости от роли получателя, выбирая, какую информацию включать, например дату, время, имя хоста, значение элементов, значения триггеров, профиль хоста и т. д.

Zabbix хранит все события в базе данных в виде списка. Параметры фильтрации можно использовать для поиска определенного триггерного события. Если нажать на конкретное, то можно увидеть подробности. На этом экране также отображаются источник события, сведения о подтверждении и связанные события.
Icinga
В Icinga можно настроить систему оповещений с помощью Icinga Director в панели управления. Для этого необходимо настроить временные периоды. Они используются для определения интервала, в течение которого будет работать рассылка оповещений. Уведомления могут отправляться по электронной почте и/или в различные мессенджеры (например, Telegram).
Prometheus
В Prometheus необходимо установить Alertmanager. Это связано с тем, что оповещение с помощью Prometheus разделено на две части. Правила оповещения пересылают оповещения менеджеру. Затем он отправляет уведомления по электронной почте или другим платформам.

Alertmanager обрабатывает предупреждения, отправленные клиентскими приложениямиs. Он заботится об их дедупликации, группировке и маршрутизации к правильной интеграции получателя. Уведомления можно отправлять по электронной почте, через системы уведомлений по телефону и через чаты.
В Grafana также есть система оповещений. Уведомления могут отправляться по электронной почте и/или в различные мессенджеры (например, Slack или Telegram).
Сообщество
Zabbix
Большим преимуществом Zabbix является его сообщество и возможность получения знаний через множество каналов поддержки, включая систему поддержки, Telegram, Discord, Zabbix Forum, blog, социальные сети.
Полезные ссылки:
-
Документация Zabbix;
-
Форум Zabbix;
-
Блог Zabbix;
-
Телеграм каналы: русскоязычные ZabbixPro и @ZabbixJunior, англоязычный @ZabbixTech;
-
Инструкция, как установить и настроить Zabbix на CentOS;
-
Международное сообщество Discord;
-
YouTube канал Dmitry Lambert про Zabbix;
-
Интересная статья про конфигурацию Zabbix+Grafana.
Icinga
В Icinga также есть большое комьюнити, где можно найти информацию по надстройке новых модулей и задать вопросы.
Полезные ссылки:
-
Документация Icinga;
-
Форум Icinga;
-
Интеграции Icinga;
-
Настройка e-mail оповещений в Icinga;
-
Как настроить уведомления в Telegram от Icinga2;
-
Установка Icinga 2 на Debian.
Prometheus
Несмотря на то что Prometheus более молодой инструмент, чем Zabbix, здесь также сформировалось большое сообщество. Вот несколько полезных ссылок:
-
Документация Prometheus;
-
Статья: Prometheus, мониторинг в Soundcloud;
-
Форум Prometheus;
-
Отчет об экспериментах с Prometheus;
-
Роль Ansible для установки Prometheus;
-
Инструкция, как установить и настроить Prometheus на Ubuntu;
-
Prometheus канал в Slack;
-
Форум для обсуждений;
-
Интересная статья про введение в мониторинг серверов с помощью Prometheus и Grafana;
-
Инструкция, как установить Grafana на Ubuntu;
-
Настройка уведомлений в Telegram.
Суммируем
Zabbix
Zabbix – это ПО с открытым исходным кодом с бэкэндом C и интерфейсом PHP. Имеет распределенную архитектуру сервера и клиента, поэтому на каждой стороне клиента необходимо установить агент Zabbix для сбора и отправки данных на сервер. Если необходимо использовать MySQL, MariaDB, PostgreSQL, SQLite, Oracle или IBM DB2 для хранения данных, то этот инструмент хорошо подойдет для мониторинга. Есть встроенная функция оповещения, позволяющая управлять событиями различными способами: отправка сообщений, выполнение удаленных команд и т.д.
Icinga
Icinga имеет современный веб-интерфейс, дополнительные соединители для баз данных (MySQL, Oracle Database, PostgreSQL), REST API, позволяющее администраторам добавлять дополнения без внесения изменений в ядро Icinga.
Для настройки дополнительных функций в Icinga необходимо настраивать отдельные расширения, например как для рисования графиков, показывающих изменения в отслеживаемых системах. Веб-интерфейс Icinga в основном доступен только для чтения. Он показывает состояние серверов, но не может сравнивать серверы и генерировать данные.
Prometheus
У Prometheus открытый исходный код, а сам продукт бесплатен. Он считается более современным инструментом, который используют, когда требуется решение для мониторинга базы данных с временными показателями и нужно долговременное хранилище для метрик. Есть версия, которая включает хранение ваших данных в течение одного года, полную настройку панели управления Grafana для визуализации данных и многое другое.
Также Prometheus имеет поддержку от стороннего Node Exporter, который может помочь Prometheus извлечь различные аппаратные и связанные с ядром метрики. Инструмент имеет поддержку языка запросов PromQL.
Какие инструменты мониторинга IT-инфраструктуры вы используете? Поделитесь своим опытом.
If you’re here, you’re probably looking for something better (or at least different) than Zabbix. Maybe it’s too complex. Maybe it’s a nightmare to scale. Or maybe you just want a fresher take on monitoring that fits today’s cloud-native world.
Zabbix is a veteran in the monitoring space, but it isn’t for everyone. The good news? Plenty of alternatives exist—each with its strengths and trade-offs. Let’s dig into the best Zabbix alternatives, breaking them down by features, use cases, and why you might (or might not) want to pick them.
5 Common Challenges with Zabbix and Why You Might Consider Switching
Steep Learning Curve
Zabbix isn’t exactly plug-and-play. Setting it up requires time, expertise, and a willingness to navigate extensive documentation. If you’re new to it, expect a fair amount of trial and error before everything runs smoothly.
Scaling Can Be a Headache
While Zabbix supports distributed monitoring, scaling it efficiently requires careful planning. You’ll need to configure proxies, manage database performance, and optimize your setup to handle large environments. It’s doable—but far from seamless.
Limited Cloud-Native Support
Zabbix was designed for traditional IT infrastructure, and it shows. While you can extend it to monitor cloud-native workloads, it lacks native support for Kubernetes and modern microservices architectures. Integrating with dynamic cloud environments often requires workarounds or additional tooling.
A UI That Feels Stuck in the Past
Functionality is king, but let’s not ignore usability. Zabbix’s interface can feel clunky and outdated, making it harder for teams to quickly access the insights they need. A more intuitive, modern UI could significantly boost efficiency.
High Maintenance Overhead
Running Zabbix on-prem means ongoing upkeep. From database tuning to managing upgrades and ensuring high availability, maintaining a self-hosted setup demands time and dedicated resources. For lean teams, this can be a major drawback.
If any of these issues resonate with you, it might be time to explore other monitoring solutions that are better suited for today’s cloud-native, scalable, and user-friendly environments.
💡
If you’re also exploring alternatives to Datadog, check out our guide on 9 Datadog Alternatives for 2024 to find the best fit for your observability needs.
The Best 9 Zabbix Alternatives by Use Case
If Zabbix’s limitations are starting to slow you down, the good news is that plenty of alternatives cater to different monitoring needs.
If you’re looking for cloud-native observability, a simpler setup, or a more scalable option, here are some of the best monitoring solutions to consider.
1. Last9 – Best for Otel-Native Full-Stack Observability and High Cardinality
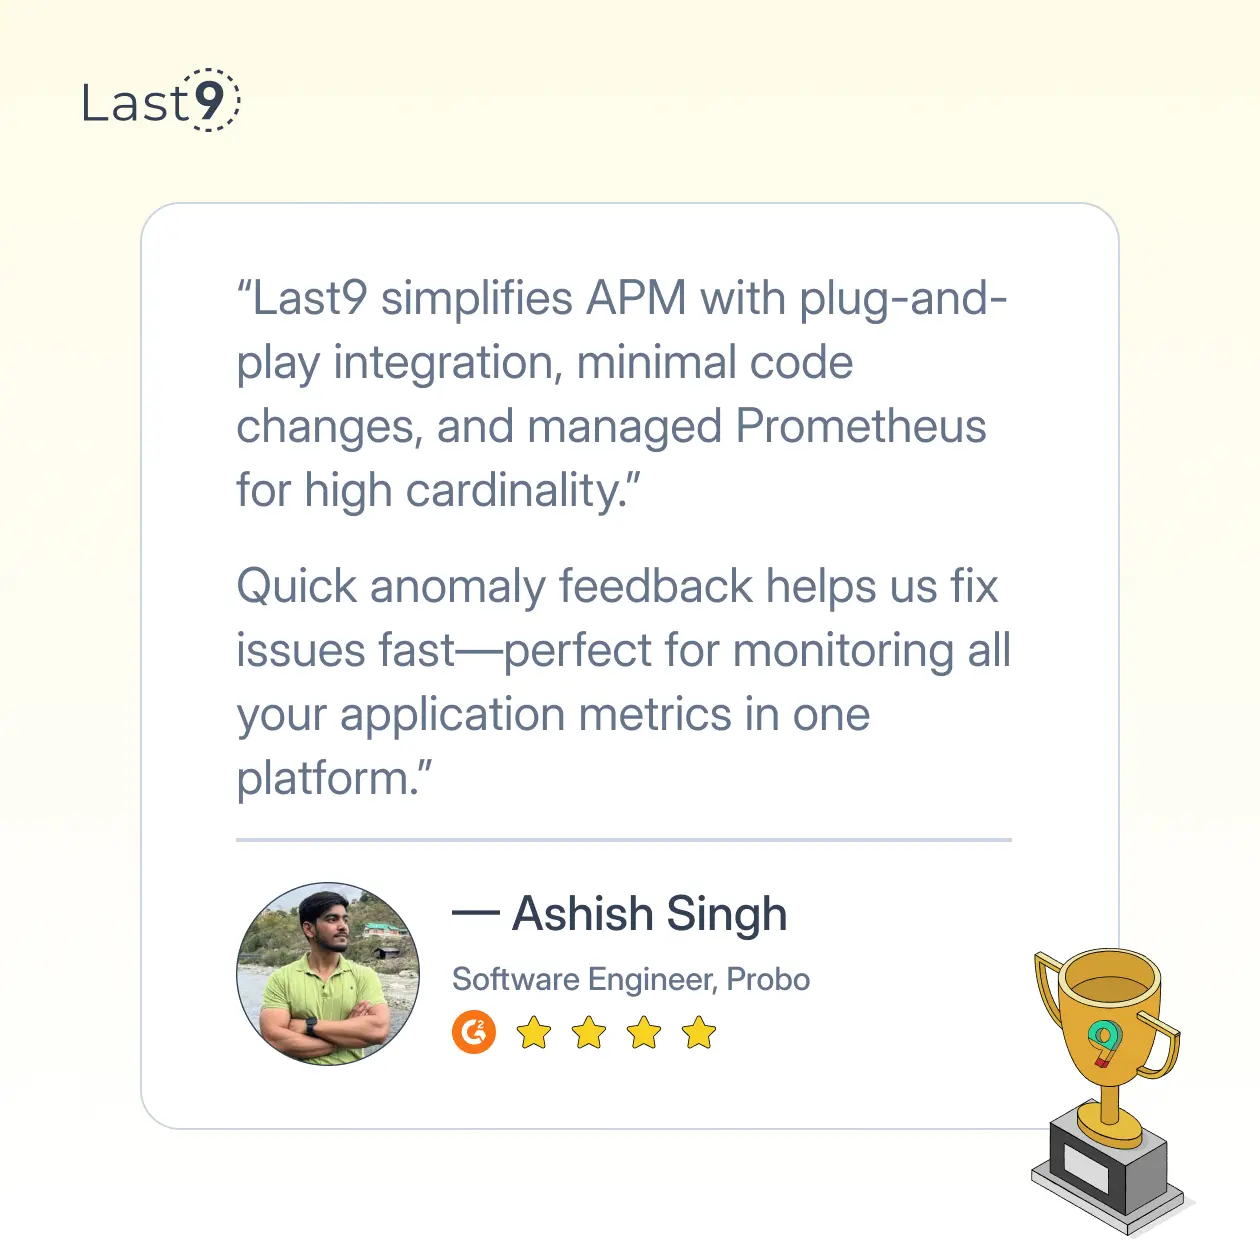
Last9 is a modern telemetry data platform built for high-cardinality observability at scale. Trusted by industry leaders like Disney+ Hotstar, CleverTap, Probo and Replit, it helps teams optimize performance, cost, and real-time insights.
What Sets Last9 Apart?
- Otel-native and vendor-neutral with seamless OpenTelemetry and Prometheus integration
- Fully managed solution with zero operational overhead
- Logs, metrics, and traces in one unified platform
- Interactive dashboards and AI-driven event correlation for faster troubleshooting
- Proven scalability, monitoring 11 of the 20 largest live-streaming events in history
If you’re looking for a cost-effective observability solution without compromising performance, give Last9 a try.
2. Prometheus – Best Open-Source Monitoring for Cloud-Native Environments
Prometheus is the default monitoring tool for Kubernetes and cloud-native applications. Maintained by the Cloud Native Computing Foundation (CNCF), it excels at handling time-series data and integrates seamlessly with Grafana for visualization.
Why choose Prometheus?
- Optimized for cloud-native environments – Uses a pull-based model, making it ideal for auto-scaling infrastructures.
- Highly flexible query language (PromQL) – Enables powerful real-time analytics and custom metrics exploration.
- Strong community support – A widely adopted open-source tool with continuous improvements and a vast ecosystem.
Challenges:
- No built-in UI like Zabbix; requires Grafana for visualizations.
- Managing long-term storage at scale can be complex.
3. Datadog – Best for Full-Stack Observability with AI-Driven Insights
Datadog is a fully managed observability platform that provides monitoring, logging, and security insights in one place. It’s particularly useful for teams that want an all-in-one solution without dealing with infrastructure maintenance.
Why choose Datadog?
- SaaS-based (zero maintenance) – No need to manage databases or monitoring agents manually.
- AI-driven anomaly detection – Identifies unusual patterns and alerts teams before issues escalate.
- Broad integrations – Supports AWS, Kubernetes, databases, and hundreds of other tools.
Challenges:
- Can become expensive as data ingestion increases.
- Might be overkill for small or simple deployments.
4. Nagios – Best for Traditional On-Premise Infrastructure Monitoring
Nagios is one of the oldest monitoring tools, known for its flexibility in tracking network devices, servers, and applications. It’s a strong alternative to Zabbix for organizations relying on legacy infrastructure.
Why choose Nagios?
- Extensive plugin ecosystem – Supports thousands of third-party plugins for different monitoring use cases.
- Reliable alerting system – Highly customizable notifications to prevent alert fatigue.
- Good for on-prem environments – Works well with traditional IT infrastructures.
Challenges:
- The UI feels outdated compared to modern monitoring tools.
- Setting up advanced monitoring can be complex.
5. New Relic – Best for Full-Stack Application Performance Monitoring
New Relic is built for developers and SREs looking to optimize application performance. It provides deep insights into application behavior, user experience, and infrastructure performance.
Why choose New Relic?
- End-to-end observability – Includes distributed tracing, real user monitoring (RUM), and synthetic testing.
- Strong cloud-native support – Works seamlessly with Kubernetes and serverless environments.
- Developer-friendly approach – Offers SDKs and APIs for custom instrumentation.
Challenges:
- Consumption-based pricing can be unpredictable.
- The UI has a steep learning curve for new users.
💡
If you’re considering alternatives to Prometheus, check out our guide on Prometheus Alternatives to explore scalable and efficient monitoring solutions.
6. Checkmk – Best for Enterprise IT Monitoring with Auto-Discovery
Checkmk is a highly scalable monitoring solution designed for enterprise IT infrastructures, providing a mix of agent-based and agentless monitoring.
Why choose Checkmk?
- Auto-discovery – Automatically detects devices, services, and dependencies.
- Great for large-scale monitoring – Can handle thousands of endpoints with efficient performance.
- Flexible deployment – Available as an open-source edition or enterprise version with additional features.
Challenges:
- Less suited for cloud-native workloads.
- The commercial version is needed for advanced capabilities.
7. VictoriaMetrics – Best for Scalable Time-Series Monitoring
VictoriaMetrics is an alternative to Prometheus for time-series monitoring, designed to handle large-scale environments with high-performance storage.
Why choose VictoriaMetrics?
- High scalability – Handles millions of active time-series efficiently.
- Optimized for long-term storage – Better compression rates compared to Prometheus.
- Compatible with PromQL – Works as a drop-in replacement for Prometheus.
Challenges:
- Smaller ecosystem compared to Prometheus.
- Requires additional tooling for dashboards and alerting.
8. InfluxDB – Best for High-Performance Time-Series Data Storage
InfluxDB is purpose-built for storing and querying time-series data, making it a strong choice for monitoring IoT devices, metrics, and real-time analytics.
Why choose InfluxDB?
- Fast, high-throughput writes – Ideal for high-frequency data collection.
- Built-in query language (Flux) – Designed specifically for time-series data manipulation.
- Scales horizontally – Can handle massive workloads efficiently.
Challenges:
- Less feature-rich compared to full observability platforms.
- Requires additional tools for visualization and alerting.
💡
Not sure whether Prometheus or InfluxDB is the right choice for your monitoring needs? Check out our in-depth comparison: Prometheus vs. InfluxDB.
9. Grafana Cloud – Best for Visualization-Driven Monitoring
Grafana Cloud is a managed observability platform that integrates Prometheus, Loki (logging), and Tempo (tracing) for a unified monitoring experience.
Why choose Grafana Cloud?
- Best-in-class dashboards – Highly customizable visualizations for metrics and logs.
- Unified observability stack – Combines metrics, logs, and traces in one platform.
- Managed Prometheus backend – Takes the hassle out of Prometheus storage and scaling.
Challenges:
- Primarily focused on visualization; depends on other tools for data collection.
- The free tier has limitations on data retention.
Which Zabbix Alternative is Right for You?
Choosing the right monitoring tool depends on your specific needs:
- If you want Otel-native full-stack observability, go with Last9.
- If you prefer open-source cloud-native monitoring, Prometheus is your best bet.
- For fully managed enterprise observability, Datadog and New Relic shine.
- If you need traditional on-prem monitoring, Nagios or Checkmk are solid choices.
- If you’re focused on scalable time-series monitoring, VictoriaMetrics and InfluxDB fit the bill.
- For best-in-class dashboards, Grafana Cloud/Last9 would be the right contenders.
Conclusion
Zabbix is powerful, but it’s not always the right fit. If you need something more modern, scalable, and easier to manage, Last9 is a great choice.
Built for hassle-free observability, Last9 unifies metrics, logs, and traces in a single platform, helping teams quickly identify issues, fine-tune alerts, and simplify troubleshooting.
Book sometime with us to know more or start your free trial today!
Frequently Asked Questions (FAQs)
1. Is Zabbix outdated?
Not necessarily, but it’s better suited for traditional infrastructure than modern, cloud-native systems.
2. What is the best Zabbix alternative for Kubernetes?
Prometheus is the best open-source choice, while Last9 and Datadog provide managed solutions.
3. Can I migrate from Zabbix to another tool easily?
It depends. Tools like Prometheus require a shift in approach, while managed platforms like Last9 or Datadog streamline migration.
4. Which alternative is the easiest to set up?
SaaS solutions like Last9, New Relic, and Datadog are easier to set up compared to self-hosted options.
5. What is the best free alternative to Zabbix?
Prometheus and Checkmk offer strong free options with open-source flexibility.
It isn’t often that you find a monitoring tool with the flexibility of a contortionist, collecting data from any source imaginable, allowing you to monitor pretty much anything.
Zabbix is a powerful, enterprise-level monitoring tool that does exactly that, giving you the peace of mind to sleep a little more like a baby and a little less like a sysadmin.
But is it the right tool for you? Sure, it’s a powerful tool, but Zabbix isn’t without flaws. The truth is that hosting Zabbix on your own as an open-source solution can be just as expensive, if not more expensive than a cloud-based solution.
The good news is that there are plenty of Zabbix alternatives to go around, and today, we’re going to dive deep into the best 15 so that you don’t have to.
Let’s start by understanding Zabbix a little better.
Zabbix Features
Zabbix is powerful in the sense that it can collect and store data from anywhere. That said, it’s really simple at its core. The idea is that it gives you exactly what you need to allow you to bend it to your application. Here’s what they offer:
- Metric collection
- Problem detection
- Alerting
- Data visualization
Zabbix Pricing
I know what you’re thinking, and yes, Zabbix is open-source and free. But, due to the complexity of setting up such a tool, Zabbix also offers a turnkey solution.
The turnkey solution comes with a lot of benefits like technical support, training, consulting, help with integrations, and a lot more. Essentially, you pay for their technical help to make the execution of Zabbix flawless.
The big kicker is the price that they charge for their solution. The turnkey package is $1,500 per day. You read that right. Per day.
The 15 Best Zabbix Alternatives in 2025
1. Better Stack
Better Stack offers a complete alternative to Zabbix, covering all essential aspects of synthetic monitoring. This includes checks for HTTPS keywords, Heartbeat, SSL, Ping, TLD, TCP/UDP, POP3/IMAP/SMTP, and DNS server monitoring.
We keep an eye on your website, checking it as often as every 30 seconds from various locations to avoid false alarms. Plus, you can set up location-specific checks to tackle issues related to different regions.
Better Stack seamlessly integrates with popular third-party tools and platforms like Heroku, Datadog, New Relic, Grafana On-Call, PagerDuty, Opsgenie, AWS CloudWatch, and Google Cloud.
Every incident is thoroughly documented with screenshots, error logs, incident timelines, post-mortems, and advanced escalation rules. Our on-call scheduling and integrations ensure quick responses. If there’s downtime, you can create custom status pages with unique designs for users to subscribe to.
One standout feature of Better Stack is the ability to run Playwright scripts. Simply copy and paste your script into the dashboard, and Better Stack can help monitor front-end transactions, too.
🌟Key features
- Incident management
- Log management
- Uptime monitoring
- API monitoring
➕Pros
- 30-second check frequency
- Able to run Playwright script
- On-call scheduling
- Built-in Status Pages
- Dozens of integrations
➖Cons
- Not a full-stack observability solution
💲Pricing
Better Stack Uptime offers a free basic monitoring and incident management package.
For more advanced features, our Uptime premium packages start at only $25 per month, providing 50 monitors, 5 status pages, and built-in incident management.
Additionally, our Logs premium packages, starting at $25 per month, include a 30GB allowance and 15 days of retention.
2. Prometheus
Prometheus is a cloud-native, open-source monitoring solution prioritizing data collection and analysis. Its integrated toolset empowers users to establish diverse monitoring capabilities effectively.
It is widely recognized for its infrastructure monitoring abilities, yet its utility extends beyond that scope. It serves various monitoring purposes, such as synthetic monitoring and application performance monitoring (APM).
What sets Prometheus apart and draws many users is its high level of customization and versatility, being an open-source tool. It effectively gathers and archives time-series data, associating it with timestamps. This feature enables users to monitor cloud-native environments like Kubernetes comprehensively and receive timely alerts in case of any issues.
Not a big fan of Prometheus? Check out some similar tools to Prometheus.
🌟Key features
- Open-source monitoring
➕Pros
- A large number of visualization tools
- Single web portal
- Easy integration with 3rd party tools
➖Cons
- The cost of self-hosting Prometheus can be expensive
- User reviews mention occasional complications with query
- Learning curve with PromQL
3. Datadog
Datadog is a top contender in any website monitoring category, thanks to its extensive feature set. However, it’s worth noting that its robust website monitoring capabilities come with a higher price tag, making it more suitable for larger enterprises.
Datadog allows for performance comparison within and outside your network firewall, alongside automation tools to streamline tasks. With these comprehensive monitoring options, users can effectively address issues and gain valuable insights into their websites and systems.
One of Datadog’s best features is its user-friendly interface, allowing users to create tests without any coding skills. Its web recorder enables interaction with websites just like a regular user, providing real-time results. In case of issues, Datadog offers detailed insights including screenshots, performance metrics, server traces, error logs, and more, facilitating efficient troubleshooting.
Not a big fan of Datadog? Check out some similar tools to Datadog.
🌟Key features
- Website monitoring
- Infrastructure monitoring
- Log management
- Synthetic monitoring
- Real User monitoring
➕Pros
- Hundreds of integrations
- 20+ individual solutions
- Full-stack observability
➖Cons
- Datadog is expensive and only suitable for giant corporations
💲Pricing
Datadog offers a wide range of solutions, too numerous to list comprehensively here. However, here are some key highlights to provide an idea of its pricing:
- Infrastructure monitoring: $15 per host per month.
- Synthetic monitoring: $5 for every 10,000 API runs and $12 for every 1,000 browser runs.
- Real user monitoring (RUM): $1.50 for every 1,000 sessions per month.
- Log management: $0.10 for every GB ingested and $1.70 for every million log events per month.
These prices give a glimpse into the cost structure of Datadog, which is known for its comprehensive solutions but comes with a corresponding expense.
4. Sematext
In contrast to Zabbix, Sematext adopts a unified approach, presenting a single-pane interface that facilitates seamless correlation of data across various metrics. This integration extends beyond infrastructure metrics to encompass application logs, events, real-user data, and synthetic performance metrics, empowering users with comprehensive insights and analysis capabilities.
With Infrastructure monitoring, users can comprehensively map their entire stack. Sematext’s numerous integrations enable the collection, reporting, and tracking of various metrics, providing a real-time view of infrastructure, whether on-premise or cloud-based.
Through its Synthetics feature, users access a diverse array of monitoring capabilities, including uptime and API monitoring from multiple locations, even within private networks and behind firewalls. It covers all layers of monitoring, from DNS and TCP to SSL and HTTP, offering customizable API monitoring and vigilance over SSL certificates, website performance, and end-to-end visibility.
🌟Key features
- Website monitoring
- Infrastructure monitoring
- Log management
- Synthetic monitoring
- Real user monitoring
➕Pros
- Price-per-monitor option
- Out-of-the-box dashboards
- Full-stack monitoring
➖Cons
- Configuring dashboards can be overwhelming
- Log monitoring is expensive per GB
- User reviews report occasional difficulties with user management
💲Pricing
Sematext has flexible pricing options, including a pay-as-you-go model where users tailor their subscriptions to meet their specific needs. In this model, Synthetics begins at $2 per monitor and $7 per Browser monitor.
Alternatively, Sematext offers standard subscription packages. The starter package for Synthetics is the Standard plan, starting at $29 per month. This plan includes a maximum of 40 HTTP monitors and 5 Browser monitors, with data retention for up to 30 days.
For Infrastructure monitoring, the cost starts at a very reasonable $3.60 per host, but it comes with a retention period of 7 days.
5. Signoz
Signoz is a versatile and comprehensive APM tool tailored for effectively monitoring applications, with a particular focus on APIs. Its distributed tracing capabilities enable users to visualize the entire journey of requests across various microservices, facilitating in-depth analysis of latency and performance bottlenecks.
One of Signoz’s best features is its ability to track latency metrics such as P95 and P99, providing valuable insights into the performance of individual service endpoints. By monitoring latency, users can identify and address slow endpoints, ensuring optimal performance and responsiveness for their applications. Additionally, Signoz integrates seamlessly with OpenTelemetry, simplifying the process of instrumenting applications and collecting telemetry data for monitoring and analysis.
Signoz offers robust error-tracking capabilities, allowing users to track and analyze errors and exceptions in their applications. With alerting and notification mechanisms, teams can set up alerts based on predefined thresholds and receive real-time notifications when performance issues occur.
🌟Key features
- Open-source monitoring
➕Pros
- Easy configuration
- Out-of-the-box dashboards
- Active online community
➖Cons
- The cost of self-hosting Signoz can be expensive
- Limited feature set
- Very few reviews online
6. Site 24×7
Site 24×7 is a solid Zabbix alternative with its cloud-based platform dedicated to monitoring websites and servers. Tailored for businesses of various sizes, from small startups to large enterprises, it offers a comprehensive suite of monitoring tools.
Powered by AI, Site 24×7 provides an intuitive and efficient solution for website monitoring, covering essential aspects such as uptime, performance, and user experience. Its capabilities extend to server monitoring, allowing users to keep a close eye on server health, resource usage, and network performance.
Site 24×7 offers a range of features beyond basic monitoring, including customizable alerting, trend analysis, and reporting functionalities. With its user-friendly interface and scalability, Site 24×7 empowers businesses to effectively manage their online presence and ensure optimal performance and reliability.
Not a big fan of Site 24×7? Check out some similar tools to Site 24×7.
🌟Key features
- Website monitoring
- Real user monitoring
- Synthetic monitoring
- Server monitoring
➕Pros
- Simple and reliable
➖Cons
- Limited feature set
- User reviews mention some technical restrictions
- User reviews mention a cluttered UI that’s hard to use
💲Pricing
Site24x7 offers a range of pricing options tailored to different monitoring needs, though the structure may initially appear complex. For website monitoring, plans start at $9 per month, providing basic uptime monitors, while the enterprise plan, priced at $225 per month, includes synthetic monitors, network monitors, and more.
Similarly, infrastructure monitoring begins at $9 per month, but with limitations such as only 10 monitors and 500MB of log data for the entire month. Additional infrastructure monitors cost $15 per month for every 10 monitors, and every 10GB of log data incurs an extra $10 charge.
For APM, plans start at $35 per month, but like other plans, come with various add-ons that can affect the final cost. The same applies to MSP plans, which start at $45 per month but can quickly escalate with add-ons.
Their all-in-one solution combines all tools into one package, starting at $45 per month. However, expenses can mount swiftly with additional add-ons, so users should carefully consider their requirements before opting for additional features.
7. Splunk
Splunk has made waves with its recent acquisition for a staggering $28 billion, solidifying its position as a dominant force in website monitoring. Boasting true full-stack observability and integrated security features, Splunk distinguishes itself in the competitive landscape.
As an all-encompassing solution, Splunk promises to address threats, reduce downtime, and expedite issue resolution, catering to organizations seeking comprehensive monitoring solutions. Its resilience and rich feature set make it a valuable asset for businesses of all sizes.
What truly sets Splunk apart, and likely justifies its premium price tag, is its expansive network. With over 2,200 partners across various industries, Splunk ensures users can fully utilize the platform’s capabilities. Furthermore, with a community of over 18,000 active members and 1,800 Splunk experts, users have access to robust support for problem-solving, architecture, deployment, and scalability.
Not a big fan of Splunk? Check out some similar tools to Splunk.
🌟Key features
- Website monitoring
- Infrastructure monitoring
- Synthetic monitoring
- Real user monitoring
➕Pros
- All-in-one observability and security tool
- Helpful network of experts
➖Cons
- Splunk is expensive and only suited for large corporations
- User reviews mention a learning curve and intense resource consumption
💲Pricing
Splunk’s pricing structure can be opaque, as only a few of their solutions display prices online, often requiring some digging within their website. The listed prices primarily pertain to their cloud observability offerings:
- End-to-End: $75 per host per month
- App & Infra: $60 per host per month
- APM: $55 per host per month
- Infrastructure: $15 per host per month
- RUM: $14 per 10,000 sessions
- Synthetics: $1 per 10,000 uptime requests
- On-call: $5 per user per month
While these figures provide some insight into Splunk’s pricing, the overall structure and details may require further exploration or contacting the company directly for a comprehensive understanding.
Dotcom-monitor is a top-tier alternative to Prometheus, especially if you’re looking for API monitoring. With Dotcom Monitor’s Web API monitoring service, users can effectively monitor the performance and uptime of various web services, including SOAP, REST, JSON, and XML. Moreover, Dotcom-monitor offers integration with Postman, simplifying internal API testing through shared public links to the Dotcom-monitor platform.
Dotcom-monitor’s API monitoring solution is both straightforward and highly efficient. It allows users to monitor from 30 global locations and set up multi-step API calls to validate complex API sequences, ensuring thorough monitoring coverage across different scenarios.
🌟Key features
- Infrastructure monitoring
- Web application monitoring
- API monitoring
➕Pros
- Clean dashboards
- Real-time data
- Multi-location testing
➖Cons
- The price per monitor is expensive
- User reviews mention some difficulties in setting up complex workflows
- User reviews mention occasional reporting complexities
💲Pricing
Dotcom-Monitor offers Web API monitoring within its Web Services package, beginning at $19.95 per month. Pricing is flexible, depending on the check frequency and task frequency chosen by the user. The Premium package includes 5-minute checks, while the Platinum package offers more frequent 1-minute checks.
This variability in pricing options allows users to select the package that best suits their monitoring needs and budget, although they don’t go into too much detail online with their prices.
9. Sumo Logic
Sumo Logic is a very viable alternative to Zabbix, particularly catering to large corporations, yet it also offers notable infrastructure monitoring capabilities. One distinguishing feature of Sumo Logic is its implementation of cloud-based machine learning, which proves invaluable in handling vast amounts of data simultaneously, making it particularly advantageous for large enterprises.
What sets Sumo Logic apart from Zabbix and other alternatives is its emphasis on end-to-end monitoring. Beyond basic infrastructure monitoring, Sumo Logic offers features such as root cause analysis, anomaly detection, and pre-set alerts. This comprehensive approach enables organizations to gain deeper insights into their systems’ performance and address issues proactively.
Not a big fan of Sumo Logic? Check out some similar tools to Sumo Logic.
🌟Key Features
- Infrastructure monitoring
- Log management
- Application observability
- AWS monitoring
- Kubernetes monitoring
➕Pros
- Powerful. Full-stack monitoring
- Offers security tools
- Out-of-the-box dashboards
- Pre-set alert rules
➖Cons
- Sumo Logic is expensive and only suited for large corporations
- User reviews mention a learning curve
💲Pricing
Seeing as Sumo Logic is an industry giant, you would expect more pricing transparency. The reality is that they only offer some prices online, and force you to contact sales for the rest.
Really the only prices they offer are for logs. They offer a few iterations of logs, like logs for monitoring and troubleshooting AWS, Kubernetes, etc, but they all start at $3/GB.
For more details on infrastructure monitoring, you’ll have to reach out to their sales team.
10. Dynatrace
Dynatrace is a great alternative to Zabbix, particularly for enterprises seeking comprehensive observability solutions. Despite its higher cost, Dynatrace streamlines the monitoring process with its intuitive interface and automated capabilities, reducing IT team workload compared to Prometheus.
With extensive out-of-the-box functionality including advanced AI-powered analytics and automatic problem detection, Dynatrace offers swift insights into systems without requiring extensive manual setup, unlike Prometheus. Its scalability and global test locations make it ideal for businesses operating at scale or across multiple regions, solidifying its position as a robust alternative to Prometheus.
In essence, Dynatrace not only excels in API monitoring but also serves as a powerful solution for enterprises, providing the tools needed for effective system monitoring, troubleshooting, and optimization.
Not a big fan of Dynatrace? Check out some similar tools to Dynatrace.
🌟Key features
- Website monitoring
- Infrastructure monitoring
- Synthetic monitoring
- Real user monitoring
- Log management
➕Pros
- Utilizes AI
- Feature-rich
- Powerful alerting capabilities
➖Cons
- Dynatrace is expensive and only suited for large corporations
- User reviews mention difficulties with the debugging tool
- User reviews mention difficulties with data collection
💲Pricing
Dynatrace’s pricing model is based on data consumption rather than a fixed fee per monitor or host. For example, synthetic monitoring charges are determined by the number of synthetic requests, while infrastructure monitoring is billed per hour per host.
At first glance, the cost of $0.001 per request may seem insignificant. However, when scaled up, it can become relatively expensive. For instance, running checks at 2-minute intervals from a single location results in 30 requests per hour, totaling 720 requests daily and 21,600 requests monthly. At $0.001 per request, this amounts to $21.6 per monitor, making it even more costly with shorter check frequencies.
Similarly, infrastructure monitoring at $0.04 per hour per host may appear reasonable initially. However, with 24 hours in a day and 30 days in a month, this translates to $28.80 per month per host, which can add up quickly for organizations managing multiple hosts.
11. Graphite
Graphite, an open-source system, comprises three core components: Graphite for rendering graphs, Carbon for listening to time series data, and Whisper for data storage. While Graphite’s UI may lack sophistication, it seamlessly integrates with Grafana for enhanced visualizations.
It’s essential to understand that Graphite isn’t a data collection tool; applications must be configured to send data to it. Carbon then listens for this data and forwards it to Whisper for storage in time series format on the filesystem.
Despite its UI limitations, this collaborative open-source system offers valuable insights into various applications, processes, and services, including APIs, making it a comparable alternative to Prometheus.
🌟Key features
- Open-source monitoring
➕Pros
- Simple metric storage
➖Cons
- The cost of self-hosting Graphite can be expensive
- Apps need to be configured before sending data to Graphite
- Needs a Grafana integration for better visualizations
12. New Relic
There’s no getting around it, New Relic is a giant in the observability space, renowned for its comprehensive array of features and capabilities. While its offerings are extensive, it’s worth noting that such excellence comes at a premium price.
A few years ago, New Relic was bought for $6.5 billion and went private. With a price tag like that, it’s very clear that this is a platform designed specifically for large corporations, and not so much for small to medium-sized businesses.
New Relic is very well known for its performance and infrastructure monitoring capabilities, but it’s well suited for monitoring anything in your stack.
Not a big fan of New Relic? Check out some similar tools to New Relic.
🌟Key features
- Website monitoring
- Infrastructure monitoring
- Synthetic monitoring
- Real user monitoring
- Log management
➕Pros
- Lightweight
- Dynamic reporting
- Every integration you can imagine
➖Cons
- New Relic is expensive and only suited for large corporations
- User reviews report occasionally receiving inaccurate data
- User reviews report the platform being overwhelming
💲Pricing
Despite New Relic’s claim of having a transparent pricing structure, understanding the actual costs can be challenging for users. Rather than a straightforward upfront cost, users often need to engage with the sales team or perform calculations to determine their total expenses.
New Relic’s free option includes full access for one user and up to 100GB of data. However, exceeding these limits triggers a pay-as-you-go model, with an additional charge of $0.25 per gigabyte of data beyond the initial 100GB. Moreover, exceeding 1,000 incident events per month incurs a charge of $0.50 per event.
Their pricing also involves per-seat charges, where users pay based on the level of access and features. Basic users are included for free but have limitations, while Core users cost $49 per seat per month, and full platform access starts at $99 per seat per month, potentially reaching up to $658 per seat per month.
This tiered approach offers flexibility but can lead to varying costs that may not align with every organization’s budget or needs, making it less straightforward than initially perceived.
13. ManageEngine Applications Manager
ManageEngine Applications Manager (MAM) prides itself on simplifying application performance monitoring. It offers comprehensive insights into the user experience and performance of critical applications and infrastructure components.
MAM enables quick identification and resolution of performance-related issues across the entire stack, from URLs to specific lines of code. With its deep APM capabilities, users can monitor database operations, identify slow SQL statements, and streamline debugging in microservice environments through distributed tracing.
Moreover, MAM facilitates the identification of bottlenecks in the code stack through code profiling and provides automated service maps for visualizing dependencies in app architecture. Essentially, MAM is a dedicated tool for transaction monitoring, ensuring optimal performance and reliability.
🌟Key features
- Website monitoring
- Infrastructure monitoring
- APM
- Synthetic monitoring
- Transaction monitoring
➕Pros
- Intuitive UI
- Powerful APM solution
- Real-time diagnostics
➖Cons
- They do not list any prices online
- User reviews mention issues with creating maps and dashboards
- User reviews mention UI response issues
💲Pricing
ManageEngine Applications Manager has made a critical mistake in the SaaS industry by removing all pricing information from its website. In today’s market, transparency in pricing is crucial, yet ManageEngine requires potential customers to contact them for a quote, adding unnecessary friction by mandating the completion of a form.
This lack of upfront pricing accessibility can deter potential buyers, as pricing is often a key factor in purchasing decisions.
14. AppDynamics
Offering an all-in-one solution, AppDynamics integrates synthetic monitoring with Real User Monitoring (RUM), Infrastructure monitoring, and security monitoring. While it can be used individually, maximum value (albeit at a higher cost) is achieved by leveraging multiple solutions for enhanced data correlation.
AppDynamics is renowned as an Application Performance Monitoring (APM) tool, but it also excels in infrastructure monitoring, similar to Zabbix. While not open-source, it offers users the ability to ingest both structured and unstructured data, providing real-time visibility into cloud, virtual, and physical infrastructures.
A compelling alternative to Zabbix, AppDynamics boasts multi-cloud capabilities within its cloud platform. Leveraging AIOps-focused alerts and notifications, it delivers comprehensive insights into application performance, IT infrastructure, and cloud-based services through user-friendly interfaces.
🌟Key features
- Website monitoring
- Infrastructure monitoring
- APM
- Synthetic monitoring
- Real user monitoring
➕Pros
- Clean UI
- Code-level profiling
- Full-stack observability
- Actionable dashboards and reports
➖Cons
- AppDynamics is expensive and only suited for large corporations
- User reviews mention issues with log parsing
- User reviews mention the need for third-party tools for some scenarios
💲Pricing
AppDynamics’ pricing structure may initially appear straightforward but can become complex if users are not fully acquainted with their system. The pricing primarily depends on the number of CPU cores utilized, except Real User Monitoring, which follows a different pricing model.
Infrastructure Monitoring Edition is priced at $6 per CPU core and encompasses infrastructure monitoring exclusively. The Premium Edition, costing $33 per CPU core, extends to infrastructure, application performance, and database monitoring. The Enterprise Edition, priced at $50 per CPU core, includes all features of the Premium Edition plus business performance monitoring. Lastly, the Enterprise Edition for SAP, priced at $95 per CPU core, incorporates infrastructure monitoring, business performance monitoring, and SAP monitoring functionalities.
15. Nagios
Since its inception in 1999, Nagios has established itself as a top choice for open-source website monitoring, earning recognition as a comprehensive monitoring solution for all critical infrastructure components, and even integrating with some of the leaders in the website monitoring industry.
From applications and networks to databases, operating systems, and servers, Nagios is capable of monitoring various vital aspects of any infrastructure. Its implementation of multiple APIs facilitates seamless integration with both in-house and third-party applications. Moreover, the extensive collection of community-developed add-ons offers virtually limitless possibilities for extending monitoring and alerting functionalities.
🌟Key features
- Open-source monitoring
➕Pros
- Highly efficient data collection
- Flexible and configurable
- Easy-to-use GUI
➖Cons
- The cost of self-hosting Nagios can be expensive
- User reviews mention occasional difficulties with installing plugins
The 15 Best Zabbix Alternatives Comparison
| Tool | Best for | Price |
|---|---|---|
| Better Stack | Synthetic monitoring, Uptime monitoring, API monitoring, Log management, Incident management | Starts at $25 per month for 50 monitors |
| Prometheus | Open-source website monitoring | Free to use, but the cost of ownership can be expensive |
| Datadog | Infrastructure monitoring, Log management, Real user monitoring, + a lot more | $5 for every 10,000 API runs and $12 for every 1,000 browser runs. Infrastructure monitoring starts at $15/host |
| Sematext | Synthetic monitoring, Real user monitoring, Infrastructure monitoring, Log management | Starts at $2 per HTTP monitor and $7 per browser monitor. Infrastructure monitoring starts at $3.60/host per month |
| Signoz | Open-source website monitoring | Free to use, but the cost of ownership can be expensive |
| Site 24×7 | Website monitoring, Server monitoring, Synthetic monitoring, Real user monitoring | Website monitoring starts at $9/month but is extremely limited |
| Splunk | Infrastructure monitoring, Log management, Real user monitoring, + a lot more | $1 per 10,000 uptime requests for synthetics, and infrastructure starts at $15/host per month |
| Dotcom-monitor | API monitoring, Infrastructure monitoring, Web application monitoring | Starts at $29.99/month |
| Sumo Logic | Infrastructure monitoring, Log management, Application observability, AWS monitoring, Kubernetes monitoring | Must contact sales |
| Dynatrace | Synthetic monitoring, Transaction monitoring, Real user monitoring, Infrastructure monitoring, Log management | Prices are based on data usage. Based on 2-minute check intervals, the price per synthetic monitor would be $21.60/month, while the price per infrastructure monitor would be about $28.80/host per month. |
| Graphite | Open-source website monitoring | Free to use, but the cost of ownership can be expensive |
| New Relic | Website monitoring, Infrastructure monitoring, Synthetic monitoring, Real user monitoring, Log management | 100GB allowance, but charges per seat (expensive) |
| ManageEngine Applications Manager | Synthetic monitoring, APM, Infrastructure monitoring | Must contact sales |
| AppDynamics | Synthetic monitoring, Real user monitoring, APM, Infrastructure monitoring | Basic infrastructure monitoring starts at $6 per CPU core |
| Nagios | Open-source website monitoring | Free to use, but the cost of ownership can be expensive |
Conclusion
While we included a few open-source options in this list for diversity, we didn’t overwhelm it with such choices. The primary reason users seek Zabbix alternatives is often the overhead cost associated with running an open-source tool.
In reality, numerous alternatives to Zabbix exist, each with its own advantages and drawbacks. Selecting the right tool depends on individual needs and preferences.
It’s crucial to invest time in research and carefully consider options. This list can serve as a helpful reference whenever questions arise during your decision-making process.
With his laptop as a sword and coffee machine as a shield, Zach is a content strategist here at Better Stack. When he’s not wordsmithing, he’s putting together PCs, working on cars, or scheming about how to own a zoo one day.
Got an article suggestion?
Let us know
Explore more
10 Best New Relic Alternatives in 2025
There are many alternatives to New Relic’s APM offering a better, less complicated and more reliable solution to application monitoring.
10 Best Datadog Alternatives to Consider in 2025
Datadog is one of the most potent and versatile players on the market, but they have their fair share of downsides. The monitoring and observability space is quite competitive, so we will discuss 10 of the best Datadog alternatives and compare their pros and cons to determine which is better suited for your needs.
10 Site24x7 Alternatives in 2025
Site24x7 offers a good solution, but not the best. There are many tools that top its functions or pricing.
10 Best Splunk Alternatives to Consider in 2025
Splunk is one of the best-known observability and SIEM tools in the software industry, but it isn’t suitable for all organizations. This article examines 10 alternatives for log management, observability, and application monitoring.
10 Best Sumo Logic Alternatives in 2025
Sumo Logic offers a good Log Management Solution, but there are a lot of solutions offering better functionality, documentation, and more features.
This work is licensed under a Creative Commons Attribution-NonCommercial-ShareAlike 4.0 International License.
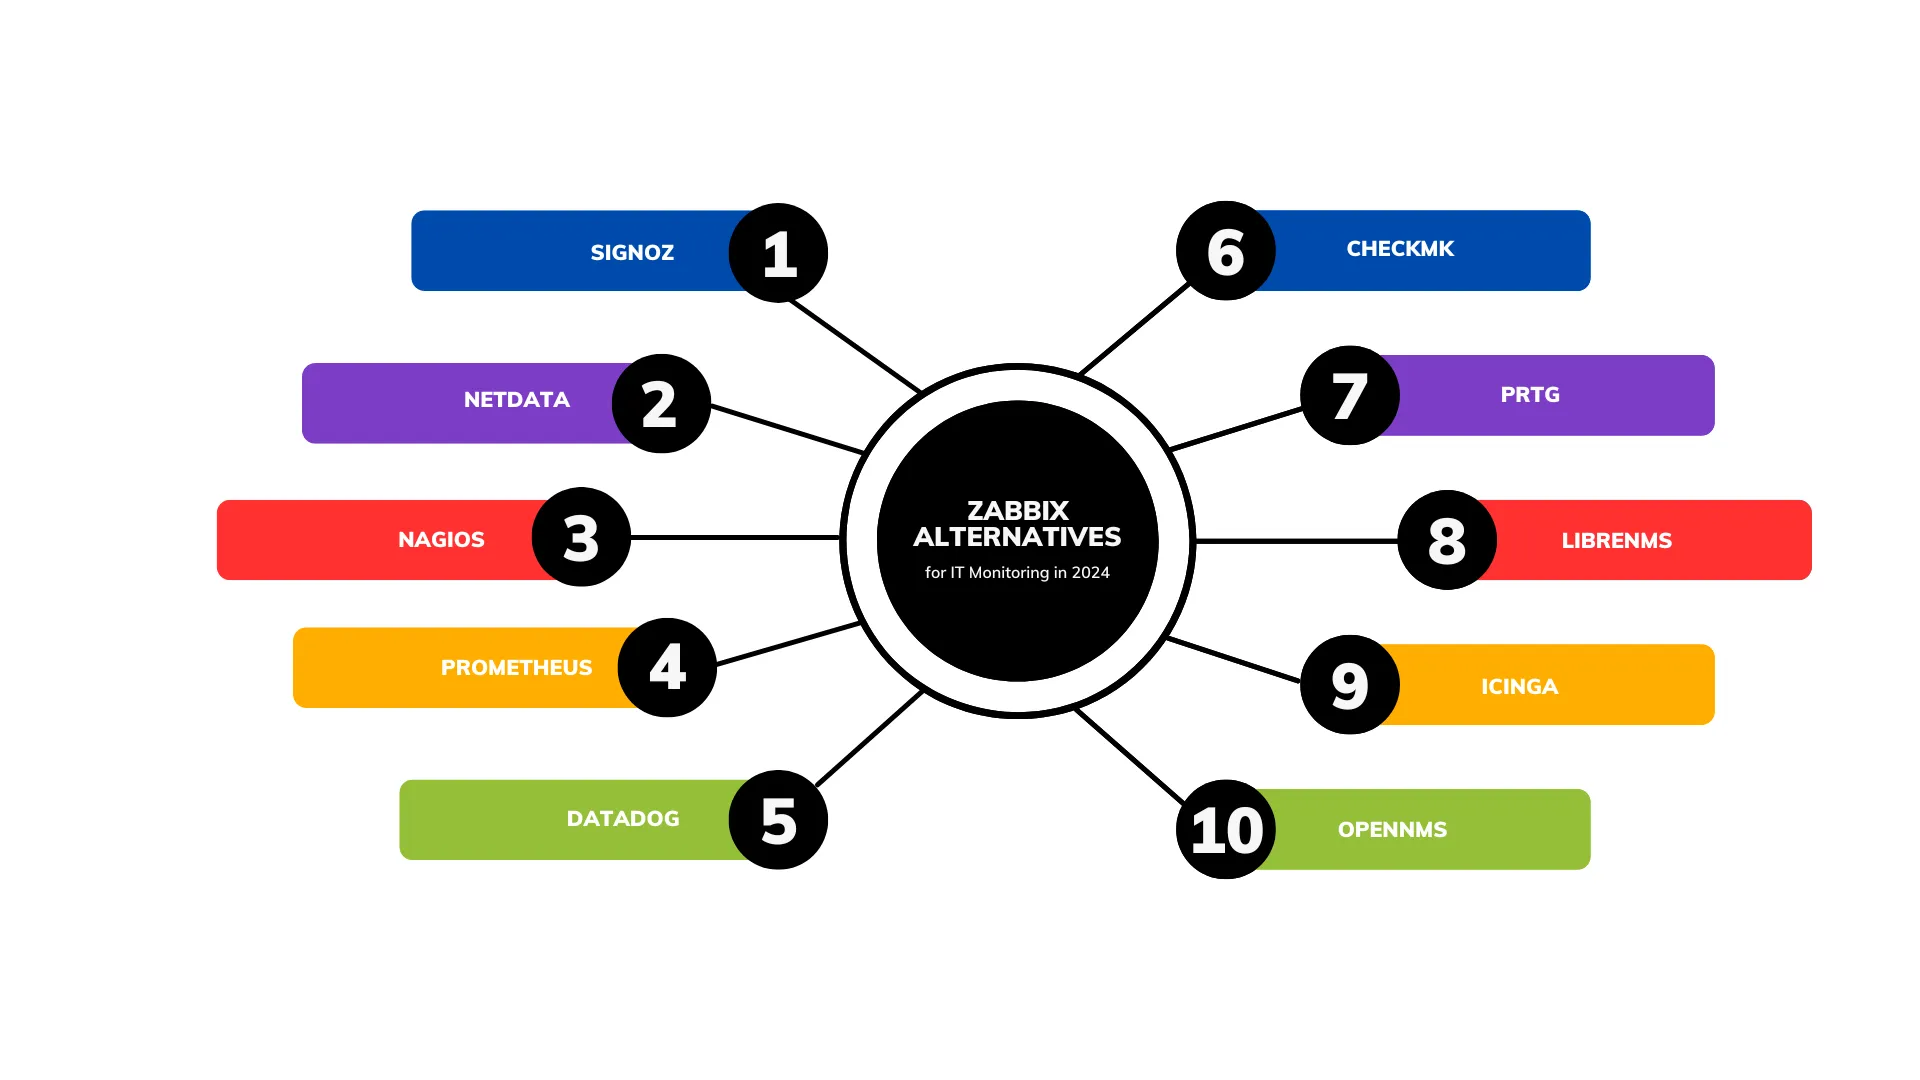
In the ever-evolving landscape of IT infrastructure, effective monitoring is crucial for maintaining system health and performance. While Zabbix has long been a popular choice for many organizations due to its flexibility, its complexity and scalability challenges have led many to seek alternatives. This article explores the top 10 Zabbix alternatives for IT monitoring in 2024, helping you find a solution that best fits your organization’s needs.
Understanding Zabbix and the Need for Alternatives
What is Zabbix?
Zabbix is a comprehensive open-source monitoring software that tracks the performance and availability of networks, servers, and applications. Since its initial release in 2001, Zabbix has become a go-to solution for Infrastructure and DevOps teams, with over 500,000 installations worldwide.
Key Features of Zabbix
Zabbix is known for its versatility and robust feature set, enabling it to monitor a wide array of systems, including:
- Wide Monitoring Range: Tracks servers, VMs, containers, cloud services, and network devices using various protocols. Prometheus is Ideal for cloud-native environments with extensive support for Kubernetes.
- Custom Alerts: Notifies via email, SMS, Slack, and more, with highly customizable alerts. Nagios offers robust, highly customizable alerting across various channels.
- Flexible Data Collection: Captures metrics from diverse sources, including custom apps and log files. Datadog excels in integrating with over 500 technologies for unified monitoring.
- Customizable Interface: Provides a web-based interface for viewing metrics, dashboards, and reports. Grafana provides highly customizable, interactive dashboards for diverse data sources.
Why Consider Alternatives?
While Zabbix is powerful and flexible, it presents several challenges that may lead organizations to explore alternatives:
- Steep Learning Curve: Zabbix’s complexity can make it difficult for new users to get up to speed quickly.
- Complex Configuration: Setting up and maintaining Zabbix requires significant effort and expertise.
- Scalability Issues: As infrastructure grows, Zabbix may struggle to scale efficiently, potentially leading to performance bottlenecks.
- Resource Intensity: Zabbix can be resource-intensive, demanding considerable system resources to operate effectively.
Criteria for Evaluating Zabbix Alternatives
Zabbix is powerful but can be challenging to manage, especially as your infrastructure grows. When exploring alternatives, focus on these key factors:
- Ease of Setup: Zabbix’s complex setup can be time-consuming. Look for alternatives that offer a quicker, more intuitive deployment process to get your monitoring up and running faster.
- Scalability: As your infrastructure expands, Zabbix might need help to keep up. Consider alternatives that scale seamlessly with your needs, ensuring consistent performance without manual intervention.
- Customization: While Zabbix is flexible, it often requires significant effort to tailor. Seek out solutions that offer simpler customization options to meet your specific requirements with less hassle.
- Integration: Zabbix might not always integrate smoothly with your existing tools. Evaluate how well alternatives connect with your current systems, enhancing workflow efficiency.
- Cost-Effectiveness: Although Zabbix is open-source, managing it can be resource-intensive. Alternatives that reduce operational overhead or offer cloud-based options could prove more cost-effective in the long run.
Migrating from Zabbix: A Simplified Guide
- Assess needs and choose an alternative: Evaluate Zabbix’s shortcomings and find a suitable replacement.
- Plan data migration: Inventory existing data and develop a transfer strategy.
- Configure and set up: Configure the new solution and define monitoring items.
- Migrate data: Transfer data from Zabbix to the new solution.
- Parallel monitoring: Run both tools for comparison.
- Cutoff and transition: Choose a cutoff date, disable Zabbix, and provide support.
- Ongoing monitoring and optimization: Monitor performance, optimize configuration, and stay updated
Top 10 Zabbix Alternatives for 2024
1. SigNoz: A Modern Alternative for Application Monitoring
SigNoz offers a fresh perspective on application performance monitoring (APM), catering to the demands of modern, distributed systems. As an open-source tool built on OpenTelemetry, it provides a unified platform for collecting, analyzing, and visualizing metrics, traces, and logs.
Key Features:
- Open-Source: Built on OpenTelemetry for standardized observability.
- Distributed Tracing: Tracks requests across complex systems.
- Unified Interface: Combines metrics, traces, and logs for holistic monitoring.
- User-Friendly: Simple interface for quick issue identification.
- Real-Time Monitoring: Instantly visualize system performance.
- Customizable Dashboards: User-friendly interface with customizable options.
- Comprehensive Monitoring: Powerful observability in one platform.
- Future-Proof: OpenTelemetry integration ensures compatibility.
Comparison with Zabbix:
- Ease of Use: SigNoz is generally easier to set up and use than Zabbix.
- Real-Time Monitoring: Both tools offer real-time monitoring, but SigNoz provides a more unified interface for monitoring metrics, logs, and traces.
- APM: SigNoz has stronger APM capabilities, which Zabbix lacks.
Signoz stands out for its ease of use and comprehensive monitoring, making it an excellent choice for cloud-native environments.
2. Netdata
Netdata is a powerful, open-source monitoring solution designed for real-time insights and ease of use. It’s lightweight, making it perfect for organizations that need instant visibility with minimal system impact.
Key Features:
- Real-Time Monitoring: Instantly visualize system performance.
- Lightweight Agent: Minimal overhead on your system resources.
- Extensive Metrics: Auto-discovers and monitors services with ease.
- Custom Dashboards: User-friendly interface with customizable options.
Comparison with Zabbix:
- Ease of Use: More user-friendly with real-time monitoring, compared to Zabbix’s complexity.
- Customization: Zabbix offers more customization options.
- Scalability: Zabbix handles larger deployments better.
Netdata is ideal for organizations seeking quick, low-friction monitoring without the complexity. Its real-time insights make troubleshooting swift and effective.
3. Nagios
Nagios is a veteran in the IT monitoring space, offering a mature and widely adopted platform for infrastructure monitoring.
Key features:
- Extensive plugin ecosystem: Offers a wide range of plugins for monitoring various systems and applications.
- Flexible alerting and notification: Allows customization of alerts and notifications based on specific needs.
- Robust support for both agent-based and agentless monitoring: Provides flexibility in deployment options.
- Strong community and documentation: Offers a wealth of resources for users.
Comparison with Zabbix:
- Ease of Use: Zabbix is easier for new users, and Nagios has a steeper learning curve.
- Customization: Both are highly customizable, with Nagios relying on plugins.
- Scalability: Zabbix generally scales better in modern environments.
While Nagios can be complex to set up, its vast ecosystem of plugins and add-ons makes it highly adaptable to diverse monitoring needs. It’s particularly well-suited for organizations with complex, heterogeneous environments that require extensive customization.
4. Prometheus
Prometheus has gained significant traction as a modern, open-source monitoring and alerting toolkit, especially in cloud-native environments.
Key features:
- Time-series database: Stores and manages time-stamped data for efficient analysis.
- PromQL: Offers a powerful query language for flexible data exploration and aggregation.
- Pull-based architecture: Ensures reliable data collection and reduces dependency on target systems.
- Integration with Grafana: Provides seamless visualization and exploration of metrics.
Comparison with Zabbix:
- Ease of Use: Zabbix is simpler to set up, but Prometheus is more powerful for cloud-native applications.
- Customization: Prometheus offers more flexibility with its query language.
- Scalability: Both scale well, but Prometheus excels in dynamic environments.
Prometheus excels in dynamic environments, such as those using containerization and microservices. Its dimensional data model and powerful query language make it ideal for organizations that need deep insights into their application and infrastructure metrics.
5. Datadog
Datadog offers a comprehensive, cloud-based monitoring and analytics platform that covers the entire IT stack.
Key features:
- Unified monitoring: Offers a comprehensive view of your entire IT stack.
- Machine learning-powered anomaly detection: Proactively identifies potential issues.
- Extensive integrations: Connects with a wide range of cloud services and tools.
- Real-time collaboration: Facilitates teamwork and incident response.
Comparison with Zabbix:
- Ease of Use: Datadog is easier to use with a cloud-based, all-in-one solution.
- Customization: Zabbix offers more customization for on-premises setups.
- Scalability: Datadog scales effortlessly with its SaaS model, while Zabbix is better for on-premise.
Datadog’s strength lies in its ability to provide a holistic view of complex, distributed systems. Its SaaS model eliminates the need for infrastructure management, making it an attractive option for organizations looking for a scalable, low-maintenance solution.
6. Checkmk
Checkmk combines the best of both worlds: the flexibility of open-source with the polish of a commercial product.
Key Features:
- Hybrid monitoring: Supports both agent-based and agentless monitoring methods.
- Automated service discovery: Automatically identifies and configures monitored systems.
- Event correlation and root cause analysis: Helps pinpoint the root cause of issues.
- Flexible reporting and dashboarding: Provides customizable visualizations for data analysis.
Comparison with Zabbix:
- Ease of Use: Easier to set up than Zabbix, with automated discovery.
- Customization: Zabbix offers more advanced customization.
- Scalability: Both tools scale well, with Zabbix being more adaptable.
Checkmk’s automated discovery and configuration features make it easier to set up and maintain than traditional open-source alternatives. It’s well-suited for organizations that want the control of an on-premises solution with the ease of use typically associated with cloud services.
7. PRTG Network Monitor
PRTG offers an all-in-one solution for network, server, and application monitoring with a focus on ease of use.
Key Features:
- Intuitive interface: Easy-to-use platform with drag-and-drop customization.
- Comprehensive sensor library: Covers a wide range of monitoring scenarios.
- On-premises and cloud deployment: Adapts to different organizational needs.
- Mobile apps: Enables remote monitoring and management.
Comparison with Zabbix:
- Ease of Use: More user-friendly than Zabbix, especially for beginners.
- Customization: Zabbix offers more in-depth customization.
- Scalability: PRTG is easier to scale but can become costly, whereas Zabbix is more cost-effective.
PRTG’s strength lies in its user-friendly approach to monitoring complex IT environments. Its pre-configured sensors and templates make it quick to set up, while still offering depth for advanced users. It’s an excellent choice for small to medium-sized businesses that need comprehensive monitoring without the complexity.
8. LibreNMS
LibreNMS is an open-source network monitoring system that emphasizes community-driven development and ease of use.
Key Features:
- Auto-discovery: Automatically detects network devices and services.
- Customizable alerting: Allows tailored notifications based on specific thresholds.
- Integration capabilities: Connects with various third-party tools for extended functionality.
- Active community: Provides support and contributes to ongoing development.
Comparison with Zabbix:
- Ease of Use: Easier to set up due to auto-discovery; Zabbix requires more manual configuration.
- Customization: Zabbix offers deeper customization.
- Scalability: Zabbix scales better for large environments.
LibreNMS shines in network-centric environments, offering detailed insights into network devices and traffic. Its community-driven approach ensures regular updates and a wealth of shared knowledge, making it a solid choice for organizations with strong network monitoring needs.
9. Icinga
Icinga, a fork of Nagios, offers enhanced features and performance while maintaining compatibility with Nagios plugins.
Key Features:
- Modular architecture: Allows for customization and extension to meet specific needs.
- Advanced distributed monitoring: Supports large-scale and complex monitoring setups.
- RESTful API: Enables integration with automation and orchestration tools.
- Modern web interface: Provides a user-friendly experience for managing and visualizing data.
Comparison with Zabbix:
- Ease of Use: Easier to set up due to auto-discovery; Zabbix requires more manual configuration.
- Customization: Zabbix offers deeper customization.
- Scalability: Zabbix scales better for large environments.
Icinga builds upon the Nagios foundation with improved scalability and a more modern architecture. It’s well-suited for organizations that appreciate Nagios’ flexibility but need better performance and a more user-friendly interface.
10. OpenNMS
OpenNMS is an enterprise-grade, open-source network monitoring platform designed for large-scale deployments.
Key Features:
- Scalable architecture: Handles monitoring of millions of devices.
- Event management and correlation: Identifies and correlates events for efficient troubleshooting.
- Extensive data collection: Gathers a wide range of performance metrics.
- Hybrid monitoring: Supports both agent-based and agentless monitoring.
Comparison with Zabbix:
- Ease of Use: Zabbix is easier to manage; OpenNMS requires expert knowledge.
- Customization: Both are highly customizable, but OpenNMS needs more technical expertise.
- Scalability: OpenNMS excels in massive deployments, while Zabbix is more versatile across scales.
OpenNMS excels in environments where scalability is a primary concern. Its ability to handle massive networks makes it a strong contender for large enterprises and service providers that need to monitor extensive, distributed infrastructure.
Setting Up SigNoz for Comprehensive Monitoring
-
Download Otel Java binary agent
To get started with SigNoz, begin by cloning the repository:
wget https://github.com/open-telemetry/opentelemetry-java-instrumentation/releases/latest/download/opentelemetry-javaagent.jarNext, run your application:
OTEL_RESOURCE_ATTRIBUTES=service.name=<app_name> \
OTEL_EXPORTER_OTLP_HEADERS="signoz-ingestion-key=SIGNOZ_INGESTION_KEY" \
OTEL_EXPORTER_OTLP_ENDPOINT=https://ingest.{region}.signoz.cloud:443 \
java -javaagent:$PWD/opentelemetry-javaagent.jar -jar <my-app>.jar
This command will set up SigNoz using Docker. For Kubernetes or manual installations, refer to the official documentation for detailed instructions.
-
Instrumenting Your Application
Integrate OpenTelemetry instrumentation into your application code to capture relevant telemetry data. OpenTelemetry provides libraries for most programming languages, making it easy to add instrumentation to your application.
-
Configuring Data Sources
Once SigNoz is running, access the web interface at
http://localhost:3301. Configure data sources to specify how SigNoz should collect data from your instrumented application. -
Setting Up Dashboards
SigNoz offers pre-built dashboards to quickly visualize key metrics. You can also create custom dashboards to tailor the monitoring experience to your specific needs.
-
Exploring and Analyzing Data
Leverage SigNoz’s user interface to explore distributed traces, analyze metrics, and identify performance bottlenecks. The platform’s intuitive design makes it easy to understand application behavior and troubleshoot issues.
Here’s a quick comparison of all the alternatives:
| Feature | Zabbix | SigNoz | Netdata | Nagios | Prometheus | Datadog | Checkmk | PRTG | LibreNMS | Icinga | OpenNMS |
|---|---|---|---|---|---|---|---|---|---|---|---|
| Open Source | Yes | Yes | Yes | Yes | Yes | No | Yes | No | Yes | Yes | Yes |
| Cloud-based | No | Yes | No | No | No | Yes | No | Yes | No | No | No |
| Agentless | No | Yes | Yes | Yes | Yes | Partial | Yes | Partial | Yes | Yes | Yes |
| Real-Time | Yes | Yes | Yes | No | Yes | Yes | Yes | Yes | Yes | Yes | Yes |
| APM | No | Yes | No | No | No | Yes | No | No | No | No | No |
| Infrastructure Monitoring | Yes | Yes | Yes | Yes | Yes | Yes | Yes | Yes | Yes | Yes | Yes |
| Application Monitoring | Partial | Yes | No | Partial | Yes | Yes | Partial | Partial | No | Partial | Partial |
| Log Management | Yes | Yes | No | Partial | No | Yes | Partial | No | No | Partial | Partial |
| Scalability | Medium | High | High | Medium | High | High | High | Medium | High | High | High |
| Ease of Use | Medium | High | High | Medium | Medium | High | Medium | High | High | Medium | Medium |
Choosing the Right Zabbix Alternative for Your Organization
Selecting the ideal Zabbix alternative requires careful consideration of your organization’s specific needs:
- Assess your infrastructure: Consider the size and complexity of your environment
- Identify key requirements: Prioritize features that are most critical for your operations
- Evaluate scalability: Ensure the solution can grow with your organization
- Consider expertise: Choose a tool that aligns with your team’s skills and resources
- Test thoroughly: Conduct proof-of-concept deployments to validate performance and usability
Remember, the best monitoring solution is one that not only meets your technical requirements but also integrates seamlessly into your workflows and processes.
Key Takeaways
- Zabbix alternatives offer diverse features and capabilities for IT monitoring.
- Open-source options provide flexibility and cost-effectiveness.
- Cloud-based solutions offer scalability and ease of management.
- Consider factors like ease of use, scalability, and integration when choosing.
- Testing multiple alternatives helps find the best fit for your organization.
FAQs
What Are the Main Advantages of Using Zabbix Alternatives?
Zabbix alternatives often offer easier setup, better scalability, specialized features, and more modern interfaces. They also integrate more seamlessly with cloud and container environments, making them a strong choice for evolving IT infrastructures.
How Do Open-Source Monitoring Tools Compare to Commercial Solutions?
Open-source tools are cost-effective and highly customizable, but they rely on community support. Commercial solutions provide polished interfaces, dedicated support, and integrated features, offering a more streamlined experience for some organizations.
Can I Migrate from Zabbix to Another Monitoring Platform Easily?
Migration complexity depends on the alternative and your current setup. While some tools offer smooth migration paths, others may require careful planning. A phased migration approach is recommended to minimize disruptions.
What Are the Key Features to Look for in a Modern IT Monitoring Solution?
Look for automated discovery, real-time alerts, customizable dashboards, API access, and support for cloud environments. Advanced features like anomaly detection and distributed tracing are valuable for handling complex systems.
Was this page helpful?
Бескомпромиссная зрелая платформа корпоративного уровня, предназначенная для мониторинга в реальном времени миллионов показателей, собранных с десятков тысяч серверов, виртуальных машин и сетевых устройств, без каких-либо усилий масштабируемых до более крупных сред.
Собирайте и анализируйте точные статистические данные и показатели производительности, визуализируйте их, незамедлительно получайте уведомления о текущих и потенциальных проблемах и пользуйтесь нашей проверенной временем профессиональной разработкой и поддержкой.
Наряду с хранением данных доступны функции визуализации (обзоры, карты, графики, экраны и т. Д.), А также очень гибкие способы анализа данных с целью оповещения.
Могут быть установлены пороги допустимых пределов для входящих данных. Как только эти пороговые значения будут превышены, Zabbix пошлет уведомления по электронной почте, информирующие сетевых администраторов о текущей или потенциальной проблеме.
Zabbix предлагает отличную производительность для сбора данных и может быть масштабирован для очень больших сред. С использованием Zabbix прокси доступны распределенные опции мониторинга. Zabbix поставляется с веб-интерфейсом, безопасной аутентификацией пользователя и гибкой схемой доступа пользователя. Поддерживается опрос и перехват, при этом собственные высокопроизводительные агенты собирают данные практически из любой популярной операционной системы; Также доступны методы мониторинга без агентов.
С Zabbix возможен веб-мониторинг и мониторинг виртуальных машин WMware. Zabbix может автоматически обнаруживать сетевые серверы и устройства, а также выполнять низкоуровневое обнаружение с помощью методов автоматического назначения проверок производительности и доступности к обнаруженным объектам.
Есть много причин выбрать решение Zabbix своим конкурентам. Попробовать Zabbix — это лучший способ убедиться, что это выбор № 1 для вашей организации.
-
84
-
Программное обеспечение службы поддержки, которое работает для IT.
- Бесплатная
- Windows
- Android
- Онлайн сервис

Присоединитесь к миллионам IT-специалистов и загрузите Spiceworks — бесплатное программное обеспечение для мониторинга сети с помощью инструментов управления сетью; приложением для получения заявок от службы поддержки;с навигацией по сети и многим другим.
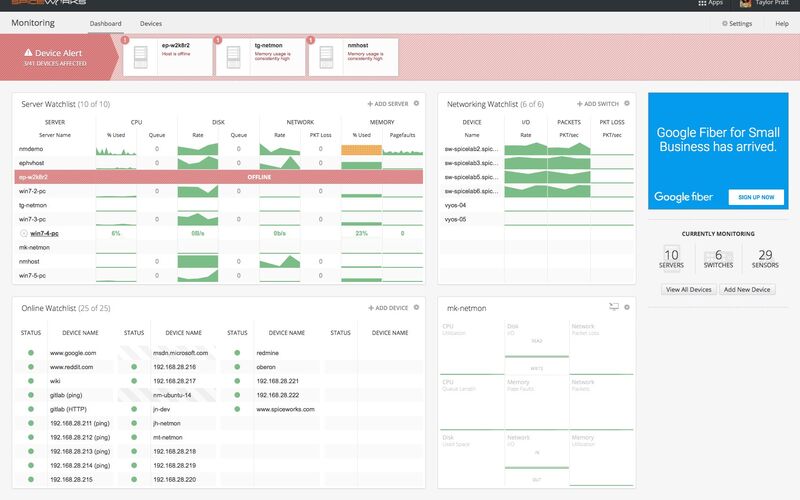
-
68
-
Datadog — это сервис мониторинга для ИТ-отделов и DevOps-команд.
- Условно бесплатная
- Windows
- Mac OS
- Онлайн сервис
Datadog — это сервис мониторинга для ИТ-отделов, групп разработчиков и специалистов по ИТ-обслуживанию, которые пишут и запускают приложения в больших масштабах и хотят превратить огромные объемы данных, создаваемые их приложениями, инструментами и сервисами, в единое представление ИТ-инфраструктуры. Возможности Datadog предоставляются на платформе анализа данных на основе SaaS, которая позволяет нескольким группам совместно работать над проблемами инфраструктуры.
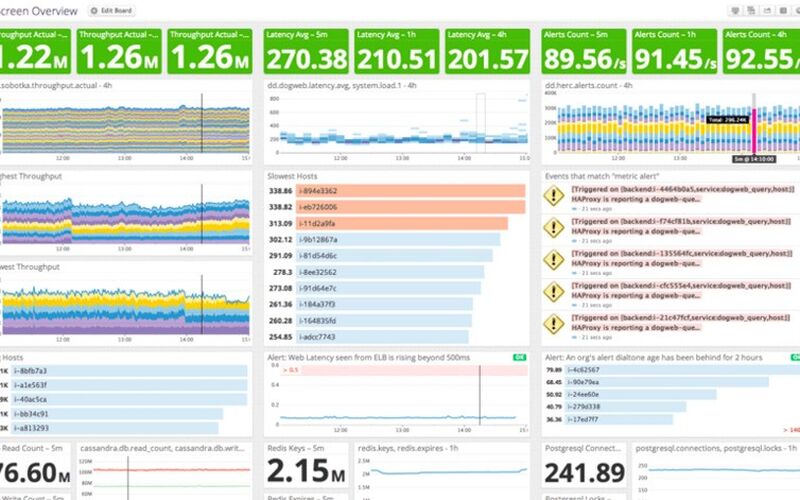
-
47
-
NetCrunch 10 — это сеть, сервер, приложение, журнал, файл и веб-интерфейс, не требующая дополнительных агентов.
- Платная
- Windows
- Mac OS
- Онлайн сервис
NetCrunch 10 — это универсальная система мониторинга и управления сетью, не требующая дополнительных агентов, и способная контролировать каждое устройство в вашей сети. Отслеживайте пропускную способность, доступность, производительность, сервисы, NetFlow и многое другое. Автоматически генерируйте карты и дисплеи в режиме реального времени. Получайте оповещения по электронной почте, через SMS, во всплывающих окнах или настраивайте NetCrunch 10 для выполнения автоматических корректирующих действий, таких как перезапуск службы или запуск сценария.
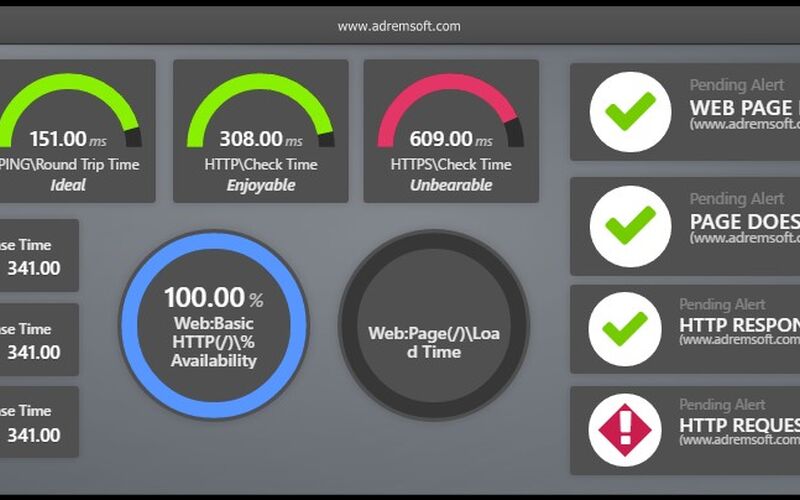
-
44
-
Munin — это сетевой инструмент мониторинга ресурсов, который может помочь проанализировать тенденции в ресурсах и то, что влияет на производительность компьютерной системы.
- Бесплатная
- Windows
- Mac OS
Munin — это инструмент для мониторинга сетевых ресурсов, который может помочь проанализировать тенденции в ресурсах и узнать, что повлияло на производительность компьютерной системы. Программу легко подключить. Установка по умолчанию предоставляет множество графиков.
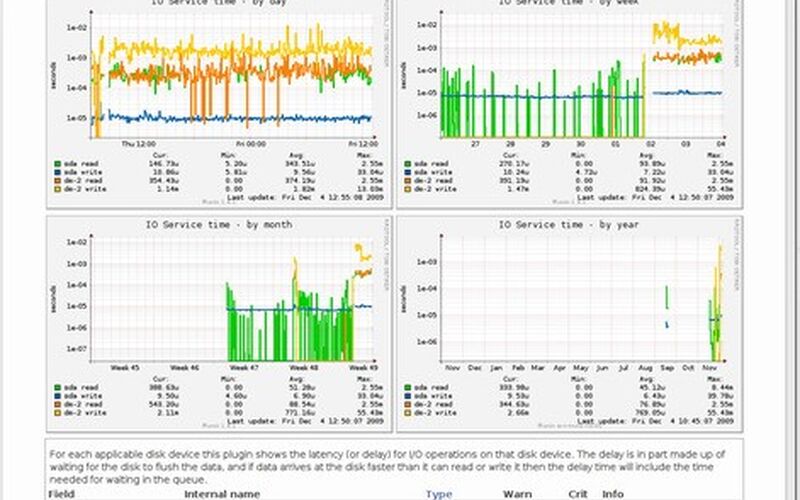
-
35
-
Усовершенствованное решение для мониторинга сети, позволяющее отслеживать время простоя / простоя сети, трафик и использование.
- Условно бесплатная
- Windows
Усовершенствованное, простое в использовании решение для мониторинга всей вашей сети. Функциональные возможности программного обеспечения включают в себя:
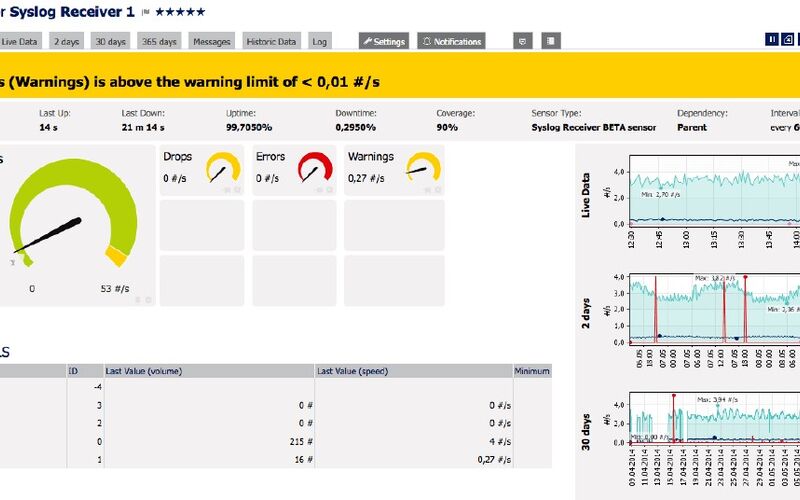
-
32
-
Icinga использует программный проект Nagios.
- Бесплатная
- Mac OS
Icinga использует программный проект Nagios. Таким образом, конфигурации, плагины и дополнения Nagios могут быть использованы с Icinga. Хотя Icinga сохраняет все существующие функции своего предшественника, в нем добавляется много долгожданных исправлений и функций, запрошенных сообществом пользователей.
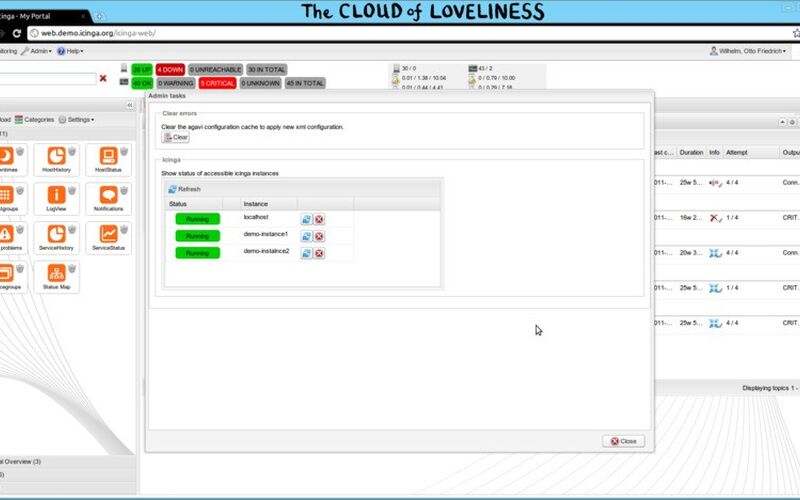
-
30
-
Готовое к использованию решение для мониторинга, обеспечивающее беспрецедентную гибкость ИТ-инфраструктуры для решения как неотложных, так и непредвиденных операционных проблем.
- Бесплатная
- Windows
Pandora FMS — это решение для мониторинга, готовое к использованию на предприятии, которое обеспечивает ИТ-специалистам беспрецедентную гибкость для решения как неотложных, так и непредвиденных операционных проблем, включая инфраструктуру и ИТ-процессы. Оно уникальным образом позволяет бизнесу и ИТ-специалистам адаптироваться к меняющимся потребностям благодаря гибкому и быстрому подходу к ИТ и бизнес-развертыванию.
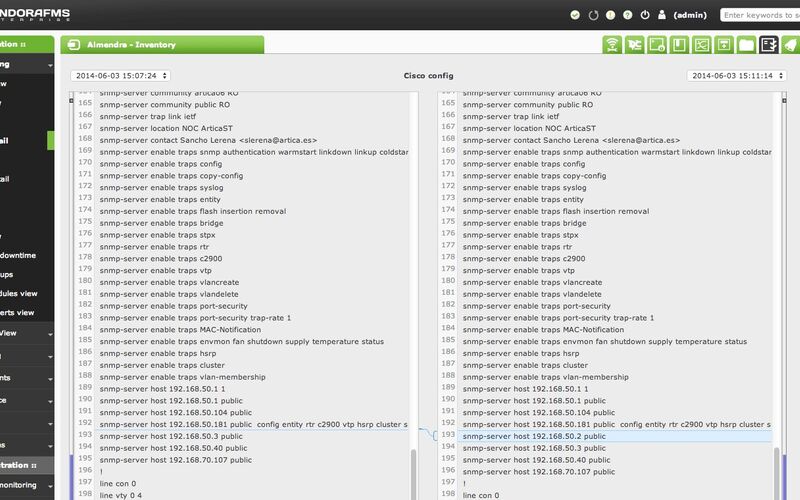
-
28
-
Полнофункциональная система мониторинга сети, предоставляющая множество функций и поддержку устройств.
- Бесплатная
- Linux/BSD
LibreNMS — это система автоматического обнаружения сетей на основе PHP / MySQL, созданная Observium. LibreNMS стремится быть простым в использовании, безболезненным для развертывания и поддерживать мониторинг широкого спектра устройств.
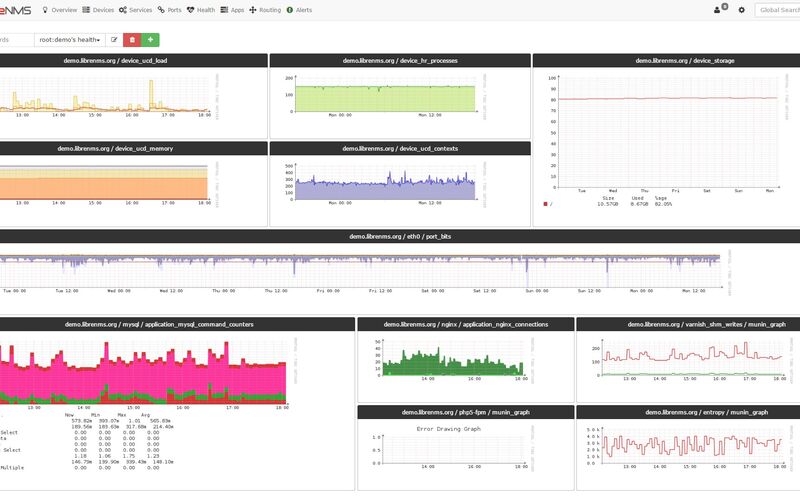
-
23
-
Observium — это автоматическое обнаружение сетевого мониторинга на основе PHP / MySQL / SNMP.
- Условно бесплатная
- Онлайн сервис
Observium — это автообнаружение сетевого мониторинга на основе PHP / MySQL / SNMP, которое включает поддержку широкого спектра сетевого оборудования и операционных систем, включая Cisco, Linux, FreeBSD, Juniper, Brocade, Foundry, HP и многие другие.
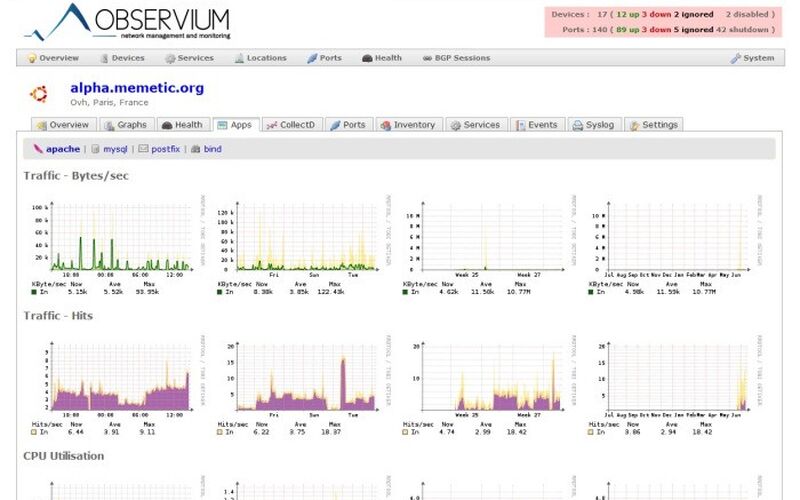
-
22
-
Сетевой монитор Dude — это новое приложение от MikroTik.
- Бесплатная
- Windows
Сетевой монитор Dude — это новое приложение от MikroTik, которое может значительно улучшить управление вашей сетевой средой. Он автоматически просканирует все устройства в указанных подсетях, нарисует и разметит карту ваших сетей, проверит сервисы ваших устройств и предупредит вас в случае проблем с некоторыми из них.

-
20
-
Мониторинг производительности и работоспособности в режиме реального времени.
- Бесплатная
- Mac OS
- Онлайн сервис
Netdata — это система распределенного мониторинга производительности и состояния в реальном времени. Он обеспечивает беспрецедентную информацию в реальном времени обо всем, что происходит в системе, в которой он работает (включая приложения, такие как веб-серверы и серверы баз данных), с использованием современных интерактивных веб-панелей мониторинга.
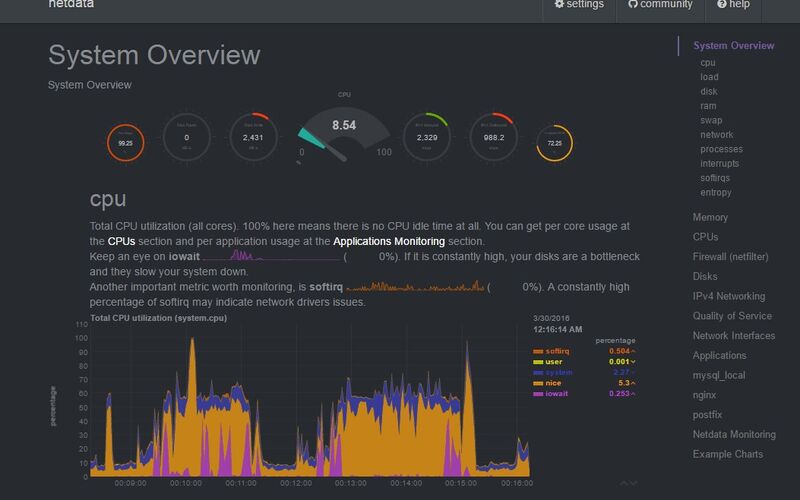
-
19
-
Cacti — это полный интерфейс RRDTool, в котором хранится вся необходимая информация для создания графиков.
- Бесплатная
- Windows
Cacti — это полный интерфейс RRDTool, он хранит всю необходимую информацию для создания графиков и заполнения их данными в базе данных MySQL. Интерфейс полностью основан на PHP.
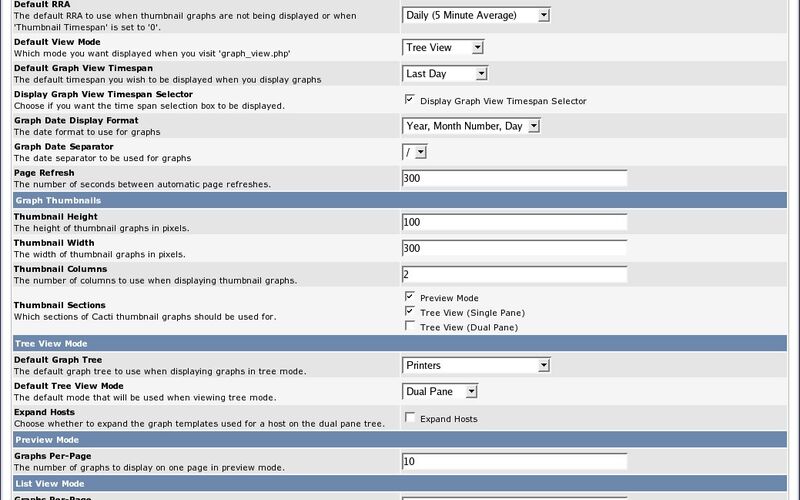
-
10
-
Доступный мониторинг производительности серверов и приложений.
- Платная
- Windows
Доступный и удобный мониторинг производительности серверов и приложений. С помощью мониторинга без лишних приложений и оборудования, Server & Application Monitor обеспечивает управление, оповещение и отчетность, необходимые для поддержания максимальной производительности ваших серверов и приложений.
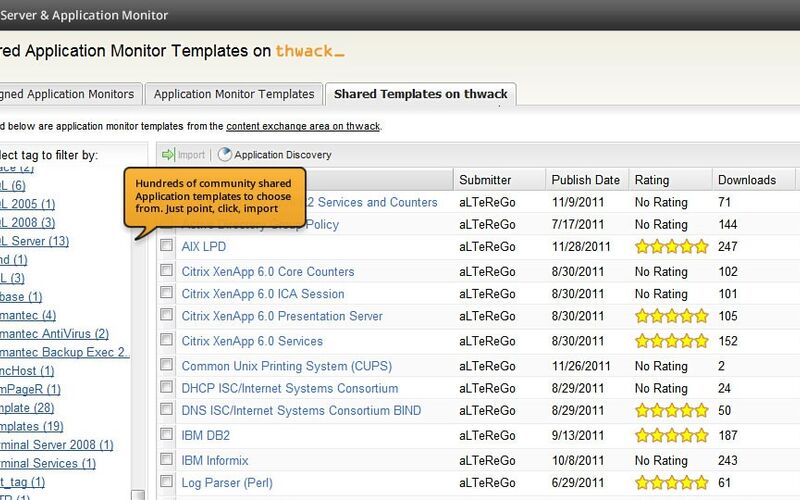
-
10
-
OpenNMS — это корпоративная платформа для мониторинга и управления сетью, разработанная в рамках модели бесплатного программного обеспечения или открытого кода.
- Бесплатная
- Windows
- Mac OS
OpenNMS — это корпоративная платформа для мониторинга и управления сетью, разработанная в рамках модели бесплатного программного обеспечения или открытого кода. Она состоит из проекта бесплатного программного обеспечения, поддерживаемого сообществом, а также организации, предлагающей коммерческие услуги, обучение и поддержку.
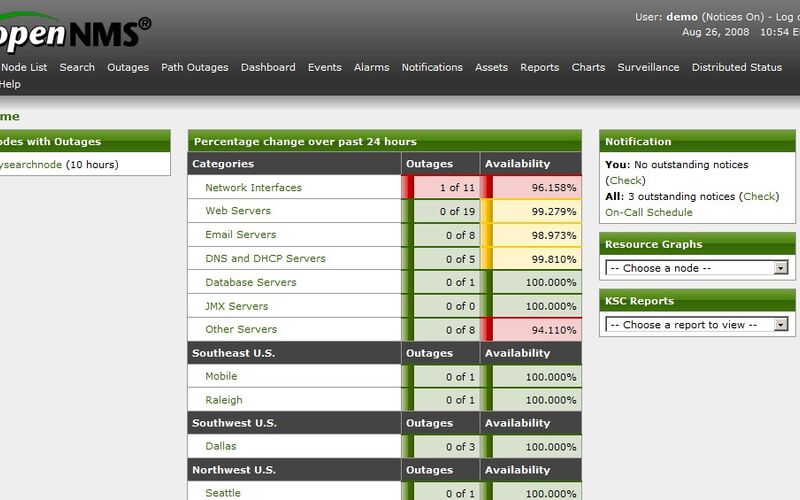
-
10
-
Zenoss (Zenoss Core) — это приложение с открытым исходным кодом, платформа для управления сервером и сетью, основанная на сервере приложений Zope.
- Бесплатная
- Android
- Mac OS
Zenoss (Zenoss Core) — это приложение с открытым исходным кодом, платформа управления сервером и сетью, основанная на сервере приложений Zope. Выпущенная по лицензии GNU General Public License (GPL) версии 2, Zenoss Core предоставляет веб-интерфейс, который позволяет системным администраторам отслеживать доступность, конфигурацию, производительность и события.
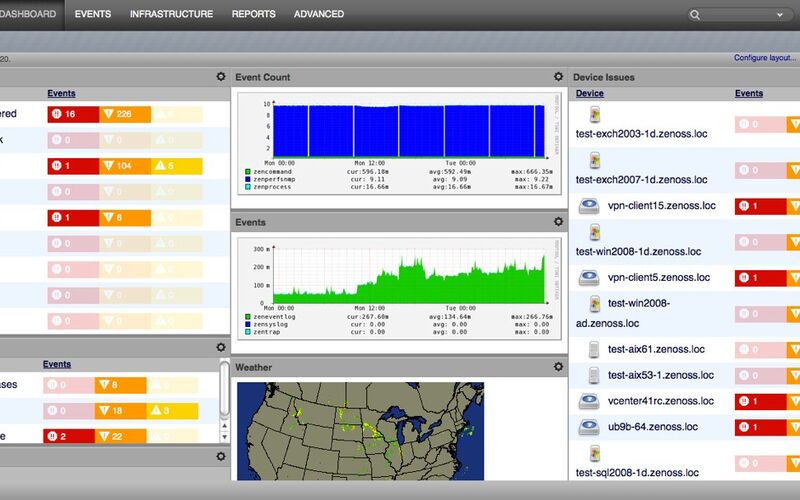
-
8
-
Гибкое решение для мониторинга серверов и сетей обеспечивает единое представление всей ИТ-инфраструктуры.
- Условно бесплатная
- Windows
- Android
- iPhone
Наше открытое и гибкое решение для мониторинга серверов и сетей обеспечивает единое представление всей ИТ-среды. Мониторинг до 100 000 устройств с одного сервера с распределёнными и избыточными решениями для почти бесконечной масштабируемости.
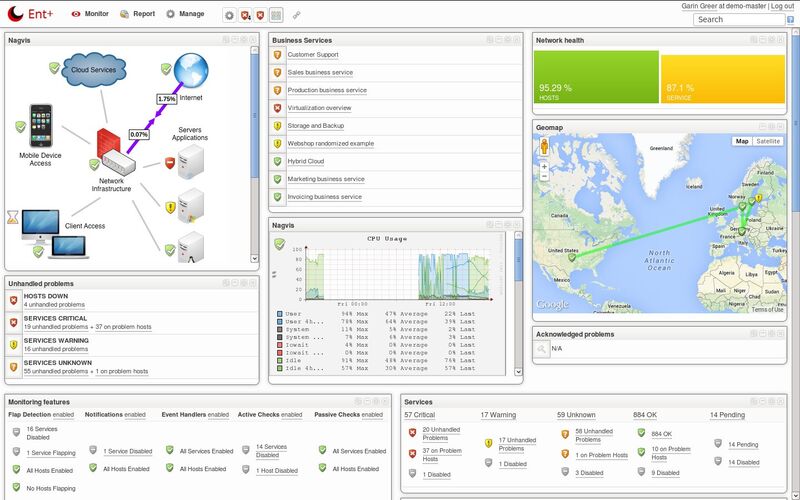
-
8
-
CloudRadar — это мощное, простое и доступное решение для мониторинга серверов и сетей.
- Бесплатная
- Windows
Мониторинг вашей ИТ-инфраструктуры никогда не был проще. CloudRadar контролирует ваши серверы, сетевые устройства и веб-сайты во всех ваших местах. Простая и управляемая настройка гарантирует, что ваш мониторинг произойдет в течение нескольких минут.