
Мониторинг сервера Windows позволяет отслеживать его работоспособность и оперативно реагировать на любые отклонения. Перезагрузки, заполнение дисков, нехватка оперативной памяти, высокая нагрузка на процессор, потеря связи или чрезмерное потребление трафика — всё это можно держать под контролем, если вы используете правильные инструменты.
В этом материале мы рассмотрим, как установить и настроить Zabbix-сервер и агент на Windows, а также какие моменты особенно важны для стабильной работы мониторинга.
Онлайн-курс: Zabbix 6. Мониторинг IT инфраструктуры предприятия.
Курс предлагает глубокое изучение Zabbix 6 и охватывает все ключевые аспекты: от установки и конфигурации до продвинутого мониторинга и автоматизации. Курс подходит как для начинающих, так и для опытных администраторов.
Содержание:
- Проверка версии Zabbix-сервера
- Загрузка агента Zabbix
- Установка агента Zabbix
- Настройка хоста в Zabbix-сервере
- Мониторинг и визуализация
- Заключение
Проверка версии Zabbix-сервера
Перед началом убедитесь, какую версию Zabbix-сервера вы используете. Эту информацию можно найти в веб-интерфейсе Zabbix, перейдя в раздел Reports > System information.
В нашем примере используется версия 7.0.9.

Перед установкой агента на Windows-сервере необходимо определить его архитектуру и имя.

Эти данные критичны при выборе подходящего инсталляционного пакета.
Загрузка агента Zabbix
Перейдите на официальный сайт Zabbix и скачайте соответствующую версию агента.
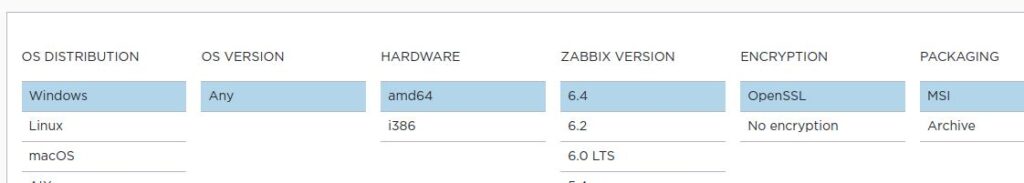
При выборе версии обратите внимание на следующие параметры:
- Операционная система: Windows
- Архитектура: 64-bit
- Совместимость по версии: должна соответствовать версии вашего Zabbix-сервера
- Метод шифрования: рекомендуется выбрать OpenSSL
- Формат установки: файл формата MSI

Выберите актуальную версию релиза агента и загрузите инсталлятор.

Установка агента Zabbix
Запустите установку агента Zabbix на вашем сервере Windows.

Примите условия лицензионного соглашения.

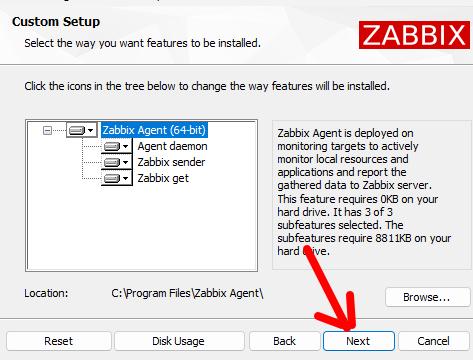
На следующем этапе выберите компоненты, которые необходимо установить. По умолчанию требуется около 8,70 МБ свободного пространства.

Путь установки — C:\Program Files\Zabbix Agent\.
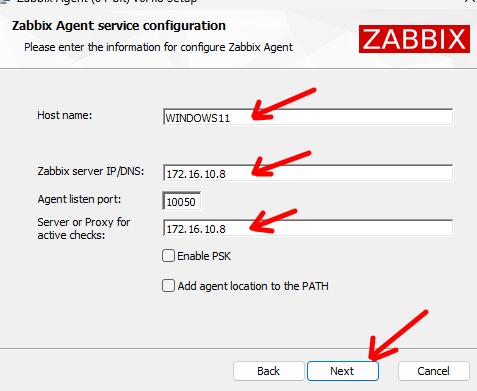
Инсталлятор автоматически определит имя машины. Далее нужно указать IP-адрес сервера Zabbix, с которым агент будет связываться.
Также на этом этапе можно настроить защищённое соединение с использованием предустановленного ключа. Подробнее об этом методе читайте на официальной странице: Использование pre-shared ключей

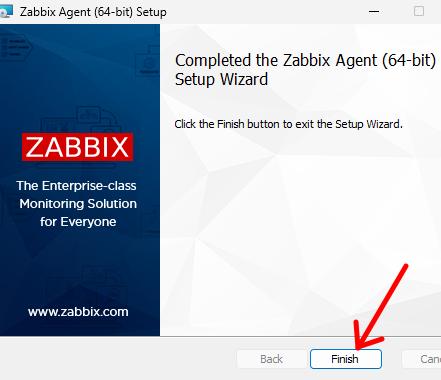
Начните установку и дождитесь её завершения.


Настройка хоста в Zabbix-сервере
Чтобы добавить хост для мониторинга в системе Zabbix, откройте веб-интерфейс и перейдите в Data collection > Hosts.
Нажмите Create host (в правом верхнем углу) и укажите следующие параметры:
- Имя хоста: например, DESKTOP-D75R1IG
- Отображаемое имя: например, Windows Server
- Шаблон: выберите Windows by Zabbix Agent — он включает в себя ключевые метрики Windows-систем
- Группа: определяет логическое размещение сервера (например, Windows Servers)
- Интерфейс: выберите тип Agent, укажите IP-адрес целевого сервера

Мониторинг и визуализация
Как только хост будет добавлен, вы начнёте получать информацию о состоянии сервера в режиме реального времени:
- Общая производительность: загрузка CPU, использование памяти и состояние дисков


- Работа служб Windows и подробная информация о системе

- Потребление сетевого трафика

Кроме того, можно отслеживать отказоустойчивость, продолжительность аптайма и другие важные параметры.
Заключение
Zabbix предоставляет мощные инструменты для мониторинга серверов Windows, предлагая готовые шаблоны и гибкие возможности настройки. Это делает его незаменимым решением для построения системы централизованного наблюдения за ИТ-инфраструктурой.
Вдобавок к базовому мониторингу вы можете расширить функциональность, подключив контроль логов, событий безопасности, конкретных портов, отслеживание неудачных попыток входа в систему и многое другое. Всё это помогает оперативно реагировать на инциденты и минимизировать простои.
А если вы хотите углубиться в тему и освоить Zabbix на профессиональном уровне — обратите внимание на курс Zabbix 6. Мониторинг IT инфраструктуры предприятия. Это практическое и структурированное обучение, созданное с учётом реальных задач, с которыми сталкиваются системные администраторы и инженеры мониторинга.
Вам понравилась эта статья? Тогда вам, скорее всего, будет интересна другая полезная статья Основы Zabbix: хосты, элементы данных и триггеры.
Интересуешься IT и системным администрированием? Подпишись на SysAdminHub в телеграмм, чтобы узнавать обо всем первым — t.me/SysAdminHub
Статья была полезна? Поддержи автора, и благодаря твоей помощи новые материалы будут выходить еще чаще:
Время на прочтение10 мин
Количество просмотров155K
Если нам нужно мониторить состояние серверов и прочих компьютеризированных рабочих мест при помощи Zabbix, то это можно сделать двумя способами.
Первый способ — это при помощи SNMP-запросов, с отправкой которых Zabbix замечательно справляется. Так можно вытащить и загрузку сетевых интерфейсов, и загрузку процессора, памяти. Поверх этого, производители сервера могут выдать нам по SNMP еще много информации о состоянии железа.
Второй заключается в использовании Zabbix агента, который мы будем запускать на наблюдаемой системе. Список наблюдаемых параметров включает в себя как и такие простые вещи, как загрузка процессора, использование памяти, так и более хитрые, такие как чтение текстовых лог-файлов с поддержкой ротации или отслеживание факта изменения любого файла. Можно даже в качестве параметра использовать вывод любой произвольной команды на системе. Возможности Zabbix агента растут от версии к версии.
Что делать, если того, что мы хотим контролировать через Zabbix нет в списке возможностей Zabbix агента? Ждать пока это имплементируют разработчики в следующем релизе? Не обязательно.
Нам оставили несколько стандартных интерфейсов для того, чтобы расширить возможности Заббикса по мониторингу серверов настолько, насколько позволит нам наша фантазия и наличие свободного времени на написание скриптов. Интерфейсы эти UserParameter и zabbix_sender. О первом и пойдет речь, а в качестве примеров будет показано как можно собирать состояние S.M.A.R.T жестких дисков и контролировать, когда кто-то удаляет или устанавливает новые программы на своей Windows-машине.
Немного матчасти
Если вы уже хоть раз настраивали Zabbix агент на сервере, то начать использовать UserParameter не составит труда. Чтобы добавить новый параметр нужно сделать несколько вещей:
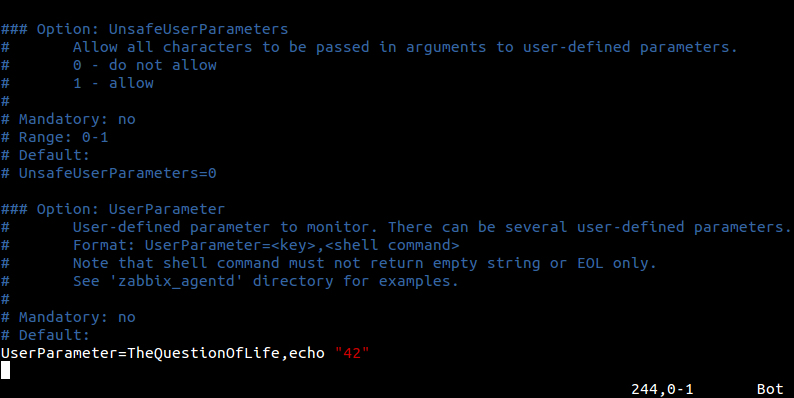
- Добавить в конце конфигурационного файла zabbix_agentd.conf строчку вида
UserParameter=<ключ>,<команда>где:
<ключ> — уникальное имя, которое мы придумываем сами. Будем его использовать при настройке элемента данных в Zabbix.
<команда> — команда, которую нужно выполнить на наблюдаемом узле сети.
А вот сразу очень простой пример, который лежит в каждом стандартном конфиге для Linux:
UserParameter=system.test,who|wc -lИтак, ключ здесь system.test, а выполняем команду who | wc -l, которая возвращает нам количество открытых сессий в системе. Добавляем (или раскомментируем данную строчку если уже есть), идем дальше.
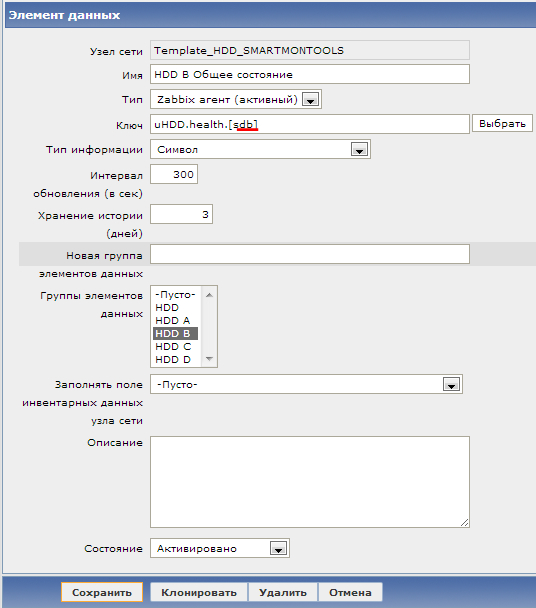
- В Веб-консоли Zabbix создать новый элемент данных с ключом, который мы использовали, если брать пример выше, то это system.test.
Для этого нажимаем «Создать элемент данных»
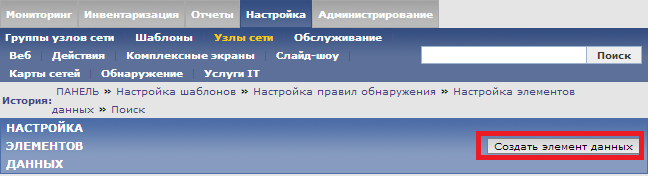
и затем выставляем ключ такой же, как указали в конфиг-файле, а тип Zabbix агент:
- Перезагрузить Zabbix агента, чтобы изменения в конфиг-файле вступили в силу
Наблюдаем результат в последних данных:

Мониторинг SMART через UserParameter
Пример выше имеет мало практического применения, учитывая, что уже итак существует стандартный ключ system.users.num, который делает ровно тоже самое.
Так что теперь рассмотрим пример, который уже больше будет походить на реалистичный.
Если нам интересно мониторить момент, когда пора планово менять жесткие диски, то есть два варианта:
- Если диски за аппаратным RAID-контроллером, то, как правило, сами диски операционная система «не видит». Поэтому ищем способы как вытащить информацию о состоянии жестких дисков через утилиты или SNMP-сабагента, которые нам любезно предоставил(или не предоставил) производитель RAID-контроллера. Для каждой отдельной серии контроллеров свой путь до этой информации.
- Если речь идет о просто рабочих станциях, серверах с софтовом RAID и т.д., то тогда к дискам есть доступ из операционной системы, и мы вольны использовать различные утилиты для чтения их статуса. В случае Zabbix нам подходит утилита smartctl, из пакета SMARTMONTOOLS.
В Debian установка SMARTMONTOOLS сводится к:
sudo apt-get install smartmontoolsи утилита готова к использованию.
Для каждого диска, который есть в системе сначала проверим, что SMART включен:
sudo smartctl -i /dev/sda | grep SMART
SMART support is: Available - device has SMART capability.
SMART support is: Enabled
если вдруг SMART поддерживается диском, но выключен, то активируем его:
sudo smartctl -s on -S on -o on /dev/sda
smartctl version 5.37 [i686-pc-linux-gnu] Copyright (C) 2002-6 Bruce Allen
Home page is http://smartmontools.sourceforge.net/

=== START OF ENABLE/DISABLE COMMANDS SECTION ===
SMART Enabled.
SMART Attribute Autosave Enabled.
SMART Automatic Offline Testing Enabled every four hours.
Теперь мы можем проверять статус SMART командой:
sudo smartctl -H /dev/sda |grep "test"| cut -f2 -d: |tr -d " "Именно эту команду мы и запишем в наш zabbix_agentd.conf:
UserParameter=uHDD.health,sudo smartctl -H /dev/sda |grep "test"| cut -f2 -d: |tr -d " "где uHDD.health — ключ.
Мониторинг SMART через Flexible UserParameter
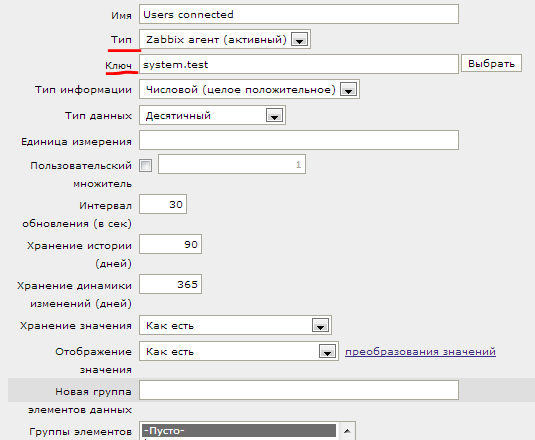
Тут возникает резонный вопрос, как быть если дисков два. Легче всего решить эту проблему поможет способность UserParameter передавать параметры агенту, про которую мы еще не упоминали. Но делается все очень просто, сразу пример:
UserParameter=uHDD.health.[*],sudo smartctl -H /dev/$1 |grep "test"| cut -f2 -d: |tr -d " "В веб-интерфейсе Zabbix в ключе мы будем подставлять параметры в квадратные скобки вместо *. Например, для одного элемента данных мы напишем sda, а для другого sdb. В команде этот параметр найдет отражение там, где стоит переменная $1.
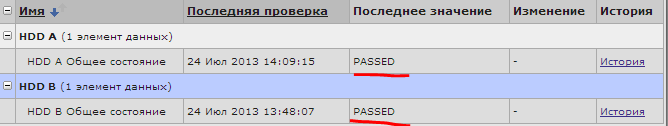
Создадим для второго диска элемент данных:
И через некоторое время сможем наблюдать результат в последних данных:
Мониторинг SMART через Flexible UserParameter c Low-level Discovery
Все получилось. Но тут возникает резонный вопрос, как быть если дисков не два, а двадцать два. И тут нам пригодится замечательная возможность низкоуровнего обнаружения (LLD), про которую мы уже говорили.
Низкоуровневое обнаружение позволяет системе мониторинга обнаруживать какое количество однотипных элементов присутствует на узле сети и динамически по шаблону создавать необходимые элементы данных, триггеры и графики для этих элементов. «Из коробки» системе доступна возможность находить файловые системы, сетевые интерфейсы и SNMP OID’ы. Однако, и здесь разработчики оставили возможность дополнить стандартные возможности, нужно просто передать в систему информацию о том, какие элементы обнаружены в формате JSON. Этим и воспользуемся.
Создадим маленький скрипт на perl, smartctl-disks-discovery.pl. Он будет находить все диски в системе и выводить эту информацию в JSON, передавая также информацию, включен ли у диска SMART или нет, а также попытается сам включить SMART, если он выключен:
#!/usr/bin/perl

#must be run as root

$first = 1;

print "{\n";
print "\t\"data\":[\n\n";

for (`ls -l /dev/disk/by-id/ | cut -d"/" -f3 | sort -n | uniq -w 3`) {
    #DISK LOOP
    $smart_avail=0;
    $smart_enabled=0;
    $smart_enable_tried=0;

    #next when total 0 at output
    if ($_ eq "total 0\n") {
        next;
    }

    print "\t,\n" if not $first;
    $first = 0;

    $disk =$_;
    chomp($disk);

    #SMART STATUS LOOP
    foreach(`smartctl -i /dev/$disk | grep SMART`) {
        $line=$_;

        # if SMART available -> continue
        if ($line = /Available/){
            $smart_avail=1;
            next;
        }

        #if SMART is disabled then try to enable it (also offline tests etc)
        if ($line = /Disabled/ & $smart_enable_tried == 0){

            foreach(`smartctl -i /dev/$disk -s on -o on -S on | grep SMART`) {

                if (/SMART Enabled/){
                    $smart_enabled=1;
                    next;
                }
            }
            $smart_enable_tried=1;
        }

        if ($line = /Enabled/){
            $smart_enabled=1;
        }
    }

    print "\t{\n";
    print "\t\t\"{#DISKNAME}\":\"$disk\",\n";
    print "\t\t\"{#SMART_ENABLED}\":\"$smart_enabled\"\n";
    print "\t}\n";

}

print "\n\t]\n";
print "}\n";
При запуске скрипт выдает:
$ /usr/local/bin/smartctl-disks-discovery.pl
{
"data":[
    {
        "{#DISKNAME}":"md0",
        "{#SMART_ENABLED}":"0"
    },
    {
        "{#DISKNAME}":"md1",
        "{#SMART_ENABLED}":"0"
    },
    {
        "{#DISKNAME}":"sda",
        "{#SMART_ENABLED}":"1"
    },
    {
        "{#DISKNAME}":"sdb",
        "{#SMART_ENABLED}":"1"
    }]
}
Теперь, для того чтобы скрипт автоматически запускался Zabbix’ом, просто добавим еще один UserParameter в zabbix_agentd.conf:
UserParameter=uHDD.discovery,sudo /usr/local/bin/smartctl-disks-discovery.plПокончив с настройкой конфига, переходим в веб-интерфейс, где создаем новое правило обнаружения для smartctl:
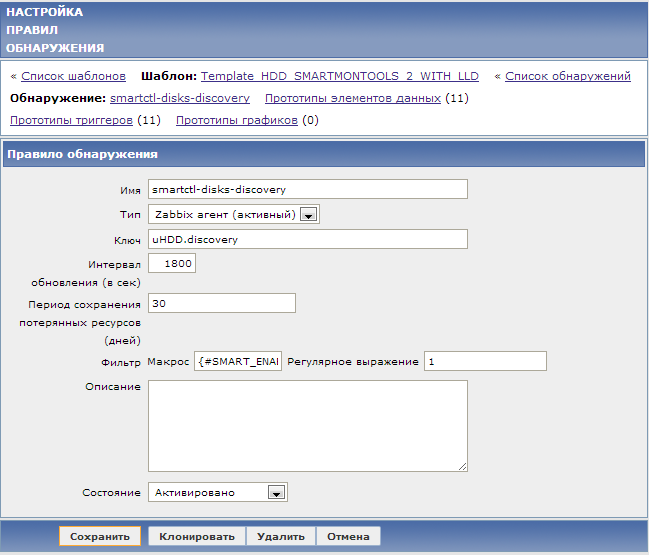
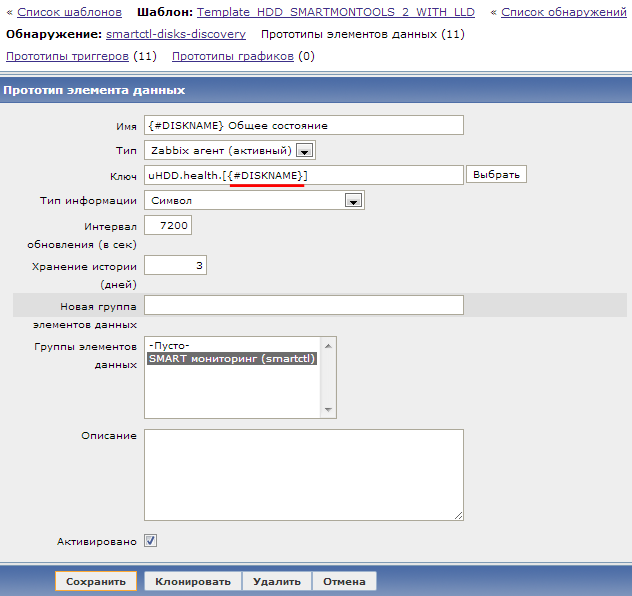
Обратите внимание на ключ и на фильтр, ({#SMART_ENABLED}=1) благодаря последнему будут добавляться только те обнаруженные диски, которые поддерживают SMART. Теперь мы можем переписать два наших элемента данных для дисков sda и sdb в один прототип элементов данных, просто заменив имя диска на макрос {#DISKNAME}:
Последнее, перед тем, как Zabbix сможет запускать команды, которые мы прописали в zabbix_agentd.conf из-под root и мониторить SMART, нужно добавить разрешения для его пользователя запускать эту команду без ввода пароля, для этого добавим в /etc/sudoers строчку:
zabbix ALL= (ALL) NOPASSWD: /usr/sbin/smartctl,/usr/local/bin/smartctl-disks-discovery.plГотовый шаблон для мониторинга SMART с остальными элементами данных, триггерами прикладываю, так же как и настроенный под него конфиг.
Контроль за установкой новых программ на Windows
Zabbix агент, установленный на Windows, точно также может быть расширен через UserParameter, только команды будут уже другие. Хотя, например, smartctl — кроссплатформенная утилита, и точно также можно ее использовать для контроля за жесткими дисками в Windows.
Кратко рассмотрим еще другой пример. Задача получать уведомление каждый раз, когда пользователь самостоятельно удаляет или устанавливает программы.
Для этого будем использовать наш vbs-скрипт:
uDiffPrograms.vbs
'KNOWN ISSUE: If Application name conatins '-' symbol then e-mail alert containing software list will be sent all on one line instead of each packet on a single line
variable=InstalledApplications(".")
'WScript.Echo strConvert(variable,"Windows-1251","cp866")
Const ForReading = 1
zabbix_dir="C:\zabbix\"
Set objFSO = CreateObject("Scripting.FileSystemObject")
'Create old file if does not exist
If objFSO.FileExists(zabbix_dir&"uDiffPrograms_old.txt")=0 Then
Set objFile4 = objFSO.CreateTextFile(zabbix_dir&"uDiffPrograms_old.txt")
objFile4.WriteLine variable
objFile4.Close
Call ConvertCharsetFile("0x0")
WScript.Quit
End if
'Create 'new' file
Set objFile3 = objFSO.CreateTextFile(zabbix_dir&"uDiffPrograms_new.txt")
objFile3.WriteLine variable
objFile3.Close
'Compare old and new files
Set objArgs = Wscript.Arguments
Set objFile5= objFSO.GetFile(zabbix_dir&"uDiffPrograms_new.txt")
Set objFile6 = objFSO.GetFile(zabbix_dir&"uDiffPrograms_old.txt")
If objFile5.Size <> objFile6.Size Then
' Wscript.Echo "The file is different."
Else
'Wscript.Echo "They are the same."
objFSO.DeleteFile zabbix_dir&"uDiffPrograms_new.txt"
Call ConvertCharsetFile("0x0")
WScript.Quit
End If
'Search for removed applications
Set objFile2 = objFSO.OpenTextFile(zabbix_dir&"uDiffPrograms_old.txt", ForReading)
Do Until objFile2.AtEndOfStream
strAddress2 = objFile2.ReadLine
If InStr(variable, strAddress2&vbCrLf) = 0 Then
strNotCurrent2 = strNotCurrent2 & strAddress2 & vbCrLf
End If
Loop
objFile2.Close
'Search for installed applications
Set objFile1 = objFSO.OpenTextFile(zabbix_dir&"uDiffPrograms_old.txt", ForReading)
oldvar = objFile1.ReadAll
objFile1.Close
objFSO.DeleteFile zabbix_dir&"uDiffPrograms_old.txt"
Set objFile2 = objFSO.OpenTextFile(zabbix_dir&"uDiffPrograms_new.txt", ForReading)
Do Until objFile2.AtEndOfStream
strAddress = objFile2.ReadLine
If InStr(oldvar, strAddress&vbCrLf) = 0 Then
strNotCurrent = strNotCurrent & strAddress & vbCrLf
End If
Loop
objFile2.Close
'Rename C:\zabbix\uDiffPrograms_new.txt to C:\zabbix\uDiffPrograms_old.txt
objFSO.MoveFile zabbix_dir&"uDiffPrograms_new.txt" , zabbix_dir&"uDiffPrograms_old.txt"
'Output
if strNotCurrent <> "" and strNotCurrent2 <> "" then
Call ConvertCharsetFile("Новые программы были установлены:" & vbCrLf & strNotCurrent & vbCrLf & "Следующие программы были удалены:" & vbCrLf & strNotCurrent2)
Wscript.Quit
End if
if strNotCurrent <> "" then
Call ConvertCharsetFile("Новые программы были установлены:" & vbCrLf & strNotCurrent)
End if
if strNotCurrent2 <> "" then
Call ConvertCharsetFile("Следующие программы были удалены:" & vbCrLf & strNotCurrent2)
End If
Function InstalledApplications(node)
'''with Versions
Const HKLM = &H80000002 'HKEY_LOCAL_MACHINE
Set oRegistry = GetObject("winmgmts://" _
& node & "/root/default:StdRegProv")
sBaseKey = _
"SOFTWARE\Microsoft\Windows\CurrentVersion\Uninstall\"
iRC = oRegistry.EnumKey(HKLM, sBaseKey, arSubKeys)
For Each sKey In arSubKeys
iRC = oRegistry.GetStringValue( _
HKLM, sBaseKey & sKey, "DisplayName", sValue)
If iRC <> 0 Then
oRegistry.GetStringValue _
HKLM, sBaseKey & sKey, "QuietDisplayName", sValue
End If
If sValue <> "" and instr(sValue, "KB")=0 Then
'instr(sValue, "KB")=0 - to exlude KB-indexed Microsoft Patches
If instr(InstalledApplications, sValue&vbCrLf)=0 then
'and instr(InstalledApplications, sValue&vbCrLf)=0 - to exlude possible dublicates
InstalledApplications = _
InstalledApplications & sValue & vbCrLf
End If
End If
Next
End Function
Function ConvertCharsetFile(input)
Const adTypeBinary = 1
Const adTypeText = 2
Const bOverwrite = True
Const bAsASCII = False
'Write to temp file
Set objFSO = CreateObject("Scripting.FileSystemObject")
If objFSO.FileExists( zabbix_dir&"uDiffPrograms_temp.txt" ) Then objFSO.DeleteFile zabbix_dir&"uDiffPrograms_temp.txt"
Set objFile3 = objFSO.CreateTextFile(zabbix_dir&"uDiffPrograms_temp.txt")
objFile3.WriteLine input
objFile3.Close
Dim oFS : Set oFS = CreateObject( "Scripting.FileSystemObject" )
Dim sFFSpec : sFFSpec = oFS.GetAbsolutePathName( zabbix_dir&"uDiffPrograms_temp.txt" )
Dim oFrom : Set oFrom = CreateObject( "ADODB.Stream" )
Dim sFrom : sFrom = "windows-1251"
Dim oTo : Set oTo = CreateObject( "ADODB.Stream" )
Dim sTo : sTo = "utf-8"
oFrom.Type = adTypeText
oFrom.Charset = sFrom
oFrom.Open
oFrom.LoadFromFile sFFSpec
oTo.Type = adTypeText
oTo.Charset = sTo
oTo.Open
oTo.WriteText oFrom.ReadText
oFrom.Close
If oFS.FileExists( sFFSpec ) Then oFS.DeleteFile sFFSpec
oTo.SaveToFile sFFSpec
oTo.Close
End Function
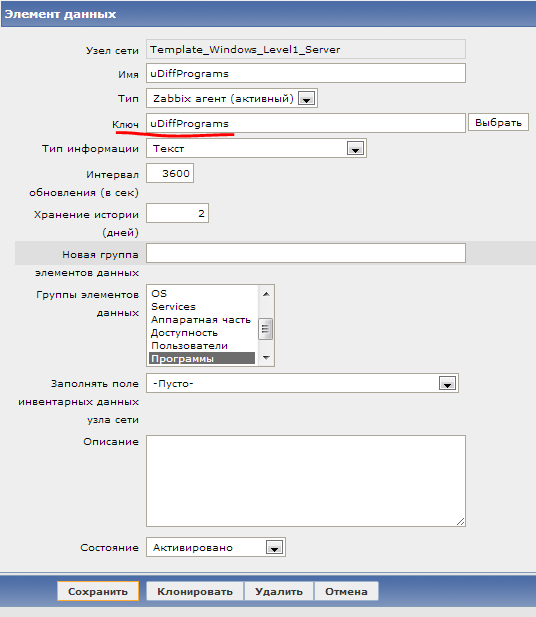
'=============================================================================Для его интеграции с Zabbix добавим UserParameter в конфиг-файл:
UserParameter=uDiffPrograms, cscript.exe /nologo "C:\zabbix\uDiffPrograms.vbs" & type C:\zabbix\uDiffPrograms_temp.txtДобавим элемент данных в шаблон для Windows:
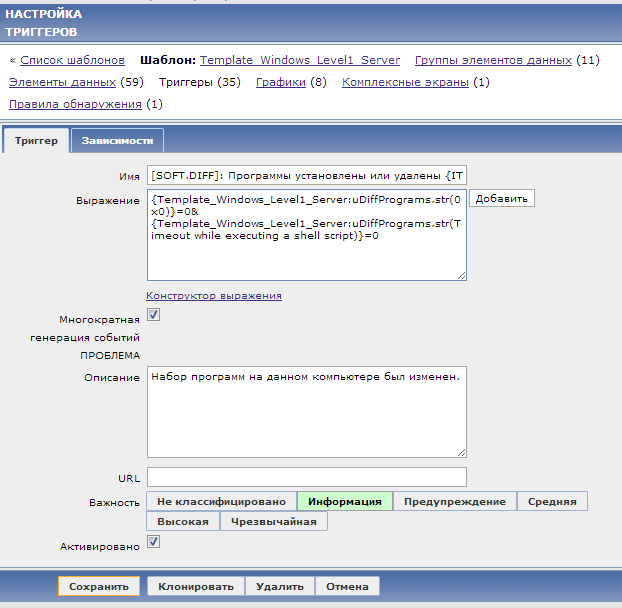
Добавим триггер:
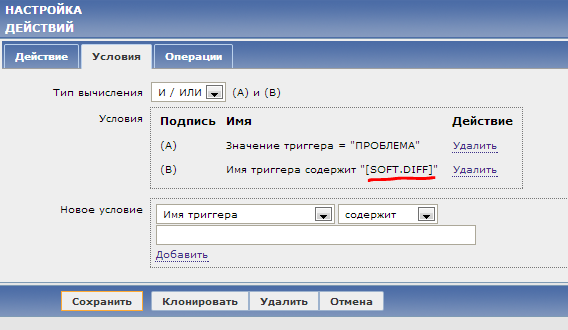
и действие, которое будет отправлять e-mail уведомление:
Весь процесс мониторинга выглядит так: каждый час запускается скрипт Zabbix агентом, который сравнивает два списка программ: текущий и предыдущий. Затем скрипт выписывает все изменения в отдельный файл. Если же изменений нет, то в файл пишется 0x0
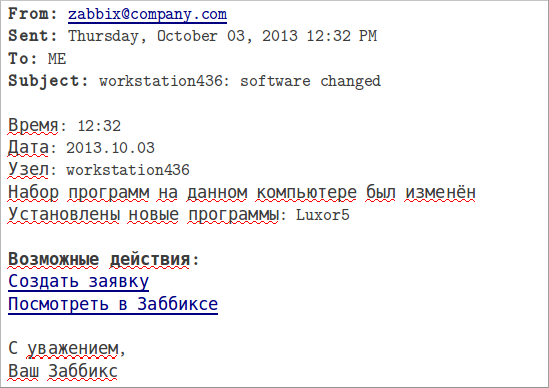
Содержимое файла уходит на Zabbix сервер, где поднимается триггер в случае, если значение элемента данных uDiffProgramms отлично от 0x0. Затем отдельное действие отправляет по почте уведомление со списком того, что было установлено или удалено на данном компьютере:
В итоге
UserParameter — отличная и простая возможность расширить функционал системы самостоятельно. Стоит упомянуть и альтернативы: zabbix_sender, который, например, подойдет для тех случаев, когда нужно отправлять данные в Zabbix не по расписанию, (как это делает UserParameter), а по какому-то событию; и system.run[], который похож на UserParameter, но удобнее тем, что не нужно вносить изменения во все конфиги агентов, достаточно просто добавить этот элемент данных в шаблон. Более того, в следующем крупном релизе Zabbix 2.2 нас ожидает еще один новый способ расширить возможности агента- это подключаемые модули. Ждем с нетерпением!
Вот так, считайте, что если вы можете узнать что-то о системе скриптом или командой, значит, вы всегда можете передать это в Zabbix.
In this tutorial we will teach you how to monitor a Windows machine using zabbix. To do this, we will use the zabbix agent on the Windows machine.
This tutorial is focused on monitoring a Windows machine and we will show the steps to install and configure the zabbix agent on Windows.
We also have another tutorial that teaches you how to monitor a Linux machine (Click Here).
Table Of Contents
- Ddownload the zabbix agent for windows
- Installing the zabbix agent on windows
- Allow Zabbix Agent in Firewall
- Monitoring on the zabbix server
- Creating new WINDOWS host on Zabbix Server
Ddownload the zabbix agent for windows
First, let’s access the zabbix download page and choose the operating system Windows.
Also, let’s choose the newest version of zabbix.
For encryption, we will choose OpenSSL and MSI packaging.
Then, further down the page, we will see the DOWNLOAD option.
Installing the zabbix agent on windows
Now, let’s go to the folder where we downloaded it and double-click on the installer.
We will then see a screen asking if we want to continue with the installation.
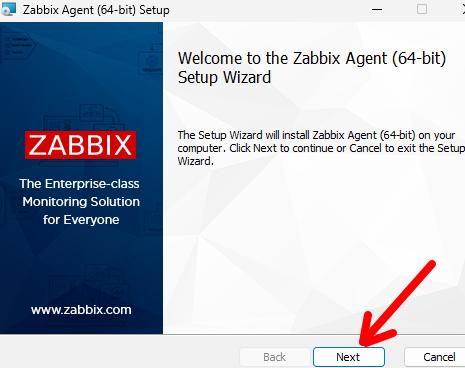
Soon after, comes the license and the question if you agree.
After continuing, we will see the screen that asks where the installation will take place. For this tutorial, we will use the standard installation and therefore click on “Next”.
Now let’s enter the Zabbix server IP both in the “Zabbix server” field and also in the “active checks” field.
If you are using a Zabbix proxy, you can enter the proxy IP in the “active checks” section.
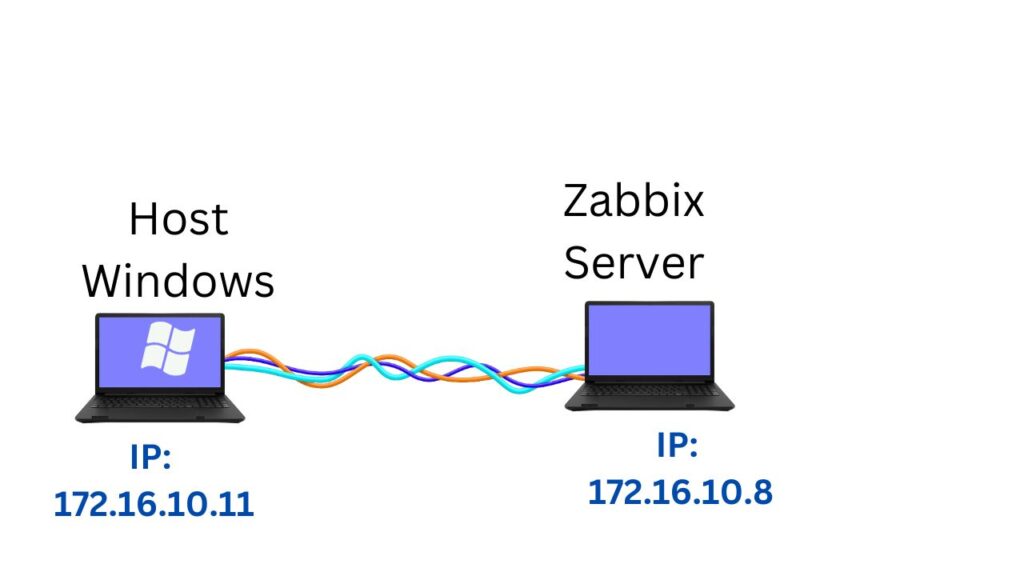
In our case, our zabbix server has the IP “172.16.10.8”.
Let’s leave the agent listening on the default port “10050”.
To make this tutorial simpler, we will not cover PSK configuration.
If you wish, we can make future tutorials including PSK.
After that, we can finish the installation.
Allow Zabbix Agent in Firewall
Check if the Windows firewall is allowing communication with the Zabbix Agent.
To do this, we will click on “Allow na app or feature…”
Next, let’s check if the “Zabbix Agent listen port” has permission in the Private and Public fields.
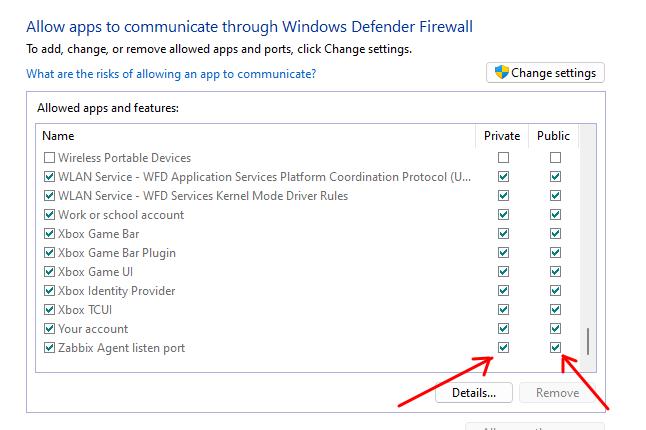
If it is as in the figure above, it means that the Windows firewall will allow communications with the zabbix agent port. If this is not the case, you need to include this permission in the Windows firewall.
Monitoring on the zabbix server
Now let’s configure the zabbix server to monitor our zabbix agent that is running on the Windows machine.
If you don’t already have a Zabbix server, see here how to configure Zabbix Server.
The scenario we used for this laboratory is shown in the figure below. We have the WINDOWS host machine and the Zabbix server machine connected.
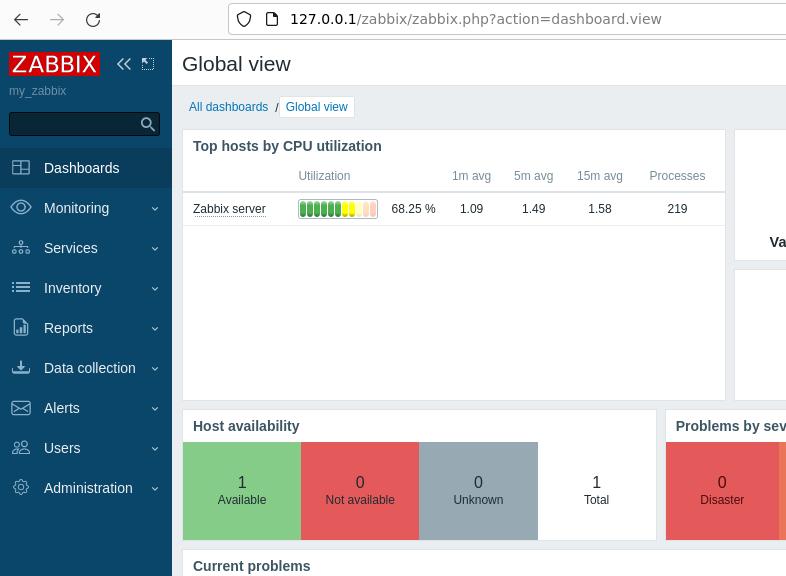
Let’s log into the machine where the Zabbix server is running and we can use the loopback IP “http://127.0.0.1/zabbix”.
http://127.0.0.1/zabbixNote. We can use another IP of the machine where the zabbix server is located to access the zabbix server’s WEB interface using another device. (In this case it would not be the loopback IP).
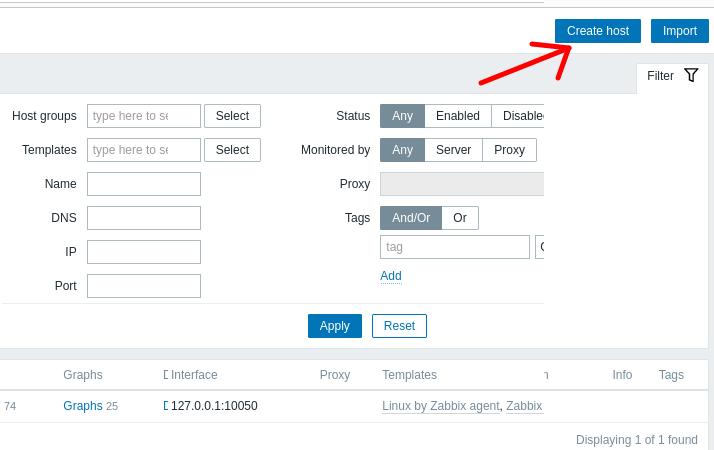
Next, let’s see the main screen of the Zabbix server as in the figure below.
Creating new WINDOWS host on Zabbix Server
Now let’s start the process of adding a host to zabbix. To do this, we will click on “Data Collection” and then on “Hosts” in the menu on the left.
Next, at the top of the screen, we will click on “Create host”.
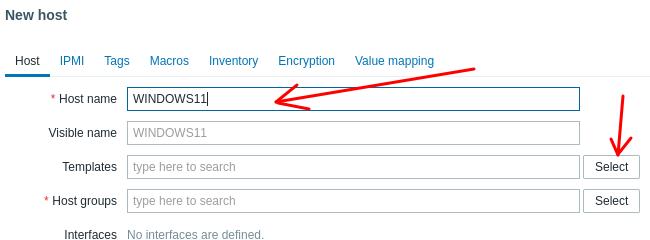
Now let’s see the hosts insertion screen. On this screen, we will give a name to the host we are going to monitor.
Here we will insert the name we gave to the machine in the zabbix agent. In our case, we use the name WINDOWS11 and we will use that same name here.
Next we will select the template and to do this we will click “Select”.
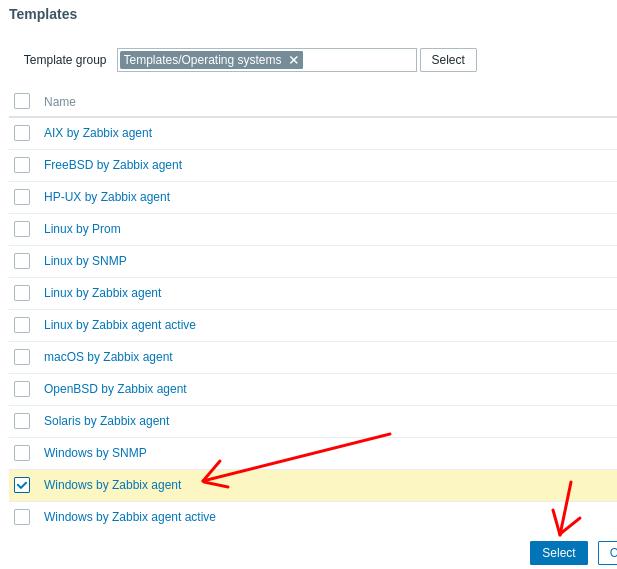
Let’s choose the type of template we are going to use. In our case, we are going to monitor a common machine and so we will choose to monitor based on the operating system. To do this, we will click on “Templates/Operating systems”.
Now, let’s select the “Windows by Zabbix agent” template and click on “Select”.
Now let’s add the host group that the new host will belong to. To do this, we will click on Select in the “Hosts groups”
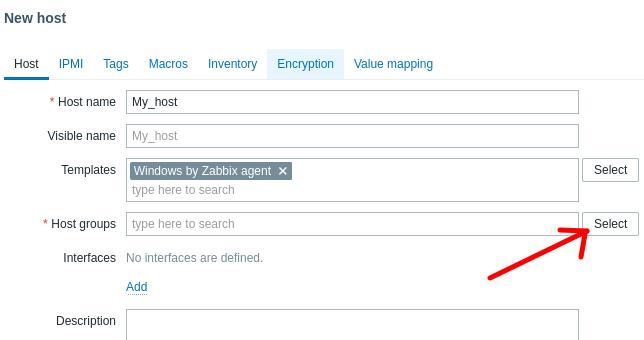
Next, we’ll choose a group for our host. In this case, we will choose the “Discovered hosts” group and then click on “Select”.
The next step is to add the interface. To do this, we will click on “Add” in the “interfaces” field.
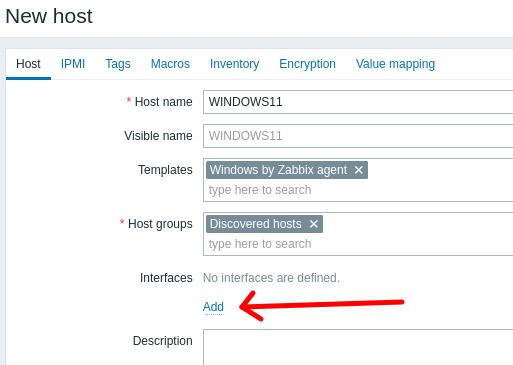
As we are going to use the zabbix agent on the host, we will choose the “Agent” option.
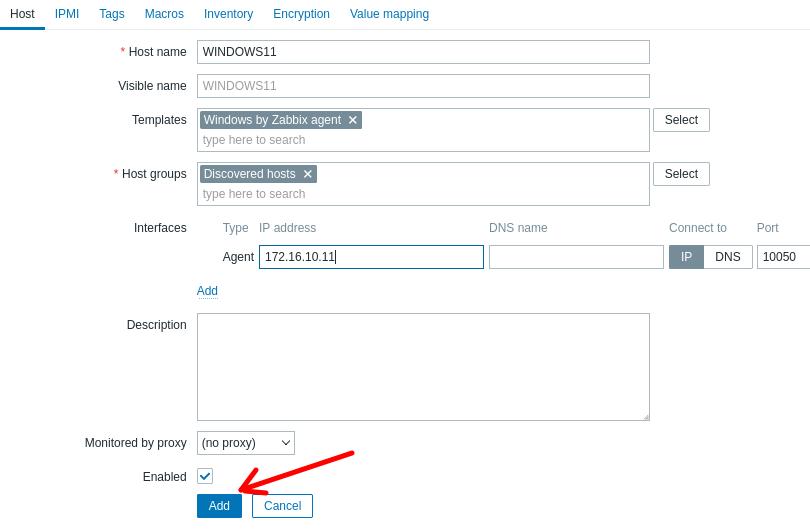
Now let’s enter the IP of the WINDOWS host we want to monitor. In our case, the host IP is “172.16.10.11”. After entering the host IP, we will click on “Add”.
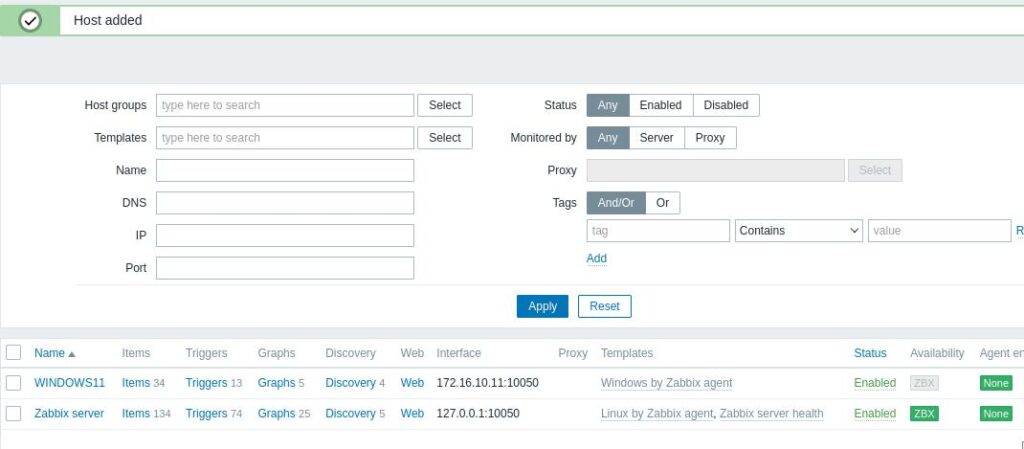
We can see that the WINDOWS11 host appears in the list below. However, we can check the “Availability” field is still not showing the host status in green.
To show the “Availability” field in green, press the F5 key or refresh the page.
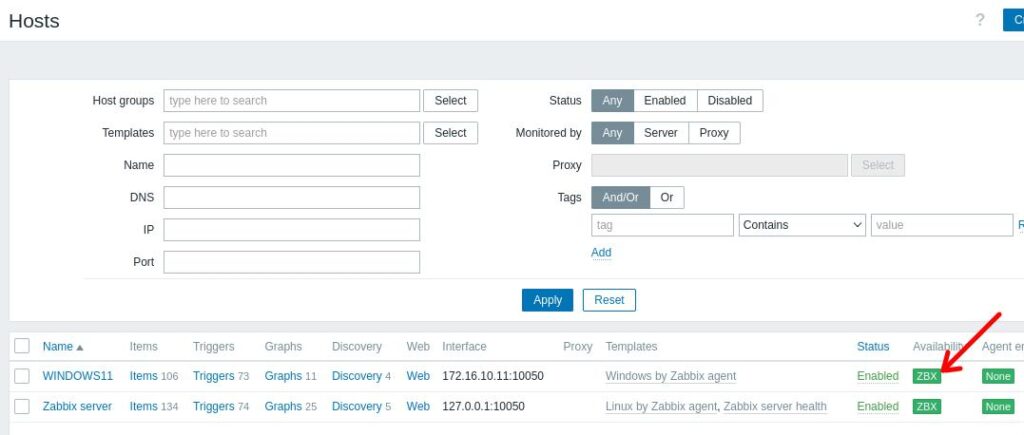
And we have completed the tutorial for adding and monitoring a Windows machine in Zabbix.
Add Host to Zabbix
Install Zabbix on Ubuntu
How to install Zabbix on Raspberry Pi

Juliana Mascarenhas
Data Scientist and Master in Computer Modeling by LNCC.
Computer Engineer
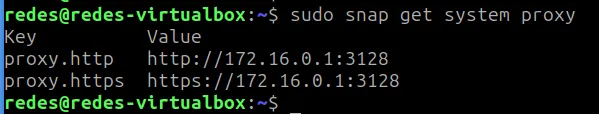
How to Use Snap Behind a Proxy on Linux (Step-by-Step Guide)
In this guide, you’ll learn how to configure Snap to work behind a proxy, even…
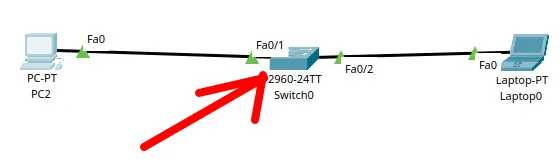
How to Create a Network with a Switch in Packet Tracer – Step-by-Step Guide for Beginners
In this practical tutorial, I will show you how to create a simple switch network…
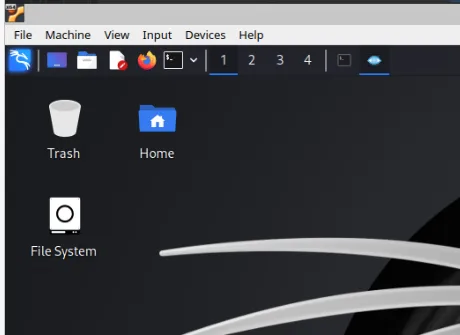
Why use Kali Linux inside VirtualBox?
In this article, we will see the main reasons for considering the use of Kali…
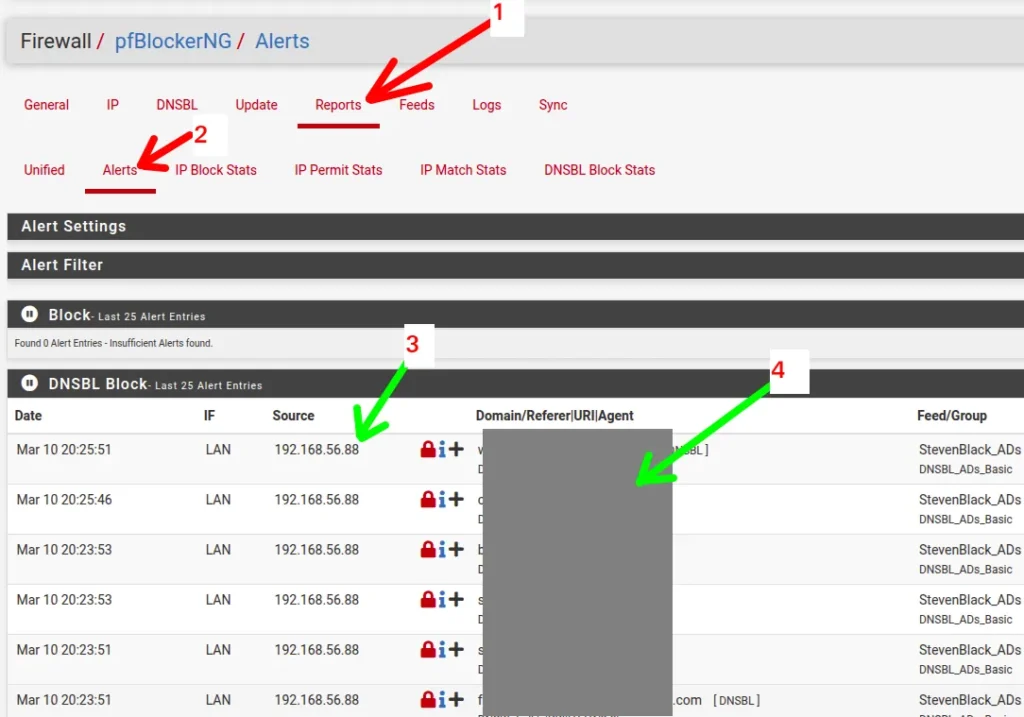
How to install pfBlocker on pfSense: step by step guide
Today we will learn how to install pfBLocker NG in PFSense. pfBLocker is an excellent…
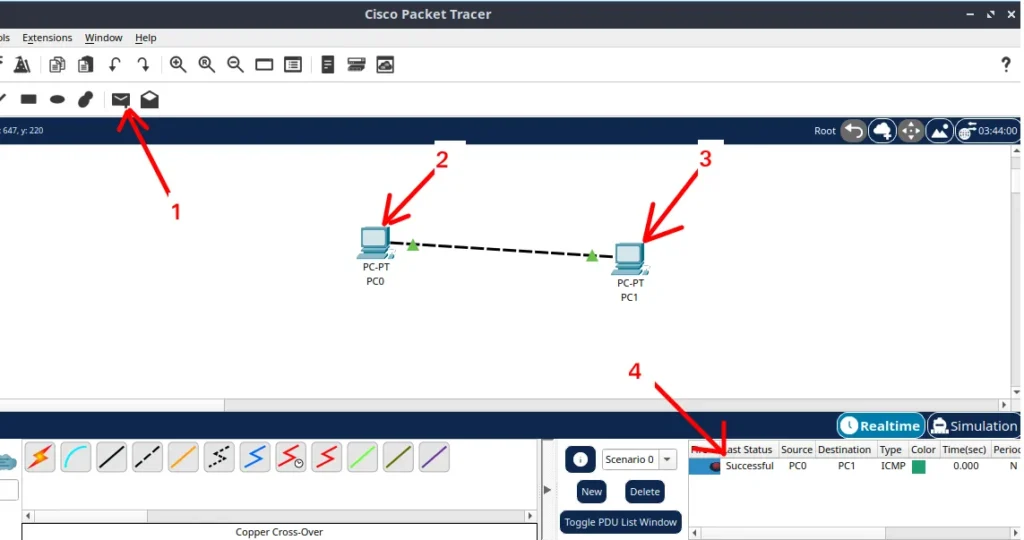
Packet Tracer for Dummies: Setting Up Your First Network with 2 PCs (Quick Start Guide)
Are you ready to take the first step into the fascinating world of computer networks?…
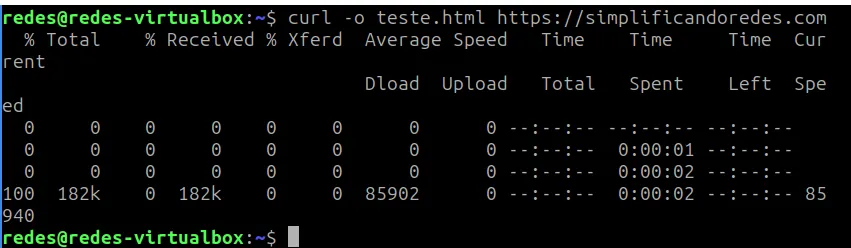
Learn how to use the curl command: tutorial with practical examples
Today we are going to learn about the curl command in Linux! This command is…
11.04.2024 |
11.04.2024 |
Категория Администрирование
В данном видео разберемся с основными возможностями системы мониторинга IT инфраструктуры предприятия Zabbix, а конкретно узнаем:
— какие устройства, приложения, службы и показатели можно мониторить?
— где скачать и как установить zabbix server и agent?
— какие операционные системы поддерживаются?
— централизованное управление и визуализация отображения данных
— обзор панелей мониторинга
— отображение объектов наблюдения на гео-карте
— использование встроенных шаблонов
— автоматические действия при возникновении проблем
Группа обучения КОСА + Zabbix
Zabbix Monitor Windows using Agent
Zabbix Monitor Windows using Agent
Would you like to learn how to do a Zabbix agent installation on Windows? In this tutorial, we are going to show you how to install and configure the Zabbix agent software on a computer running Windows.
• Zabbix version: 3.4.12
• Windows version: 2012 R2
Hardware List:
The following section presents the list of equipment used to create this Zabbix tutorial.
Every piece of hardware listed above can be found at Amazon website.
Zabbix Playlist:
On this page, we offer quick access to a list of videos related to Zabbix installation.
Don’t forget to subscribe to our youtube channel named FKIT.
Zabbix Related Tutorial:
On this page, we offer quick access to a list of tutorials related to Zabbix installation.
Tutorial — Zabbix Agent Installation on Windows

In our example, we download the Zabbix file: zabbix-3.4.12.tar.gz
Open the Windows Explorer application, navigate to the root of drive C and create a new directory.

The new directory name should be: zabbix

The Zabbix installation package usually is compacted using a TAR.GZ file extension.
Today, Windows is not able to open TAR.GZ extensions file.
Download and install 7ZIP or WINRAR to enable the Windows operating system to use TAR.GZ files.
Use a program like 7ZIP or WINRAR to extract the Zabbix installation package content.

In our example, we used the 7ZIP software.
Copy the content of the following Zabbix installation package: zabbix-3.4.12\bin\win64
Paste the content of the inside the folder that we created before: C:\zabbix

Copy file zabbix_agentd.win.conf from the following Zabbix installation package folder: zabbix-3.4.12\conf
Paste the file zabbix_agentd.win.conf inside the folder that we created before: C:\zabbix
Open the WORDPAD application and edit the zabbix_agentd.win.conf configuration file.
The file zabbix_agentd.win.conf is locate inside the C:\Zabbix folder.

Delete all the content of the configuration file and enter the following directives:
Server=127.0.0.1,200.200.200.200
ServerActive=200.200.200.200
Logfile=C:\zabbix\zabbix_agent.log
Save the configuration file and exit the WORDPAD application.
In our example, the Zabbix agent is configured to allow the connection of the Zabbix server 200.200.200.200.
The server with the IP address 200.200.200.200 is allowed to request and receive information from the agent.
The Localhost, 127.0.0.1, is allowed to request and receive information from the agent.
After finishing the configuration, open a DOS elevated command prompt.
Enter the following command to install the Zabbix agent service on Windows.
c:\zabbix\zabbix_agentd.exe —config c:\zabbix\zabbix_agentd.win.conf —install
If everything was done correctly, you should see the following messages
zabbix_agentd.exe [4508]: service [Zabbix Agent] installed successfully
zabbix_agentd.exe [4508]: event source [Zabbix Agent] installed successfully
The Zabbix agent was installed on your computer but we need to start the service manually.
You only need to start the service manually the first time after the installation.
Open the Windows service management screen and start the Zabbix agent service.

Open the zabbix_agent.log file to verify the Zabbix agent log file.
If the Zabbix agent was started successfully, you should see a message similar to this.
4964:20180808:190920.442 Starting Zabbix Agent [WINDOWS-SERVER-01]. Zabbix 3.4.12 (revision 83216).
4964:20180808:190920.442 **** Enabled features ****
4964:20180808:190920.442 IPv6 support: YES
4964:20180808:190920.442 TLS support: NO
4964:20180808:190920.442 **************************
4964:20180808:190920.442 using configuration file: c:\zabbix\zabbix_agentd.win.conf
4964:20180808:190920.442 agent #0 started [main process]
4764:20180808:190920.442 agent #2 started [listener #1]
4856:20180808:190920.442 agent #1 started [collector]
4340:20180808:190920.442 agent #3 started [listener #2]
4400:20180808:190920.442 agent #5 started [active checks #1]
5016:20180808:190920.442 agent #4 started [listener #3]
Congratulations! you have installed the Zabbix agent on a computer running Windows
Keep in mind that your Windows firewall application needs to accept connections from the Zabbix server.
The Windows firewall should accept network packets on TCP port: 10050
You can now use the Zabbix server dashboard to add this computer to the network monitoring service.
Tutorial — Zabbix Monitor Windows
Now, we need to access the Zabbix server dashboard and add the Windows computer as a Host.
Open your browser and enter the IP address of your web server plus /zabbix.
In our example, the following URL was entered in the Browser:
• http://35.162.85.57/zabbix
On the login screen, use the default username and default password.
• Default Username: Admin
• Default Password: zabbix
After a successful login, you will be sent to the Zabbix Dashboard.

On the dashboard screen, access the Configuration menu and select the Host option.

On the top right of the screen, click on the Create host button.
On the Host configuration screen, you will have to enter the following information:
• Host Name — Enter a Hostname to identify the Windows server.
• Visible Hostname — Repeat the hostname.
• New group — Enter a name to identify a group of similar devices.
• Agent Interface — Enter the IP address of the Windows server.
Here is the original image, before our configuration.

Here is the new image with our configuration.

Next, we need to associate the host with a specific network monitor template.
By default, Zabbix comes with a large variety of monitoring templates.
Access the Templates tab on the top of the screen.
Click on the Select button and locate the template named: TEMPLATE OS Windows

Click on the Add button (1).
Click on the Add button (2).
After a few minutes, you will be able to see the initial result on the Zabbix Dashboard.
The final result will take at least one hour.
By default, Zabbix will wait 1 hour to discover the number of interfaces available on the Windows computer.
By default, Zabbix will wait 1 hour before collect information from the network interfaces.
In order to test your configuration, access the Monitoring menu and click on the Graphs option.

On the top right of the screen, select the group named ALL.
Select your Windows computer host name.
Select the graph named: CPU UTILIZATION
You should be able to see the graphic of CPU utilization.

Congratulations! You have configured the Zabbix server to monitor a Windows computer.
VirtualCoin CISSP, PMP, CCNP, MCSE, LPIC22019-06-11T10:57:47-03:00
Related Posts
Page load link
Ok