
Температура процессора — один из ключевых показателей, влияющих на производительность и долговечность вашего компьютера. Перегрев может привести к снижению скорости работы, неожиданным перезагрузкам и даже к поломке компонентов.
Зачем знать
Какой должна быть
Как узнать
На Linux
На macOS
Как снизить
Чек-лист
Зачем знать
Какой должна быть
Как узнать
На Linux
На macOS
Как снизить
Чек-лист
В этом руководстве мы расскажем, как посмотреть температуру процессора на ноутбуке или ПК с операционными системами Windows 7, 10, 11, Linux или macOS. Вы узнаете, как проверить температуру процессора с помощью специализированных программ, через командную строку или BIOS.
Зачем знать температуру процессора

Контроль температуры процессора важен по нескольким причинам:
- Предотвращение перегрева и поломок. Высокая температура может привести к перегреву процессора, что в свою очередь может вызвать аварийное отключение компьютера или его зависание. Постоянный перегрев также ускоряет износ компонентов.
- Оптимизация производительности. При перегреве процессор может автоматически снижать свою тактовую частоту, чтобы уменьшить выделение тепла. Это явление называется троттлингом и приводит к снижению производительности системы.
- Удлинение срока службы компонентов. Поддержание оптимальной температуры помогает продлить срок службы процессора и других компонентов компьютера. Высокие температуры могут повредить не только процессор, но и другие важные элементы системы.
Какой должна быть температура процессора

Температура процессора является важным показателем его работоспособности и долговечности. В целом, в норме температура процессора должна быть в пределах 30−40°C в состоянии простоя и до 70−80 °C под нагрузкой. Однако эти значения могут варьироваться в зависимости от модели процессора и условий эксплуатации.
- В состоянии простоя, когда компьютер не выполняет интенсивные задачи, температура процессора обычно находится в диапазоне от 30 до 45 . Это нормальный уровень, который не вызывает беспокойства и не требует дополнительных мер по охлаждению.
- При выполнении ресурсоемких задач, таких, как игры, рендеринг видео или работа с большими объемами данных, температура процессора может повышаться до 70−80 °C. Это допустимый уровень, но важно следить за тем, чтобы температура не превышала эти значения, так как это может привести к перегреву и снижению производительности.
- Максимальная допустимая температура для большинства современных процессоров составляет около 90−100 °C. При достижении этих значений процессор может автоматически снижать свою тактовую частоту (троттлинг) или даже отключаться, чтобы предотвратить повреждение.
Способы узнать температуру процессора на ПК с Windows
Существует несколько способов узнать температуру процессора на ПК с Windows. Одни предполагают использование специализированного софта, другие позволяют обойтись и без них. Рассмотрим все способы подробнее.
Без программ
Для того, чтобы посмотреть текущую температуру ЦП, необязательно даже устанавливать специальные утилиты. Достаточно воспользоваться командной строкой или зайти в BIOS.
Через командную строку
- Нажмите комбинацию клавиш Win+R, введите cmd и нажмите Enter.
- Введите следующую команду и нажмите Enter:
wmic /namespace:\\root\wmi PATH MSAcpi_ThermalZoneTemperature get CurrentTemperature
Температура будет отображена в градусах Кельвина. Для перевода в Цельсий используйте формулу: t°C = t°K — 273,15
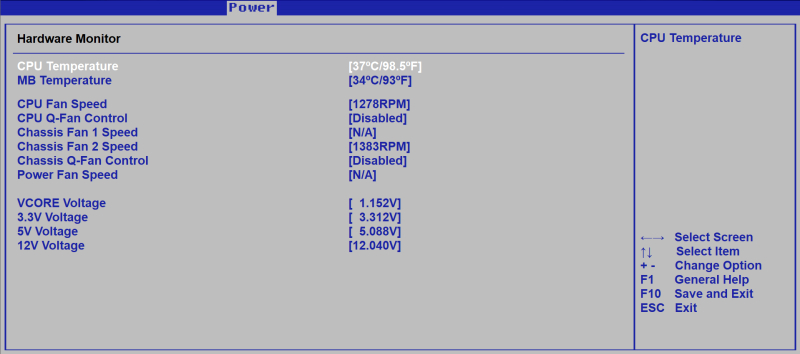
Через UEFI (BIOS)
- Сразу после включения компьютера нажмите клавишу для входа в UEFI (обычно это Del, F2, Esc или F10).
- В UEFI найдите раздел Hardware Monitor или System Health, где будет отображена температура процессора в реальном времени.
С помощью программ
Среди утилит для мониторинга состояния «железа» наиболее популярны три: AIDA 64, MSI Afterburner и SpeedFan.
AIDA64
- Скачайте программу с официального сайта и установите ее.
- Перейдите в раздел «Компьютер» > «Датчики».
- В разделе датчиков будет указана температура процессора и других компонентов в реальном времени.
MSI Afterburner
- Скачайте программу с официального сайта и установите ее.
- В настройках программы включите отображение температуры процессора.
- Температура будет отображена на панели задач.
SpeedFan
- Скачайте программу с официального сайта и установите ее.
- Перейдите в раздел «Температуры».
- В разделе температур будет указана температура процессора и других компонентов.
Методы проверки температуры процессора на Linux

На Linux существует несколько способов проверки температуры процессора, включая использование командной строки и графических приложений. Рассмотрим их подробнее.
Использование командной строки
- Откройте терминал и введите команду для установки необходимых пакетов: sudo apt install lm-sensors hddtemp.
- Запустите сканирование датчиков. Введите команду: sudo sensors-detect.
- Ответьте Yes на все запросы для завершения сканирования.
Чтобы посмотреть температуру, введите команду sensors. Эта команда отобразит текущую температуру процессора и других компонентов.
Для постоянного мониторинга используйте команду watch sensors. Эта команда будет обновлять данные каждые две секунды.
Использование Psensor
- Введите команду для установки приложения: sudo apt install psensor.
- После установки запустите приложение Psensor.
В настройках Psensor можно включить отображение температуры процессора в панели задач.
Как посмотреть температуру процессора на macOS

На macOS существует несколько способов проверки температуры процессора, включая использование встроенных инструментов и сторонних приложений. Рассмотрим их подробнее.
Использование Terminal
- Найдите Terminal через Spotlight или в папке «Программы» > «Утилиты».
- Введите следующую команду и нажмите Enter: sudo powermetrics —samplers smc |grep -i «CPU die temperature».
- Введите пароль администратора, когда будет запрошено.
Температура процессора будет отображена в списке значений.
Использование приложения Hot
- Скачайте приложение Hot с сайта разработчика iMazing.
- Запустите приложение Hot, и его иконка появится в меню.
Температура процессора будет отображена рядом с иконкой в меню. Вы также можете настроить отображение температуры в градусах Цельсия или Фаренгейта.
Как можно снизить температуру процессора

Снижение температуры процессора важно для поддержания его производительности и долговечности. Рассмотрим несколько эффективных методов.
1. Очистка системы охлаждения
Регулярная очистка вентиляторов и радиаторов от пыли помогает улучшить охлаждение. Пыль может замедлять вращение вентиляторов и снижать эффективность охлаждения. Используйте баллончик со сжатым воздухом для очистки вентиляторов и радиаторов.
2. Замена термопасты
Термопаста помогает улучшить теплопередачу между процессором и радиатором. Со временем она может высыхать и терять свои свойства. Рекомендуется менять термопасту каждые пару лет.
3. Улучшение вентиляции корпуса
Обеспечьте хорошую циркуляцию воздуха внутри корпуса. Убедитесь, что кабели не препятствуют продуваемости, и установите дополнительные вентиляторы, если это необходимо. Также важно, чтобы корпус компьютера находился в хорошо вентилируемом месте.
4. Оптимизация настроек питания
Снижение максимальной мощности процессора может помочь уменьшить его температуру. В Windows это можно сделать через настройки питания:
- Откройте «Панель управления» и выберите «Электропитание».
- Измените план питания на «Сбалансированный».
- Если это не поможет, то выберите план «Экономия энергии».
5. Использование качественного кулера
Инвестиции в качественный процессорный кулер могут значительно снизить температуру процессора. Существуют различные модели кулеров, которые обеспечивают более эффективное охлаждение по сравнению со стандартными. В первую очередь стоит присмотреться к башенным разновидностям.
Чек-лист: как посмотреть температуру процессора
Для удобства и быстроты проверки температуры процессора, следуйте следующему чек-листу:
- Используйте приложение SpeedFan для Windows, Psensor для Linux или Hot для macOS.
- Чтобы перевести температуру в кельвинах в градусы Цельсия, используйте формулу t°C = t°K — 273,15.
- В общем случае нормальной считается температура ЦП в пределах 30−40 °C в состоянии простоя и до 70−80 °C под нагрузкой.
- Если температура вашего процессора превышает вышеназванные пределы, то, скорее всего, есть проблемы с охлаждением.
- Чтобы снизить температуру процессора, замените кулер и улучшите вентиляцию корпуса.
Discover the top 6 apps for monitoring CPU temperature.
Published
6 min read
6 Best Apps to Check CPU Temperature in Windows 11/10
Monitoring your CPU temperature is a vital part of maintaining the health and longevity of your system. Whether you are a casual user, a gamer, or a professional who relies on an efficient machine, keeping an eye on your CPU temperature can help prevent overheating and enhance performance. This necessity becomes even more critical with the advent of Windows 11 and the continuous evolution of Windows 10, where users may seek new and better tools to manage their systems. Here, we will explore six of the best apps available for checking CPU temperature in Windows 11/10, detailing their features, ease of use, and what makes them stand out from the rest.
1. Core Temp
Core Temp is a lightweight and reliable tool that focuses solely on monitoring CPU temperature. It’s user-friendly and allows users to check the temperature of individual CPU cores, which is particularly useful for those with multi-core processors.
Features:
- Real-time Monitoring: Core Temp provides real-time temperature readings directly from the CPU sensors, allowing users to see temperature fluctuations in real time.
- Customizable Interface: You can personalize the application’s interface according to your needs, making it as simple or as detailed as you wish.
- Logging: It offers a logging option that can save temperature data to a file, allowing users to track changes over time.
- Alerts: Users can set temperature alerts to warn them if their CPU exceeds a specified temperature threshold.
How to Use:
- Download and install Core Temp from the official website.
- Open the application; the main window will display the current temperature of each core from your CPU.
- Configure settings if necessary, such as alerts and logging options.
Core Temp is particularly great for users who desire a straightforward solution without unnecessary complications, retaining an efficient and uncluttered interface.
2. HWMonitor
HWMonitor is an excellent application that not only checks CPU temperature but also monitors voltages, fan speeds, and other vital system components. This comprehensive approach makes it a favorite among PC enthusiasts.
Features:
- Comprehensive Monitoring: Apart from CPU temperature, it provides information regarding the temperature of other components like GPUs, hard drives, and motherboard sensors.
- Sensor Monitoring: It supports a wide range of sensors and can read the health status of various components.
- Graphical Interface: HWMonitor presents the data in a user-friendly way, making it easy to navigate and find information.
- Portable Version: HWMonitor also has a portable version that doesn’t require installation, making it easy to run from a USB stick.
How to Use:
- Download HWMonitor from the official website.
- Launch the application to see a detailed report of all monitored components.
- Look for the CPU section to find temperature readings along with those of other parts.
HWMonitor is perfect for users who like tracking multiple aspects of their system performance, ensuring a holistic view of their PC’s health.
3. Speccy
Developed by the team at Piriform, Speccy is a powerful system information tool that provides detailed insights into your computer’s hardware and temperature readings.
Features:
- System Overview: Speccy gives an easy-to-understand overview of your system components, including CPU, RAM, motherboard, graphics card, and more.
- Temperature Display: It displays real-time temperature information for CPU, motherboard, and other key components.
- Snapshots: You can save snapshots of your computer’s current state and temperature readings for diagnostics or future reference.
- User-Friendly Interface: The graphical interface makes it easy for users of all experience levels to navigate and understand.
How to Use:
- Download and install Speccy from the official website.
- Open the program, and it will initiate an analysis of your system’s hardware.
- Within a few moments, all relevant details, including temperature readings, will be displayed in an organized manner.
Speccy stands out for its clean design, making it accessible even to users who may not be particularly tech-savvy.
4. Real Temp
Real Temp is another specialized application focusing on CPU temperature monitoring. It’s particularly effective for Intel processors, providing accurate temperature readings and a clean interface.
Features:
- Core Temperature Display: Real Temp shows the temperature of each CPU core and offers a temperature range specific to Intel CPUs.
- Thermal Throttling Alert: This feature alerts users when their CPU begins thermal throttling due to high temperatures, allowing for proactive management.
- Logging and Graphs: The software logs temperature readings and displays them in graphical format, allowing users to track temperature changes over time.
- Test for Maximum Temp: Real Temp can conduct a maximum temperature test, providing insight into how hot the CPU can get under stress conditions.
How to Use:
- Download Real Temp from its official site.
- Start the application to see each core’s current temperature along with maximum and minimum readings.
- Set up logging if you wish to keep detailed records of your CPU’s temperature over time.
Real Temp is particularly suitable for Intel users looking for no-frills monitoring tailored to their specific CPUs.
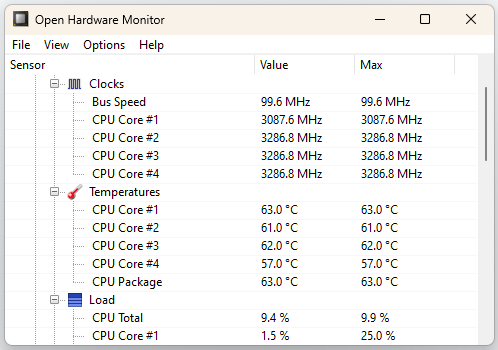
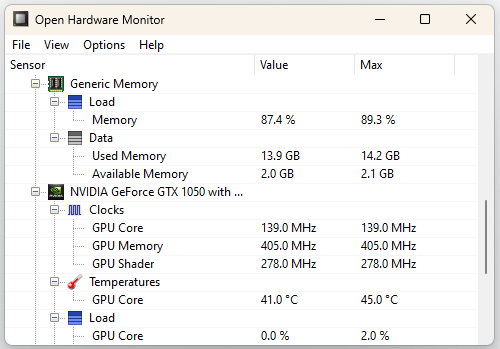
5. Open Hardware Monitor
Open Hardware Monitor is an open-source application that monitors various hardware elements, from CPU temperatures to fan speeds and voltages. It provides extensive information while being completely free to use.
Features:
- Open Source: Being open-source, the program is free to use and modify, attracting users who prefer community-driven projects.
- Cross-Platform Compatibility: In addition to Windows, it also works on other operating systems, making it versatile.
- Multiple Component Monitoring: Open Hardware Monitor doesn’t just show CPU temperatures but also temperatures of hard drives, motherboard components, and other hardware.
- Widgets and Panel Support: You can create desktop widgets to keep your CPU temperature visible at all times.
How to Use:
- Download Open Hardware Monitor from the official website.
- Launch the program, and it will automatically detect your hardware components.
- Navigate to the CPU section for a detailed temperature report.
Open Hardware Monitor is a fantastic choice for tech enthusiasts who appreciate an all-in-one solution that goes beyond simple temperature monitoring.
6. MSI Afterburner
Although primarily developed for overclocking graphics cards, MSI Afterburner has also evolved into a robust system monitoring tool. This app provides detailed insights into CPU temperature and performance metrics while being user-friendly.
Features:
- Comprehensive Monitoring: MSI Afterburner displays temperature data not just for the CPU but also for the GPU, offering detailed insights into your machine’s performance.
- Overclocking Capabilities: The application includes controls for adjusting GPU settings, making it suitable for gamers and overclockers.
- Hardware Monitoring: You can create personalized monitoring graphs for CPU, GPU, and RAM usage along with temperature readings.
- Customizable Interface: Users can adjust the layout and what stats to monitor, allowing for a tailored experience.
How to Use:
- Download MSI Afterburner from the official website and install it.
- Open the application, and familiarize yourself with the interface.
- Click on the monitoring tab to adjust which readings you’d like to see on the main screen, including CPU temperatures.
MSI Afterburner is the ideal option for gamers and those who occasionally push their systems to the limit, providing the tools they need for monitoring performance effectively.
Conclusion
Monitoring CPU temperature is not just a technical requirement but a necessary practice for every Windows user who aims for longevity and performance from their machines. The applications listed above provide a variety of features catering to both casual users and performance enthusiasts. By choosing the right tool for your specific needs, you can efficiently track your CPU’s health, prevent overheating, and optimize your system for better performance. Whether you prefer simple interfaces or in-depth monitoring, these six apps offer something for everyone on Windows 11 and Windows 10.
Timesaver Summary
- There are no built-in apps to check CPU temperature in Windows 11. If you are tech-savvy and want to get precise CPU data directly from hardware thermal indicators, use the BIOS menu. Here are quick instructions. Be careful—this process is time-consuming, requiring you to restart your laptop and enter system mode. You will get accurate data, but not all laptop manufacturers provide it, and it may not be as informative. Additionally, you might not be able to check CPU data under load, such as while playing games or using other software.
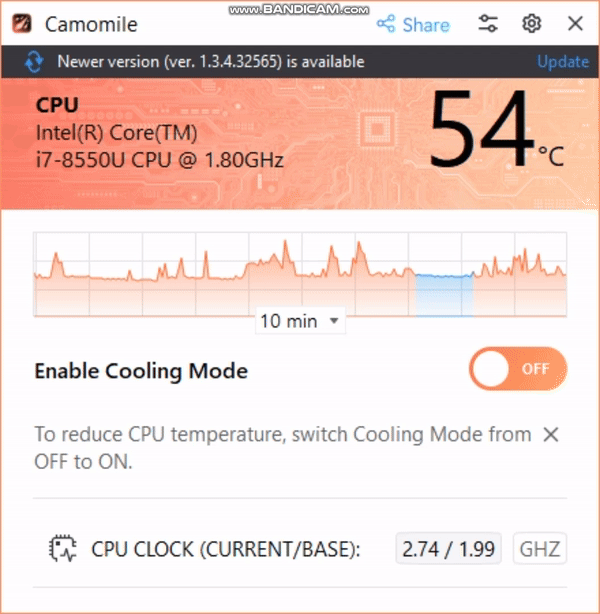
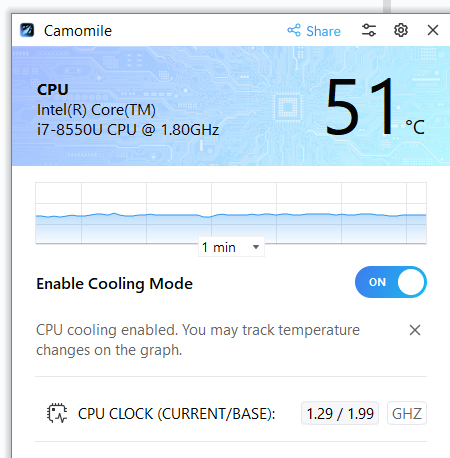
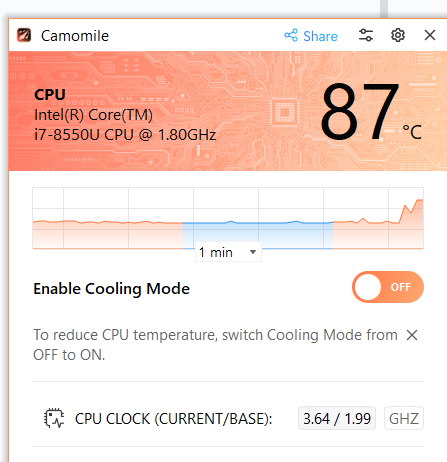
- We researched all the apps you can download to find the temp data, and here is a summary table. The best option for both newbies and tech geeks is the Camomile app. It is free, optimized for Windows 11, easy to use, and shows temperature data within ~1 minute. You can monitor CPU data dynamically, and it can apply tweaks to cool down the CPU temperature with one click.
Download Camomile and check CPU tempThe best part—Camomile is a free CPU optimizer. The app monitors the CPU cores’ temperature and dynamically distributes tasks to the coolest ones – this way CPU cores avoid overheating and you forget about temperature spikes and throttling.

Camomile doesn’t make any critical changes to the registry, and all changes can be reversed. It doesn’t create new keys or paths in the registry, which means there is no risk of system conflicts with other applications.
- If you need a quick option, just pick Speccy. You get the temperature data in 1 minute—super easy and straightforward. This utility provides a comprehensive overview of your PC specs (CPU, RAM, motherboard, hardware settings, compatibility, etc.) and nothing more. There is no option of optimizing your system with any additional settings.
Concerns About Using Third-Party Apps
Apps that check CPU temperature on a PC work by reading data from thermal sensors embedded in the CPU and other hardware components. These sensors provide real-time temperature information through the system’s hardware monitoring interfaces, such as SMBus (System Management Bus) or PECI (Platform Environment Control Interface).
The CPU data is displayed in an easy-to-read format within the application, allowing users to monitor their CPU’s thermal performance. However, the biggest concern is that this kind of software uses low-level system calls to access these interfaces and retrieve temperature data. This level is also known as Kernel level, and applications with such access have total control of PC data, including all software and hardware settings and any data stored on the PC.

It is a concern that when you get applications to check CPU temperature, the elevated access rights can potentially allow them to infect a PC with malware, steal personal data, or even change hardware settings to the extent that would make the computer unusable with no way to recover.
If you decide to use any apps to check CPU data, you should be very careful when choosing the provider, and always double-check the risks.
Best Apps for Monitoring CPU Temperature on Windows 11: A Comparative Table
Best Software to Check CPU Temperature on Windows 11
A Comparative Table
| Tool | Effort to check CPU t° | Overview | Platforms, Chipsets |
|---|---|---|---|
| #1 Camomile Read Review |
Easy! 1 minute to install and check. Download Camomile |
The best solution – Shows real time CPU temperature – Optimizes CPU temperature spikes and PC performance – Temperature data in the tray – Totally free and safe. |
Windows (11, 10). 32/64-bit. AMD, Intel |
| #2 Speccy Read review |
Easy! 1 min through all to the end. | Good solution – Average CPU temp data + each core data. – Temp data in the traySpecs of other hardware components ❌Security concerns: outdated installation certificate |
Windows (11, 10, 8.1, 8, 7, Vista, and XP). 32/64-bit. AMD, Intel |
| #3 MSI Afterburner Read review |
Average. Shows GPU temperature by default. | Good solution – Real-time CPU and GPU temperature indicators – On-Screen Display (OSD) to check temperature while gaming – GPU overclocking settings ❌ Long path to check CPU data. |
Windows (11, 10, 8, 8.1, 7), 32/64-bit support AMD, Intel |
| #4 HWINFO Read review |
Average. ~3 minutes through to the end. | Good solution – Average CPU temp data + each core data – Alerts about high CPU temperaturesHardware monitoring and specs (RAM, motherboard, GPU) – Benchmark to measure CPU under different conditions ❌Heavy and not so friendly interface, best for tech pros |
Windows (11, 10, 8, 8.1, 7), 32/64-bit AMD, Intel |
| #5 Core Temp Read review |
Average. ~1 min installation but don’t forget to untick the autoinstall of a third-party game. | – Real-time CPU data for each individual coreTray icons with temp data – System logs and alerts ❌Outdated certificate for the installation file ❌Third party software (games) offered during the installation process. |
Windows (11, 10, 8, 7, XP), Windows Server 2003-2022, 32/64-bit support AMD, Intel, VIA x86 |
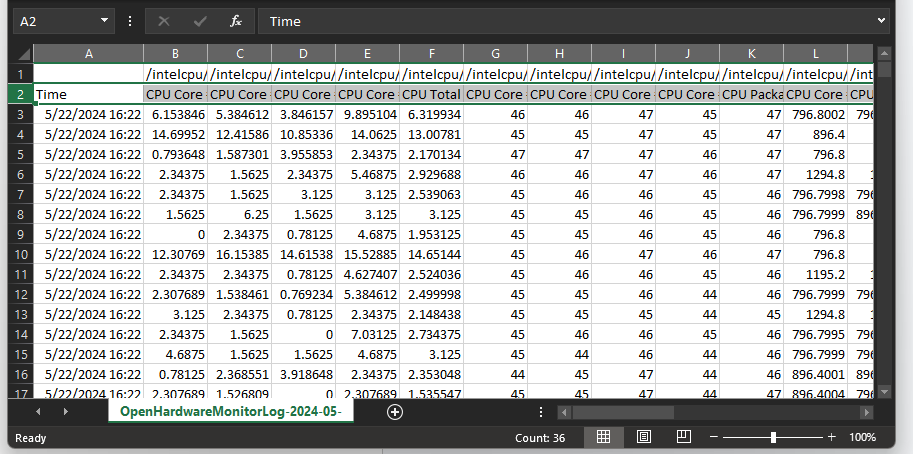
| #6 Open Hardware Monitor Read review |
Easy! ~1 minute to unzip the app. No need to install it. | – Detailed system data about all hardware components: CPU, GPU, Motherboard, RAM – Logs in Excel ❌Potential security issues like with any other open-source application |
Windows (11, 10, 8.1, 8, 7), 32/64-bit, Linux Intel, AMD |
| #7 Intel Extreme Tuning Utility Read review |
Easy! ~2 minutes through to the end | – Real-time monitoring of CPU temperatures, divided by cores – Temperature thresholds and alerts – Thermal throttling flags – Stress tests of CPU under load – Overclocking settings – Create and switch performance plans – Benchmarking tools ❌ Limited set of eligible models with Intel processors |
Windows 10 (22H2), Windows 11 (21H2, 22H2, 23H2) Intel processors (K- and X-series) |
| #8 Ryzen Master Read review |
Average. ~5 minutes. Easy but time-consuming due to a heavy installation file (268 MB) | – Real-time monitoring of CPU temperatures, voltages, and speeds – Overclocking capabilities – Profiles for custom configurations ❌ Limited set of eligible models with AMD processors |
Windows 10, Windows 11 AMD only (limited set of models) |
Outbyte Camomile
| Platform Support: | Windows 11, 10 |
| Chipset Support: | AMD, Intel |
| Price: | Totally free |
| Security: | Certificate valid till 10/14/2034 |

Effort to Check CPU Temperature
The lightweight installation file is quick and easy to set up, occupying 55MB on your hard drive. It takes about 2 minutes to download and run the app, with the CPU temperature displayed on the main screen.
CPU Temperature Features
- Dynamic CPU Temperature Indication: Always shows the current temperature of the hottest core for accurate data, unlike other utilities that display average temperatures. Only the highest temperature of your cores, not the average, affects the thermoregulation process on your PC, determining how fans operate and throttling settings come into effect.
- Tray Menu Display: Easily check current CPU temperature while using other apps.
- Temperature History: Shown via graphs in the main menu, with 1-10 minute intervals.
Other Features for CPU and Performance Optimization
- One click CPU optimization: Camomile helps prevent CPU overheating through implementing the mechanism that checks the frequency dynamics of each CPU core. If a core runs at excessive CPU frequency while performing a task, Camomile switches this task to the cooler core. This is done so quickly that no core gets the chance to experience excessive frequency, which effectively prevents CPU temperature spikes. As a result, the CPU gets a performance boost.
- Safe and secure CPU tweaks: Traditional tweaks to improve PC performance through overclocking enable the system to handle more demanding tasks or run applications faster, but carry the risk of crashing hardware components or system instability. You can find GPU overclocking settings in XTU, AMD Ryzen Master or MSI Afterburner.
Camomile doesn’t implement any risky optimization settings – just smart algorithms that help avoid excessive CPU frequencies. It means no potential harm to hardware or system performance.
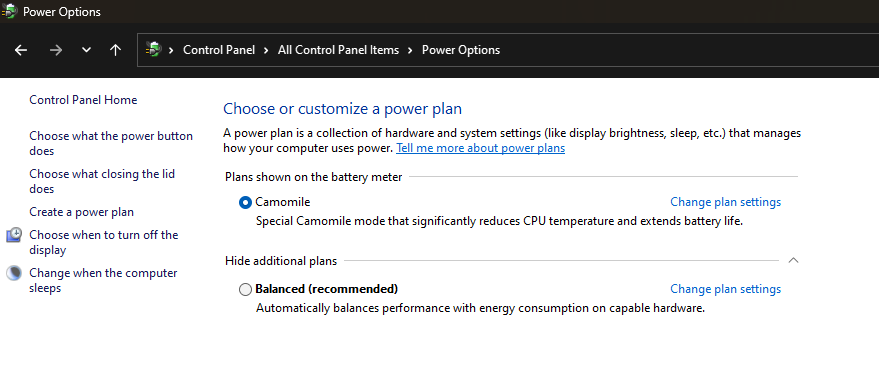
All changes made by Camomile come as a separate Windows power plan (Control Panel > All Control Panel Items > Power Options). That means, if you feel something wrong about Camomile settings or effects, just delete the Camomile power plan and you will reset all the changes.
Looking deeper into the logs and changes that Camomile creates in the registry (here is the source file), there is nothing to worry about. All changes occur in standard registry folders, no new keys or registry paths are created, which could otherwise potentially create conflicts with other keys or registry paths. That is why you can easily reverse all of the changes by simply deleting the Camomile power plan.
There is no need to clean the registry after deactivating – there are no files or folders being left after deletion, which makes Camomile an amazingly safe and clean app.
Basic Overview of the Software
Overall, Camomile is a top-choice app for CPU temperature checks and quick but efficient optimization. The only disadvantages could be its limited range of supported Windows OS versions (only Windows 11 and 10) and the lack of settings to show CPU temperature in a separate layer.
P.S.
You can see how gamers can optimize CPU temperature while gaming with Camomile software:
Speccy
| Platform Support: | Windows only (11, 10, 8.1, 8, 7, Vista, and XP). 32/64-bit |
| Chipset Support: | AMD, Intel |
| Price: | Free version available. Premium version – $19.95 |
| Security: | Outdated certificate for the installation file, expired on 10/18/2022 |
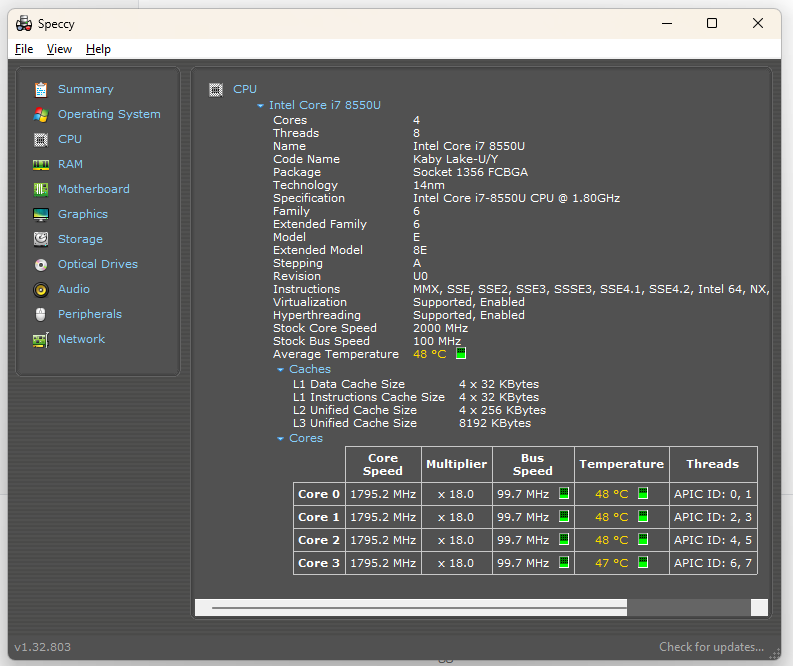
Effort to Check CPU Temperature
It takes about 1 minute from visiting the website to seeing the final results. The installation file is 3MB and sets up quickly. However, it could be easier—the installation file was flagged as not secure by the browser, requiring additional steps to download.
CPU Temperature Features
- Real-time CPU temperature monitoring, displayed in the main interface and optionally in the system tray.
- View the temperature of each CPU core and the average CPU temperature across all cores.
Other Features for CPU and Performance Optimization
- Comprehensive CPU details, including model, manufacturer, core count, clock speed, and cache sizes.
- Insights into current CPU performance and compatibility with other hardware components.
- Core specifications for other hardware components: hard drive, motherboard, GPU, etc.
- Users can save snapshots of their system’s state, including CPU data, to track performance over time and document changes like new cooling solutions or RAM upgrades.
Basic Overview of the Software
Speccy is valuable for a wide range of users, from casual PC owners to tech enthusiasts and IT professionals. It simplifies the process of diagnosing hardware issues, planning upgrades, and verifying system configurations. By consolidating all essential information in one place, Speccy saves time and effort compared to manually gathering data from multiple sources.
We didn’t like it that the installation file’s certificate expired in 2022, which makes the installation process longer and raises concerns about the app’s security.
MSI Afterburner
| Platform Support: | Windows (11, 10, 8.1, 8, 7), 32/64-bit |
| Chipset Support: | AMD, Intel |
| Price: | Totally Free |
| Security: | Installation file certificate is valid till 10/16/2025 |
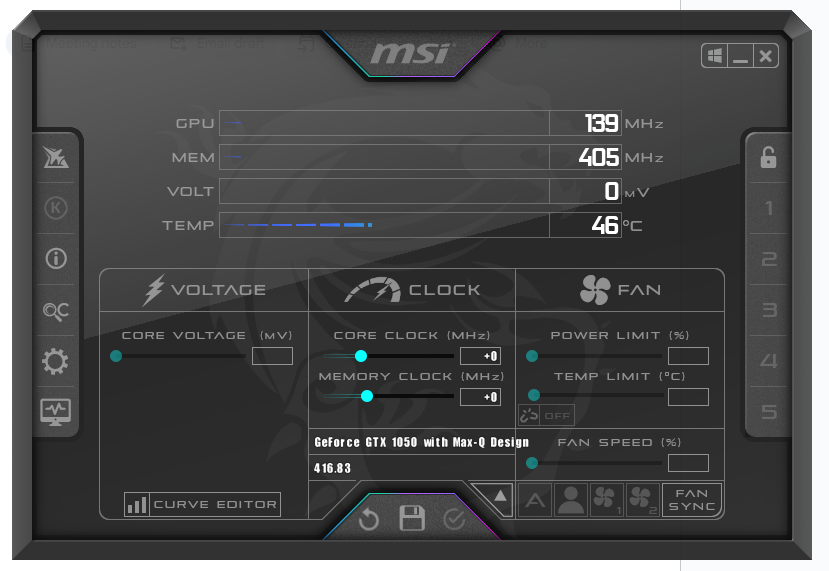
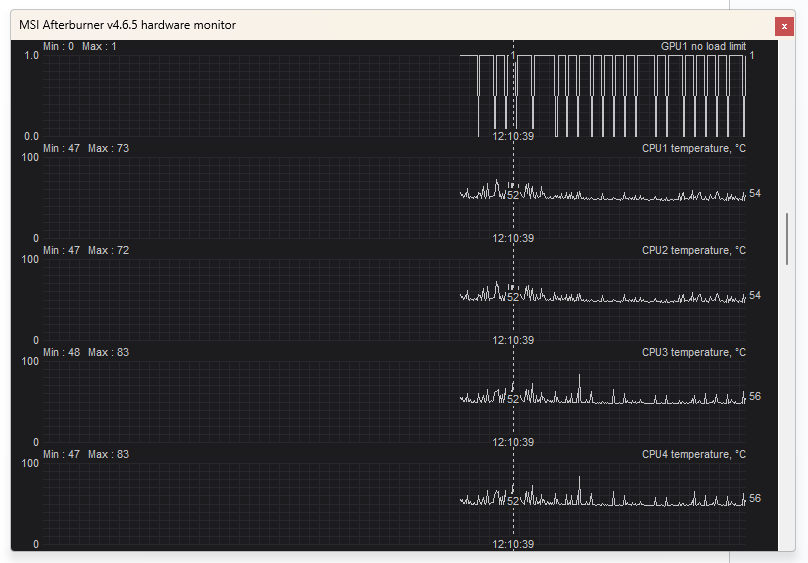
Effort to Check CPU Temperature
It takes about 3 minutes to check the temperature. The straightforward download and installation process leads to the main screen, where you can find temperature data, but it covers the GPU, not the CPU. To check CPU data, you need to open the “Detached Monitoring” window, where you can see graphs and temperature data for the CPU, GPU, RAM, and how they change over time.
CPU Temperature Features
- Real-time CPU temperature indicators
- Shows temperature on the On-Screen Display (OSD) while gaming or running other applications
Other Features for CPU and Performance Optimization
- Easy and precise access to GPU settings, allowing users to overclock their graphics cards by adjusting core voltage, core clock, memory clock, and fan speeds. The OC Scanner feature can automatically find the highest stable overclock settings. Here is a quick guide on CPU undervolting.
- Create custom fan speed curves to optimize cooling performance and maintain optimal temperatures during high workloads.
- The Predator software integrated into MSI Afterburner allows users to record gameplay or overclocking sessions without significantly impacting performance.
Basic Overview of the Software
Overall, MSI Afterburner is a comprehensive tool that assists in GPU overclocking and provides essential monitoring and optimization features to enhance PC productivity.
It has an intuitive interface and a wide range of settings for graphics card optimization and fan control.
HWINFO
| Platform Support: | Windows (11, 10, 8, 8.1, 7), 32/64-bit |
| Chipset Support: | AMD, Intel |
| Price: | Can check CPU data in the free version. Pro version starts from $29 |
| Security: | Installation file certificate valid till 8/12/2024 |
Effort to Check CPU Temperature
It takes about 3 minutes from visiting the website to seeing the final results. The installation file is 12.7MB and sets up easily. Although the installation file certificate is signed and valid, the web browser may block the download, treating it as unsecure.
After installation, the interface is somewhat confusing, with three system windows and no clear indication of where to find the temperature data. This information is located in a separate “Sensors” menu, which may take an average user more time to find than expected.
CPU Temperature Features
- It displays temperatures for individual cores and the overall CPU package.
- Users can set alerts about high temperatures to help them take preventive actions. Metrics can be displayed in various formats such as tables, graphs, and system tray icons.
Other features for CPU and performance optimization
The app provides extensive CPU details including clock speeds, usage, power consumption, and thermal design power (TDP). It also offers in-depth analysis of other components such as the motherboard, RAM, and GPUs.
Benchmarking features allow users to measure CPU performance under different conditions, useful for comparing performance before and after optimizations or hardware upgrades.
Basic Overview of the Software
HWiNFO is a powerful tool for anyone needing detailed and accurate information about their computer hardware. This tool is designed for more advanced PC users rather than novices—the interface is quite complex and features a variety of tabs, categories, and indicators.
Generally, it has a good interface, but newcomers might get stuck navigating and locating specific performance indicators and alerts.
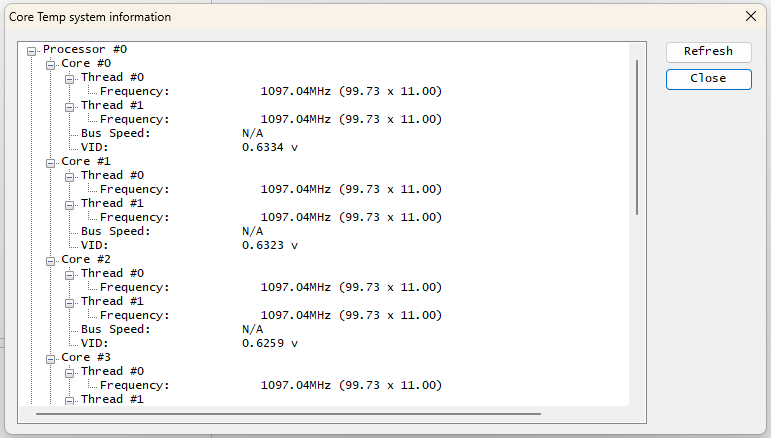
Core Temp
| Platform Support: | Windows (11, 10, 8, 7, XP), Windows Server 2003-2022, 32/64-bit |
| Chipset Support: | AMD, Intel, VIA x86 |
| Price: | Totally Free |
| Security: | Outdated certificate for the installation file, expired on 05/18/2024. Integration of a third party software offer (games) during the installation process. |
Effort to Check CPU Temperature
It takes about 1 minute to check the temperature with this app. The installation file is lightweight (1.2 MB), safe, signed, and installs very easily. The process could be a bit shorter and simpler, but during installation, you need to untick the offer to install third-party apps and additional plugins.
CPU Temperature Features
- Core Temp provides real-time temperature readings for each individual core of the processor, displayed directly in the app window.
- You can set up system tray icons to show temperatures at a glance.
- Users can log temperature data over time, useful for diagnosing intermittent issues or understanding long-term temperature trends. Logs can be exported for further analysis or sharing with technical support.
- Core Temp can be configured to alert the user or perform actions (such as shutting down the system) if the CPU temperature exceeds a specified threshold.
Other features for CPU and performance optimization
- Besides temperatures, Core Temp displays detailed information about the CPU, such as the model, platform, frequency, and core count, providing a comprehensive view of the processor’s specifications and performance.
- Leverages the Digital Thermal Sensor (DTS) built into modern x86 processors, offering more accurate and higher resolution temperature readings than conventional onboard thermal sensors.
Basic Overview of the Software
Core Temp is a lightweight, compact program that monitors CPU temperatures and other vital information. It does not provide comprehensive info about other computer hardware components (motherboard, GPU, etc.) like similar apps do, but it professionally solves the goal of CPU monitoring with very friendly navigation and design.
A third-party application (game) is included in the installation file and could be installed on your PC if you don’t untick it, which can be a nuisance. The expired certificate for the installation file also raises additional security concerns.
Due to these points, we wouldn’t recommend Core Temp as an optimal solution to check CPU temperature.
Open Hardware Monitor
| Platform Support: | Windows (11, 10, 8.1, 8, 7), 32/64-bit, Linux |
| Chipset Support: | Intel, AMD |
| Price: | Totally Free |
| Security: | Potential issues like with any other open-source applications |
Effort to Check CPU Temperature
Very easy, takes about 1 minute. You don’t even need to install this app. Just unzip the archive, and you will immediately see the CPU indicators.
CPU Temperature Features
- You can set up CPU temperature logging and its frequency. All records are collected in a separate Excel file, recording changes every second, minute, or hour.
Other features for CPU and performance optimization
- Open Hardware Monitor provides a comprehensive view of all hardware parts: motherboard, RAM, GPU, hard drive. There are no additional features for optimization.
Basic Overview of the Software
This is the best solution for those needing quick data about CPU or other hardware parts and nothing more. It’s a lightweight app that runs from any folder on your PC. There are no options for PC optimization, overclocking, or customization. It supports Linux OS, which can be especially valuable to IT pros and software developers.
Taking into account the security concerns common to all open-source projects, we wouldn’t consider this app a top solution. However, it meets our goals effectively.
Intel Extreme Tuning Utility
| Platform Support: | Windows 10 (22H2), Windows 11 (21H2, 22H2, 23H2) |
| Chipset Support: | Intel processors (K- and X-series) |
| Price: | Totally Free |
| Security: | Installation file certificate is valid till 03/06/2025 |
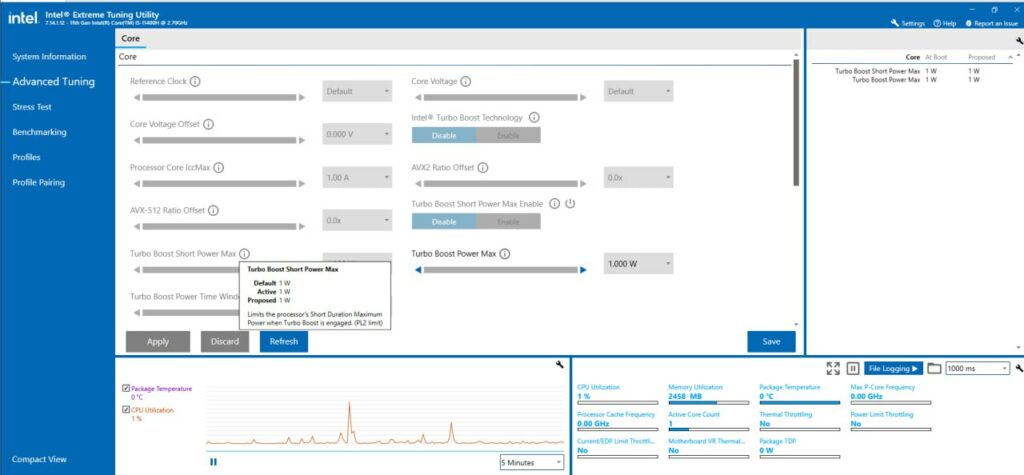
Effort to Check CPU Temperature
Quite easy, taking about 2 minutes to check CPU data. The mid-sized installation file (47MB) and an easy, predictive installation process lead directly to the home screen where your temperature data is shown.
CPU Temperature Features
- Real-time monitoring of CPU temperatures, displaying package and individual core temperatures.
- Users can set temperature thresholds and receive alerts when these are exceeded.
- Thermal throttling flags indicate when the CPU reduces its speed to prevent overheating.
- Users can perform stress tests to check the CPU’s thermal performance under load and adjust settings based on results.
Other features for CPU and performance optimization
- Adjust CPU multipliers, core voltage, and cache ratios to increase performance. Users can overclock individual cores or the entire processor.
- Create and switch between performance profiles automatically based on running applications, optimizing settings for different usage scenarios.
- Built-in benchmarking tools to measure performance gains from overclocking and stress tests to ensure system stability.
Basic Overview of the Software
Intel XTU is a Windows-based utility for K and X series Intel processors. It helps with overclocking, monitoring, and stress testing systems equipped with Intel processors. It offers robust performance tuning features suitable for both novice and experienced enthusiasts, providing a user-friendly interface to enhance system performance.
At the same time, it is an easy-to-use utility to check CPU temperature if you don’t need additional features or goals.
Ryzen Master
| Platform Support: | Windows 10, Windows 11 |
| Chipset Support: | AMD only (B350, B450, B550A, TRX40, X300, X370, X399, X470, X570, WRX80, X670E, X670, B650E, B650, A620) |
| Price: | Totally Free |
| Security: | Installation file certificate is valid till 05/03/2027 |
Effort to Check CPU Temperature
Easy but time-consuming, about 5 minutes. The heavy installation file (268 MB) makes the process a bit harder than expected. The good news is that after the lengthy download and installation, the app displays the CPU temperature directly on the home screen.
CPU Temperature Features
- Provides real-time monitoring of CPU temperatures, voltages, and speeds, allowing users to track thermal performance.
Other features for CPU and performance optimization
- Overclocking capabilities, enabling users to adjust CPU core clock speeds, memory frequencies, and voltages.
- Includes up to four profiles for custom configurations and supports integrated Radeon graphics adjustments.
Basic Overview of the Software
Overall, it is a comprehensive utility designed for overclocking and performance tuning of AMD Ryzen processors. It balances comprehensive data and usability, providing many indicators that are well-structured and easy to access. It offers detailed monitoring, profiling, and tuning options, making it a versatile tool for enthusiasts seeking to optimize their system’s performance.
How to Check CPU Temperature through BIOS/UEFI
BIOS (Basic Input/Output System) and UEFI (Unified Extensible Firmware Interface) are firmware interfaces between a computer’s hardware and its operating system. BIOS is the traditional firmware used to initialize hardware during booting, while UEFI is a modern replacement with more features, including faster boot times, support for larger hard drives, and enhanced security.
There are some conditions to checking CPU temperature through BIOS:
- This data will be accurate but not informative. It is calculated without any load or operations, meaning it may not be of great value. It is way more useful to check how your CPU works under the load of particular apps and tasks (games, video editors, WinRAR unzipping, etc.).
- Not all PC manufacturers provide this temperature data, so you might not have access to it though BIOS.
Nevertheless, entering BIOS/UEFI mode to check the CPU temperature is precise and safe if you follow these simple steps and do not make any changes to the system configuration.
We cannot guarantee that the keys mentioned below will trigger the BIOS to load on your computer — please check your manufacturer’s guidelines for the most accurate instructions.
- Turn off your PC and turn it back on.
- Press the BIOS key during startup (commonly F2, DEL, ESC, or F10).
- Use the arrow keys to go to the “Hardware Monitor,” “PC Health Status,” or similar section.
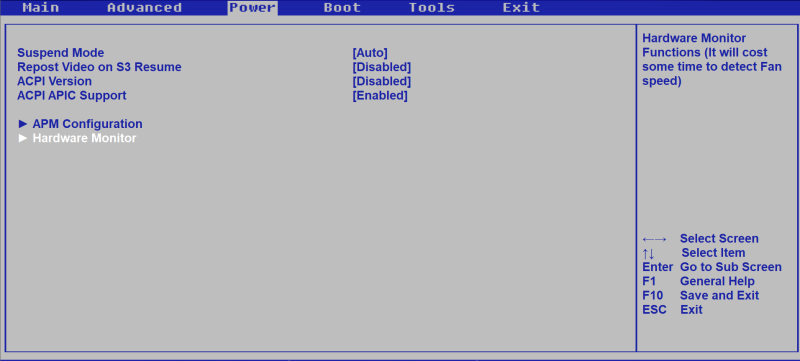
- The CPU temperature should be displayed in this section.
Other Utilities for CPU Checks and Optimization
If you are curious about other apps that can help research CPU data, here are some more:
CPU-Z
CPU-Z is a free system profiling and monitoring application for Windows that provides detailed information about the hardware in your computer.
Developed by CPUID, CPU-Z is a popular tool for enthusiasts, overclockers, and professionals who need to gather comprehensive data about their systems.
HARDiNFO
HARDiNFO is a comprehensive system information and benchmark tool for Windows. It offers detailed insights into PC hardware components, such as CPU, memory, and storage, along with advanced benchmarking capabilities. Users can test their PC’s performance and compare results online. The software also includes features for monitoring system processes, network traffic, and notebook battery health.
HARDiNFO provides well-organized graphical representations of hardware data and supports exporting reports in text or HTML formats. It has a free edition and a PRO version with additional features.
AIDA64
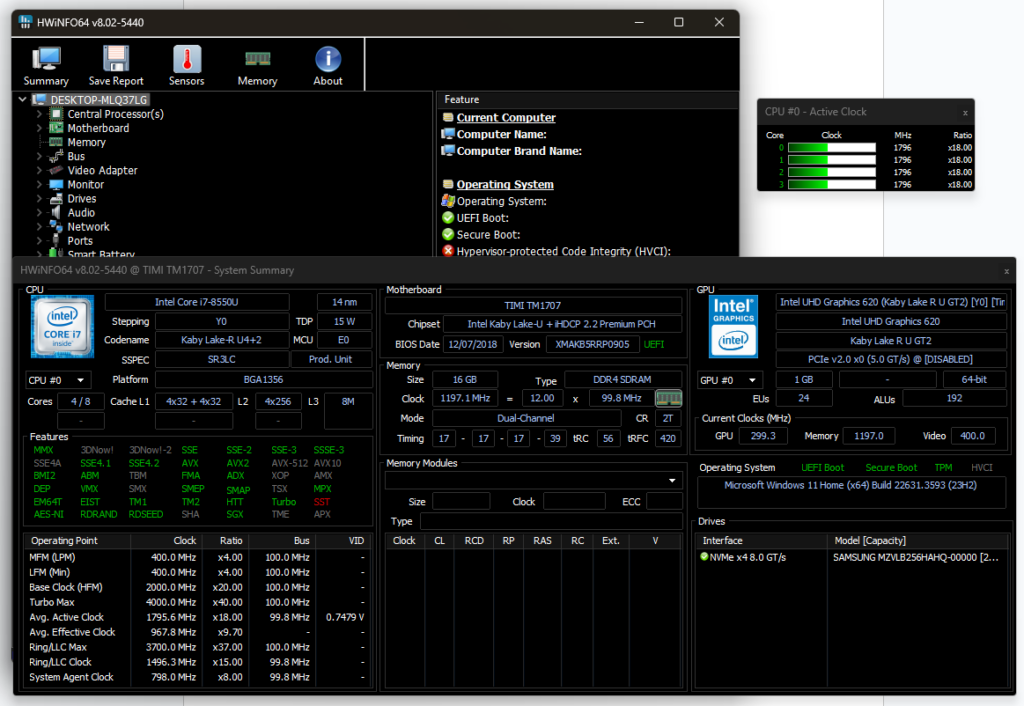
AIDA64 is a robust system information and diagnostic tool for various platforms, including Windows, Android, and iOS. It provides detailed insights into hardware and software components, supporting over 247,000 devices.
Key features include system stability testing, real-time monitoring, benchmarking, and extensive hardware detection. AIDA64 is available in different editions tailored for home users, engineers, and businesses, each with specific functionalities. It supports remote monitoring and can display data on various external devices.
CPU-X
CPU-X is a free and open-source system profiling and monitoring application, akin to CPU-Z but designed for GNU/Linux and FreeBSD. It provides detailed information about the processor, motherboard, memory, system, and graphics card, and includes performance monitoring.
CPU-X can operate in both graphical mode using GTK and text-based mode using NCurses, with an additional dump mode available via command line. It is maintained by “The Tumultuous Unicorn of Darkness”
Mission Center
Mission Center is a versatile system monitoring tool designed for Linux, offering detailed real-time insights into CPU, memory, disk, network, and GPU usage. It provides overall and per-thread CPU monitoring, detailed memory usage breakdowns, disk utilization, network interface details, and GPU statistics powered by NVTOP.
The tool uses OpenGL for graph rendering, minimizing resource usage, and supports a simplified summary view. Developed with GTK4 and Libadwaita, it is primarily distributed as a Flatpak package and is written in Rust.
SIW
SIW (System Information for Windows) is a comprehensive tool for Windows that provides detailed analysis of a computer’s hardware, software, and network configuration. It offers extensive information on components like the CPU, memory, storage devices, and more, as well as software details such as installed programs and licenses.
SIW features easy-to-generate reports in various formats and includes useful tools like network utilities and password recovery. It’s designed with a user-friendly interface and can run as a portable application without installation.
Neofetch
Neofetch is a command-line system information tool written in Bash. It displays essential system information alongside your OS logo or a custom image. Designed for aesthetic presentation, it’s highly configurable via command-line flags and a configuration file.
Neofetch supports nearly 150 operating systems, including Linux, Windows, and more obscure ones like Minix and Haiku. Its primary use is for visually appealing screenshots of system setups, rather than in-depth diagnostics.
FAQ
Why do I need to check CPU temperature?
There are several reasons:
- Ensures the CPU does not overheat, which can cause system crashes or permanent hardware damage.
- High temperatures can lead to thermal throttling, reducing the CPU’s performance to avoid damage.
- Monitoring and managing temperatures can extend the lifespan of your CPU and other components.
- High temperatures can indicate problems like inadequate cooling, dust buildup, or failing hardware components.
What temperature should my CPU be?
The ideal CPU temperature varies depending on the model, but the general guidelines for most CPUs are:
- Idle temperature: 30°C to 40°C (86°F to 104°F)
- Under load: 60°C to 80°C (140°F to 176°F)
Gaming and intensive tasks may push temperatures higher. It’s crucial to stay below 85°C to avoid throttling or damage. Check your CPU manufacturer’s guidelines for specific recommendations, as different CPUs have different thermal limits.
How can I reduce CPU temperature?
There are several steps you can take in addition to using a CPU optimizer like the Camomile app:
- Ensure good case ventilation and remove any obstructions to airflow.
- Regularly clean dust from fans, vents, and heatsinks.
- Reapply thermal paste between the CPU and heatsink if it has dried out.
- Use higher quality or additional fans, or upgrade to a liquid cooling system.
- Lower CPU voltage and clock speed in BIOS or use power-saving modes.
- Close unnecessary background applications and processes.
What’s the maximum temperature for a CPU?
The maximum safe temperature for a CPU varies by model, but generally, most CPUs are designed to operate safely up to around 95°C (203°F). However, it’s advisable to keep the temperature below 85°C (185°F) during intensive tasks to ensure longevity and prevent thermal throttling.

Keeping an eye on your CPU temperature is crucial for maintaining your computer’s performance and longevity. Overheating can cause system instability, crashes, and even hardware damage. In this guide, we’ll show you how to monitor your CPU temperatures on Windows 10 and 11 using a free tool called Hardware Info.
Key Takeaways
- Hardware Info is a reliable tool to monitor your CPU temperature.
- You can check individual core temperatures for more detailed monitoring.
- Keeping your CPU temperature within safe limits helps prevent damage.
Step-by-Step Guide to Check CPU Temperature
Follow these steps to easily check your CPU temperature in Windows 10 or 11:
Step 1: Download Hardware Info

- Open your web browser and visit the official Hardware Info download page.
- Choose the portable version for a quick setup. Download the file from a nearby server for faster access.
Step 2: Extract the ZIP File

- After downloading, locate the ZIP file in your Downloads folder.
- Right-click the file and select Extract To using an extraction tool like 7-Zip.
Step 3: Run Hardware Info

- Open the extracted folder and run the Hardware Info 64-bit application. If you have a 32-bit system, use the 32-bit version instead.
- Click Start when prompted to begin the system analysis.
Step 4: Access CPU Temperature

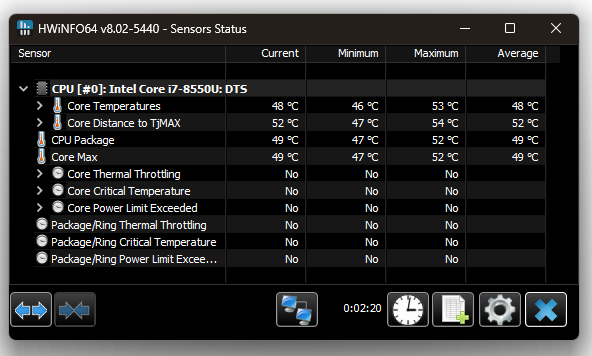
- Once the application is running, close any unnecessary pop-ups until you reach the main screen.
- Click on the Sensors button to open the sensor status screen.
- Scroll down to find the CPU section, which will display the current, minimum, maximum, and average temperatures.
Why Monitoring CPU Temperature is Important

Monitoring your CPU temperature helps ensure your computer is running efficiently. Overheating can lead to performance drops and even physical damage to your system. Keeping your CPU cool by monitoring temperatures regularly is one of the simplest ways to avoid these issues.
Pro Tip: The ideal CPU temperature should generally stay below 85°C under heavy load. Anything consistently above this could indicate that it’s time to improve your cooling setup.
Tools to Help You Monitor Your PC Health

While Hardware Info is a great tool for checking your CPU temperature, there are other applications available for monitoring your entire system. Tools like LibreHardwareMonitor also provide real-time temperature readings and can help you track your hardware’s health over time.
Conclusion
Monitoring your CPU temperature is an easy but essential part of maintaining your computer’s health. Using Hardware Info makes this process simple, and it gives you detailed information about your CPU and other components. By following this guide, you can ensure your CPU stays within safe operating limits, helping you avoid costly repairs down the line.
Stay proactive and keep an eye on your system’s health. A cooler CPU means a longer-lasting and better-performing computer!
FAQs
1. What is a Safe CPU Temperature?
A safe CPU temperature typically ranges between 40°C to 85°C, depending on the workload. If your CPU consistently stays above 85°C, it could be a sign that your cooling system needs an upgrade.
2. Can I Check CPU Temperature Without Third-Party Software?
No, Windows does not offer a built-in feature to check CPU temperature. You will need to use third-party software like Hardware Info or LibreHardwareMonitor to monitor your CPU temperature.
3. Does Overheating Damage the CPU?
Yes, excessive heat can cause permanent damage to your CPU and other components. Prolonged exposure to high temperatures can reduce your CPU’s lifespan and lead to performance issues.
4. How Often Should I Check My CPU Temperature?
It’s a good idea to check your CPU temperature periodically, especially if you notice unusual behavior like slowdowns or crashes, or if you are running resource-heavy applications.
5. Can Cleaning My Computer Help Reduce CPU Temperature?
Yes, dust buildup can restrict airflow and cause higher temperatures. Regularly cleaning your computer’s internal components can help improve cooling and reduce your CPU temperature.
- On Windows, boot into UEFI Firmware Settings from Settings > System > Recovery > Restart now, then click Troubleshoot > Advanced options > UEFI Firmware Settings. In the settings, look for the CPU Temperature.
- You can also use Core Temp, HWiNFO, HWMonitor, and other third-party tools to monitor per-core current temp, max temp, and min. temp.
The temperature of your system’s CPU highly affects its performance, and several reasons can lead to abnormal temperatures. On a Windows PC, there are multiple ways to check and monitor your CPU’s temperature and check if it is the culprit for a lagging performance.
CPU temperatures can drastically rise while performing CPU-extensive tasks, like playing games or performing complex calculations. This not only affects its performance, but it can also permanently damage the CPU and other associated hardware. Therefore, you must monitor its temperature under such circumstances.
Monitoring the CPU temperature allows you to take the appropriate action to maintain it, and keep it at an optimal temperature. This guide will show you multiple ways to check and monitor your CPU’s temp on Windows 11 and 10, both natively and using third-party tools.
Table of Contents
How to check CPU temp on Windows
Most modern computers come with embedded sensors that report certain parameters for different hardware, including the temperatures for each core of the CPU, information on the GPU, etc.
However, there is no native method to view the CPU temperature from within Windows. Instead, you must use either third-party tools and applications to monitor the CPU temp or boot into the UEFI settings.
Check CPU temp from system BIOS/UEFI settings
You can check the live temperature of the CPU from the system BIOS. However, to do so, you must restart the computer every time, which might not be convenient for everyone.
If you do not feel like restarting the computer, then skip to the other methods to monitor the CPU temp given below.
-
Press the Windows key + i to open the Settings app.
-
Go to System.
-
Click Recovery.

Open Recovery settings -
Click “Restart now” in front of “Advanced Startup“.
Restart into Advanced Startup The system will now boot into the Windows Recovery Environment (WinRE).
-
Click Troubleshoot.
-
Click “Advanced options.”
-
Click “UEFI Firmware Settings.”

Open UEFI Firmware Settings -
Click Restart.
The computer will now restart and boot into the UEFI firmware settings.
-
You should now be able to see the CPU temp on the main UEFI page. If not there, check a different page for the CPU information.
Note: If you do not see this information, then it is likely that your CPU is not supported by the UEFI, or the SMART technology is not available.


Monitor CPU temp using third-party apps
Core Temp
Core Temp is a free application that uses embedded sensors to provide you with fresh, current information on the system hardware, including the per-core current CPU temperature, max temperature, and minimum temperature. It also provides other information, like the power it is currently consuming, operating frequency, and complete model information.
Here are the steps to monitor the CPU temperature using Core Temp:
-
Download Core Temp.
-
Run the executable package and follow the on-screen instructions in the installation wizard to install it.
-
You can now view the CPU core temperatures under the “Temperature Readings” section.
Monitor CPU Core temperatures using Core Temp
In Core Temp, you will find the current temperature for each core, the minimum temperature it has reached, the maximum value, and the current load percentage as well.
When the application is running, you can also view the individual Core temperatures, in degrees Celsius, in the Quick Access menu.
HWiNFO
HWiNFO is another popular application that provides similar information to Core Temp. It is also free to use for non-commercial users. The only difference is the UI and the fact that the application needs to be installed from the Command Prompt.
Use the following steps to install HWiNFO and use it to monitor the CPU temperatures:
-
Press the Windows key + R to open the Run Command box.
-
Type in “CMD” and press CTRL + Shift + Enter to launch an elevated Command Prompt.
-
Run the following command to install HWiNFO:
winget install --id REALiX.HWiNFO
Install HWiNFO The app will then automatically run after installation.
-
Check the “Sensors-only” option and click Start.
Start the app -
If prompted for an Embedded Controller, click Continue.

Continue -
Inside the HWiNFO app, scroll down and view the temperature information for the CPU under the “CPU [#0] enhanced” section, or the temperature for individual cores under the computer model’s name section.
Note: The “CPU (Tctl/Tdie)” provides information for the AMD CPUs, and the “CPU Package” provides information for Intel CPUs.

Check CPU temperature using HWiNFO


HWMonitor
HWMonitor is another tool, very much like HWiNFO, that provides live information on the CPU temperature, as well as the temperature for individual cores, the maximum temperature, and the minimum temperature.
It is a lightweight application with less configuration and can be installed in a few simple steps. Here are the steps to install and run the HWMonitor application to check the CPU temperature:
-
Press the Windows key + R to open the Run Command box.
-
Type in “CMD” and press CTRL + Shift + Enter to launch an elevated Command Prompt.
-
Run the following command to install HWMonitor:
winget install --id CPUID.HWMonitor
Install HWMonitor -
Once installed, run the HWMonitor tool.
-
You should be able to see the CPU temperatures under the “Temperatures” subsection in the CPU section.

Check CPU temperature using HWMonitor


Other tools to monitor CPU temperature
Like the free and performing tools discussed above, there are many others available that can be used to monitor the CPU temperature and other hardware-related information as well. Here are some of the top tools on my list:
- NZXT’s Cam
- HWInfo
- Open Hardware Monitor
Optimal CPU temperature
If you regularly monitor your CPU temperature, you will notice that sometimes it is operating at relatively lower temps, while at other times, its temperatures are off the charts. This can happen depending on how much load it is bearing at that moment.
If you are performing CPU-intensive tasks, then the CPu temps are bound to rise. While tasks that don’t require much CPU processing go easy on the cores, hence causing less heat dissipation.
That said, the optimal CPU temperature during normal workloads should be between 40-65°C. However, it is normal for them to rise to 85°C during heavy workloads, such as playing a game.
If you find that the CPU temperatures are going well above the normal range for prolonged periods, then there might be an issue that needs resolving.
Note that the CPU temperatures might even rise above 85°C, which can be normal, provided that the rise is not constant and the temps return to optimal range in a few seconds after the cooling fans kick in.
Causes of high CPU temperatures
There can be several reasons why a CPU temperature is above the charts and operating in abnormal ranges. Here are a few common reasons:
- Extensive workload – one of the reasons for a CPU to reach high temperatures is because of high-intensity, continuous tasks. It may be possible that you are over-burdening the CPU with multiple CPU-intensive tasks, and therefore, it is reaching high temperatures.
- Overclocking – CPU overclocking is when you manually overburden the hardware to speedily perform tasks at its maximum capacity, which in turn can raise its temperature beyond the normal limits.
- Dried-up thermal paste – thermal paste is an excellent heat conductor, placed between a CPU and the heat sink. It often dries up when operating under high temperatures, and needs to be replaced for proper heat dissipation. If dried up the CPu can reach high temps and cause permanent damage.
- Faulty cooling fan – Cooling fans adjust their speeds automatically to keep the CPu and other hardware at optimal temperatures. When faulty, or not working at all, the hardware temps can rise. Check to see if all fans are working as they should.
- Dust buildup – Computers sitting idly for long periods can gather dust. Dust in the fans or on the hardware itself can hinder proper air ventilation. Proper cleanup and maintenance are advised before starting up a computer. Also, clean the computer hardware occasionally even when in use.
These are some of the common issues people face when experiencing high CPU temperatures. If you are seeing the same, then you may also be experiencing deteriorated system performance. Learn how to keep your CPU temperatures low and within optimal temperatures below.
How to keep CPU temperatures down
System hardware requires regular maintenance for all of it to perform well. Here are a few things you should do and look out for to maintain your CPU temperatures and prolong the CPU life in return:
- Keep the hardware clean – Dust bunnies often accumulate on idle and in-use computers, which prevents proper air ventilation for heat dissipation. Therefore, periodic cleaning is recommended through vacuum and leaf blowers.
- Use a ventilated laptop stand – Laptop stands prevent blockage of the air vents, ensuring proper air ventilation. Some stands even come with extra fans attached.
- Keep the environment cool – Do not use your computers in enclosed and hot places. Make sure that there is plenty of air circulation around the entire computer, with optimal temperatures.
- Close unused and background applications – apps running in the background still consume system resources. Close them when they are no longer needed to make sure that the CPU is not burdened with workload any more than it has to.
- Regularly perform malware scans – Some malware consumes 100% of the CPU for prolonged periods, resulting in elevated operating temperatures. Make sure that your computer is malware-free by performing regular checks and scans.
- Shut down the computer when not in use – Leaving your computers on overnight does not give the hardware the cooling time it needs, resulting in higher operating temps. It is recommended to switch off the computer when not in use.
How to check if CPU is heating?
One may not always keep an eye on the CPU’s temperature. So what other ways are there to tell whether the CPU is overheating or not?
Physically checking whether the CPU or its heat sink is hotter than normal is not the way to go about it. Instead, you may experience lag and degraded system performance when the CPU is overheating. Occasionally, you may even smell the thermal paste burning, if you are sitting close enough.
These are the only observations you can make to conclude that the CPU is overheating. If you do observe them, use one of the methods given above and check the CPU’s current temperature, as well as the maximum value to confirm your hunch.
Takeaway
CPU temperatures need to be monitored and maintained for optimal performance and increasing the life of the hardware. Periodic cleaning and other maintenance, such as replacing the thermal paste once a year is recommended. Also, make sure that the system’s ventilation, both inside and out, is in top shape and operating temperatures are optimal in the environment.
If you observe degraded system performance or lag, keep one of your preferred tools handy to check the CPU temperature.