
Linux has ltrace. Windows has…? I was looking for applications to trace DLL calls, so I could tell why a certain application goes wrong. The classic way is to get hints from library calls. Or system calls. Or both.
In the beginning, I was turned down by they idea, that most trackers only support those basic system DLLs (kerner32 and friends), but I was soon to find out that one gets loads of information about what the application is at only through them.
I found a discussion about such tools in a forum leading my to the WinAPIOverride32 application (“the tracker” henceforth), which is released under GPL. It doesn’t come with a fancy download installation, so you have to run the WinAPIOverride32.exe yourself and read the help file at WinAPIOverride.chm. Having looked at a handful of commercial and non-commercial alternatives, I have to say that it’s excellent. The only reason I looked further, is because it didn’t run on Windows 2000, which is an understandable drawback, and still, a problem for me.
The documentation is pretty straightforward about what to do, but here’s a short summary anyhow:
You can pick your target application by running it from the tracker, or hook on a live process by picking its process number, or even better, drag an icon over the target process’ window. Then click the green “play” button to the upper left. If you chose to run your process ad hoc, you’ll set up the modules immediately after the launch, and then resume operation by confirming a dialog box. As a side feature, this allows starting a process just to halt it immediately, and let a debugger hook on it, and then resume. A bit ugly, but effective (with Microsoft Studio, for example).
Module filters sets what calls are included or excluded, depending on the modules calling them. One problem with including modules such as kernel32 is that several calls are made while the hooks are made (by the tracker itself), so the log explodes with calls while the target application is paused anyhow. This is solved by using the default exclusion list (NotHookedModuleList.txt). Only be sure to have the “Use list” checked, and have the Apply for Monitoring and Apply for Overriding set. Or hell breaks loose.
At this point, the idea is to select which API calls are monitored. Click the torch. There’s a list of monitor files, basically contain the names of the DLLs to be hooked upon, and the function prototypes. One can pinpoint which functions to monitor or not, but the general idea is that the monitor files are sorted according to subjects which the calls cover (registry, I/O, etc).
Choosing kernel32 will give a huge amount of data, which reveals more or less what the target application was doing. Monitoring “reg” is also useful, as it reveals registry access. Specific other DLLs can be helpful as well.
When huge amounts of data comes out, the log will keep running even after monitoring has been stopped. If this goes on for a while, a dialog box opens, saying that unhooking seems to take too much time, and if it should wait. Answering “no” will cut the log right there, possibly causing the target application to crash. Whether to chop it right there or not is an open question, since the critical event is already over, yes, but we’re not sure whether it has been logged.
To make things easier, just minimize the tracker’s window, since it’s mainly the display of the log which slows things down. Quit the target application, wait for the popup telling about the unload of the process, and then look.
A very nice thing is that it’s possible to create monitor files automatically with the MonitoringFileBuilder.exe application, also in the bundle. Pick an application and create a monitor file for all its special DLLs, or pick a DLL to monitor its calls. The only problem with these files is that since the information about the function prototypes is missing, parsing the arguments is impossible.
It’s possible to write the call logs to an XML file or just a simple text file, of course. The only annoying thing is that the output format it 16-bit unicode. Notepad takes this easily, but simple text editors don’t.
In short, it’s a real work horse. And it just happened to help me solve a problem I had. This is the classic case where free software which was written by the person who uses it takes first prize, over several applications which were written to be sold.
I should also mention the Dumper.exe, which allows connection to any process, and not only dump and modify the process’ memory on the fly, but also see what DLL is mapped where in memory (which is useful when reading in-memory raw assembly with a debugger). Also, it allows displaying the call stack for each thread, which is sometimes more instructive than Microsoft’s debugger (is that really a surprise?).
But since I had a brief look on other things, I wrote my impressions. They may not be so accurate.
Other things I had a look at
There’s SpyStudio API monitor, which I had a look on (it isn’t free software, anyhow. That is, free as in free beer, but not as in freedom). Its main drawback is that it logs only specific functions, and doesn’t appear to allow an easy appliance of hooks to a massive amount of functions. In other words, one needs to know what the relevant functions are, which isn’t useful when one wants to know what an application is doing.
I also had a look on API monitor, which was completely useless to me, since it doesn’t allow adding command line arguments when launching a new process. Not to mention that their trial version completely stinks (buy me! buy me!). Everything useful was blocked in the trial version. I wonder if the real version is better. Was that an application I gladly uninstalled.
API sniffers with names such as Kerberos and KaKeeware Application Monitor seem to include trojan horses, according to AVG. Didn’t take the risk.
Rohitab API Monitor v1.5 (which I picked, since v2 is marked Alpha) wouldn’t let me start a new process, and since I was stupid enough to monitor all calls on all processes, this brought a nasty computer crash (when I killed the tracker). After a correspondence with the author, it turns out that the version is 10 years old, and it is possible to start a process with arguments. Then I tried v2. I would summarize it like this: It indeed looks very pretty, and seems to have a zillion features, but somehow I didn’t manage to get the simplest things done with it. Since I don’t want to rely on contacting the author for clarifications all the time, I don’t see it as an option.
Auto Debug appears pretty promising. It’s not free in any way, though, and even though it caught all kernel32 calls, and has neat dissection capabilities, I couldn’t see how to create a simple text output of the whole log. Maybe because I used the application in trial mode.
The Generic Tracker looks very neat, and it’s a command line application, which makes me like it even more. I didn’t try it though, because it allows tracking only four functions (as it’s based upon break points). But it looks useful for several other things as well.
Intro
The Sysmon ProcessAccess event has been used in threat hunting and detection efforts in order to alert on techniques such as process injection and credential access.
According to the Sysinternals website, the Sysmon ProcessAccess event reports when a process opens another process, an operation that’s often followed by information queries or reading and writing the address space of the target process.
Johnny Johnson’s research into which APIs map to Sysmon events shows us that the Sysmon ProcessAccess event gets its information from the NtOpenProcess` and `NtAlpcOpenSenderProcess
We can also look at the Sysmon Community Guide for an explanation of the various fields contained in the Sysmon ProcessAccess event as well as a sample configuration file containing rules that correspond to this event.
A particular field of interest for this blog post is the CallTrace field, which, according the Sysmon Community guide, includes the DLL and the relative virtual address of the functions in the call stack right before the open process call
Very interesting indeed and leads to the question of whether we can extract any detection value out of this field.
With this in mind, the purpose of this blog post is to look at the above question and take a deeper dive into the Sysmon CallTrace field in order to demonstrate how it can be used for both writing Sysmon rules as well as hunting for particular TTPs.
Before diving in, it is important to note that hunting within the Call Trace field is not a brand new concept, Andrey Skablonsky presented on the topic for Zero Nights 2019. This presentation served as the inspiration for this blog post.
Methodology
A sample Sysmon Process Access event can be found here: https://www.ultimatewindowssecurity.com/securitylog/encyclopedia/event.aspx?eventid=90010 – taking a look at the CallTrace field, we see values like C:\Windows\SYSTEM32\ntdll.dll+a5594` and `C:\Windows\system32\KERNELBASE.dll+1e865
In order to extract value from these events and make them readable to humans, we need a way to look up these addresses and translate them to their corresponding functions.
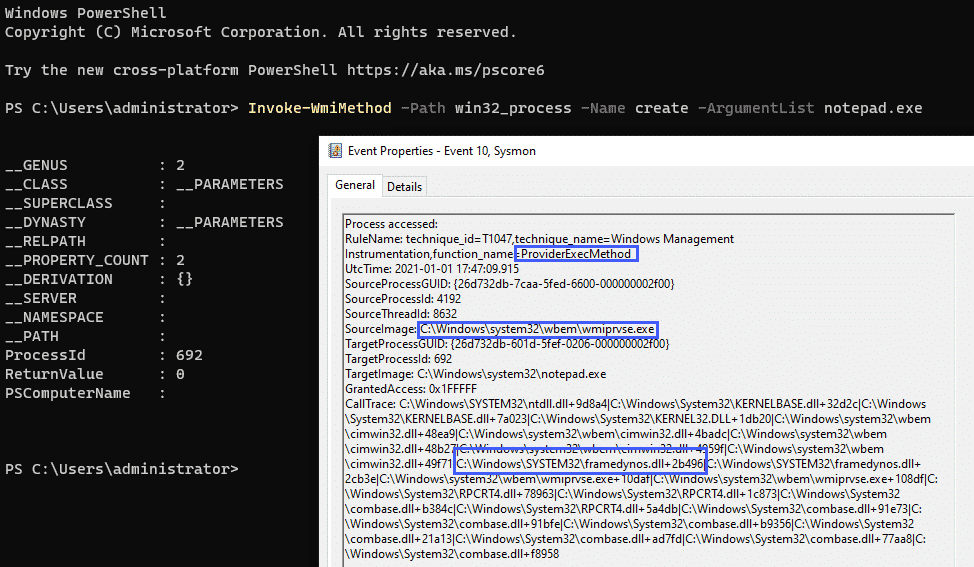
There are probably numerous ways to accomplish this task, however, for the purposes of this post, WinDbg and Process Monitor will be used.
Using WinDbg, we need to either start the process we need to monitor via the debugger or start the process first and then attach a debugger to it. After doing so, a breakpoint needs to be set on the CreateUserProcess API call: bp ntdll!ZwCreateUserProcess
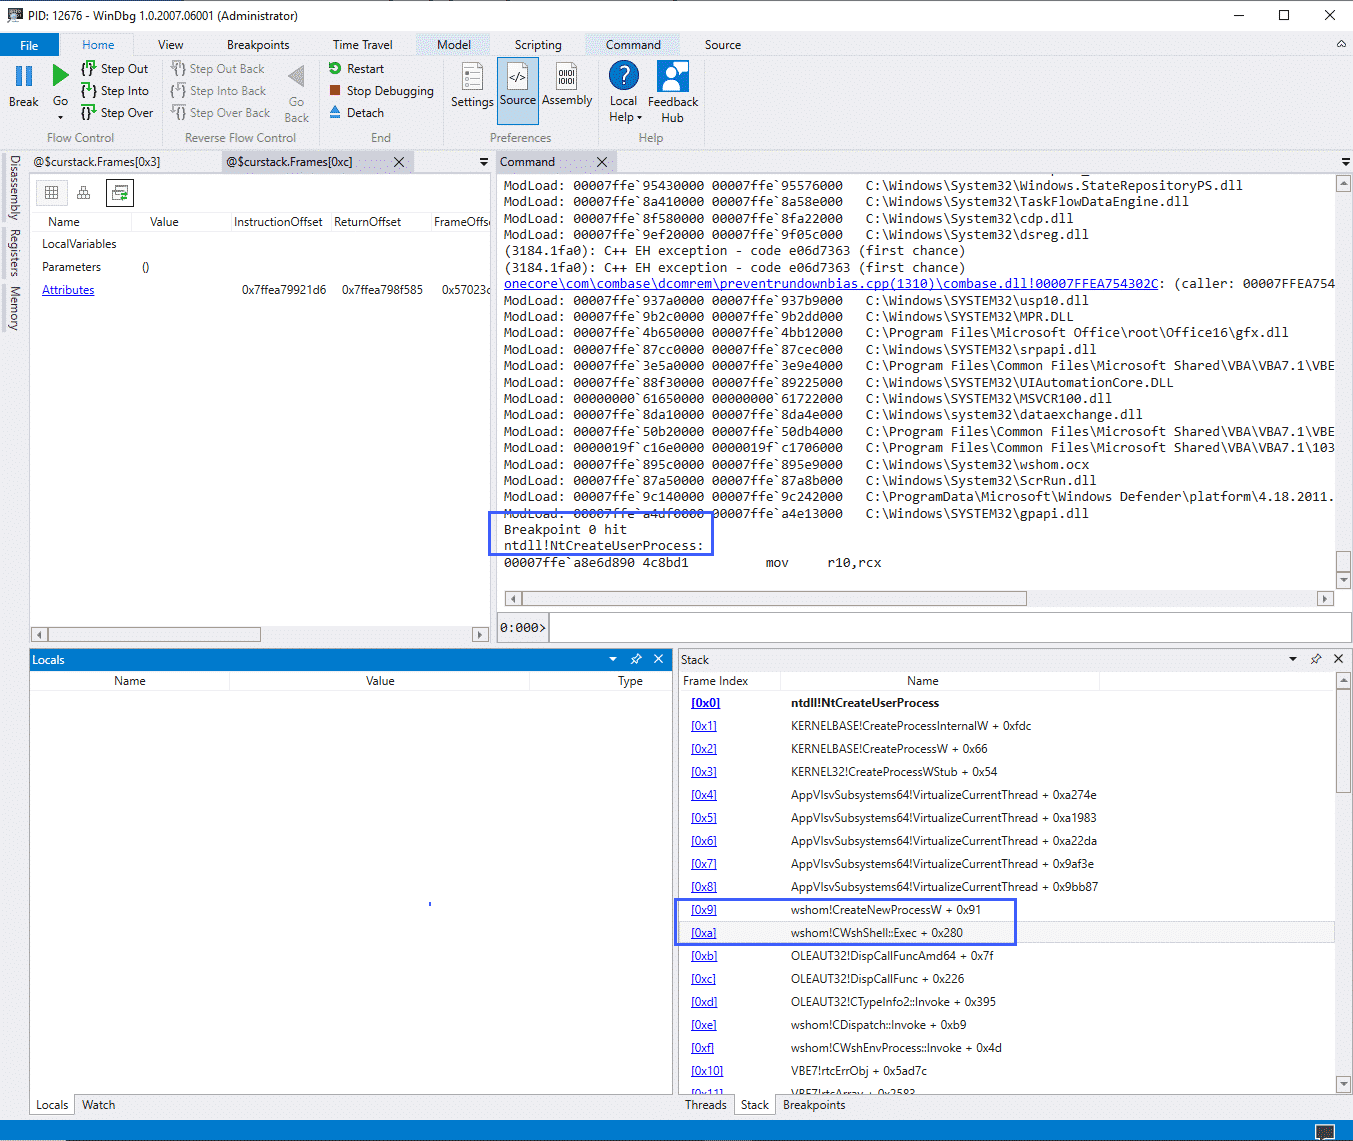
The screenshot above illustrates a debugger running, in this case attached to the WINWORD.exe process, with the breakpoint highlighted above it.
The «Stack» window shows us the same values as would be found in the CallTrace field of the Sysmon ProcessAccess event, however, we can see that WinDbg has translated the function calls for us.
The Process Monitor «Stack Summary» can also be used to translate call trace values:
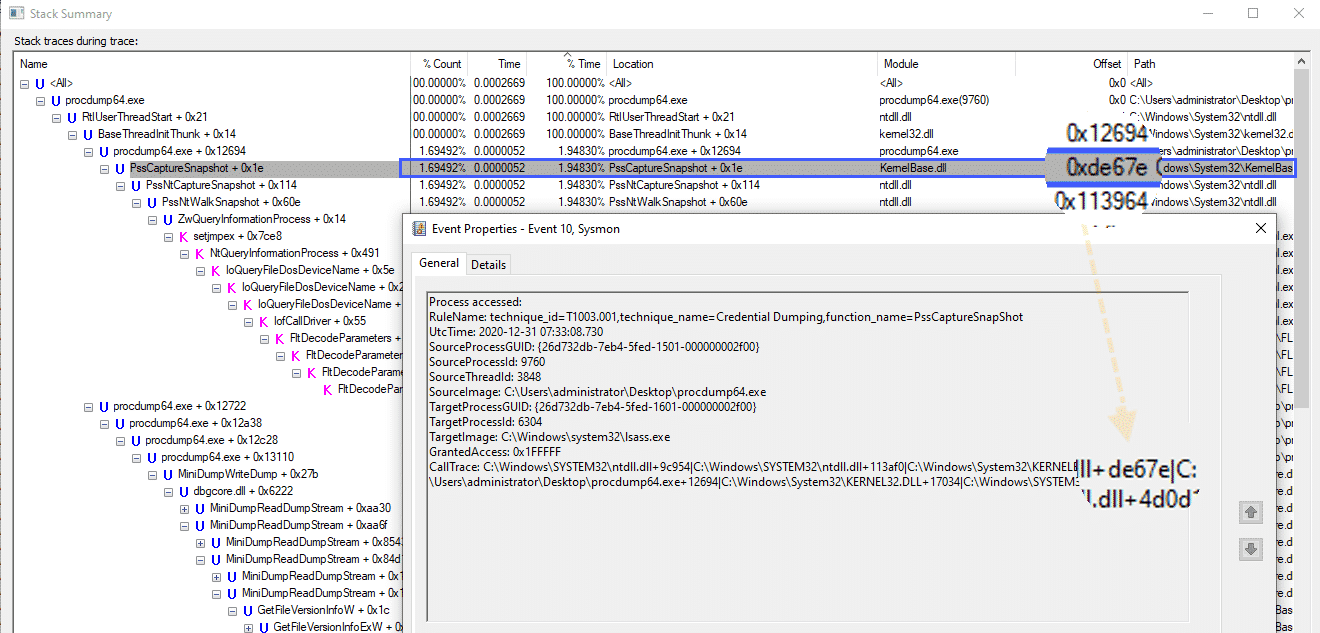
In the screenshot above we can see the PssCaptureSnapshot function address in both the Process Monitor window as well as the Sysmon ProcessAccess CallTrace field.
Those who are more proficient in reverse engineering may have more comprehensive and automated ways of translating these function calls. For a reversing newbie like myself however, the methods above worked as – at the very least – a proof of concept.
At this point, we now know what the Sysmon ProcessAccess CallTrace field is and we also know how to translate the function calls contained within this field.
We can now look at a few examples of how this data can be used within the Sysmon configuration file.
Before doing so however, it must be noted that the location of these function calls will most likely change depending on what Windows version is being used. For this post, Windows 10 20H2 Build 19042.685 was used.
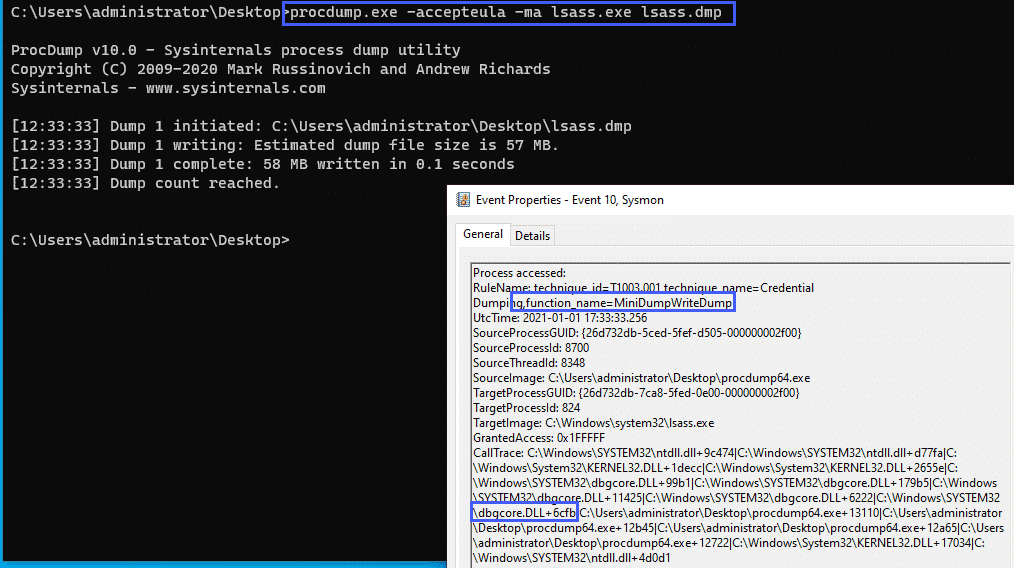
Credential Dumping – MiniDumpWriteDump
A common technique for dumping credentials is using the MiniDumpWriteDump function
With the following Sysmon config snippet:
<CallTrace condition="contains" name="technique_id=T1003.001,technique_name=Credential Dumping,function_name=MiniDumpWriteDump">C:\Windows\SYSTEM32\dbgcore.DLL+6cfb</CallTrace>We can alert on this specific function call.
As a test, we can use procdump to dump the LSASS process:
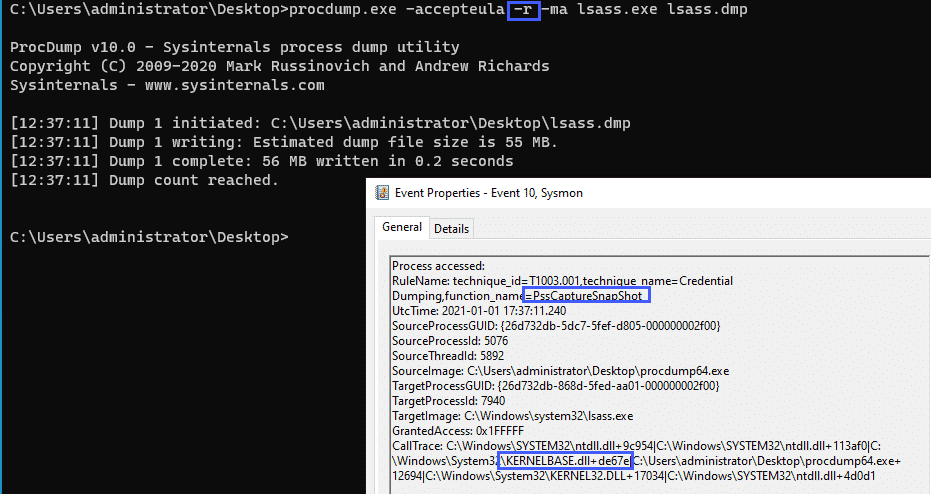
Credential Dumping – PssCaptureSnapShot
Taking a look at another example, we can run procdump with the -r flag which uses the PssCaptureSnapshot function rather than MiniDumpWrite.
We can use the following Sysmon config snippet to alert on this:
<CallTrace condition="contains" name="technique_id=T1003.001,technique_name=Credential Dumping,function_name=PssCaptureSnapShot">C:\Windows\System32\KernelBase.dll+de67e</CallTrace>And taking a look at the event generated:
The two above examples cover a few credential theft TTPs, which, as stated in the Sysinternals documentation, is one of the primary use cases for the Sysmon ProcessAccess event.
Using the data contained within the CallTrace field, we can extend the functionality of this event a little bit.
Let’s continue on with the examples and look at a few Office Macros TTPs.
We’ll be using the awesome «Generate Macro» test provided by Red Canary as a base for the following Macro tests: https://redcanary.com/blog/testing-initial-access-with-generate-macro-in-atomic-red-team/
WMI Execution
Given the following macro:
Sub Calc()
  Set objWMIService = GetObject("winmgmts:{impersonationLevel=impersonate}!\\.\root\cimv2")
  Set objStartup = objWMIService.Get("Win32_ProcessStartup")
  Set objConfig = objStartup.SpawnInstance_
  Set objProcess = GetObject("winmgmts:root\cimv2:Win32_Process")
  errReturn = objProcess.Create("calc", Null, objConfig, intProcessID)
End Sub
Combined with the following Sysmon config snippets:
<CallTrace condition="contains" name="technique_id=T1047,technique_name=Windows Management Instrumentation,function_name=ProviderExecMethod">C:\Windows\SYSTEM32\framedynos.dll+2b496</CallTrace>
<CallTrace condition="contains" name="technique_id=T1047,technique_name=Windows Management Instrumentation,function_name=CWbemProviderGlueExecMethodAsync">C:\Windows\SYSTEM32\framedynos.dll+2cb3e</CallTrace>
We can alert on the function calls used for WMI process execution:
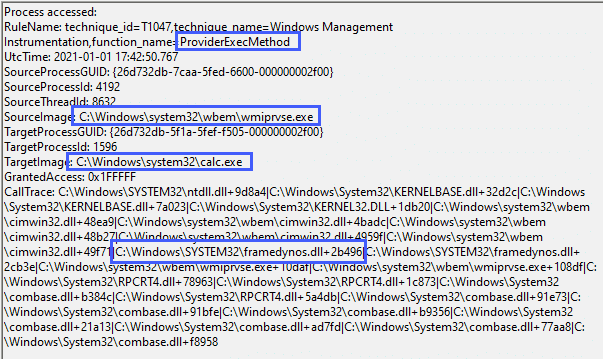
Note that in this case, the parent process for calc.exe is wmiprvse.exe and not WINWORD.exe as this particular macro breaks the typical ‘Word spawns a process’ lineage.
The Sysmon config above that alerts on the ProviderExecMethod function call will also fire if WMI is used to launch processes in other ways, such as PowerShell, and is not limited to macro executions:
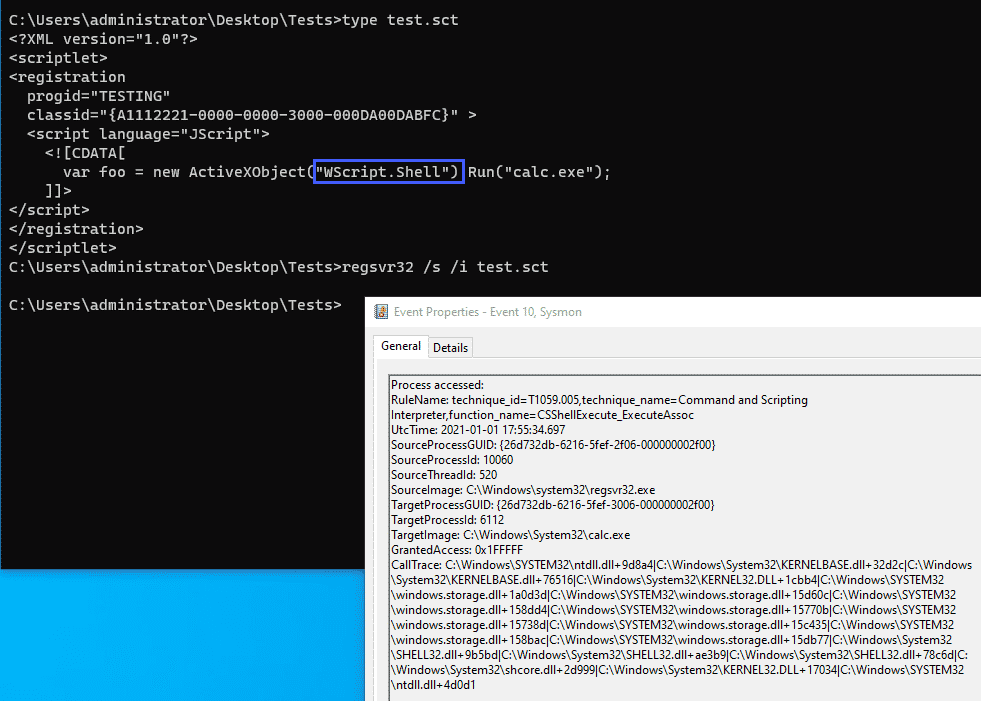
Wscript.Shell
Let’s continue on with our examples and look at the WShellexec function which is another popular execution technique, looking at the following macro code:
Sub Auto_Open()
    Set WshShell = CreateObject("WScript.Shell")
    Set WshShellExec = WshShell.Exec("cmd.exe /c calc")
End Sub
We can alert on the WSShellExec function with the following config snippet:
<CallTrace condition="contains any" name="technique_id=T1059.005,technique_name=Command and Scripting Interpreter,function_name=WSHellExec">C:\Windows\System32\wshom.ocx+c8a0;C:\Windows\System32\wshom.ocx+c39d</CallTrace>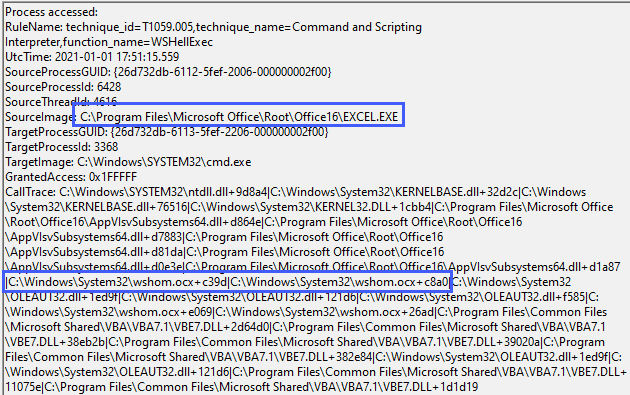
ShellExecute
Similar to Wscript.Shell, ShellExecute can also be used to launch processes via Office Macros, taking a look at the following macro code:
Function ShellExecuteVB()
    Dim objShell
    Set objShell = CreateObject("Shell.Application")
    Call objShell.ShellExecute("notepad.exe", "", "", "open", 1)
End Function
And the following config snippet:
<CallTrace condition="contains" name="technique_id=T1059.005,technique_name=Command and Scripting Interpreter,function_name=CSShellExecute_ExecuteAssoc">C:\Windows\System32\SHELL32.dll+9b5bd</CallTrace>
<CallTrace condition="contains" name="technique_id=T1059.005,technique_name=Command and Scripting Interpreter,function_name=CSShellExecute_DoExecute">C:\Windows\System32\SHELL32.dll+ae3b9</CallTrace>
Gives us the following results:
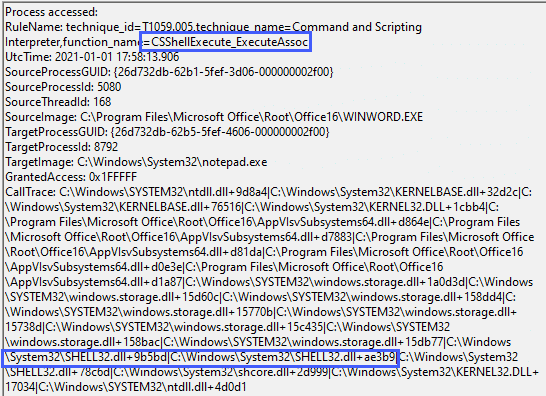
As with some of our previous examples, this function call is not unique to Office macros and will fire whenever the particular function is called, the screenshot below illustrates the same event firing for a sct scriplet executed via regsvr32:
Special shout out here to @spottheplanet and ired.team which were used as a reference for some of the techniques discussed here.
OpenProcess – Office Application
Looking at the final example, we can use our methodology of looking at function calls and combine that with Sysmon Rule Groups, the below example looks at an Office product calling the CreateProcessW function which in my example was used to alert on a VBA RunPE macro:
<Rule groupRelation="and" name="technique_id=T1059.005,technique_name=Command and Scripting Interpreter,function_name=CreateProcessW">
    <SourceImage condition="contains">C:\Program Files\Microsoft Office\Root\Office16</SourceImage>
    <CallTrace condition="contains">C:\Windows\System32\KERNELBASE.dll+76516</CallTrace>
</Rule>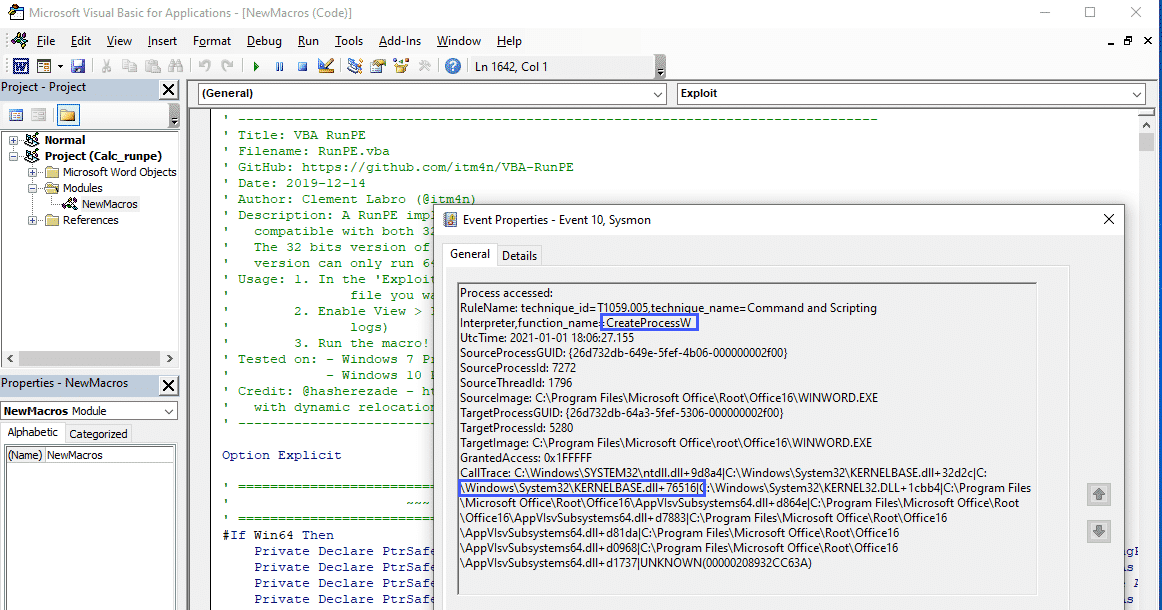
Putting it Together
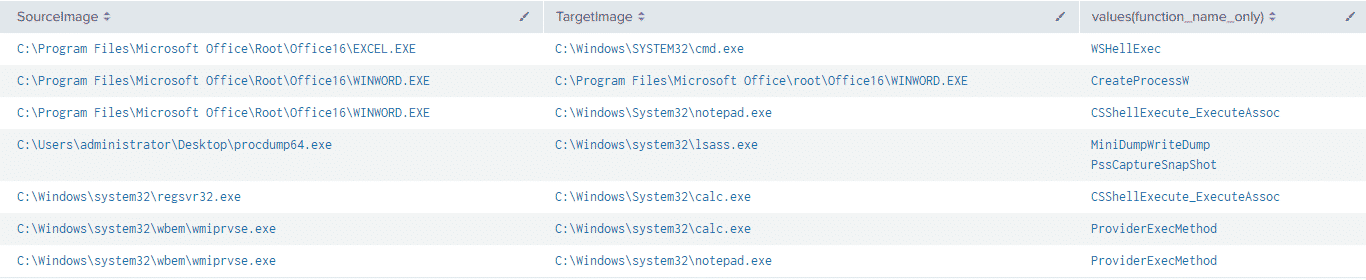
The config snippets outlined above followed the naming convention used by Olaf Hartong’s Sysmon Modular project with an added field called function_name
| eval RuleNameSplit = split(RuleName,",")
| eval technique_name=mvindex(RuleNameSplit,2)
| eval function_name=split(technique_name,"=")
| eval function_name_only=mvindex(function_name,1)
And if we combine this with a simple stats
index=sysmon
| eval RuleNameSplit = split(RuleName,",")
| eval technique_name=mvindex(RuleNameSplit,2)
| eval function_name=split(technique_name,"=")
| eval function_name_only=mvindex(function_name,1)
| stats values(function_name_only) BY SourceImage,TargetImage
We can get a nice view of the functions called by the tests we went through above:
Conclusion
The aim of this post was to highlight how the data contained within the Sysmon ProcessAccess CallTrace field can be translated and used to aid detection and hunting efforts.
The efficacy of this technique is somewhat blunted by the fact that the addresses of the function calls will change with Windows OS and software updates, combined with the manual process involved in translating the addresses into function names. However, despite these barriers, the use of translated function calls in the CallTrace field may be able to help with Sysmon configuration file tuning, especially when used in Sysmon RuleGroups. In addition, extracting additional context from data already being generated is also an added benefit.
Additional utility can also be extracted from these events when paired with other Sysmon telemetry such as ImageLoads and ProcessCreate events.
Appendix – Sample Sysmon Config Used for Post
For the purposes of this post, a bare-bones configuration file was used. If you want to tinker around with these events, feel free to test the following configuration. However, please consider this configuration as untested in a production environment:
<Sysmon schemaversion="4.40">
  <HashAlgorithms>*</HashAlgorithms>
  <CheckRevocation/>
  <EventFiltering>
    <RuleGroup name="" groupRelation="or">
      <CreateRemoteThread onmatch="include"></CreateRemoteThread>
    </RuleGroup>
    <RuleGroup name="" groupRelation="or">
      <ImageLoad onmatch="include"></ImageLoad>
    </RuleGroup>
    <RuleGroup name="" groupRelation="or">
      <ProcessCreate onmatch="include"></ProcessCreate>
    </RuleGroup>
    <RuleGroup name="" groupRelation="or">
      <FileCreateTime onmatch="include"></FileCreateTime>
    </RuleGroup>
    <RuleGroup name="" groupRelation="or">
      <NetworkConnect onmatch="include"></NetworkConnect>
    </RuleGroup>
    <RuleGroup name="" groupRelation="or">
      <ProcessTerminate onmatch="include"></ProcessTerminate>
    </RuleGroup>
    <RuleGroup name="" groupRelation="or">
      <DriverLoad onmatch="include"></DriverLoad>
    </RuleGroup>
    <RuleGroup name="" groupRelation="or">
      <RawAccessRead onmatch="include"></RawAccessRead>
    </RuleGroup>
    <RuleGroup name="" groupRelation="or">
      <ProcessAccess onmatch="include">
        <CallTrace condition="contains" name="technique_id=T1047,technique_name=Windows Management Instrumentation,function_name=ProviderExecMethod">C:\Windows\SYSTEM32\framedynos.dll+2b496</CallTrace>
        <CallTrace condition="contains" name="technique_id=T1047,technique_name=Windows Management Instrumentation,function_name=CWbemProviderGlueExecMethodAsync">C:\Windows\SYSTEM32\framedynos.dll+2cb3e</CallTrace>
        <CallTrace condition="contains any" name="technique_id=T1059.005,technique_name=Command and Scripting Interpreter,function_name=WSHellExec">C:\Windows\System32\wshom.ocx+c8a0;C:\Windows\System32\wshom.ocx+c39d</CallTrace>
        <CallTrace condition="contains" name="technique_id=T1059.005,technique_name=Command and Scripting Interpreter,function_name=CSShellExecute_ExecuteAssoc">C:\Windows\System32\SHELL32.dll+9b5bd</CallTrace>
        <CallTrace condition="contains" name="technique_id=T1059.005,technique_name=Command and Scripting Interpreter,function_name=CSShellExecute_DoExecute">C:\Windows\System32\SHELL32.dll+ae3b9</CallTrace>
        <Rule groupRelation="and" name="technique_id=T1059.005,technique_name=Command and Scripting Interpreter,function_name=CreateProcessW">
            <SourceImage condition="contains">C:\Program Files\Microsoft Office\Root\Office16</SourceImage>
            <CallTrace condition="contains">C:\Windows\System32\KERNELBASE.dll+76516</CallTrace>
        </Rule>
        <CallTrace condition="contains" name="technique_id=T1003.001,technique_name=Credential Dumping,function_name=MiniDumpWriteDump">C:\Windows\SYSTEM32\dbgcore.DLL+6cfb</CallTrace>
        <CallTrace condition="contains" name="technique_id=T1003.001,technique_name=Credential Dumping,function_name=PssCaptureSnapShot">C:\Windows\System32\KernelBase.dll+de67e</CallTrace>
      </ProcessAccess>
    </RuleGroup>
    <RuleGroup name="" groupRelation="or">
      <FileCreate onmatch="include"></FileCreate>
    </RuleGroup>
    <RuleGroup name="" groupRelation="or">
      <RegistryEvent onmatch="include"></RegistryEvent>
    </RuleGroup>
    <RuleGroup name="" groupRelation="or">
      <FileCreateStreamHash onmatch="include"></FileCreateStreamHash>
    </RuleGroup>
  <RuleGroup name="" groupRelation="or">
    <PipeEvent onmatch="include"></PipeEvent>
  </RuleGroup>
  <RuleGroup name="" groupRelation="or">
    <WmiEvent onmatch="include"></WmiEvent>
  </RuleGroup>
  <RuleGroup name="" groupRelation="or">
    <DnsQuery onmatch="include"></DnsQuery>
  </RuleGroup>
  <RuleGroup name="" groupRelation="or">
    <FileDelete onmatch="include"></FileDelete>
  </RuleGroup>
  </EventFiltering>
</Sysmon>
References & Thanks
- https://github.com/jsecurity101/Windows-API-To-Sysmon-Events
- https://github.com/trustedsec/SysmonCommunityGuide
- https://docs.microsoft.com/en-us/sysinternals/downloads/sysmon
- https://zeronights.ru/wp-content/themes/zeronights-2019/public/materials/3_ZN2019__andrej_skablonskijThreatHuntingInCalltrace.pdf
- https://www.ultimatewindowssecurity.com/securitylog/encyclopedia/event.aspx?eventid=90010
- https://docs.microsoft.com/en-us/sysinternals/downloads/procmon
- https://docs.microsoft.com/en-us/windows/win32/api/minidumpapiset/nf-minidumpapiset-minidumpwritedump
- https://redcanary.com/blog/testing-initial-access-with-generate-macro-in-atomic-red-team/
- https://www.ired.team/offensive-security/code-execution/t1117-regsvr32-aka-squiblydoo
- https://github.com/itm4n/VBA-RunPE
- https://github.com/olafhartong/sysmon-modular
Special thank you to https://twitter.com/TheHack3r4chan & https://twitter.com/malwaresoup from the ThreatHunting Slack for lending their time and expertise to help me talk through the ideas and concepts discussed in this post.
Sometime ago I was doing some performance work for start-up of an .NET application ,and it so happened the CLR Perf team had blogged specifically about this. One of critical pieces to start-up speed is loading only necessary Dll’s. And loading these Dll’s on demand reduces the memory consumption, reduces look-up ,which could potentially save few hundred milliseconds based on different configuration. I am going to be using the same example as the CLR perf team had used. Here is the sample code.
using System.IO;
using System.Xml.Linq;

internal class Program
{
 private static void ProcessArgs(string[] args)
 {
 if (args.Length == 2 && args[0] == "text")
 File.WriteAllText(args[1], "Here is the data I am writing");
 else if (args.Length == 2 && args[0] == "xml")
 {
 var myXml = new XElement("data", "Here is the data I am writing");
 myXml.Save(args[1]);
 }
 }
 private static int Main(string[] args)
 {
 ProcessArgs(args);

 return 0;
 }
}
In this sample code we wouldn’t want to load System.Xml.Linq.dll to be loaded if the command line option was set to “text”. In the past to diagnose the load of System.Xml.Linq.dll I would have to attached the windbg and set a break-point on load of System.Xml.Linq using sxe:ld and then get the call-stack using !clrstack. With the ETW it is as simple starting and stopping a trace.
xperf -start clr -on e13c0d23-ccbc-4e12-931b-d9cc2eee27e4:0x400010dc:0xffffffff -f clrevents.etl
This is the clr guid for etw “e13c0d23-ccbc-4e12-931b-d9cc2eee27e4:0x400010dc” and the keyword is 0x400010dc, which is for Fusion,Loader,Jit and Stackwalk combined together. So we are essentially asking clr to log events for Jit,Loader, Fusion and as well as stack-walk information.
After issuing the command start the console app
EtwProvider.exe text text
Stop the trace
xperf -stop clr
And here is the sample output from the etl file
| Opcode name | MethodNameSpace | MethodName | MethodSignature |
| JittingStarted | “Program” | “ProcessArgs” | “void (class System.String[])” |
| Walk | [0x719c9909 : 0x719c9a8d] | ||
| AssemblyLoad | “System.Xml.Linq; Version=4.0.0.0; Culture=neutral; PublicKeyToken=b77a5c561934e089” | 15 | |
| Walk | [0x719c9909 : 0x719c9a8d] |
The above table represents the ordered trace where the Jit compiler is trying to compile ProcessArgs method ,which is in-turn causing the System.Xml.Linq.dll to be loaded. The reason for doing this is because the Jit compiler is not aware of which code path would be taken and that’s the reason for loading the dll even though command line was text and not xml.

The idea behind this post is not show how the dll loading can be avoided, this has been already demonstrated in the CLR blog. I am trying to demonstrate how we can leverage ETW tracing , which is non-invasive and we don’t have to jump though hoops to get the information.
-
Niki911
- Posts: 12
- Joined: Thu Jun 10, 2004 4:06 pm
Tracing DLL-Calls of another program — Utility for that?
Hi,
I know that this question is maybe *not* 100% right here — but anyway:
I need to trace all calls to one (or all) DLLs that another program does.
(Especially all calls to the DirectX-DLLs)
There *was* a good Utility for that named «DLLDetective» on the net:
http://n.ethz.ch/student/adammo/DLLDetective/index.html
But that link is dead and I searched all over the net for a whole day to find that utility anywhere
(DLLDetective is not to be missed with «DLL Detective» which is a completly different software)
Anyone knows where I can find that tool — or any other tool which monitors DLL-Calls of another program?
Thx in advance…
—
Niki
-
madshi
- Site Admin
- Posts: 10856
- Joined: Sun Mar 21, 2004 5:25 pm
Post
by madshi »
Ah, I think I just replied on the borland newsgroup to your question…
-
Niki911
- Posts: 12
- Joined: Thu Jun 10, 2004 4:06 pm
Post
by Niki911 »
Thx. Please read my answer there…
Problem is that I need to know WHERE and WHAT to hook before I can start work
BTW: I now used MadCollection in 3 different commercial applications. Running great
Niki
-
cool_tester
- Posts: 75
- Joined: Sun Oct 31, 2004 5:45 am
Post
by cool_tester »
Did you ever find the detective, I would like to hire him Please let me know where to get it …
Thanks.
Quick Navigation
Posting Permissions
Forum Rules
|
Featured
Learn some of the best reasons why you should seriously consider bringing your Android mobile development expertise to bear on the Windows 8 platform. |