Remote Desktop Protocol, i.e., RDP is a particularly common protocol used to manage the remote windows servers. Administrators often require the guide to check out the user’s activity, such as when the user logged in, authenticated using which IP address, etc. This article will guide you through the step-by-step procedure for tracking and analyzing remote desktop connection logs in the windows server. In short, track & Analyze Remote Desktop Connection Logs in Windows Server
All the logins that occurred on the RDP are logged as events, and each event has an Event ID through which you can determine the actions. RDP connection logs you can view through Event Log Viewer (eventvwr.msc), and understand the reports better, we will split the article into several events and every particular event is assigned with Event ID ,
Network Connection, Authentication, Logon, Session Disconnect/Reconnect, Logoff.
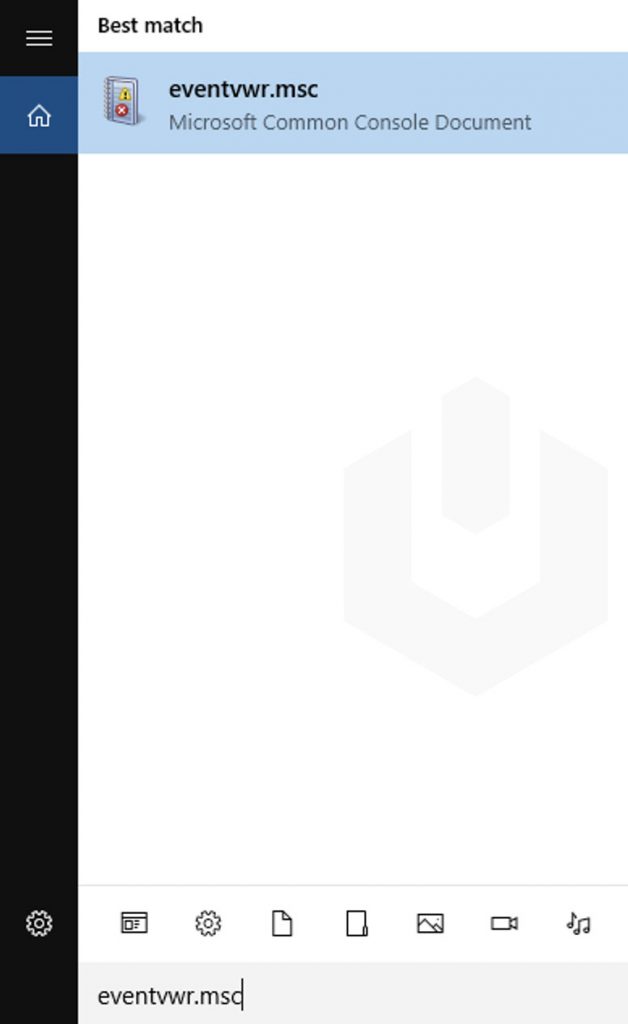
First, login to Windows → Search and Open Event Log Viewer (eventvwr.msc).
Network Connection
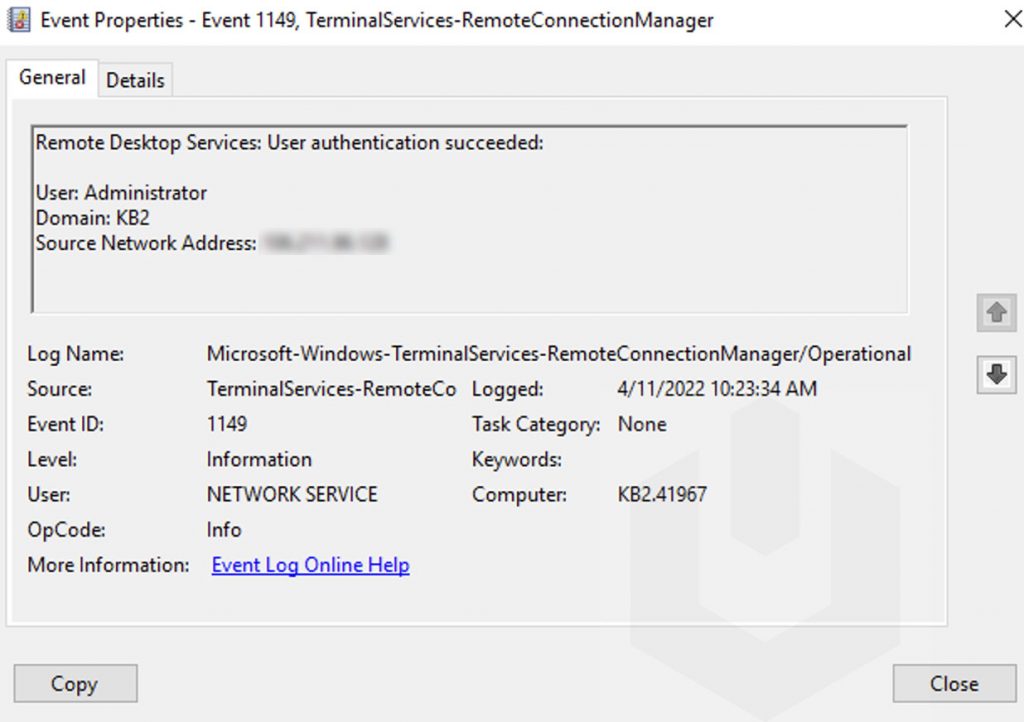
Network connection occurred when a particular user tried to establish a network connection to the remote desktop protocol. Event ID for network connection is 1149 when user authentication succeeds. Generally, authentication success is considered a particular user logged correctly in, but in this case the specific user tries to establish a Network Connection.
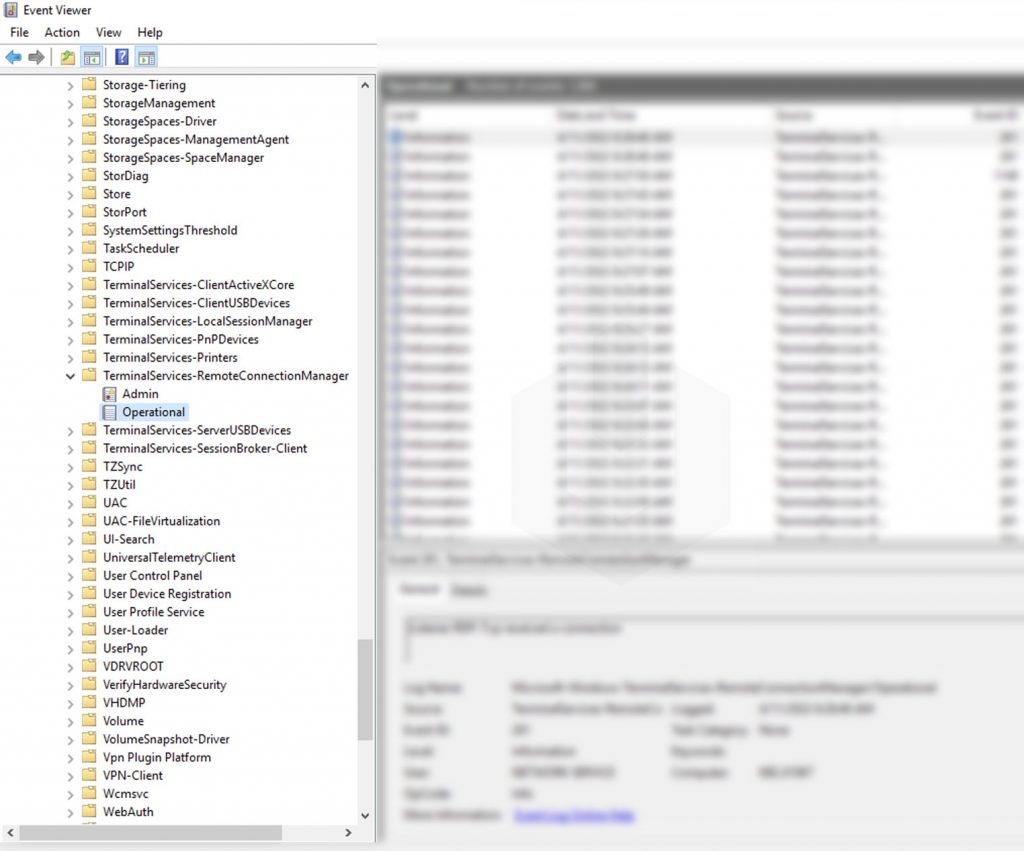
Network connection logs you can find at: Event Viewer → Applications and Services Logs → Microsoft → Windows → Terminal-Services-RemoteConnectionManager → Operational.
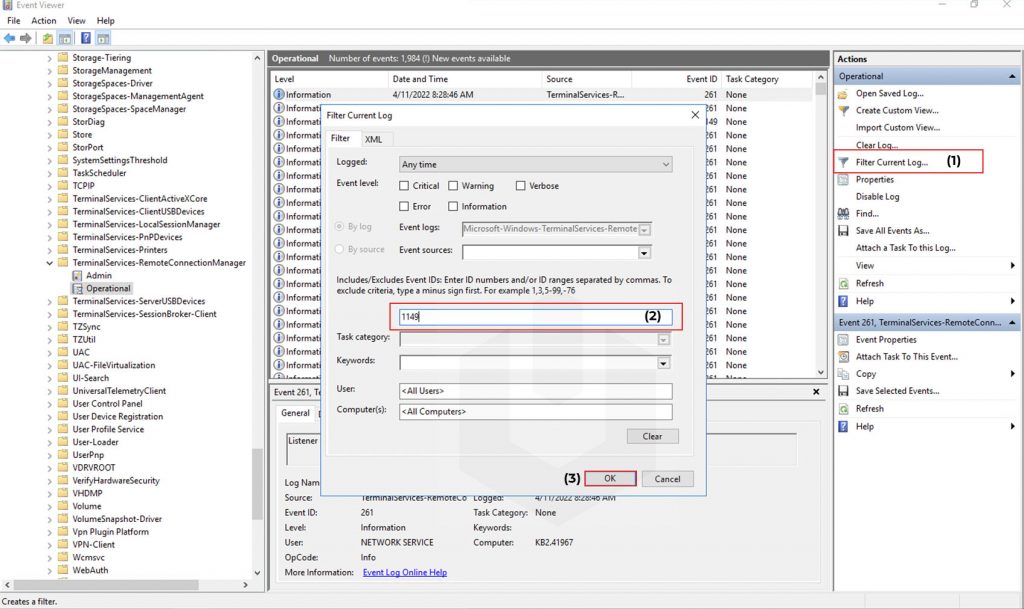
To find the Network Connection Event ID: Click on Filter Current Log → Enter the Event ID 1149 → Click on OK.
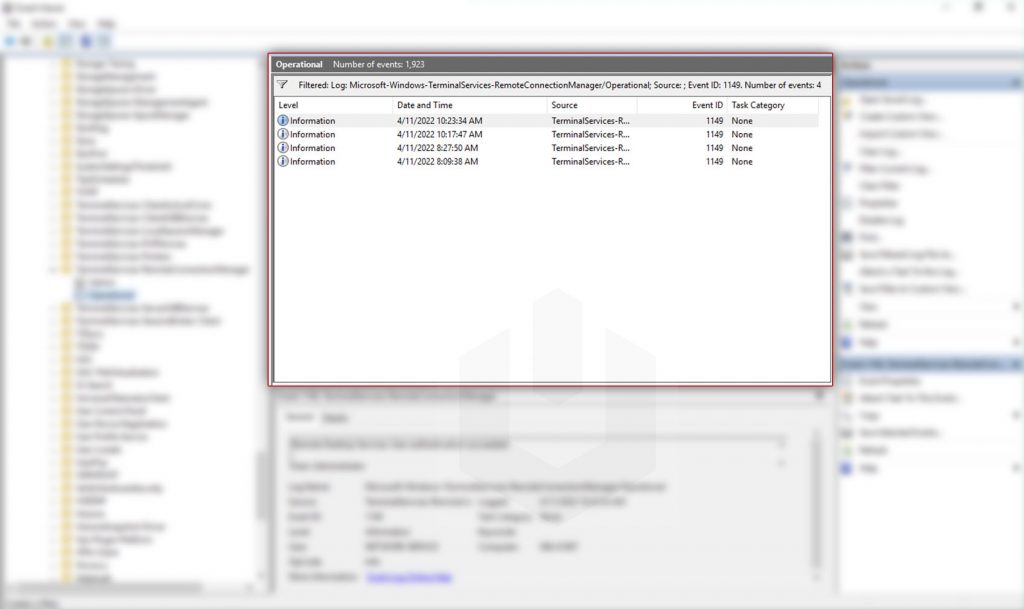
Now, double-click on any of the entry to check the proper details,
Authentication
Here comes the second part, Authentication. This is the second factor logged in the logs where user authentication is shown with two Event IDs,
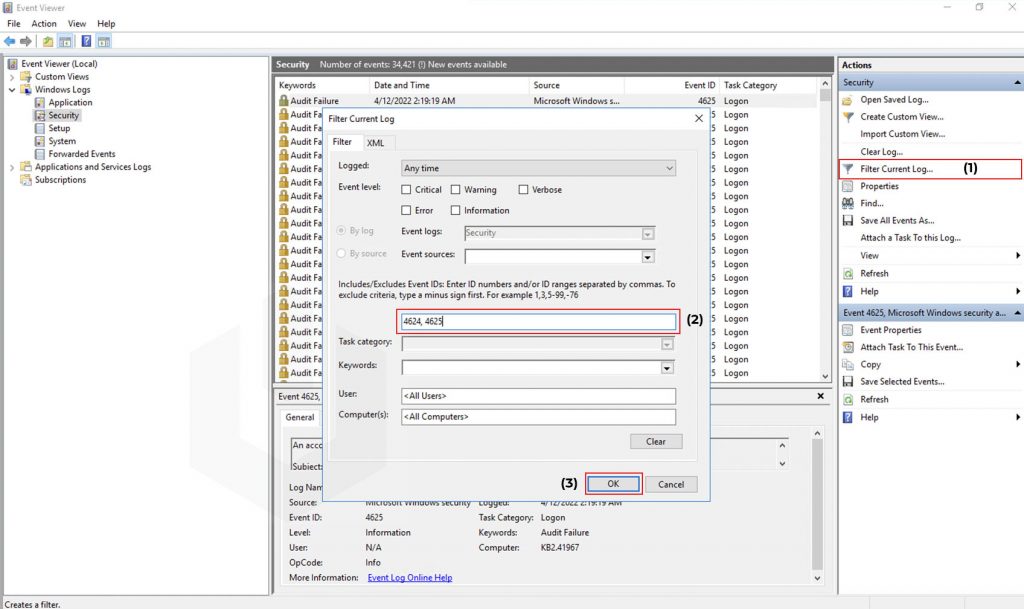
- Successful authentication Event ID (where the user logged into the RDP successful): 4624
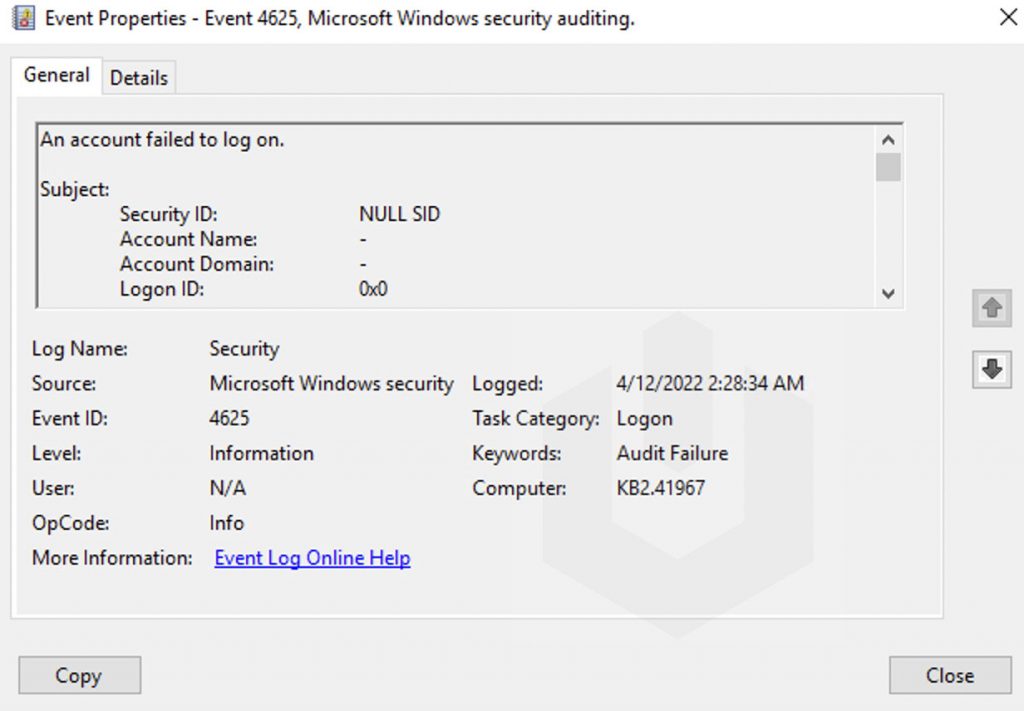
- Un-successful authentication Event ID (where the user failed to log into the RDP successful): 4625
Furthermore, there are again three Logon types,
- Logon type 5: User authenticated to RDP server console, i.e., mstsc.exe /admin mode.
- Logon type 7: User re-connected to the existing RDP session.
- Logon type 10 or 3: The user tries to create another RDP session while already logged into the RDP.
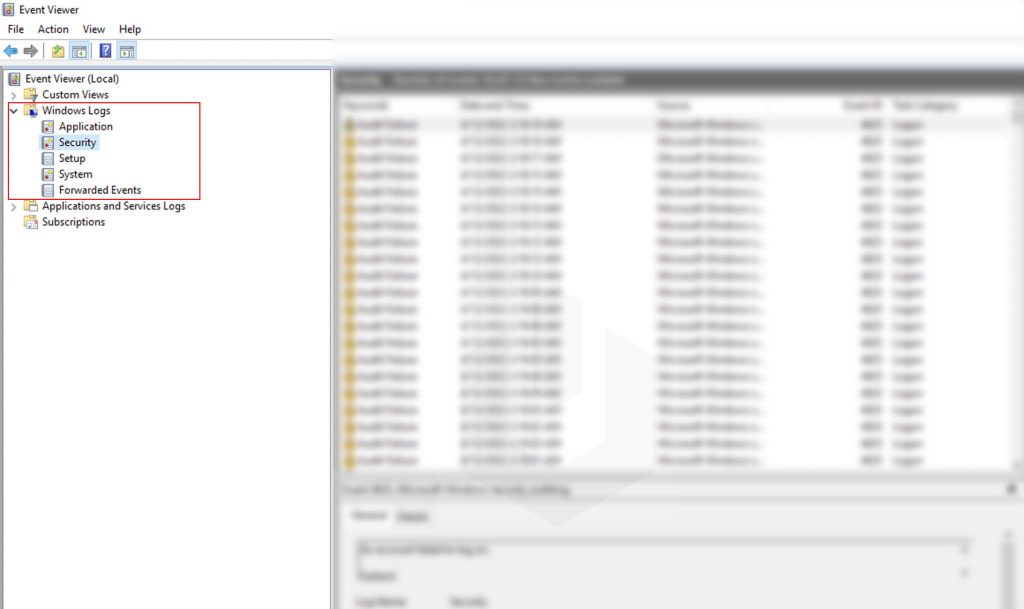
All the authentication logs you can find at: Event Log Viewer → Windows Logs → Security.
To find the Network Connection Event IDs: Click on Filter Current Log → Enter the Event ID 4624 or 4625 → Click on OK.
Now, double-click on any of the entries to check the proper details,
Logon
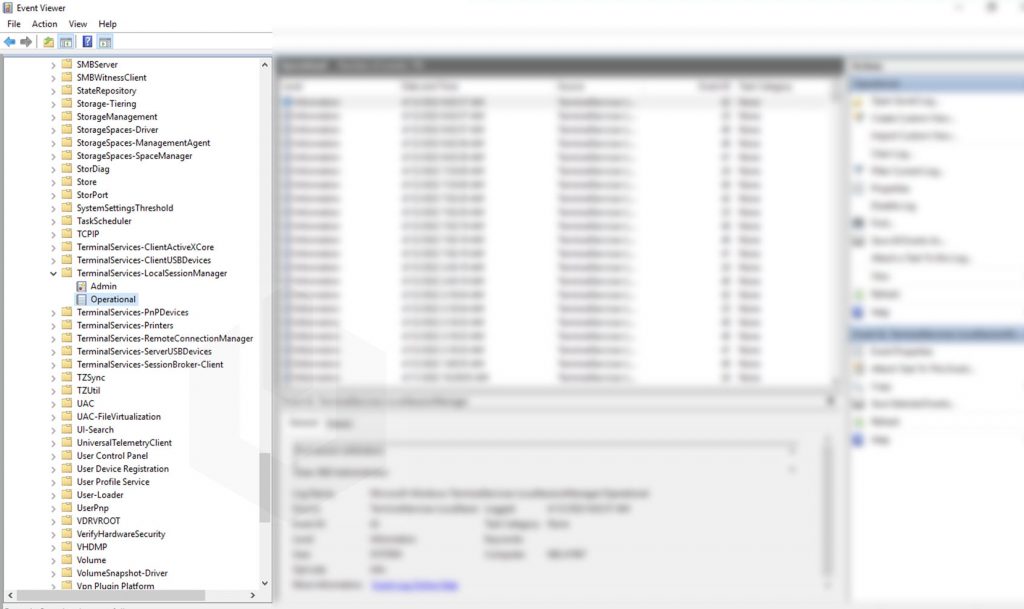
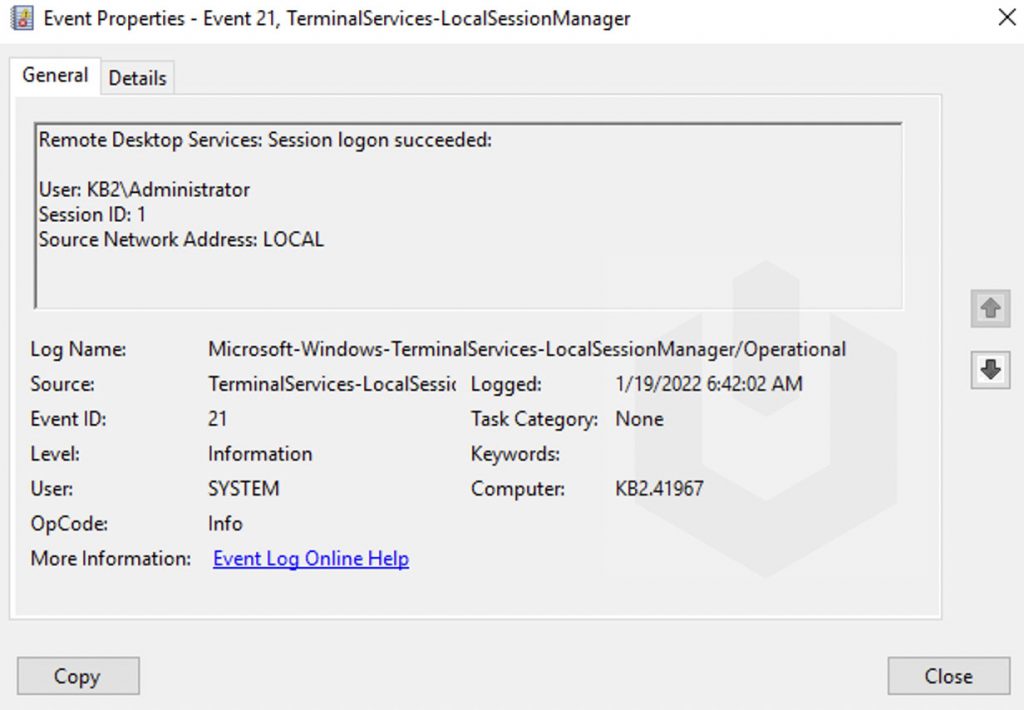
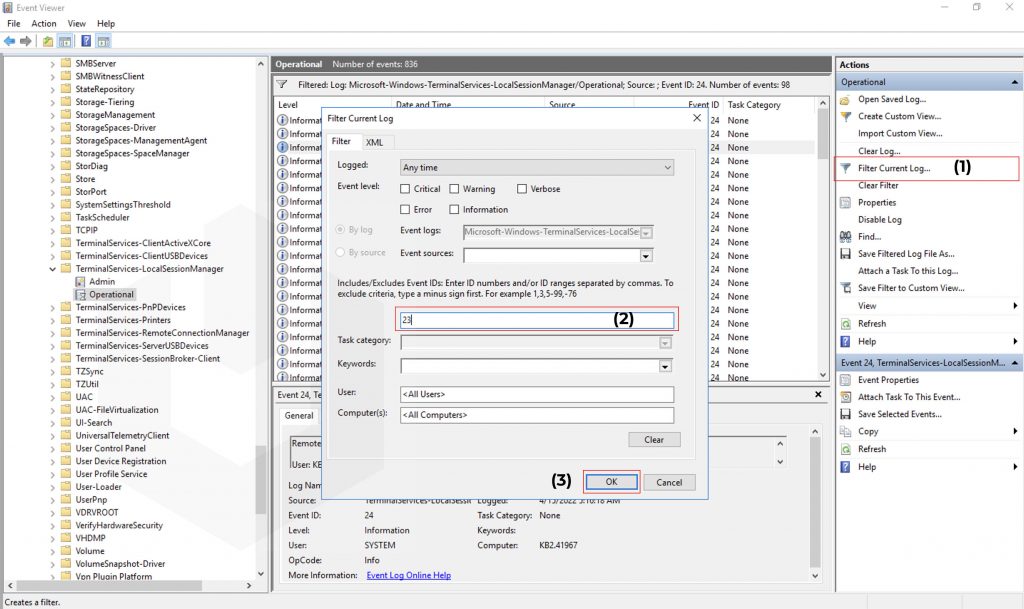
Logon Event IDs will be logged when a user successfully authenticated in the RDP (Remote Desktop Services: Session logon succeeded). The Event ID for the Logon is 21. You can find the Logon logs at Event Log Viewer → Windows → TerminalServices-LocalSessionManager → Operational.
To find the Network Connection Event IDs: Click on Filter Current Log → Enter the Event ID 21 → Click on OK.
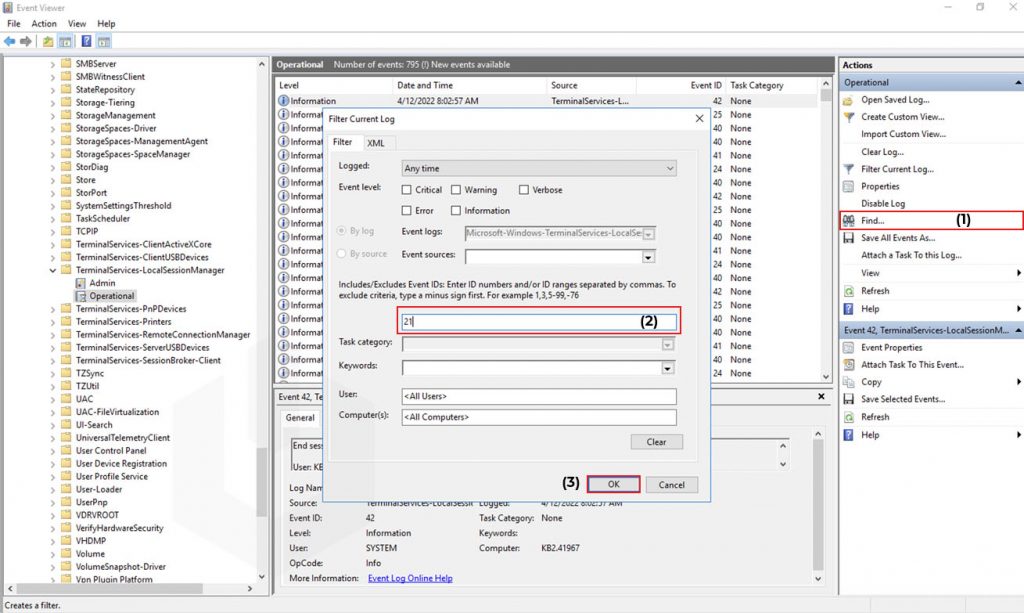
Now, double-click on any of the entries to check the proper details,
Session Disconnect/Reconnect
Session disconnection and reconnection have various reasons. Every reason for disconnection and reconnection shares different event IDs.
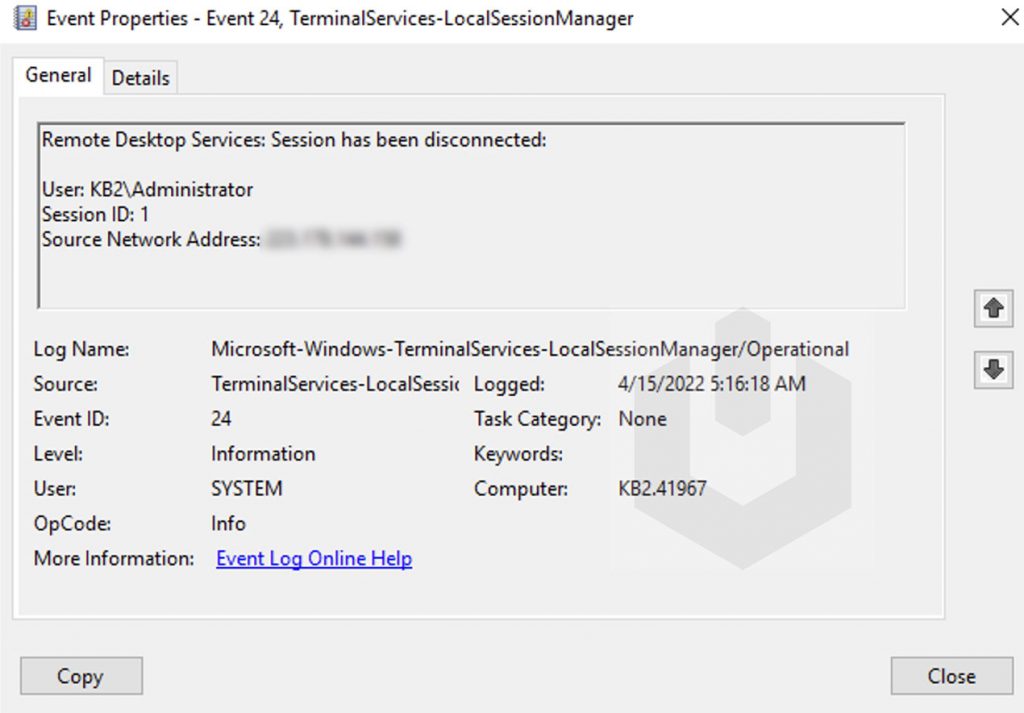
Event ID 24 (Remote Desktop Services: Session has been disconnected): User has disconnected from the RDP session;
Event ID 25 (Remote Desktop Services: Session reconnection succeeded): User has reconnected to the existing RDP session on the server;
Event ID 39 (Session <X> has been disconnected by session <Z>): User has disconnected from the RDP session by selecting the corresponding menu option (instead of just closing the RDP client window). If the session IDs are different, a user has been disconnected by another user (or administrator).
Event ID 40 (Session <A> has been disconnected, reason code <B>). Here you must check the disconnection reason code in the event description. For example:
- Reason code 0 (No additional information is available) User has just closed the RDP client window.
- Reason code 5 (The client’s connection was replaced by another connection) User has reconnected to the previous RDP session.
- Reason code 11 (User activity has initiated the disconnect) User has clicked the Disconnect button in the start menu.
Event ID 4778: User re-connected to RDP session.
Event ID 4779: User disconnected from RDP session.
You can find the Session Disconnect/Reconnect logs at Event Log Viewer → Windows → TerminalServices-LocalSessionManager → Operational.
To find the Network Connection Event IDs: Click on Filter Current Log → Enter the Event ID → Click on OK.
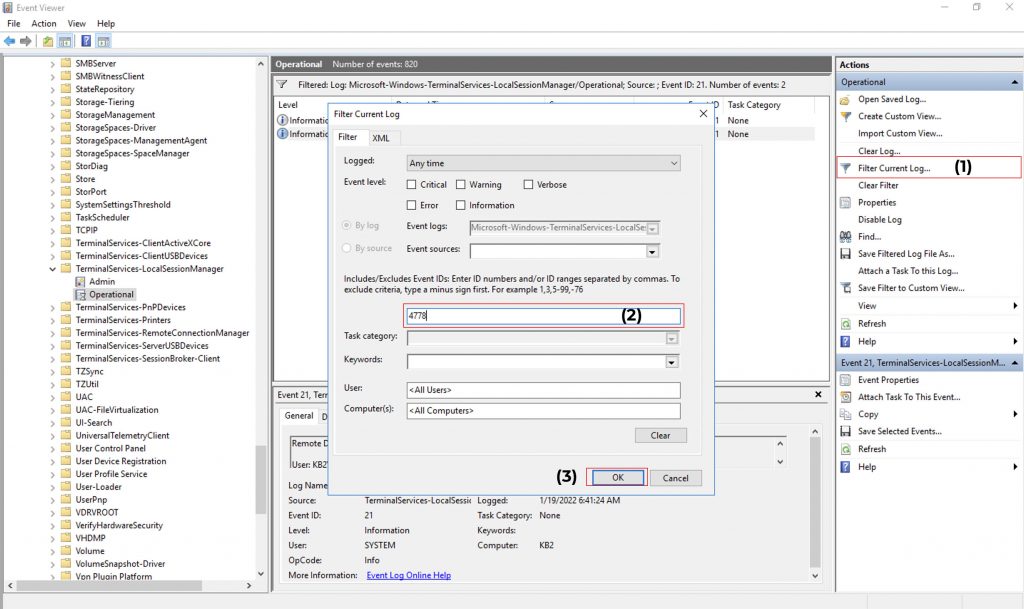
Now, double-click on any of the entries to check the proper details,
Logoff
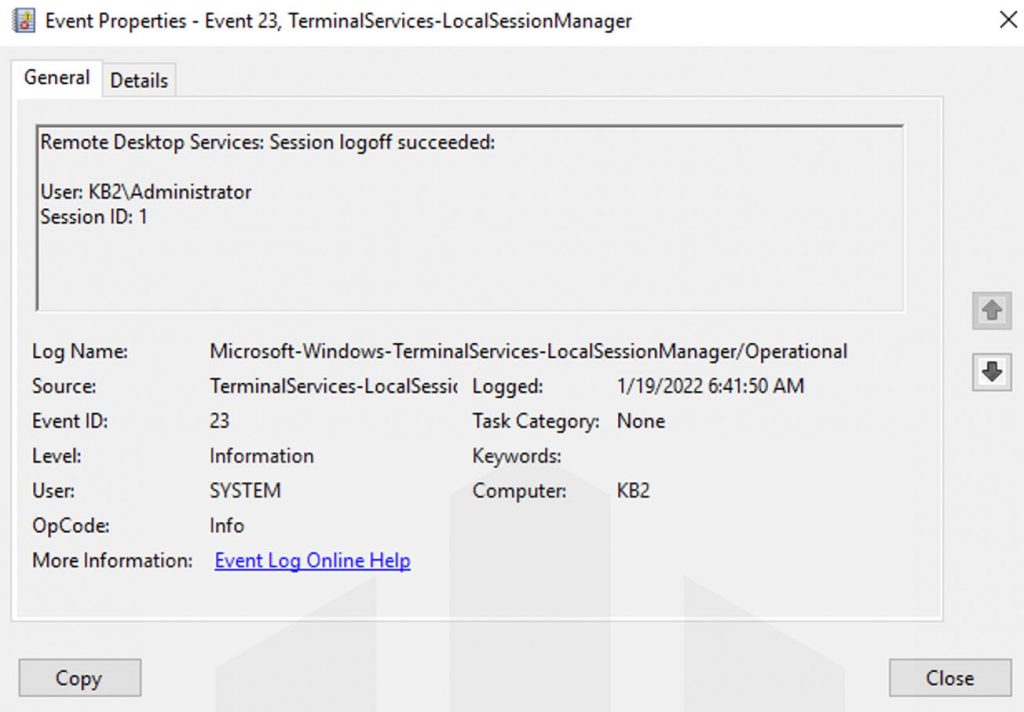
Here comes the last event, which gets logged that helps us when the user ends the session. Logoff shares Event ID 23. Also, you could fine Event ID 4634 (An account was logged off), Event ID 9009 (The Desktop Window Manager has exited with code), Event ID 4647 (User-initiated logoff) and you can find the logs at
Event Log Viewer → Applications and Services Logs → Microsoft → Windows → Terminal-Services-RemoteConnectionManager → Operational.
To find the Network Connection Event IDs: Click on Filter Current Log → Enter the Event ID → Click on OK.
Now, double-click on any of the entries to check the proper details,
How to check Windows server logs (Windows Event Log Types. Microsoft Windows Server is an operating system that provides network administrators with a collection of enterprise level management features. Accordingly, some of these features include data storage, applications, security, network, and hardware management.
Similarly, Microsoft’s collection of desktop operating systems allow you to view event logs through a set of Administrative Tools. So, Windows Server offers similar features but in a more enterprise capacity. After all, event logging and tracing are important parts of running servers. Thus, this guide will explore how you can find Windows server logs and how to interpret the information from them.
Shall we start with How to check Windows server logs (Windows Event Log Types).
Understanding The Windows Event Log
If your servers are positioned in a fairly medium or large company, they may be collecting thousands of events hourly. Especially if you have not configured your Windows Server Event Logs. Basically, the event log is separated into channels. The four most important are:
- System: Features events related to system software and/or hardware. For instance, driver failures or installations.
- Application: Contains events logged by (mostly) Windows applications.
- Security: Contains events pertaining to the security of the Windows system. This may include failed login attempts.
- Setup: Features system related event logs for setups and updates. For instance, Windows updates.
Besides, Microsoft also has channels for its features such as BitLocker, AppLocker, and Windows Firewall. Additionally, the event log may also contain channels for third party software. As a result, Windows Server allows you to collect all your events from separate servers and combine them in a central location. Alternatively, you could feed event logs to a Security Information and Event Management (SIEM) solution that isn’t Microsoft based.
While there is a lot of information collected by the events log by default, it is the auditing feature in Windows that determines what information gets collected and logged.
How to Check Windows Server Logs
There are two main graphical ways you can access the Windows Server event log:
- Event Viewer Microsoft Management Console (MMC)
- Windows Admin Center (WAC)
The WAC isn’t as fully-featured as the Event Viewer. Nonetheless, you can access the Event Viewer from the server or client machine(s) using Windows Administrative Tools. Alternatively, you can use the Windows Server Manager to run the Event Viewer.
Launching The Windows Server Manager
Again, there are quite a few ways you can check server event logs from Windows Server. One of the best ways is using Windows Server Manager which acts as a central hub for our server. By default, Windows Server Manager is a Windows Server start up application. This means that it’s one of the first applications to run when you launch Windows Server. However, you can also run the Server Manager from the start menu or search bar:
- Open the Start Menu (WinKey).
- Search through the applications list for Server Manager or type it into the search field.
- Double click on the Server Manager item.

How to Launch The Event Viewer
Once again, the best way to check Windows Event Logs is through the Event Viewer. You can launch it from the Server Manager using the following steps:
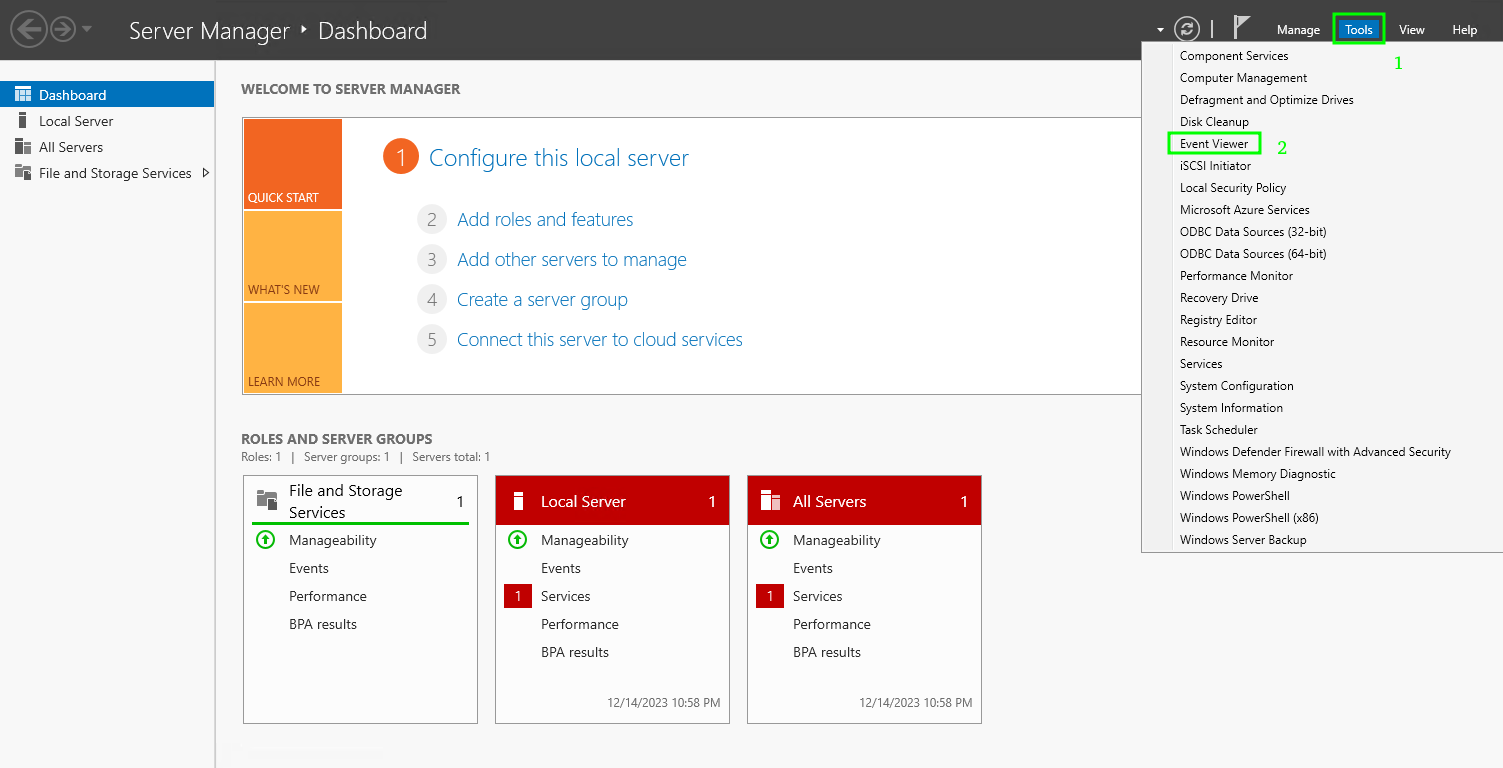
- Click on the top Tools menu button.
- Search the list for Event Viewer.
- Double click on it to open it .

Using The Roles and Server Groups Section To Check Events
You may have noticed that the Events Viewer isn’t the only place you can view events from the Server Manager. As seen, the Server Manager also allows you to view roles and server specific events on the dashboard. You can view File and Storage, Local Server, and All Servers events by using the various widgets in the dashboard.

Clicking on one of the Events options in these widgets will launch a screen similar to this one:

This is called the Events Detail View. It gives you a list of filtration options including:
- Event Security Levels: Filter events according to their severity.
- Event Sources: Origin of an event (applications, services, etc).
- Servers: The machine the event occurred on.
- Time Period: The hours and/or minutes the event occurred in between.
- Event IDs: Each event has a unique ID. You can filter events using these IDs.
Again, we’ll stick to using the Event Viewer because it’s the most fully featured option.
Navigating Through the Event Viewer

One of the most unfortunate facts about Windows Server’s event management system is its lack of built in alerts or notifications. However, you can apply a script or run a program that is triggered when a particular event enters one of your custom views.
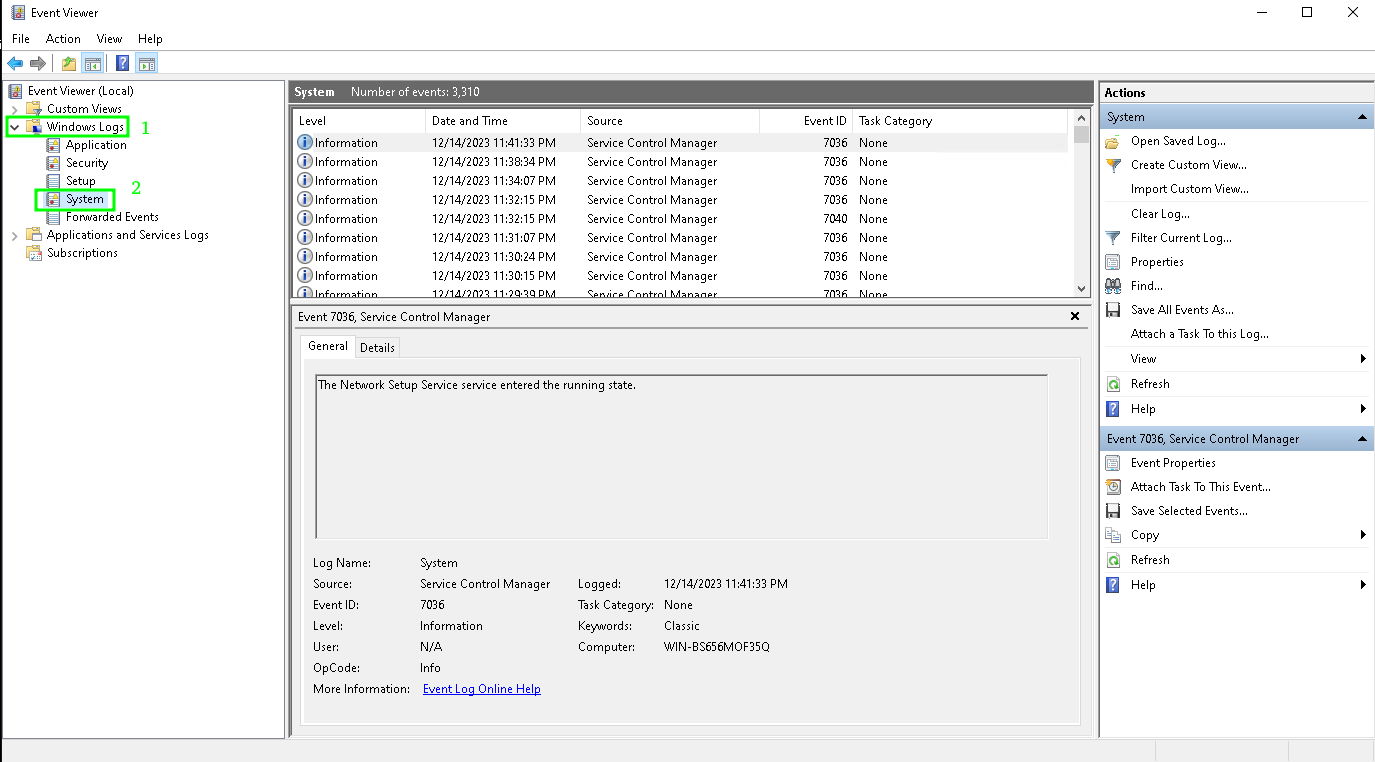
Nevertheless, you should be able to see the four channels we previously mentioned under the Windows Logs folder. You can use the above image as a reference. Ultimately, this is where you will check your Windows Servers Log.
You will notice that the above image features an additional channel called Forwarded Events. This channel is used by servers that have been set up as event collectors. It allows you to see events from other servers.
If you scan through the Event Viewer tree, you should notice a top folder labeled Applications and Services Log. It contains event channels related to installed server software and hardware.
Event Log Levels
When checking Windows Server Logs through the Event Viewer, you’re bound to run into a plethora of event types. They include:
- Information: Logs information event. For instance, when a task is completed successfully or when the system informs the user of something.
- Warning: Used to log system and software warnings. They don’t demand immediate action. However, they may warn you of a future problem, like disk space running out.
- Error: Indicates a system, software, or hardware issue that requires immediate action. For instance, a driver failing to load upon start up.
- Success Audit (Security log): This signifies the success of an audited security event. For instance, a user successfully logging onto the server or client.
- Failure Audit (Security log): This signifies the success of an audited security event. For instance, a user failing to log onto a server or client.
It is time to explain How to Check Windows Server Logs (Windows Event Log Types).
Event Log Types
In this section of the guide, you’ll explore the event types (Event Sources) you should be monitoring. Ultimately, keeping track of important logs requires you to use event sources to identify vulnerabilities in your system. Certainly, you’ll be able to find the event source by using the Source tab for each event.

Alternatively, you can create a custom view by:
- Right clicking on any one of the folders or objects on the right tree panel eg. Windows Logs.
- Next, select Create Custom View… from the context menu.
If you execute the above steps correctly, you should be presented with this screen.
You can then use either the filer screen or XML screen to create an event source-based view.
1. Application Whitelisting
As shown, you should have a list of approved services and applications. Anything that doesn’t appear on your whitelist should be flagged as suspicious. Consequently, there are two systems built into the latest versions of Windows for application control:
- AppLocker
- Microsoft Defender Device Guard
You can either use these systems individually or in tandem. Regardless, DeviceGuard is considered the most difficult to configure but also the most secure. As such, admins may elect to use it over AppLocker. AppLocker is easy to bypass by compromising the Windows NT Kernel. Comparatively, the Device Guard is much more robust and much more secure against exploits against the Windows NT Kernel.
However, if it’s your first time working with application control software, it is recommended that you use AppLocker with the Event Viewer.
What Should You Do When You Encounter This Event?
Your event source is dependent on the application control solution you’ve chosen to use for black and whitelisting. For instance, any event related to the AppLocker will use AppLocker as a source. Likewise, if you use Microsoft Defender, Device Guard events will use DeviceGuard as a source. It’s important that you investigate any suspicious events related to these sources. Correspondingly, bad actors may be trying to whitelist apps that you’ve previously blacklisted because of the vulnerabilities they impose on your system. You should:
- Check your app control configurations.
- Consult with a network security specialist to track down the person that may have changed your rules.
- Change all necessary Passovers.
2. Randomly Cleared Events and Audit Logs
If you notice that some of your events have been randomly cleared, then your network/system has most likely been compromised by bad actors. Especially, these bad actors may be trying to hide malicious activity by purging events. At this time it’s important to remember that event logs are not typically cleared during normal operations. As such, if you notice the following event logs, you should be worried:

What Should You Do When You Encounter This Event?
Nevertheless, collecting logs centrally on a server that only you (or your network’s admin) can access is the best way to protect yourself against cleared event logs. This will allow you to view deleted or cleared event logs without restoring your server from a backup. You can then confirm if a bad actor compromised your system.
3.Account Usage
A variety of users will log in to your server(s). You can use these event types and IDs to detect unauthorized account usage and remote desktop logins. Some users can use Windows Remote Desktop to configure systems that they should not be allowed to. Equally, users should not be logging into your server using Remote Desktop when there are other tools such as Power Share, Windows Admin Console (WAC), etc.
You (or your network administrator) should especially be paying attention to privileged Active Directory groups such as the domain and enterprise admin groups. Furthermore, you must make sure that your system isn’t adding or removing users from these groups without permission.
Account lockouts are important events that should be monitored. They can often signify brute force attempts by malicious actors. These bad actors may be trying to guess a user’s password. Nevertheless, the following are the events that fall under this category:

What Should You Do When You Encounter This Event?
When you encounter this event, it’s important to connect all related users and/or groups. First step is to investigate why a specific user was locked out. Was it indeed a bad actor or have they forgotten their password? Once you’ve fully ascertained the reasons for the user’s failed login attempts, you can act accordingly.
4. Group Policy Errors
Evidently, you use Group Policy Objects (GPOs) to configure and enforce your organization’s security policy. Thus, if the group policies you’ve set aren’t enforced, then your system may be compromised. In most cases, it may be the result of a bad actor attempting to prevent your system from enforcing certain policies so they can enact their own.
However, it can also be something benign or innocent. For instance, the group policy client may be failing for some reason. Regardless, it’s always important to monitor your group policies as they may indicate something nefarious occurring on your network..

What Should You Do When You Encounter This Event?
Your group policies can be viewed in the GroupPolicy channel (Microsoft > Windows > GroupPolicy). It allows you to see if your system is applying Group Policy Objects (GPOs) successfully. Once you encounter any errors in this view, you should first determine why the error is concerning. It may not be the result of a breach or attempted exploit. One of your machines may be struggling with low system resources. Make sure to check if your GroupPolicies are operational.
5. Software and Service Installation
By the same token, you may be regularly installing and updating software and services on your server. However, installations occur daily. Of course, this depends on the server’s usage and age. Freshly commissioned servers may require daily installations, backups, and updates. Nonetheless, if you see suspicious software and service-related events, then it may be a sign of malicious activity carried out by a bad actor.
What Should You Do When You Encounter This Event?
Look out for keywords in events such as “Installed”, “New”, “Removed”, “Update”, and ”Updated”. You can find the above keywords by using a search or a custom view of your creation. You must investigate every suspicious occurrence you find and review logs to ensure that every software/service installation and removal has been approved.
6. Windows Updates
As with the desktop version of the operating system, Windows Server also requires regular updates. These updates are imperative because they often contain important system patches. If these Windows updates fail, it may leave your system vulnerable.
Consequently, you must check the WindowUpdateClient and Servicing event sources from the System channel. Alternatively, you can create a custom view filtered according to these event sources. Nevertheless, you must validate that there are no errors or information events that indicate Windows Update failures.
What Should You Do When You Encounter This Event?
The first thing you must do is investigate why your Windows Updates are being interrupted. It may not be a result of a malicious. Your server(s) may be low on system resources or your system may be experiencing a network error. As you investigate the source of the issue, you must ensure that your Windows Server operating system is up to date. You can manually download and install Windows Server Cumulative Updates.
7. Windows Firewall
The Windows Firewall is enabled by default. It protects servers and clients against malicious activities from your internal trusted network. Henceforth, it’s just as important as any firewall you have segregated in your network. Thus, you must check that your firewall is it’s working, and if the status and/or rules have been updated or changed, etc.
Event sources to look out for include: Firewall, Firewall-Client, Firewall-CPL, Firewall-Driver, and Firewall-Service. Again, you can create a custom view with these event sources.
What Should You Do When You Encounter This Event?
Again, you must determine the source of the issue. Is someone trying to reconfigure your firewall? You should consider using third party firewalls for your internal system. There are other steps you can take to improve your overall cybersecurity.
8. Application Crashes
Application crashes are fairly common. However, they may indicate a malicious attack where a bad actor is forcing processes and services to shut down. Therefore, you or your system administrator must check the event logs for instances of Blue Screen of Death (BSOD), Windows Error Reporting (WER), Application Crashes, and Hang events.

What Should You Do When You Encounter This Event?
Again, you should determine the source of the crash, freeze, etc. Are the affected applications important to the security of your network? Which machines are they specifically related to? This will help you decide if you must investigate further or change the posture of your network’s security.
Thank you for reading How to Check Windows Server Logs (Windows Event Log Types Explained). We shall conclude.
How to Check Windows Server Logs (Windows Event Log Types) Conclusion
В этой статье мы рассмотрим, как включить логирование всех DNS запросов пользователей, которые получает DNS сервер на Windows Server, и выполнить их анализ. У меня такая возникла, когда понадобилось декомисснуть (удалить) старый контроллер домена Active Directory в филиале и нужно было понять, какие устройства все еще используют этот DNS сервер. После включения DNS лога и его анализа я смог найти оставшиеся устройства и перенастроить их на другие DNS сервера. Также эта методика поможет вам найти в сети хосты с подозрительной активность (обращения к вредоносным URL, хостам управления ботнетами и т.д.).
Конечно, можно поставить на сервер Wireshark, network monitor или pktmon и отслеживать весь трафик на 53 порту, но использование встроенной функции логирования DNS запросов намного проще.
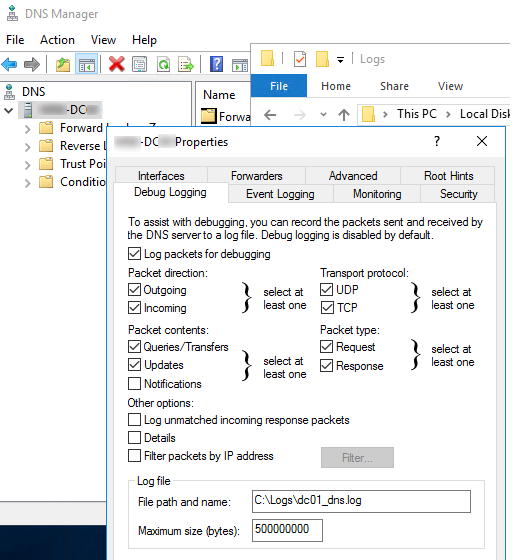
По умолчанию в Windows Server отключено логирование DNS всех пакетов. Чтобы его включить:
- Запустите консоль DNS Manager (
dnsmgmt.msc
) и подключитесь к нужному DNS серверу; - Откройте его свойства и перейдите на вкладку Debug Logging;
- Включите опцию Log packets for debugging;
- Далее можно настроить параметры логирования: выбрать направление DNS пакетов, протокол (UDP и/или TCP), типы пакетов (простые dns запросы, запросы на обновление записей, уведомления);
- С помощью опцию Filter packets by IP address можно указать IP адреса, для которых нужно логировать отправленные или полученные пакеты (поможет существенно уменьшить размер лога).

- В поле Log file path and name укажите имя текстового файла, в который нужно записывать все события. По умолчанию размер DNS лога ограничен 500Мб. После достижения этого лимита старые события начнут перезатираться новыми.
Также вы можете включить логирование DNS или получить текущие настройки с помощью PowerShell:
Get-DnsServerDiagnostics
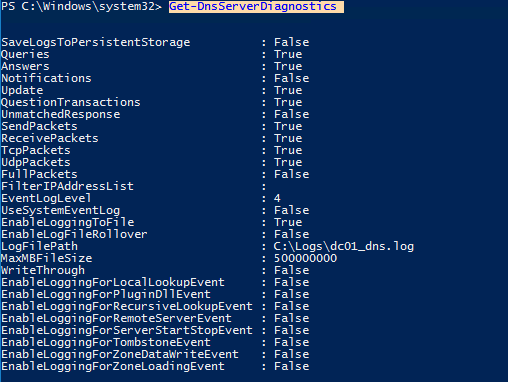
Обратите внимание, что на высоконагруженных DNS серверах Windows логирование DNS запросов может вызвать дополнительную нагрузку на CPU, память и дисковую подсистему (диски должны быть достаточно производительными).
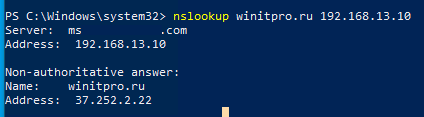
Теперь выполните с любого компьютера DNS запрос к этому серверу (IP адрес нашего DNS хоста с Windows Server 192.168.13.10), например:
nslookup winitpro.ru 192.168.13.10
Или выполните DNS запрос с помощью PowerShell:
Resolve-DnsName -Name winitpro.ru -Server 192.168.13.10
Данный запрос вернул клиенту IP адрес запрошенного сервера.
Проверим теперь, что этот запрос отобразился в логе DNS сервера.
Для этого, выполним поиск в текстовом логе по IP адресу клиента (192.168.13.200). Можно открыть лог файл в блокноте, а можно выполнить поиск по нему с помощью PowerShell:
get-content "C:\Logs\dc01_dns.log" | Out-String -Stream | Select-String "192.168.13.200"

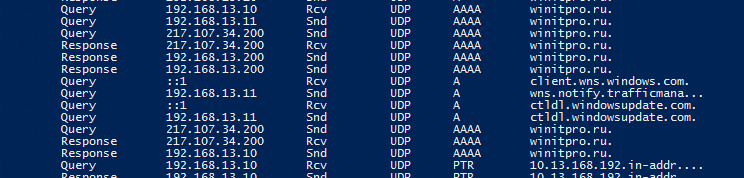
Событие выглядит так:
4/29/2021 2:30:20 AM 0D0C PACKET 00000272D98DD0B0 UDP Rcv 192.168.13.200 0002 Q [0001 D NOERROR] A (8)winitpro(2)ru(0)
Как вы видите, в логе указано: от клиента 192.168.13.200 получен (rcv) DNS запрос по протоколу UDP на разрешение имени (8)winitpro(2)ru(0), а затем DNS сервер успешно (NOERROR) отправил ему ответ (snd).
Все поля описаны в начале файла:
Field # Information Values
------- ----------- ------
1 Date
2 Time
 3 Thread ID
4 Context
5 Internal packet identifier
6 UDP/TCP indicator
7 Send/Receive indicator
8 Remote IP
9 Xid (hex)
10 Query/Response R = Response
blank = Query
11 Opcode Q = Standard Query
N = Notify
U = Update
? = Unknown
12 [ Flags (hex)
13 Flags (char codes) A = Authoritative Answer
T = Truncated Response
D = Recursion Desired
R = Recursion Available
14 ResponseCode ]
15 Question Type
16 Question Name
Из-за специфического формата, анализировать DNS лог вручную довольно сложно, поэтому для преобразования DNS запросов в более удобный формат можно использовать готовый PowerShell скрипт Get-DNSDebugLog.ps1.
Скачайте данный файл к себе на диск. Затем разрешите запуск PowerShell скриптов в текущей консоли:
Set-ExecutionPolicy -Scope Process Unrestricted
Импортируйте функцию из файла Get-DNSDebugLog.ps1 в свою сессию:
. C:\ps\Get-DNSDebugLog.ps1
Теперь можно преобразовать DNS лог в более удобный вид:
Get-DNSDebugLog -DNSLog C:\Logs\dc01_dns.log | format-table
[Или можно экспортировать полученный результат в CSV файл для дальнейшего анализа в Excel (либо можно напрямую обращаться из PowerShell к Excel файлу и заносить в него нужные строки).
Get-DNSDebugLog -DNSLog C:\Logs\dc01_dns.log | Export-Csv C:\log\ProperlyFormatedDNSLog.csv –NoTypeInformation
Вы можете экспортировать данный файл в Excel и использовать его для анализа DNS запросов (в файле есть адреса хостов и DNS имена, за которыми они обращались к вашему DNS серверу).
Также для анализа лог файла с DNS запросами можно использовать Log Parser 2.2 (https://docs.microsoft.com/en-us/archive/blogs/secadv/parsing-dns-server-log-to-track-active-clients). Например, следующая команда выведет информацию о количестве DNS запросов с каждого IP адреса:
LogParser.exe -i:TSV -nskiplines:30 -headerRow:off -iSeparator:space -nSep:1 -fixedSep:off -rtp:-1 "SELECT field9 AS IP, REVERSEDNS(IP) AS Name, count(IP) as QueryCount FROM "C:\Logs\dc01_dns.log" WHERE field11 = 'Q' GROUP BY IP ORDER BY QueryCount DESC"

В этом примере мы использовали текстовые файлы для сбора DNS логов. В Windows Server 2012+ вы можете записывать DNS запросы прямо в журнал Event Viewer (
Microsoft-Windows-DNS-Server/Audit
). Но на мой взгляд текстовые DNS логи анализировать гораздо проще.
Конечно, если вам нужно вести логирование DNS запросов на множестве серверов, предпочтительнее слать их нормальную систему сбора логов, хранения и обработки логов, такую как Splunk, ELK, Graylog или Azure Log Analytics.
После включения DNS лога и его анализа я нашел IP адреса устройств, которые все еще используют этот DNS сервер и перенастроил их на другие DNS сервера. Теперь, если старый DC не содержит FSMO ролей, то его можно спокойно удалять (события логона пользователей при этом роли не играют).
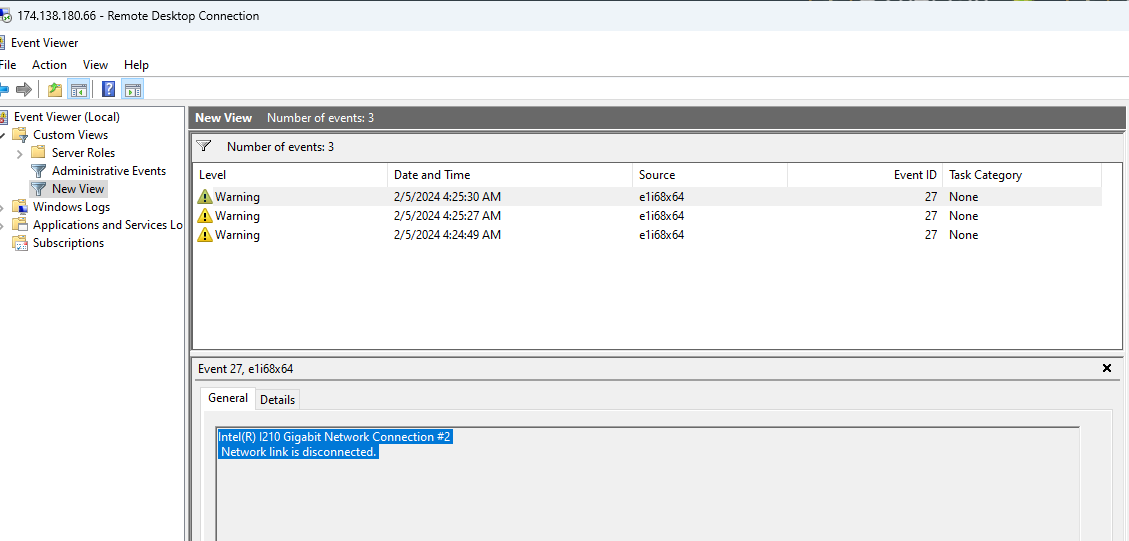
When a network disconnect occurs, it can affect the functionality of various applications and services that rely on a stable network connection. By being aware of these disconnects, We can precisely identify where and when the issues are happening, which helps in narrowing down potential causes. This targeted approach allows for quicker and more effective resolution of problems, ensuring that the overall performance and reliability of network-dependent applications and services are maintained.
Whenever you see logs on your trading platform indicating a network disconnect, you should check if the network adapter of your server has been disconnected from the internet. This disconnection can cause your trading platform to lose communication with your broker’s server, leading your algorithm to fail in closing or opening trades.
If your server did not reboot (all applications are running), yet your trading platform logs show a network disconnect, you need to determine the cause of the disconnect. To do this, check the Event Viewer on your server. This will help you identify whether the disconnection was due to the server’s network losing internet connection or if it was an issue between your trading platform and your broker’s server.
To check for network disconnect, follow the steps below:
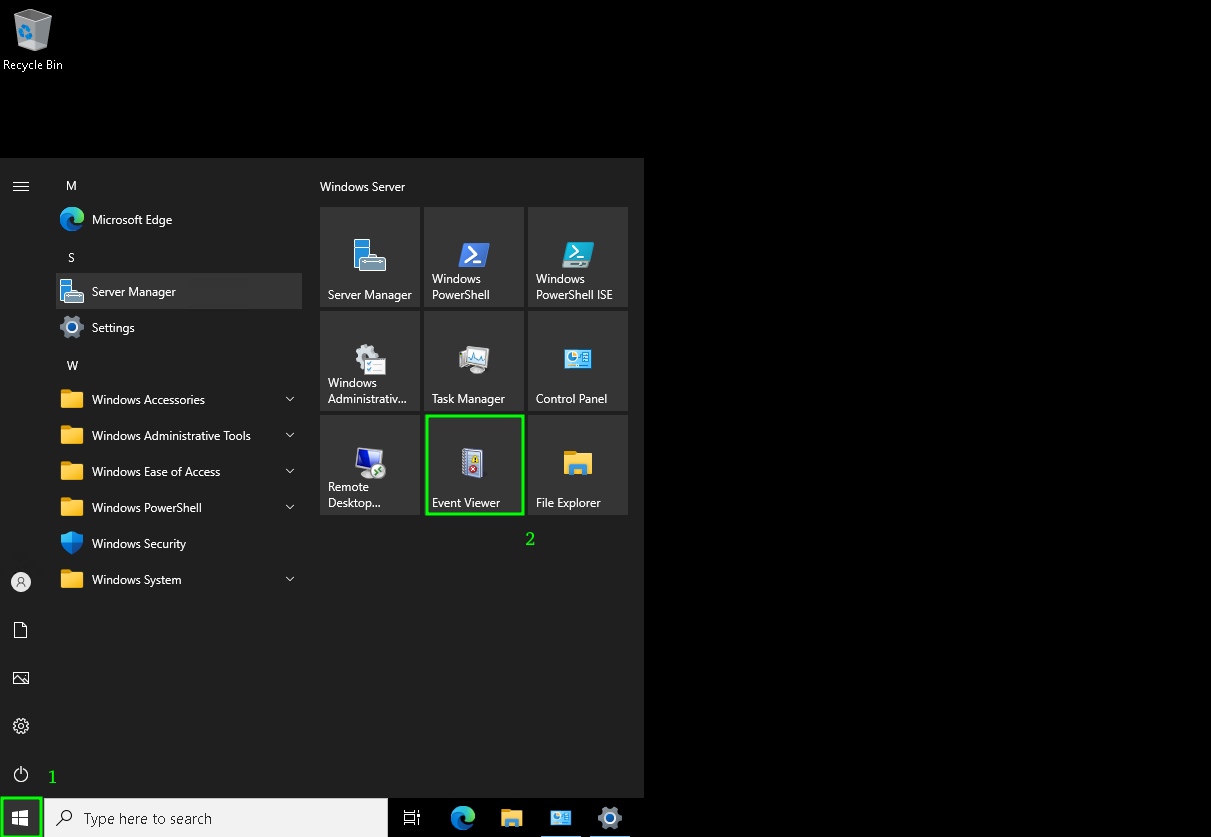
1
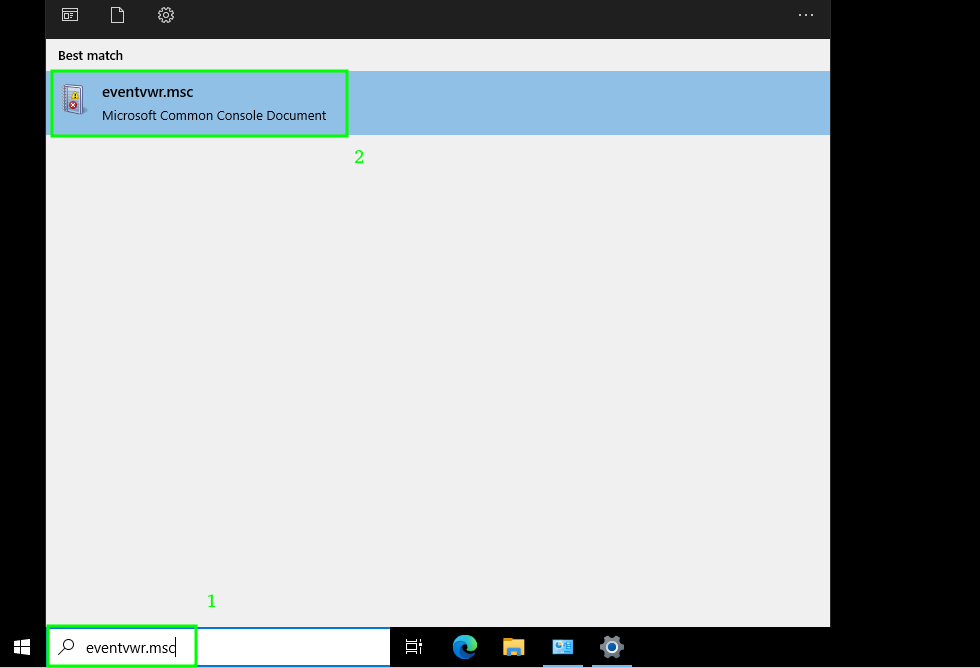
Open the Event Viewer by typing Event Viewer in the Windows search bar.
2
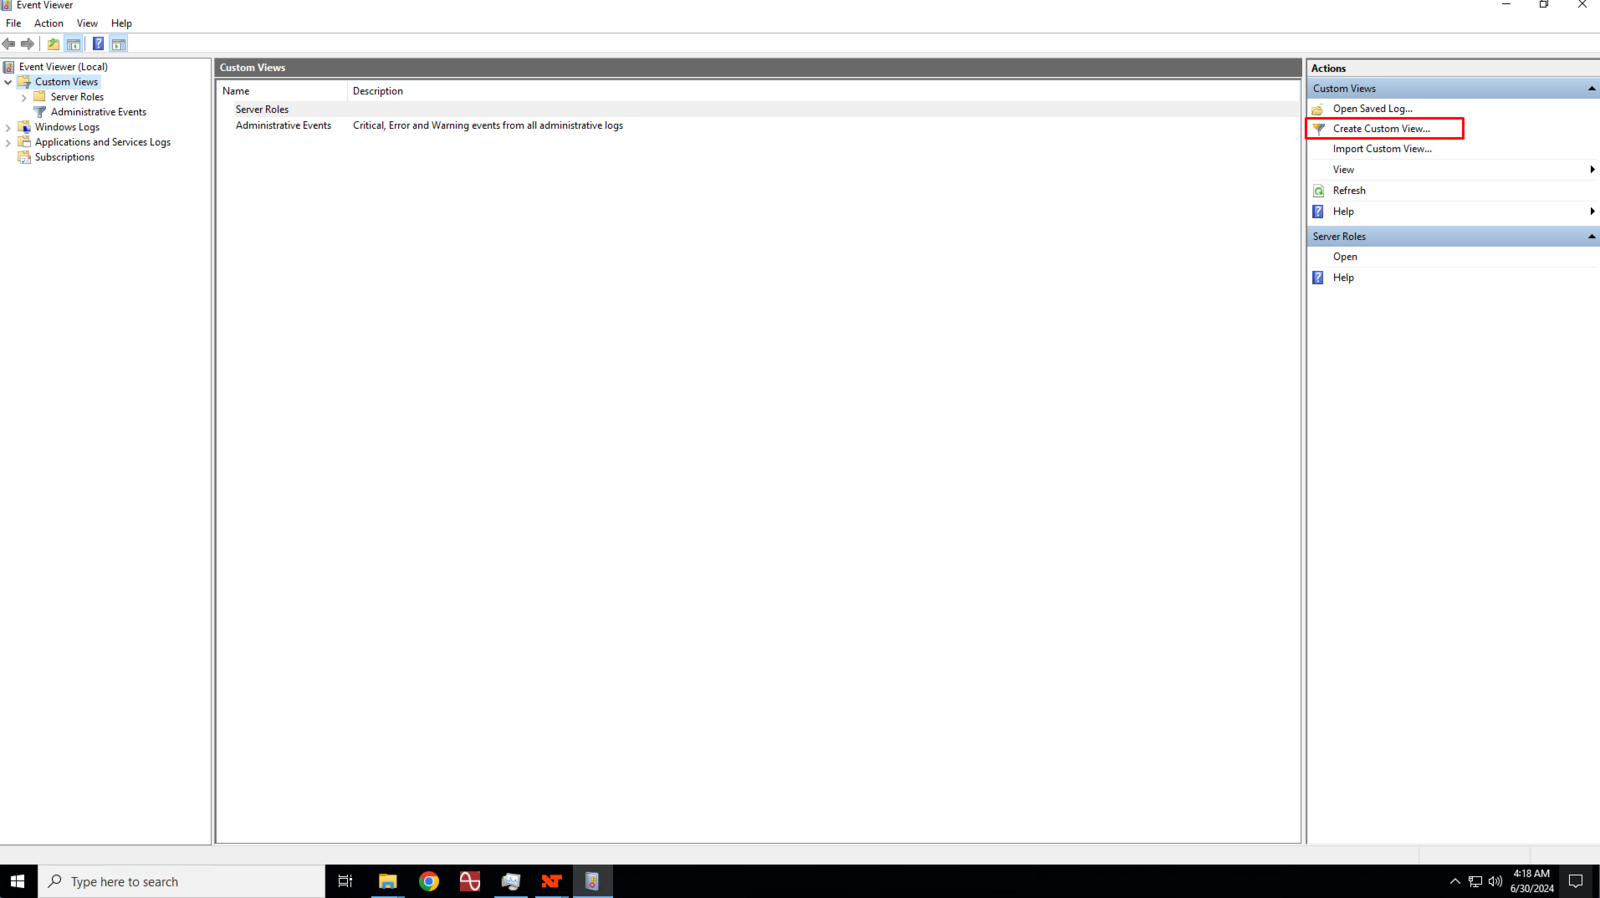
In the right pane, click on Create Custom View
3
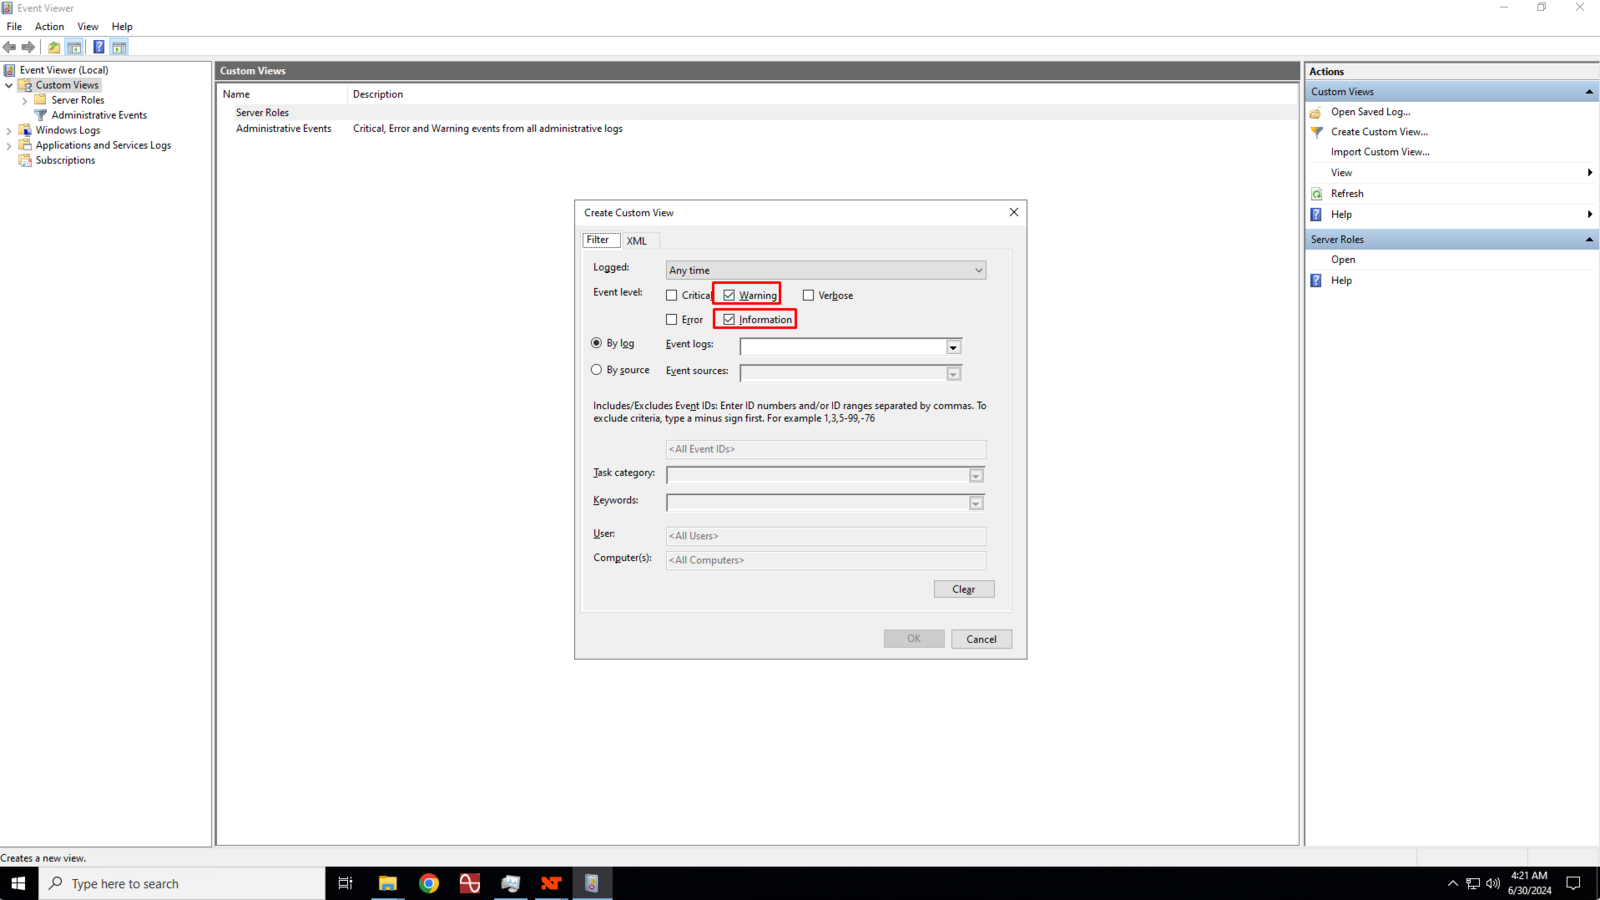
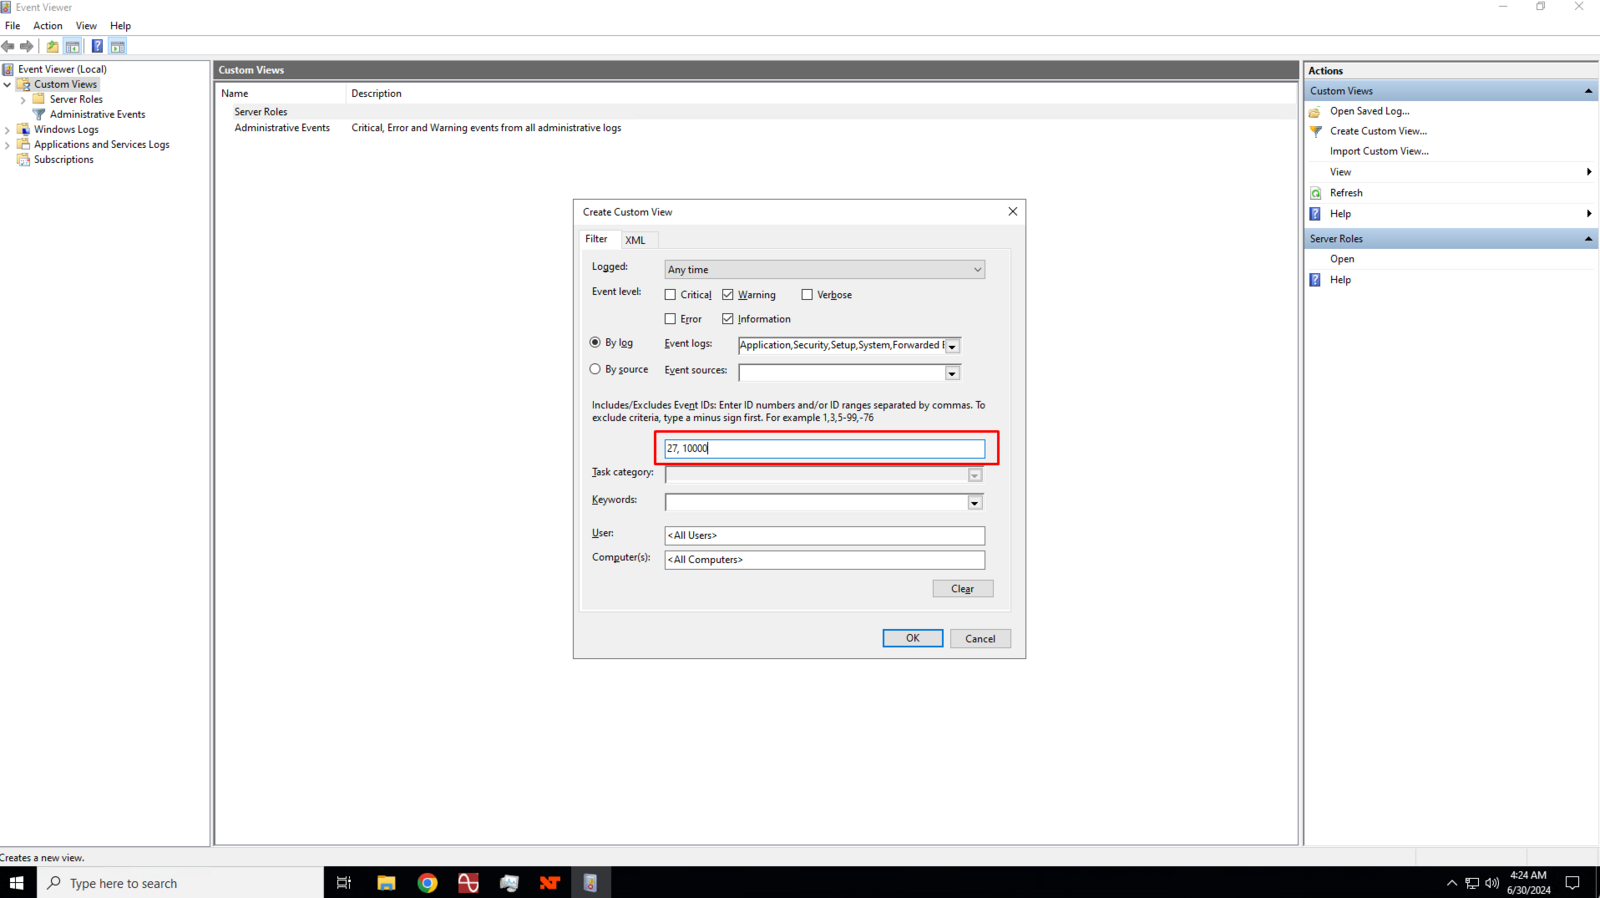
In the Create Custom View dialog box, click to check the Warning and Information boxes.
4
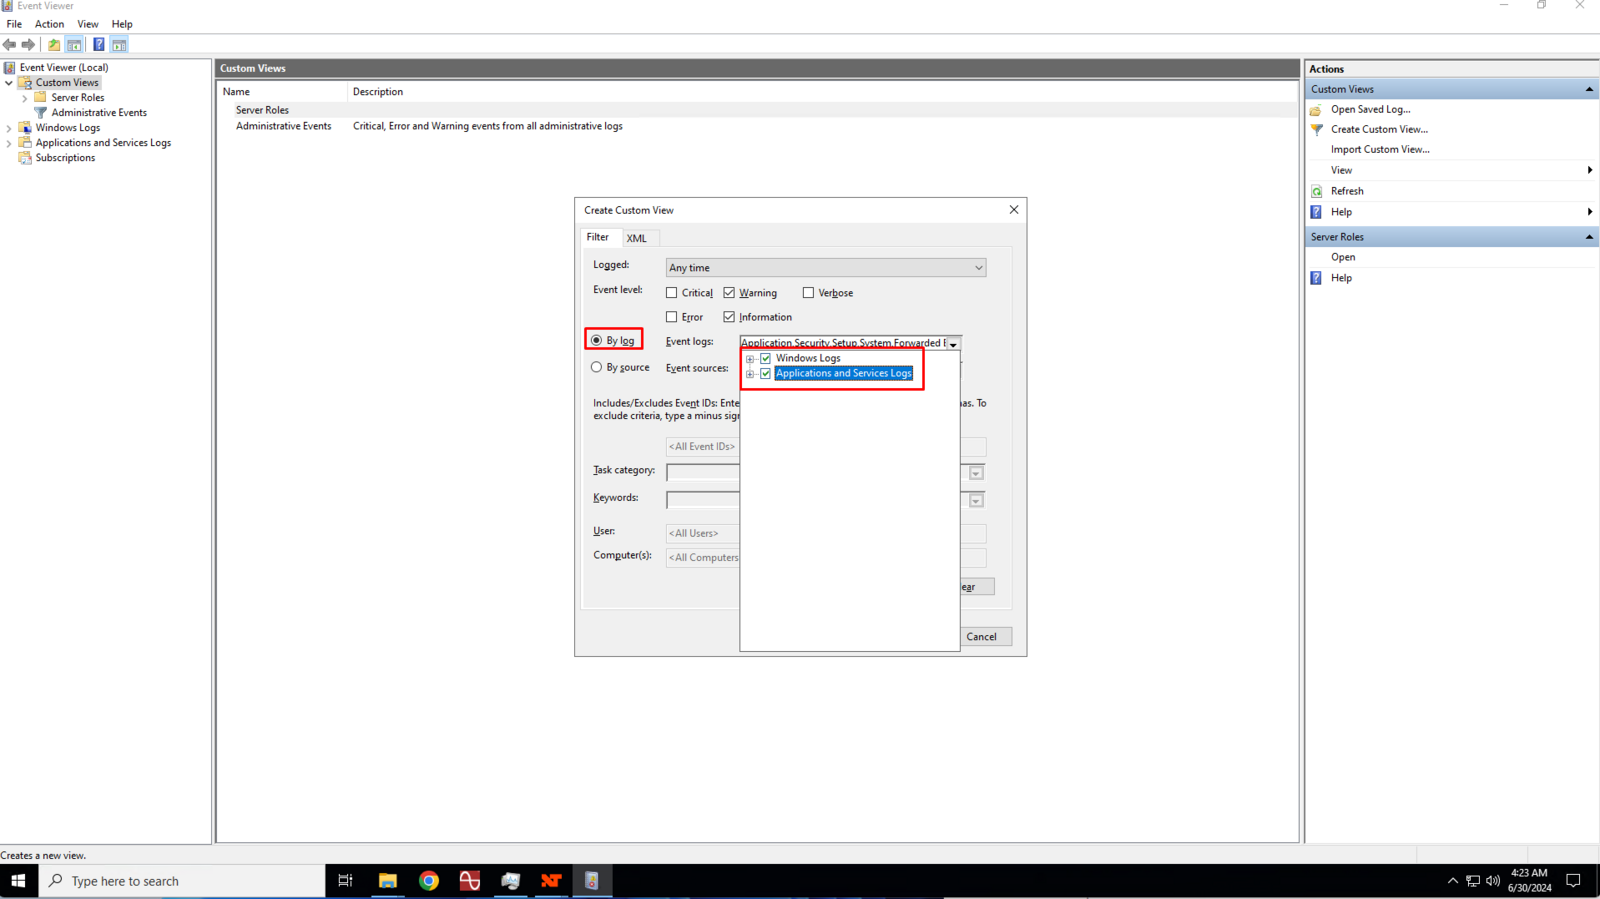
Ensure that the By log is selected and then click the Event Logs drop down box and click to check the Windows Log and Applications and Services Logs boxes.
5
In the Event ID text box, enter 27 and 10000 separated by a comma then click the Ok button to save the custom view.
Event ID 27 in Windows Server 2022 typically pertains to a network-related issue, specifically to the network adapter. This event is logged when the network link is disconnected, meaning the network adapter has lost its connection to the network. This can occur for various reasons, including hardware issues, driver problems, or network configuration changes.
Event ID 10000 in Windows Server 2022 is typically associated with the DistributedCOM (DCOM) component. DCOM is a Microsoft technology that enables software components to communicate over a network. This event ID usually indicates a problem related to DCOM, such as permission issues, network connectivity problems, or other errors involving COM components.
6
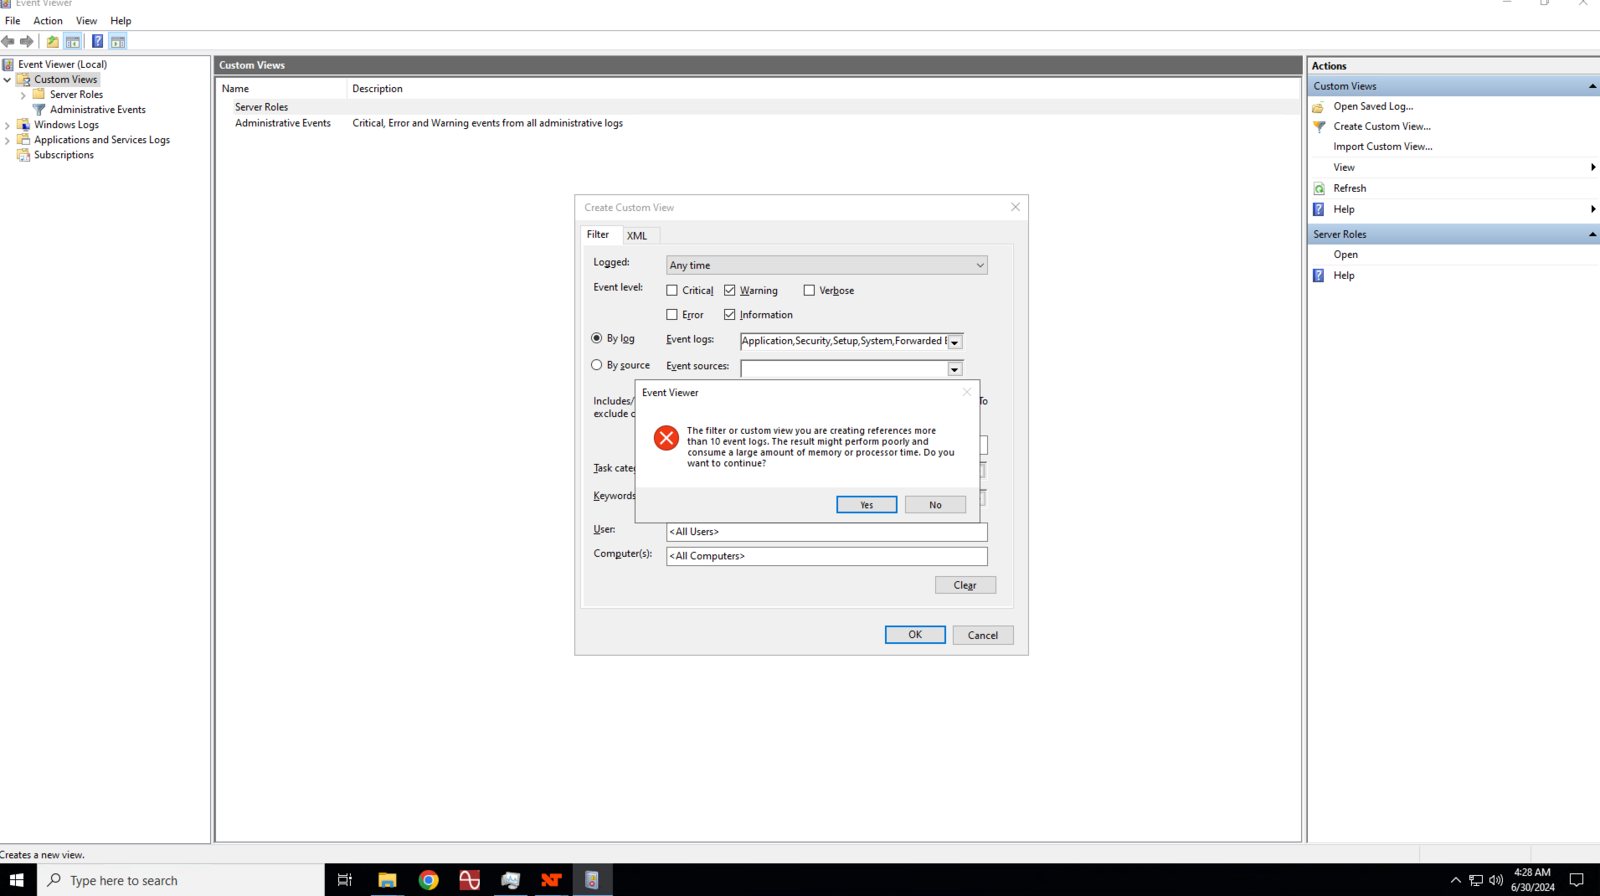
You will get a prompt regarding memory and processor time, simply click the Yes button to proceed.
7
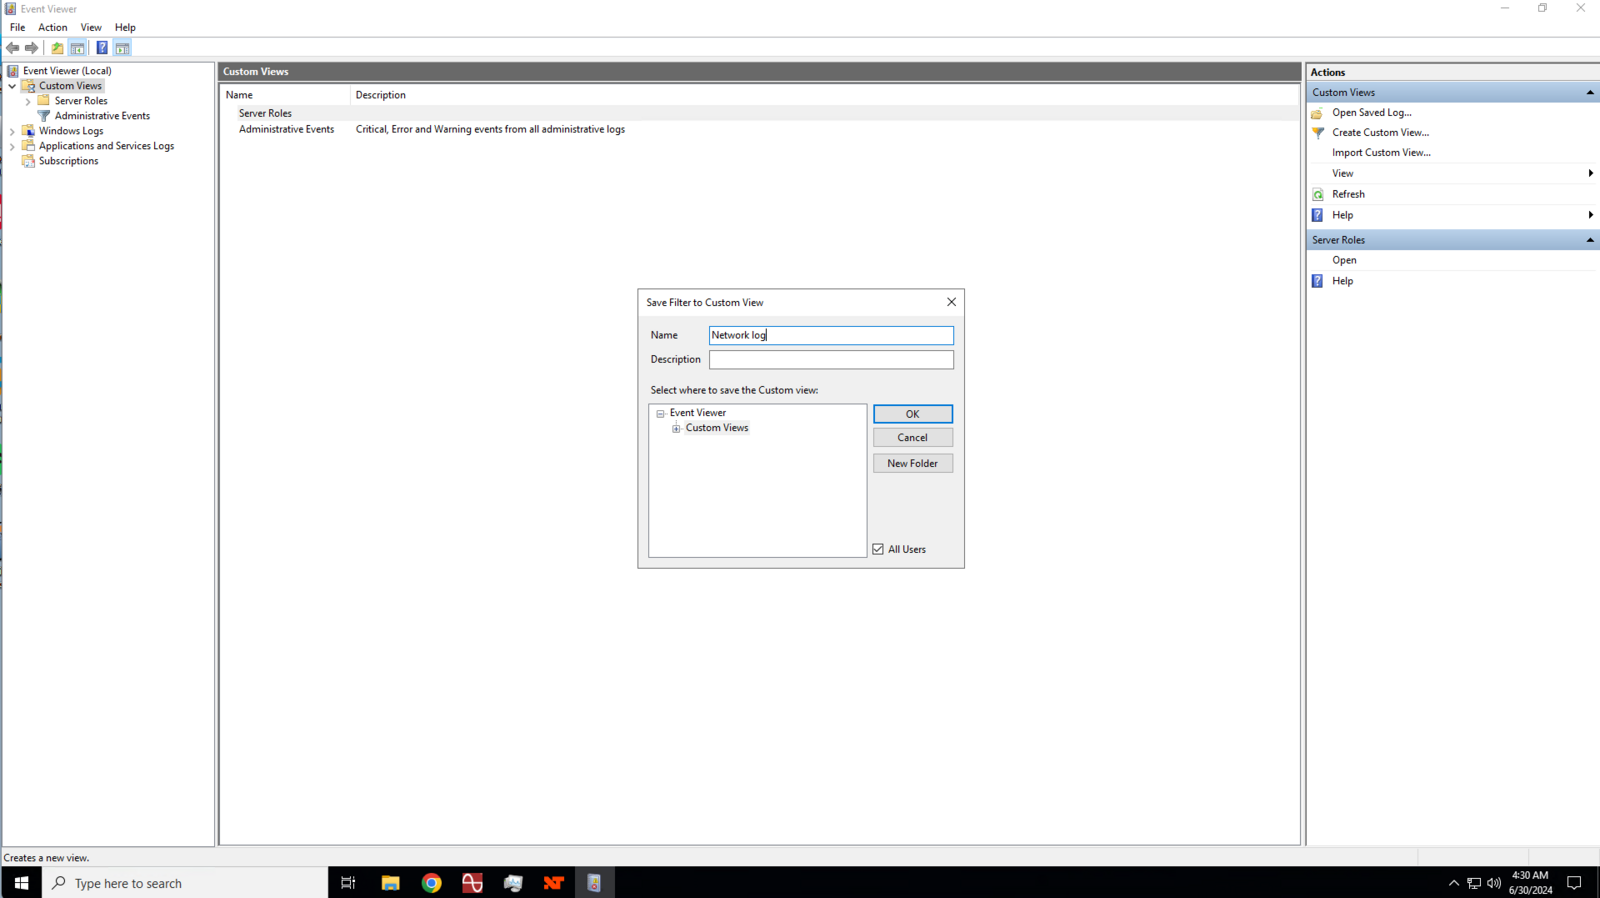
Enter a name for your custom view.
8
If there were no network disconnects or errors, logs won’t show any warnings.
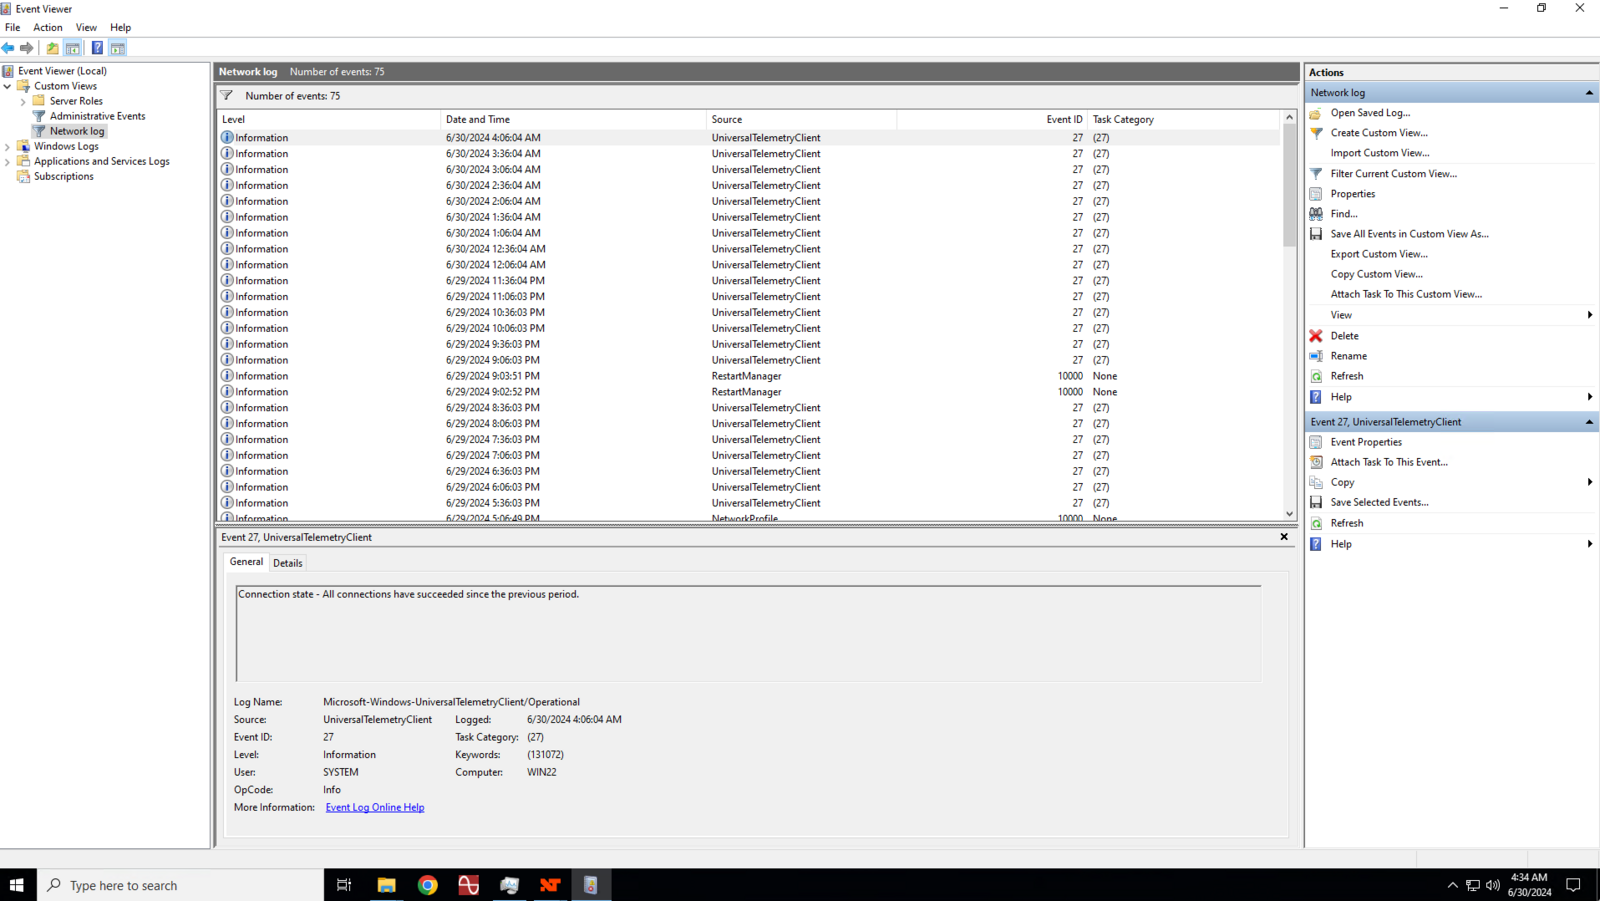
On the other hand, if there were network disconnect, it will show warning.
9
Compare the dates between the event viewer and your trading platform.
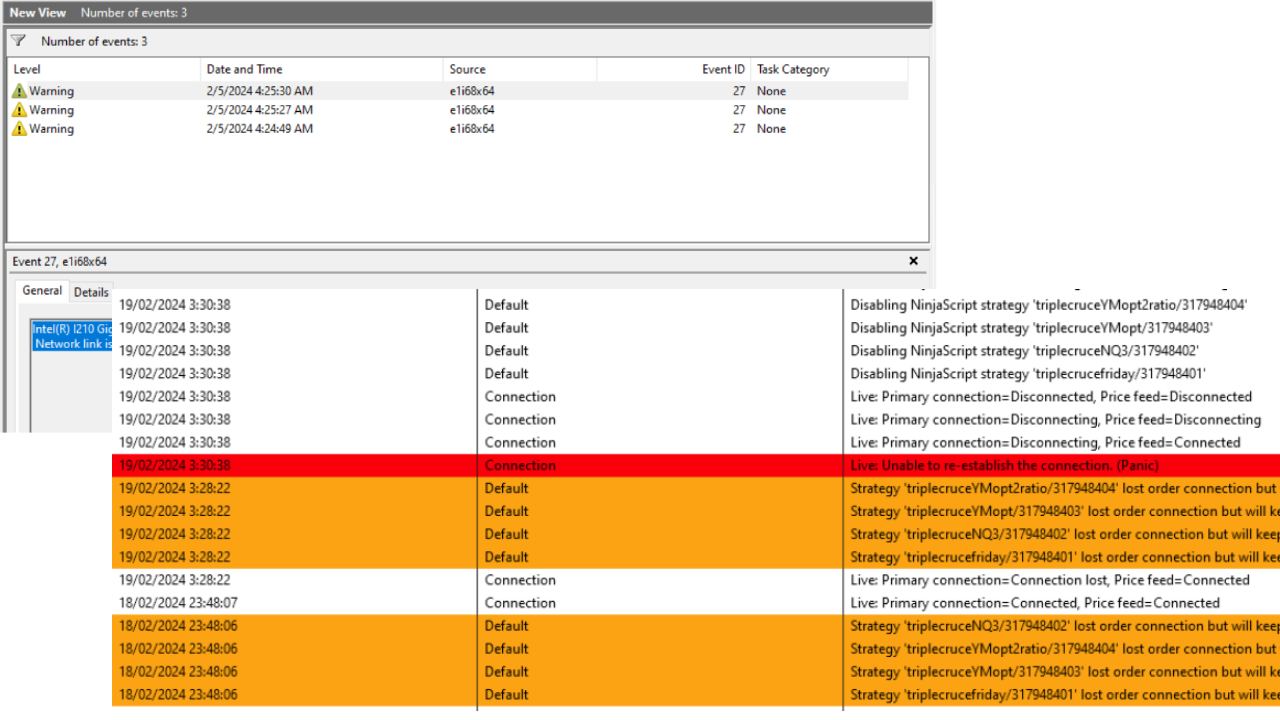
If the dates between the warning shown in the Event Viewer matches the date shown in your trading platform’s Logs, that would mean that your platform’s disconnect was caused by network failure, while if the dates between Event Viewer and trading platform logs are not matching, the disconnect happened between your trading platform and your broker.
How to check network disconnection events in the Windows system event log
Как посмотреть логи Windows Server 2022. Журнал событий.
Операционная система Windows, системные службы и приложения записывают события и ошибки в системные журналы, чтобы в дальнейшем у системного администратора была возможность проверки операционной системы и диагностики проблем.
Получить доступ к этим записям можно через встроенное приложение Просмотр событий (Event Viewer). Есть несколько вариантов запуска данного приложения:
- через меню Пуск – Просмотр событий (Start – Event Viewer)
- в командной строке или в окне Выполнить набрать eventvwr.msc
- в Диспетчере серверов в разделе Средства выбрать Просмотр событий (Server Manager – Tools – Event Viewer). В диспетчер серверов можно зайти, через меню «Пуск»
Описание интерфейса программы
Окно программы состоит из следующих компонентов:
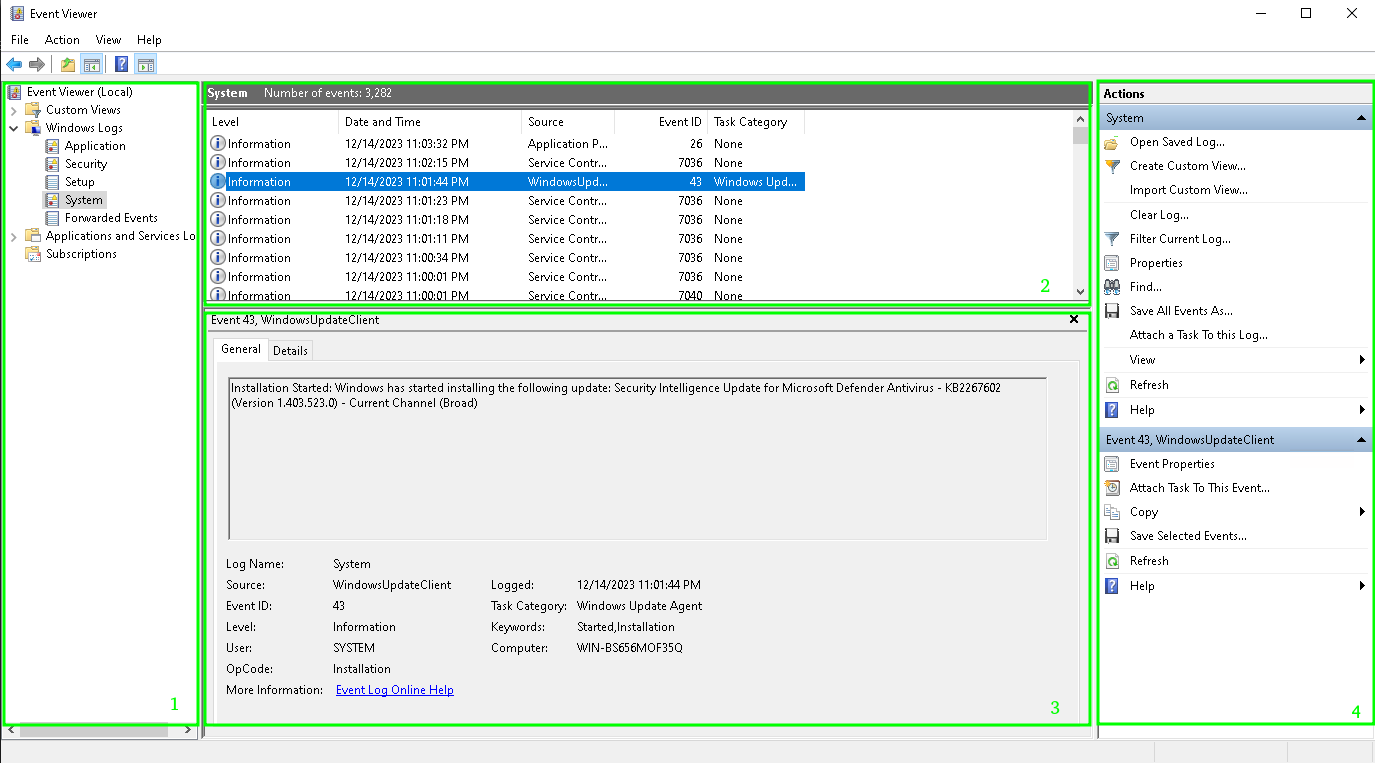
1. Панель навигации позволяет выбрать конкретный журнал, записи которого необходимо просмотреть;
2. Список событий, содержащийся в выбранном журнале. В колонках выведена базовая информация о событии. Их можно отсортировать по датам, типам, категориям событий и т.д.;
3. Детальная информация о выбранном во второй панели событии. Также детальную информацию можно открыть в отдельном окне, если кликнуть по нужному событию два раза;
4. Панель быстрых действий, которые можно совершить с данным журналом или событием. Действия также доступны в контекстном меню (клик правой кнопкой мыши по журналу или событию).
Для удобства просмотра и управления системные журналы разбиты по категориям:
- Приложения (Application) – как и гласит название, содержит события и ошибки приложений;
- Безопасность (Security) – если в операционной системе включена и настроена функция аудита, журнал будет содержать записи, связанные с отслеживанием соответствующих событий (например, авторизация пользователя или попытки неудачного входа в операционную систему);
- Система (System) – здесь регистрируются события операционной системы и системных сервисов;
- Установка (Setup) – события, связанные с инсталляцией обновлений Windows, дополнительных приложений.
В разделе Журналы приложений и служб (Applications and Services Logs) можно найти более детальную информацию о событиях отдельных служб и приложений, зарегистрированных в операционной системе, что бывает полезно при диагностике проблем в работе отдельных сервисов.
Сами события также разделяются на типы:
- Сведения (Information) — информируют о штатной работе приложений.
- Предупреждение (Warning) — событие, свидетельствующее о возможных проблемах в будущем (например, заканчивается свободное место на диске – приложения могут продолжать работу в штатном режиме, но когда место закончится совсем, работа будет невозможна).
- Ошибка (Error) — проблема, ведущая к деградации приложения или службы, потерям данных.
- Критическое (Critical) — значительная проблема, ведущая к неработоспособности приложения или службы.
- Аудит успеха (Success audit) — событие журнала Безопасность (Security), обозначающее успешно осуществленное действие, для которого включено отслеживание (например, успешный вход в систему).
- Аудит отказа (Failure audit) — событие журнала Безопасность (Security) обозначающее безуспешную попытку осуществить действие, для которого включено отслеживание (например, ошибка входа в систему).
Как узнать, кто перезагрузил (выключил) сервер Windows?
Информация об учетной записи, которая отправила команду перезагрузки Windows сохраняется в журнал событий.
- Откройте консоль Event Viewer и перейдите в раздел Windows Logs -> System;
2. Включите фильтр журнала событий в панели быстрых действий справа
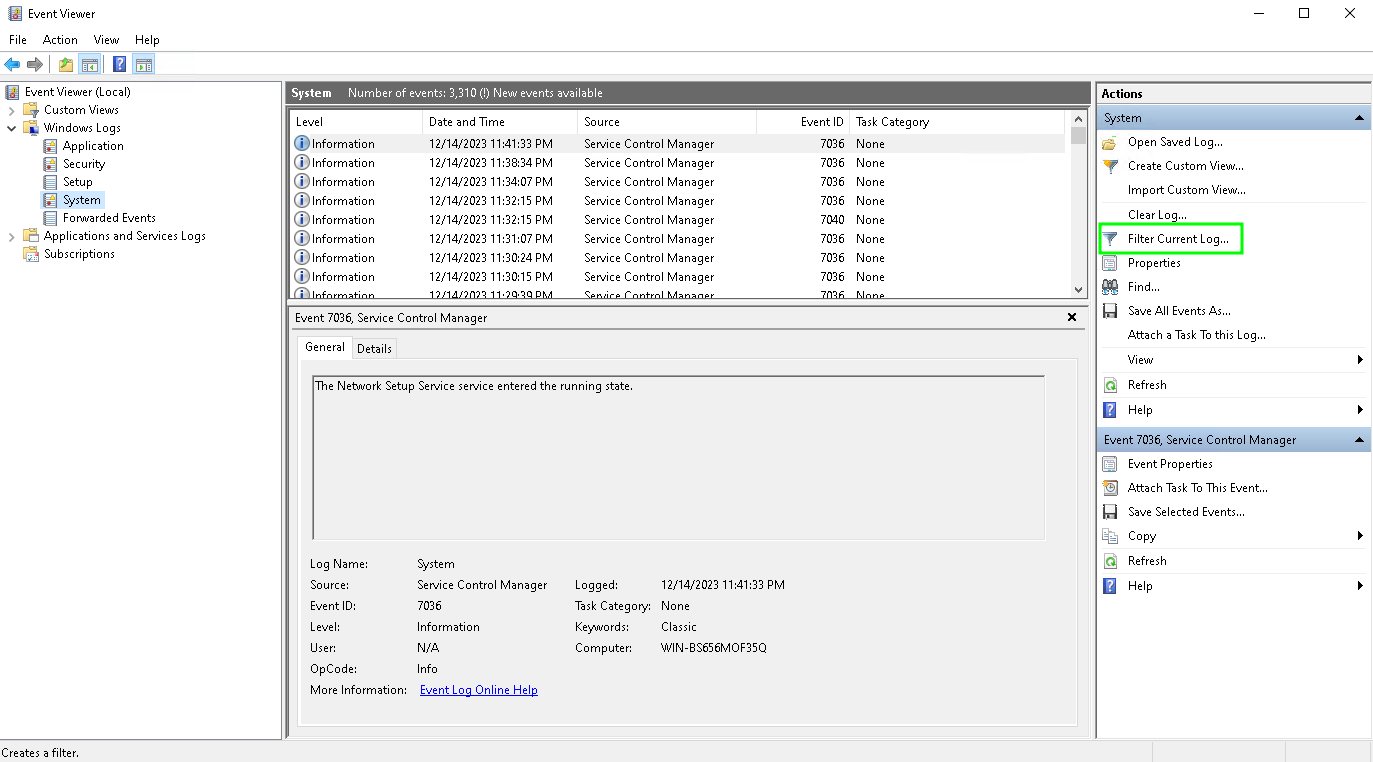
3. В поле фильтра укажите EventID 1074 и нажмите OK;
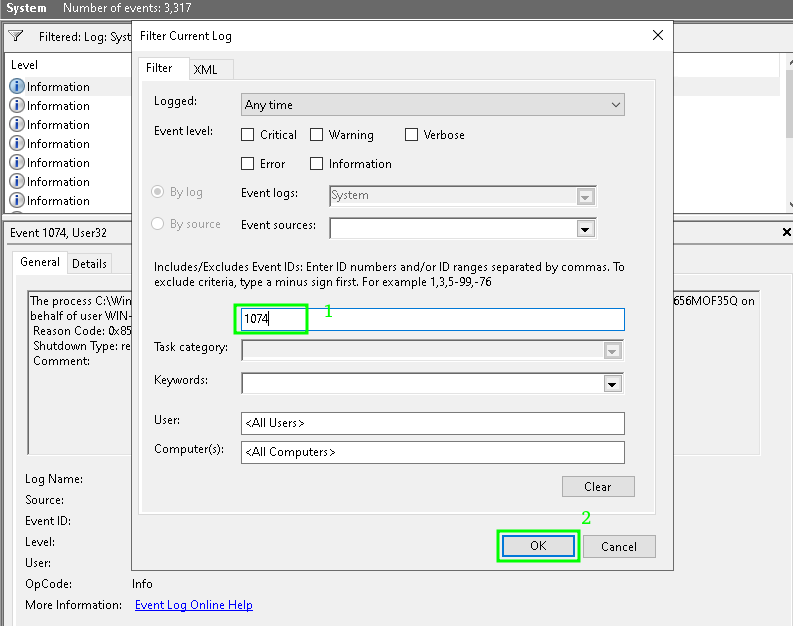
4. В журнале событий останутся только события выключения (перезагрузки), откройте нужное событие
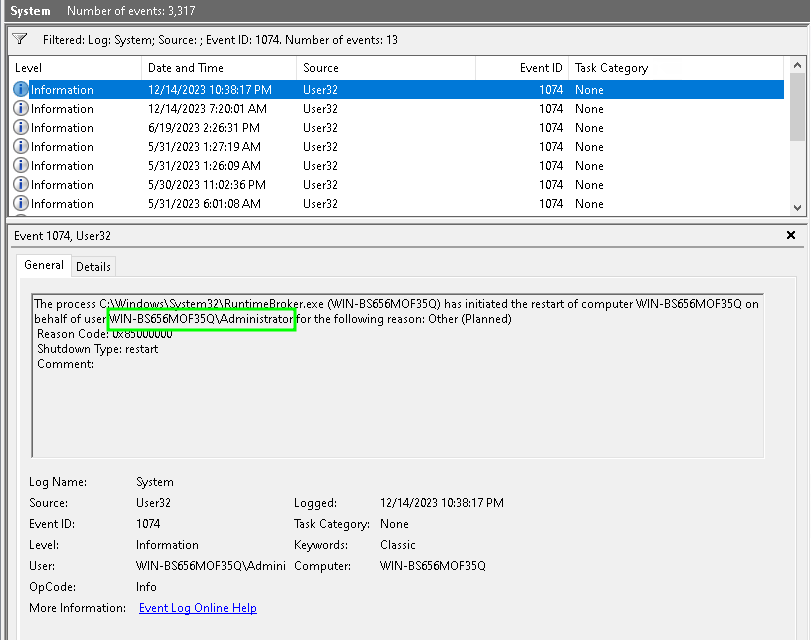
В событии от источника User32 будет указан пользователь, который инициировал перезагрузку Windows. В этом примере это пользователь Administrator.
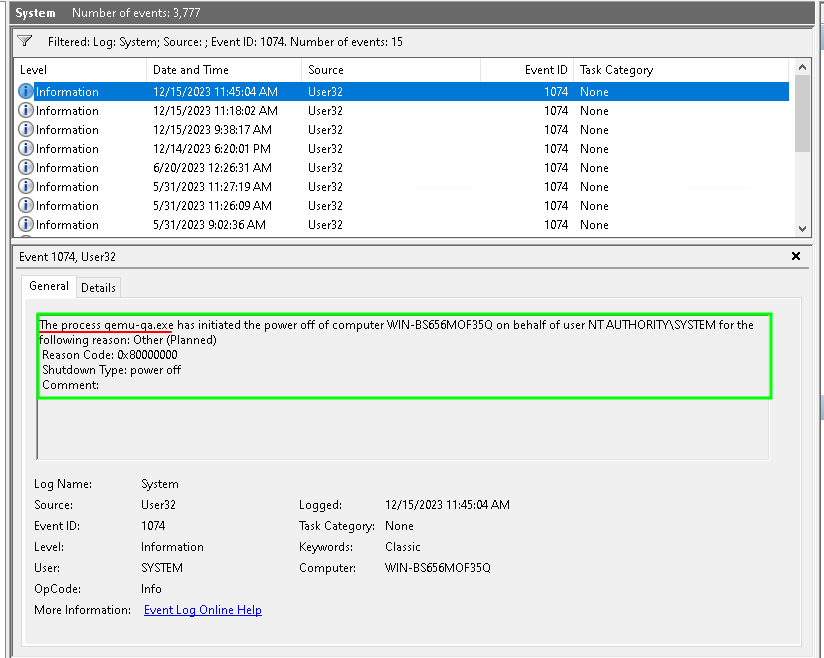
В качестве пользователя, запустившего перезагрузку операционную систему может быть указан NT AUTHORITY\SYSTEM.
Это означает, что перезагрузку инициировала одна из служб или программ Windows, запущенная от имени SYSTEM.. Например, это может быть процесс службы wuauserv, который закончил установку обновлений Windows и выполнил перезагрузку согласно настроенной политике Windows Update или с помощью задания модуля PSWindowsUpdate.
The process C:\Windows\uus\AMD64\MoUsoCoreWorker.exe (WKS-PC11S22) has initiated the restart of computer WKS-PC11S22 on behalf of user NT AUTHORITY\SYSTEM for the following reason: Operating System: Service pack (Planned)
Reason Code: 0x80020010
Shutdown Type: restart
Comment:
Если у Вас виртуальный сервер, и он был перезагружен из панели управления VMmanager6, то в журнале может быть следующая запись:
По событию 1074 можно найти только причины корректных (штатных) перезагрузок сервера. Если Windows была перезагружена не штатно (например, при потере электропитания, или появления BSOD), тогда нужно искать события с EventID 6008.
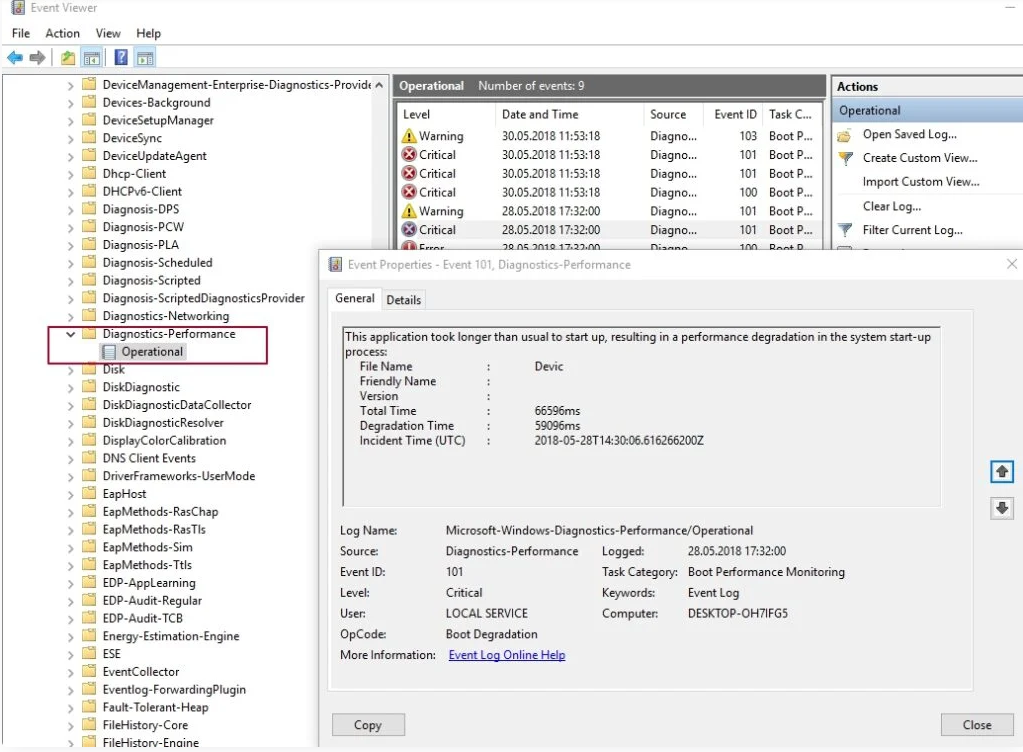
Просмотр журнала производительности Windows
В просмотре событий Windows можно найти достаточное количество интересных вещей, например — посмотреть на проблемы с производительностью компьютера. Для этого в левой панели откройте Журналы приложений и служб — Microsoft — Windows — Diagnostics-Perfomance — тут вы можете наблюдать, есть ли среди событий какие-либо ошибки — они сообщают о том, что какой-то компонент или программа привела к замедлению загрузки Windows. По двойному клику по событию, вы можете вызвать подробную информацию о нем.