
The Windows Performance Analyzer (WPA) tool is a part of the Windows Assessment and Deployment Kit (Windows ADK). It’s the tool you can use to create graphs and tables based on event trace log recordings. You make these trace files using tools like Xperf or Windows Performance Recorder (WPR). These tools are useful if you have system performance issues. You can also use them regularly for performance monitoring.
In this article, you’ll learn how to create a quick recording using the WPR. You should launch this recording during an event where you want to test the performance of your computer. This could be launching a game or other application or even running a program you’ve written. Then, we’ll cover how to use the WPA tool to read and analyze that data file for troubleshooting purposes.

Installing and Launching Microsoft Windows ADK Tools
The first step to install both the WPA and WPR is to install Windows ADK from Microsoft’s download page for the Windows Performance Toolkit. This tool is from Microsoft.com, so completely safe to install. As you step through the installation process, you’ll need to choose the components you want to install.
Just make sure that the Windows Performance Toolkit is selected since this includes both tools you need.

Once you select Install, the process can take time, so be patient.
When the Windows Performance Toolkit installation is complete, you’re ready to make your first WPR recording.
Note: For this example, we’ve installed the HeavyLoad Stress Test app to put our system under a heavy load while the WPR recording occurs.
Before using the Microsoft Windows Performance Analyzer tool, you’ll need to use the Windows Performance Recorder to capture an event trace log recording (an ETL file). This recording will contain all Event Tracing for Windows (ETW) events. WPA analyzes all system information about CPU, memory, storage, and more.
To launch WPR, select the Start menu and type “Windows Performance Recorder.” Next, select the Windows Performance Recorder app.

The WPR tool is a straightforward tool to capture events occurring on your system during a specific timeframe. To start the recording, just select the Start button.

This will launch the system event recording process. Perform actions (like launching and running a program) that you want to use to test your system’s performance.
Once finished, just return to the WPR window and select the Save button.

The next step will display the path to your ETL file. You can include a description of what you’re troubleshooting or testing in the detailed description window.

When done, select the Save button.
The app will write all data to the ETL file, and you’ll see options at the bottom of the window to open the WPA tool directly or navigate to the ETL file by opening the folder.

The most convenient way to immediately move on to your performance analysis is to select the Open in WPA button.
Analyzing ETL Files with Windows Performance Analyzer
Once you double-click the WPA app and it launches, you’re ready to start navigating through and visualizing the data in the ETL file. This is a special log file only certain apps can open. You couldn’t view it using something like Google Docs or Microsoft Word.
You’ll notice along the left side there are four major categories of data to explore. You can select any of these charts on the left to see them displayed in more detail in the right pane.

These categories include:
- System Activity: Process information, background tasks, events, and more.
- Computation: All information related to CPU cores.
- Storage: Disk usage information.
- Memory: Real and virtual memory usage.
- Power: Processor power usage details.
In each chart, like the CPU Usage chart, you can hover over any graph area to see a breakdown of the data components like process name, process active time, and percentage of overall CPU usage.

If you select a specific process name from the list at the bottom, you’ll see highlighted areas in the graph to identify the specific times that process consumed CPU resources. This can help identify whether operating system processes or application processes are eating up all CPU time.
You can also drill down into each process to see specific stack activity, again with the graph above highlighting areas when that stack was actively using CPU time.

Available Charts in WPA
Inside each of the four major categories in the left pane, you’ll find a graph explorer that can help you analyze and troubleshoot what’s happening with your system performance.
We’ve covered the System Activity list above. Below this, you’ll find the Computation category.

Here you’ll find the following sub-charts:
- CPU Usage (Sampled): Samples of CPU activity taken at sampling intervals.
- CPU Usage (Precise): CPU usage associated with specific running process threads.
- DPC/SR Duration: CPU time spent servicing deferred procedure calls (DPCs).
- CPU Usage (Attributed): CPU usage broken down into several categories.
Again, you can select any of these sub-charts to display them on the right. Or you can drill down further into more sub-charts related to each of these areas.
The Storage category has several disk usage sub-visuals underneath it in the left navigation pane.

You can view overall lDisk Usage or drill down into any of the following sub-visuals:
- Disk activity
- Disk Counts
- Disk Offset
- IO Time
- Service Time
- Disk Size
- Disk Throughput
- Disk Utilization
Adding one or more of these to the same pane on the left lets you compare different aspects of disk usage to one another. This kind of comparison alongside visuals related to processes or CPU time could potentially help you identify the source of your Windows performance problems.
The next category in the left navigation pane is Memory.

You’ll find the following charts under the Memory category:
- Memory Utilization
- Fault Counts
- Fault IO Time
- Virtual Memory Snapshots
Finally, the last category in the list is Power. These are all visuals related to your system’s overall CPU power consumption.

This includes all of the following sub-visuals around all system processors like CPUs and GPUs:
- CPU Frequency
- CPU Idle States and State Diagram
- System Latency Tolerance
- Processor Profiles
- Processor Parking State
- Core Parking State
- Processor Performance
- Processor Constraints
Other Microsoft WPA Features
There are several useful features in the WPA tool that’ll help you with your troubleshooting efforts.
One of those is an Analysis Assistant. You can find this by selecting the Window menu and selecting Analysis Assistant.
This opens up a new pane in the tool that will give you tips and details about the charts or items inside the charts that you click on.

This is especially useful if you aren’t that familiar with all of the terminology used throughout the tool.
If you select the Window menu and select New Analysis View, you can open a new Analysis tab.

This lets you perform multiple analyses by adding a family of visuals in one tab and then opening a new tab to perform a completely different set of visuals without losing your previous analysis. Flip back and forth between tabs to work on each analysis individually.
Exploring Windows Performance Analyzer Further
If you’d like to dig even further into WPA, Microsoft has an old Microsoft Docs guide. The documentation isn’t being maintained anymore, but it should point you in the right direction. It even includes a full command line reference you can use to run WPA commands from the command prompt.
As you can see, the Windows Performance Analyzer tool is much more flexible and useful than standard performance tools that come installed on Windows by default. So, the next time your Windows system starts acting unusual, take the time to download the Windows ADK and give WPR and WPA a try.
If you’re using Linux (or Android), a GitHub Linux version of a similar tool is available using the Microsoft Performance Toolkit.
Related Posts
- How to Fix a “This file does not have an app associated with it” Error on Windows
- How to Fix an Update Error 0x800705b4 on Windows
- How to Resolve “A JavaScript error occured in the main process” Error on Windows
- How to Fix the Network Discovery Is Turned Off Error on Windows
- How to Change Folder Icons in Windows
Здравствуйте, уважаемые читатели сайта remontcompa.ru! Меня зовут Роман Нахват и в сегодняшней статье мы поговорим о прекрасном инструменте под названием — Windows Performance Analyzer (WPA), который как никто другой произведёт диагностику автозапуска программ Windows и покажет, сколько времени отнимает у загрузки вашей операционной системы та или иная программа.
– Почему именно Windows Performance Analyzer? – Спросите вы! – Ведь она самая сложная в этом отношении.
Да, в цифровом мире существует много программ, пользоваться которыми избегают обычные пользователи по причине их сложности, предпочитая более простые. Но уверяю вас, с Windows Performance Analyzer вам просто не хватило времени разобраться, а разобраться стоит, так как на данный момент не существует инструмента способного его заменить. К примеру, чтобы определить какая именно программа тормозит загрузку вашей Windows, нужно узнать время загрузки (в миллисекундах) всех приложений по отдельности, загружающихся вместе с ОС, также необходимо узнать время загрузки всех системных процессов по одному. Справится с этим только Windows Performance Analyzer.
Чтобы всё было как можно понятнее, разберём конкретный случай. Я установил себе на компьютер программы: Skype, uTorrent, Download Master и FTP-клиент FileZilla, после этого система стала долго загружаться, определим виновника с помощью WPA.
Ещё в конце статьи мы перенесём операционную систему Windows 8.1 с тестового компьютера на твердотельный накопитель «Kingston SSDNow UV400» и произведём повторные измерения скорости загрузки программ, стартующих после запуска операционной системы.
{banner_google1}
Средство Windows Performance Analyzer входит в состав Windows ADK (будем использовать версию 1703) для Windows 10, скачать можно здесь:
Запускаем установку.
Далее

Далее

Принимаем лицензионное соглашение

Ставим галочку напротив «Набор средств для оценки производительности Windows» и выполняем установку «Windows Performance Analyzer» на компьютер нажав «Установить»


Установка завершена.

Если запустить Диспетчер задач на тестовом компьютере и перейти на вкладку «Автозагрузка», то можно увидеть список программ, которые загружаются когда пользователь входит в систему. Также стоит обратить внимание на столбец «Влияние на загрузку», в котором напротив каждой программы стоит своего рода оценка, указывающая, какое влияние оказывает та или иная программа на скорость запуска операционной системы. Влияние программ из автозагрузки на запуск операционной системы может быть «Высокое», «Среднее» и «Низкое». Далее мы увидим, каким же образом операционная система выставляет оценку влияния той или иной программе. На вкладке «Автозагрузка» видно, что к примеру программы Skype и Download Master оказывают высокое влияние на скорость запуска операционной системы.

{banner_google1}
Если перейти по пути C:\Windows\System32\wdi\LogFiles, то мы можем увидеть папку StartupInfo, а также файлы BootCKCL.elt и ShutdownCKCL.etl. Нас в данной статье будет интересовать файл BootCKCL.elt и далее именно с ним мы и будем работать, так как при каждой загрузке операционной системы Windows в файл BootCKCL.elt записывается различная информация о запуске процессов на компьютере, загруженности жёсткого диска и процессора.

Файл BootCKCL.elt мы будем изучать при помощи инструмента Windows Performance Analyzer, который как уже говорилось выше, входит в состав «Windows ADK»
Запускаем инструмент Windows Performance Analyzer.
Главное окно WPA.

Откроем файл «BootCKCL.etl». Для этого выбираем File — Open.

Указываем местоположение файла BootCKCL.etl, находится он по адресу: C:\Windows\System32\wdi\LogFiles
и жмём «Открыть».

После открытия файла BootCKCL.etl мы увидим различные графики, с которыми и будем работать.

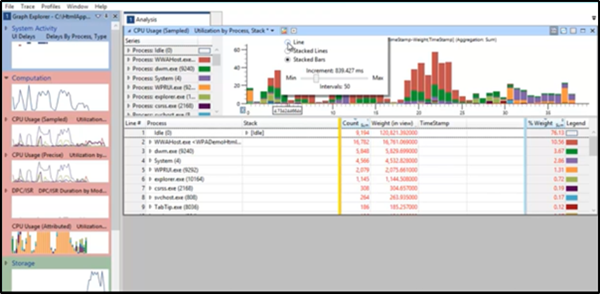
Нажимаем на треугольник пункта (Computation), показанный стрелкой, находим график с названием «CPU Usage (Precise)» и мышкой перетягиваем его в окно «Analysis»

{banner_google1}
Должно получиться примерно следующее, а именно в нижней части окна откроется таблица со списком различных работающих в нашей системе процессов.

Щёлкнем правой кнопкой мыши по заглавию какого-либо столбца из таблицы.

и вызовем контекстное меню. После этого добавим в таблицу столбец под названием «CPU Usage (in view)», поставив галочку напротив

Столбец «CPU Usage (in view)» добавлен в таблицу.

В столбце «New Process» выделяем процессы программ из автозагрузки, а именно Skype.exe, uTorrent.exe, dmaster.exe, Cloud.exe, filezilla.exe

Вызываем контекстное меню и отфильтровываем выделенные процессы, выбрав «Filter To Selection»

Получаем следующее.
В столбце «CPU Usage (in view) (ms)» напротив каждого процесса находится определенное числовое значение в миллисекундах, например для процесса «Skype.exe» оно равно 5263,425473, а для процесса «dmaster.exe» — 1119,308324. Данные числа напрямую связаны со степенью влияния программ из автозагрузки (которая как мы уже выше выяснили бывает высокой, средней или низкой, и мы это видели запустив диспетчер задач и перейдя на вкладку «Автозагрузка») на скорость запуска операционной системы следующим образом: влияние программы на скорость запуска операционной системы оценивается по количеству процессорного времени а также объёма дисковой активности.
Параметры влияния на скорость загрузки Windows следующие: имеет место высокая степень влияния, если приложение использует более 1000 миллисекунд ( более 1 секунды) времени процессора или свыше 3 mb дисковых операций; средняя степень влияния — если приложение использует от 300 до 1000 миллисекунд ( от 0.3 до 1 секунды) времени процессора или от 300 kb до 3 mb дисковых операций; низкая степень влияния — если приложение использует менее 300 миллисекунд (0.3 секунды) времени процессора и менее 300 kb дисковых операций.
Исходя из этого видим, что процесс «Skype.exe» использовал 5263,425473 мс (5.26 секунды) процессорного времени, следовательно он оказывал высокую степень влияния на запуск Windows

{banner_google1}
Создадим ещё одну вкладку «Analysis» и перетянем на нёё график с названием «Lifetime by Process»

Получаем следующее

Выделяем нужные нам процессы таким же образом, как мы это делали на графике «CPU Usage (Precise)»
Например выделим процесс «explorer.exe»,

а также процессы программ из автозагрузки, а именно «uTorrent.exe», «dmaster.exe», «Skype.exe», «Cloud.exe» и «filezilla.exe»

Отфильтруем выбранные процессы, выбрав «Filter To Selection»

Получаем следующее:
В Windows 8.1, 10 снижено влияние программ сторонних разработчиков в автозагрузке на скорость запуска операционной системы. Запуск сторонних приложений происходит только после старта всех системных процессов и появления рабочего стола. Сделано это специально, чтобы программы не тормозили ОС во время старта. В столбце «Start Time (s)» напротив каждого процесса указано время (в секундах), через которое программа начала стартовать после запуска операционной системы. К примеру программа «uTorrent» начала стартовать через 45.4 секунд после запуска Windows, а программа «Download Master» начала стартовать через 49.8 секунд.

{banner_google1}
Все статьи о переносе операционных систем находятся на нашем сайте в этом разделе.
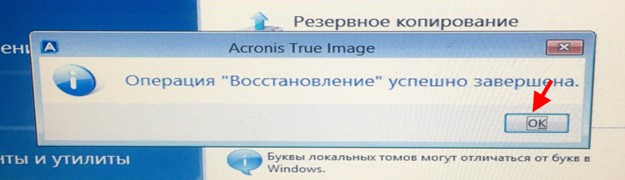
Развернем заранее созданную резервную копию тестового компьютера с Windows 8.1 на твердотельный накопитель «Kingston SSDNow UV400» используя загрузочный диск Acronis True Image 2018

Жмём «Приступить».


Восстановление Windows 8.1 успешно завершено.
После восстановления системы на твердотельный накопитель «Kingston SSDNow UV400» снова запускаем Диспетчер задач и заходим на вкладку Автозагрузка. Видим, что теперь программа FileZilla оказывает среднее влияние на скорость запуска Windows 8.1

Переходим по пути C:\Windows\System32\wdi\LogFiles и копируем с тестового компьютера файл BootCKCL.etl.

Файл BootCKCL.etl скопированный с тестового компьютера.

Запускаем инструмент Windows Performance Analyzer.
Открываем файл «BootCKCL.etl», выбрав File — Open.

Открыть.

{banner_google1}
Так же, как это мы делали выше, перетягиваем график «CPU Usage (Precise)» в окно «Analysis»
В столбце «New Process» выделяем процессы программ из автозагрузки, а именно Skype.exe, uTorrent.exe, dmaster.exe, Cloud.exe, filezilla.exe.


Вызвав контекстное меню отфильтровываем выделенные процессы, выбрав «Filter To Selection».

Как видим, процесс«filezilla.exe» использовал 507,442282 мс (0.507 секунды) процессорного времени, следовательно он оказывает среднюю степень влияния на запуск Windows. То же самое мы видели на вкладке Автозагрузка в Диспетчере задач.

Если проанализировать график «Lifetime by Process», как мы это делали выше, то можно увидеть, что системный процесс explorer.exe запустился через 5.4 секунды после запуска ОС (до переноса ОС на твердотельный накопитель процесс explorer.exe запускался через 29.1 секунду после запуска ОС), а программа Skype запустилась через 28.2 секунды (до переноса ОС на твердотельный накопитель программа Skype запускалась через 52 секунды)

Статьи на эту тему:
- Автозагрузка Windows 10
- Autoruns – одна из лучших программ для ускорения автозагрузки Windows
- Долгая загрузка Windows 10. Или как быстро определить, какое именно приложение более всего тормозит загрузку операционной системы
- Оптимизация автозагрузки Windows программой Autorun Organizer
-
Home
-
News
- Windows Performance Analyzer – How to Download/Install/Use It
By Daisy | Follow |
Last Updated
If you encounter system performance issues on Windows 11/10, Windows Performance Analyzer can help you detect the issue. This post from MiniTool tells you how to download, install and use Windows Performance Analyzer.
What Is Windows Performance Analyzer
What is Windows Performance Analyzer? The Windows Performance Analyzer (WPA) tool is part of the Windows Assessment and Deployment Kit (Windows ADK). It is a tool you can use to create charts and tables from event trace logging.
The Windows Performance Toolkit consists of two separate tools: Windows Performance Recorder (WPR) and Windows Performance Analyzer (WPA). Windows Performance Recorder (WPR) is a performance recording tool based on Event Tracing for Windows (ETW). It records system events, which you can then analyze using the Windows Performance Analyzer (WPA).
How to Download and Install Windows Performance Analyzer
This part introduces how to download and install Windows Performance Analyzer.
Step 1: Go to Microsoft’s official website to download the Windows ADK according to your operating system.
Step 2: Find the Windows ADK exe file and double-click it to start the installation.
Step 3: There are 2 options for you to install ADK:
- Install Windows Assessment and Deployment Kit on this computer
- Download the Windows Assessment and Deployment Kit for installation on a separate computer
Step 3: Select the second option to download Windows ADK offline. Then, make sure that the Windows Performance Toolkit is selected.
Step 4: On the Windows kits privacy page, click Yes to allow Microsoft to collect insights for the Windows Kits.
Step 5: Accept the license agreement and click Next. Then, it will start the installation.
How to Use Windows Performance Analyzer
This part tells you how to use Windows Performance Analyzer.
Step 1: Before you use Windows Performance Analyzer, you need to use the Windows Performance Recorder to capture an event trace log recording. You can type Windows Performance Recorder in the Search box to open it.
Step 2: After opening it, you can click the Start button. This will start the system event logging process. Perform actions you want to use to test system performance (such as starting and running programs).
Step 3: The next step will display the path to the ETL file. You can include a description of what you are troubleshooting or testing in the Detailed Instructions window.
Step 4: Then, select the Save button. Next, select the Open in WPA button.
Step 5: After launching Windows Performance Analyzer, you can see there are four major categories of data to explore. These categories include:
- System Activity: Process information, background tasks, events, and more.
- Computation: All information related to CPU cores.
- Storage: Disk usage information.
- Memory: Real and virtual memory usage.
- Power: Processor power usage details.
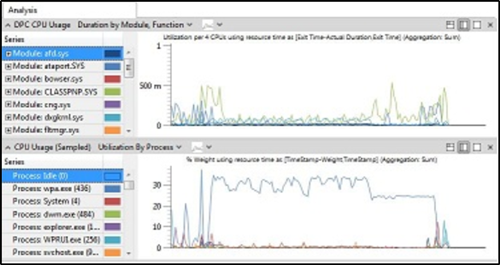
Step 6: In the four main categories in the left pane, you’ll find a graphical browser that can help you analyze and troubleshoot system performance issues. Find the Computation category. Here you’ll find the following sub-charts:
- CPU Usage (Sampled): Samples of CPU activity taken at sampling intervals.
- CPU Usage (Precise): CPU usage associated with specific running process threads.
- DPC/SR Duration: CPU time spent servicing deferred procedure calls (DPCs).
- CPU Usage (Attributed): CPU usage broken down into several categories.
Step 6: In the Storage category, you can see the following items.
- Disk activity
- Disk Counts
- Disk Offset
- IO Time
- Service Time
- Disk Size
- Disk Throughput
- Disk Utilization
Step 7: The next category in the left navigation pane is Memory. You can see:
- Memory Utilization
- Fault Counts
- Fault IO Time
- Virtual Memory Snapshots
Step 8: The last category in the list is Power.
- CPU Frequency
- CPU Idle States and State Diagram
- System Latency Tolerance
- Processor Profiles
- Processor Parking State
- Core Parking State
- Processor Performance
- Processor Constraints
About The Author
Position: Columnist
Having been an editor at MiniTool since graduating college as an English major, Daisy specializes in writing about data backups, disk cloning, and file syncing as well as general computer knowledge and issues. In her free time, Daisy enjoys running and going with friends to the amusement park.
In this fast-paced world, delays as small as a second can impact business metrics. So, a thorough analysis of performance characteristics likely causing these delays is essential. Windows Performance Analyzer offers valuable information in this regard.
The tool, which is included in Windows Assessment and Deployment Kit (Windows ADK), creates graphs and data tables of Event Tracing for Windows (ETW) events that are recorded by Windows Performance Recorder (WPR), Xperf, or an assessment that is run in the Assessment Platform. It can also open any event trace log (ETL) file for analysis. However, to do this, you’ll need to take the following actions:
- Open an ETL file in WPA
- Select Graphs
- Selecting Time Interval
- Highlighting a Selected Time Interval and Customizing a Data table
- Analysis Tab and Analysis View
- Creating and Applying a View Profile
- Searching and Filtering
- Setting User Preferences
- Using the Diagnostic Console
- View Assessment Analysis and Issue Details
1] Open an ETL file in WPA
To open an ETL file in WPA, click on the File menu, choose Open. By default, WPR saves ETL files in your Documents\WPR Files folder. However, if you have saved the file to a different location, browse to the location, and select your ETL file.
2] Selecting Graphs

The Graph Explorer window visible on the left-hand side displays the thumbnails of all graphs that you can use to view the data of the current recording. All the graphs are grouped under several nodes. To expand a node, click the small triangle next to the node name. Alternatively, to see the full graph, drag the graph to the Analysis tab.
3] Selecting a time interval
Alongside the Analysis tab, you can find a pointer. Simply drag the pointer over the desired time interval in the graph. You can also zoom in on a time interval by right-clicking the selected time interval, and then choosing ‘Zoom to selected time range‘.
4] Highlighting a Selected Time Interval and Customizing a Data table
Assuming you have completed the above step, you can now proceed to highlight the time interval in all graphs visible under the Graph Explorer window. Simply, right-click the interval and then select ‘Highlight Selection’. The action, when confirmed, will lock the selection. Moving further, you can also customize data tables by selecting what columns to display. For example, you can open the Column Chooser box, right-click the table header and select columns individually or create or apply preset combinations of columns to display.
5] Analysis Tab and Analysis View
To have a clear view of the desired graph with the associated summary tables, drag the graph from the Graph Explorer window onto the Analysis tab.
When you drag a graph from the Graph Explorer window to the Analysis tab, the graph appears together with a Legend control on the left. The Legend control provides information about the lines or bars in the graph. If you want to see the same data in tabular form, click the right-most layout icon on the graph title bar.
You can use the right drop-down arrow on the graph title bar to change from a line graph to a-
- stacked-line graph or
- stacked-bar graph
The left drop-down arrow on the graph title bar gives valuable information about different parameters for the graph like CPU usage by process, by CPU, or by process and thread. If you would like to view some graphs on a different timeline, you can open an additional Analysis tab. For this, click New Analysis View on the Window menu, and then drag the desired graphs to the new tab.
6] Creating and Applying a View Profile
Once you have the desired layout of the Analyzer with you, you can proceed to create a view profile that opens or launches the same layout as the current one every time you open WPA or only for specific occasions. So, go to ‘Profiles‘ menu and click ‘Export’ to create a view profile. Later, click ‘Apply’ to give the authorization to a ‘View Profile‘ that you previously created, or hit ‘Save Startup Profile’ to view the current layout view every time that you open WPA.
7] Searching and Filtering
You can filter the data in a graph by right-clicking the graph ‘Legend’ control and enabling or disabling the desired items. To allow only the selected row/s to be seen, right-click the data table, and choose ‘Filter To Selection‘ option. Also, to select the columns to display in the data table, right-click the table header, and then select or clear the columns in the ‘Column Chooser’ box.
8] Setting User Preferences
Configure Windows Performance Analyser to load symbols, and set symbol paths. These options can be readily accessed via the ‘Trace’ menu.
9] Using the Diagnostic Console
As the name suggests, this window lists exceptions that occurred in the analysis workflow so that you can diagnose them from the console.
10] Viewing Assessment Analysis and Issue Details
You can also search the list of issues by using the ‘Search‘ options at the top of the Issues window. This is possible when you have chosen to run an assessment from the Assessment Platform.
Upon selecting it, the ‘Details’ window shows details of that issue, with recommended solutions. To see a summary report of all of the issues that need investigation, see the ‘Issue Details’ section at the bottom of the ‘Analysis’ tab
You can learn more about this on Microsoft.com. The tool is now also available in the Microsoft Store.
Windows Performance Analysis Tools
The Windows Performance Tools (WPT) Kit contains performance analysis tools. Windows Performance Tools are designed for analysis of a wide range of performance problems including application start times, boot issues, deferred procedure calls and interrupt activity (DPCs and ISRs), system responsiveness issues, application resource usage, and interrupt storms.
The Windows Performance Tools (WPT) is part of the Windows 8 SDK and the Windows Assessment and Deployment Kit. In this guide I’ll use the Windows 8 SDK Installer to install the WPT.
Go to the download site of the SDK:
http://msdn.microsoft.com/en-us/windows/hardware/hh852363
and click on the button download to download the Webinstaller:
and store the installer on your HDD. Now run the setup and this screen shows up:
Click next and select the WPT from the list:
Click «Install» and the Setup downloads the required files.
and installs the WPT
After a reboot (required to add the WPT folder to the PATH variable to run the tools from every place) you are ready to follow my xperf guides here on msfn:
Trace Windows Vista/7 boot/shutdown/hibernate/standby/resume issues
http://www.msfn.org/board/index.php?showtopic=140247
How to speed up boot process under Windows Vista or Windows 7
http://www.msfn.org/board/index.php?showtopic=140262
Analyzing DPC / Interrupt Issues:
http://www.msfn.org/board/index.php?showtopic=140263
Analyzing High CPU Usage Issues:
http://www.msfn.org/board/index.php?showtopic=140264
1 tip: The setup stores the MSI files in the folder C:\Program Files (x86)\Windows Kits\8.0\Windows Performance Toolkit\Redistributables. The 32Bit version is named WPTx86-x86_en-us.msi, the 64Bit version is named WPTx64-x86_en-us.msi. The 3rd file (WPTarm-arm_en-us.msi) is needed for ARM based tablets/notebooks which run Windows RT.
You can use the MSI installer to avoid downloading the WPT after you reinstall Windows!
If you use Windows 8.1, you MUST use the WPT from the 8.1 SDK:
http://msdn.microsoft.com/en-US/windows/desktop/bg162891
But here the xperfview.exe is missing and you must use the horrible, blurry WPA.exe and I don’t update my guide to show how it works with this broken tool, this is too much hassle. Upload the files and I’ll try the WPA.exe to read the files.
Edited by MagicAndre1981