
When a network disconnect occurs, it can affect the functionality of various applications and services that rely on a stable network connection. By being aware of these disconnects, We can precisely identify where and when the issues are happening, which helps in narrowing down potential causes. This targeted approach allows for quicker and more effective resolution of problems, ensuring that the overall performance and reliability of network-dependent applications and services are maintained.
Whenever you see logs on your trading platform indicating a network disconnect, you should check if the network adapter of your server has been disconnected from the internet. This disconnection can cause your trading platform to lose communication with your broker’s server, leading your algorithm to fail in closing or opening trades.
If your server did not reboot (all applications are running), yet your trading platform logs show a network disconnect, you need to determine the cause of the disconnect. To do this, check the Event Viewer on your server. This will help you identify whether the disconnection was due to the server’s network losing internet connection or if it was an issue between your trading platform and your broker’s server.
To check for network disconnect, follow the steps below:
1
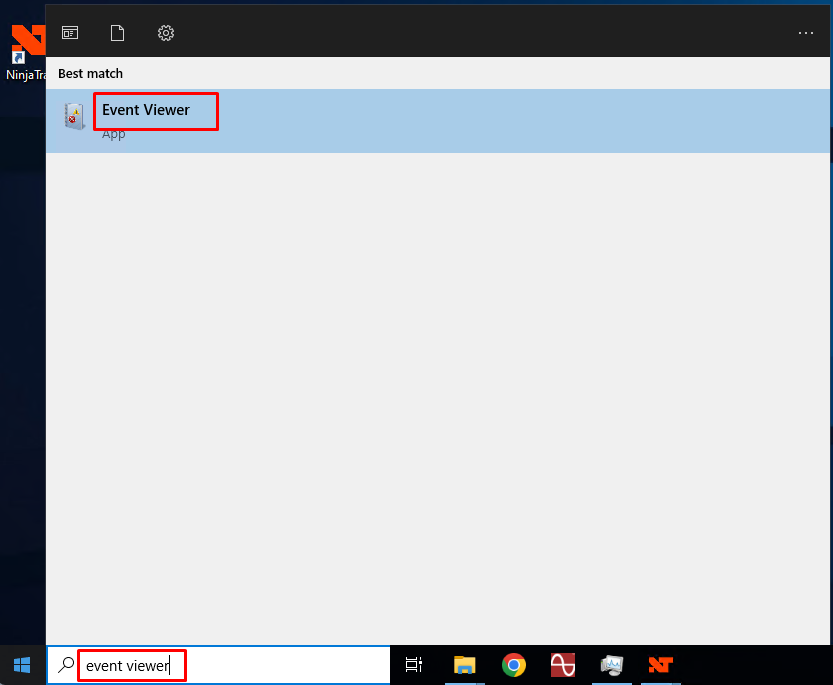
Open the Event Viewer by typing Event Viewer in the Windows search bar.
2
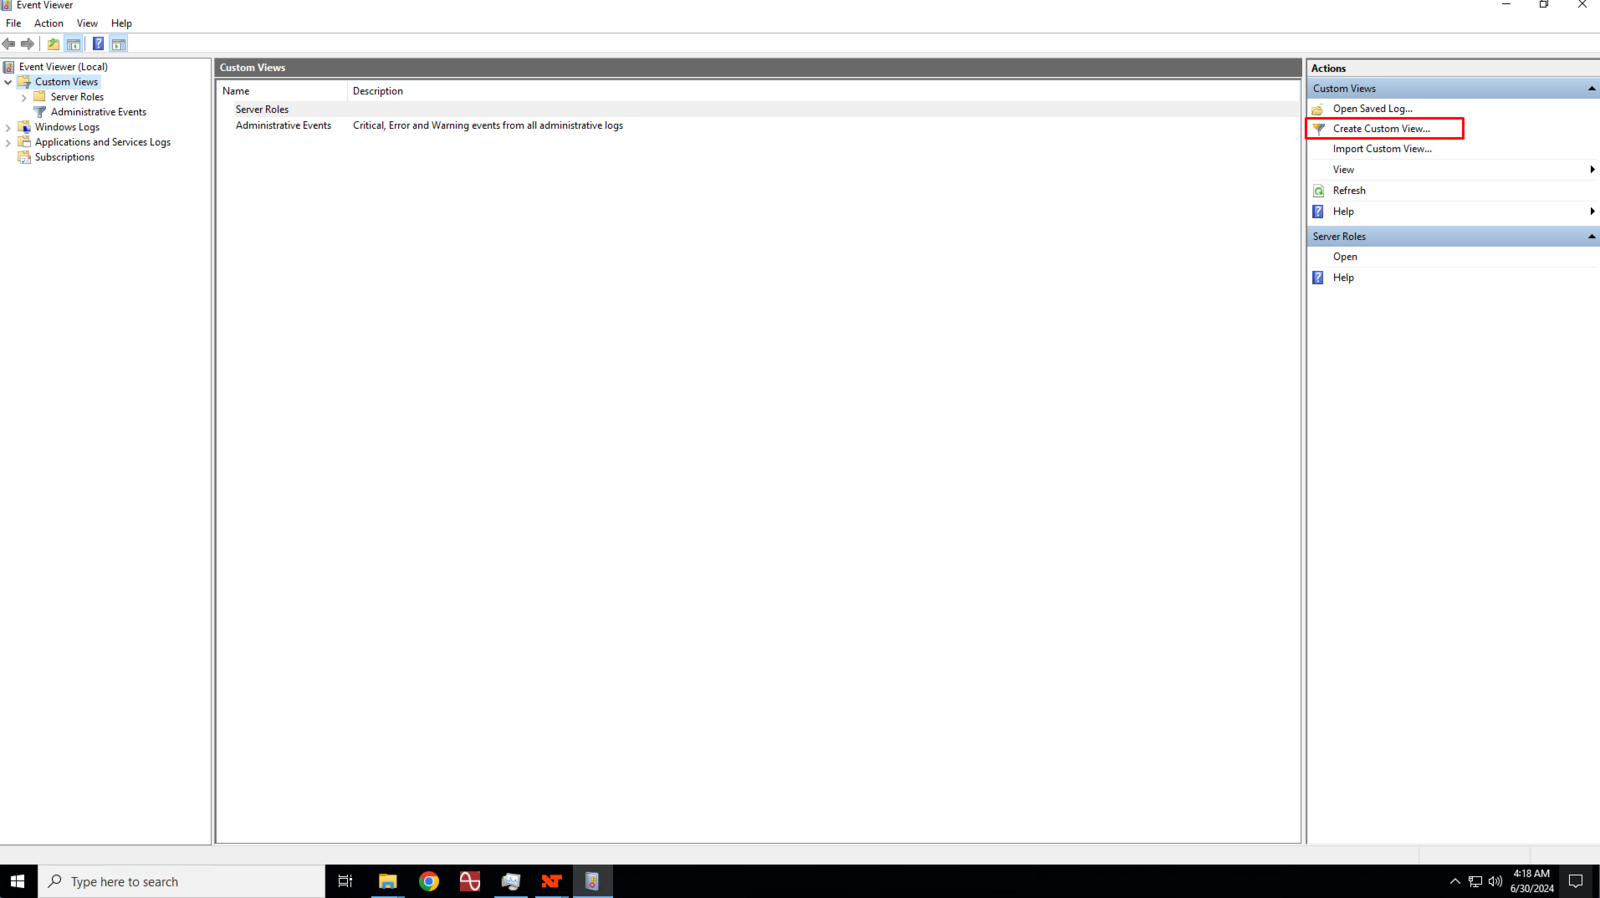
In the right pane, click on Create Custom View
3
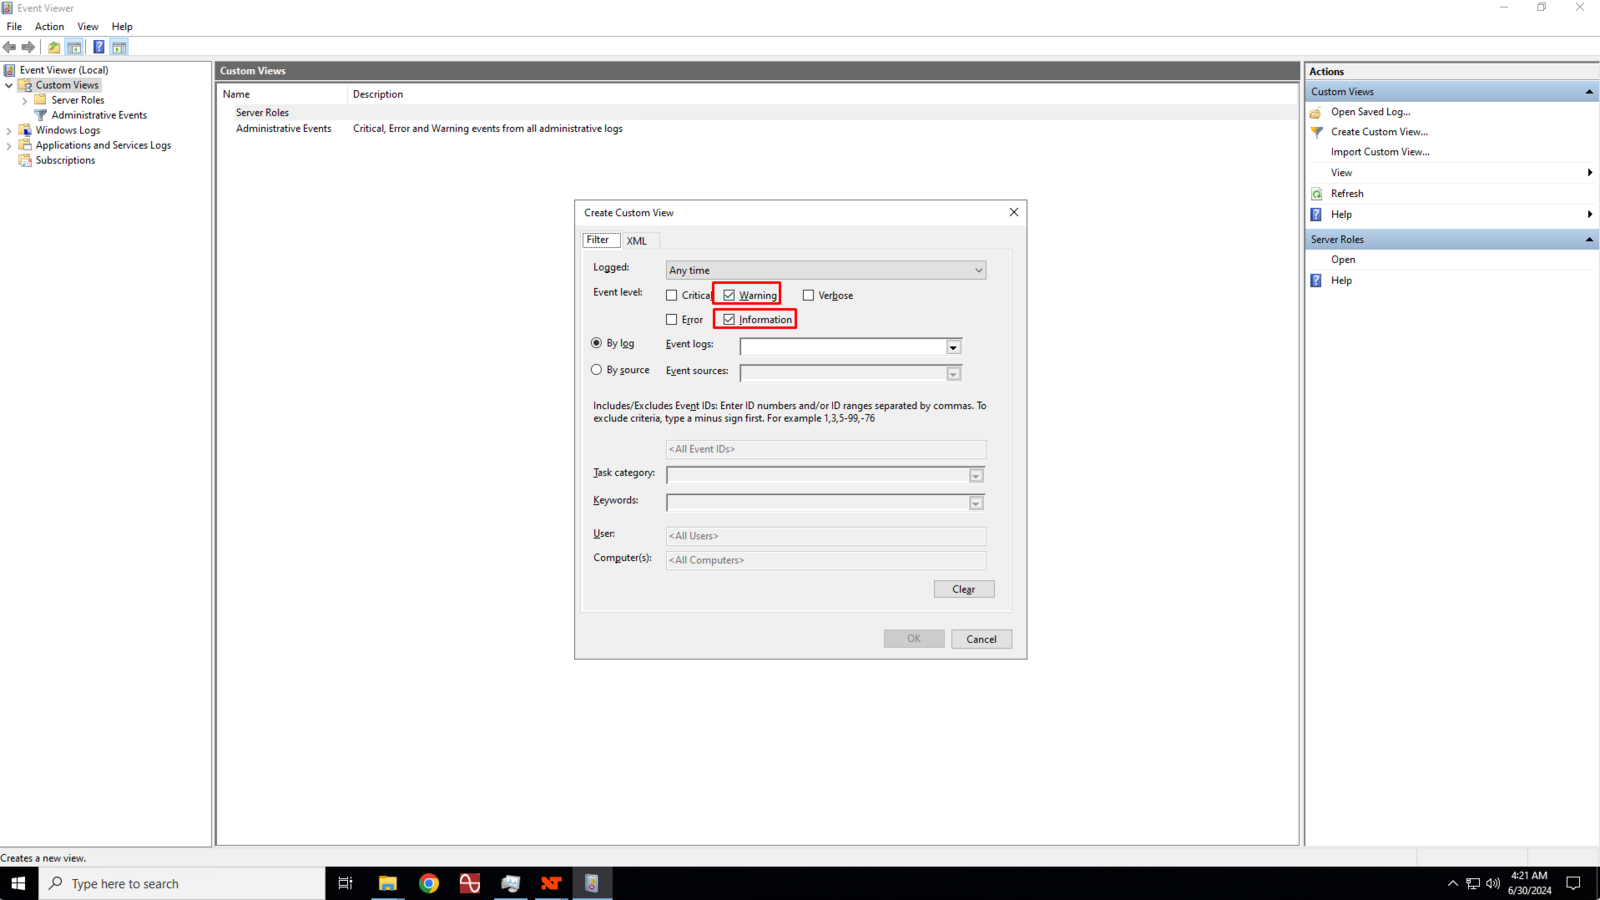
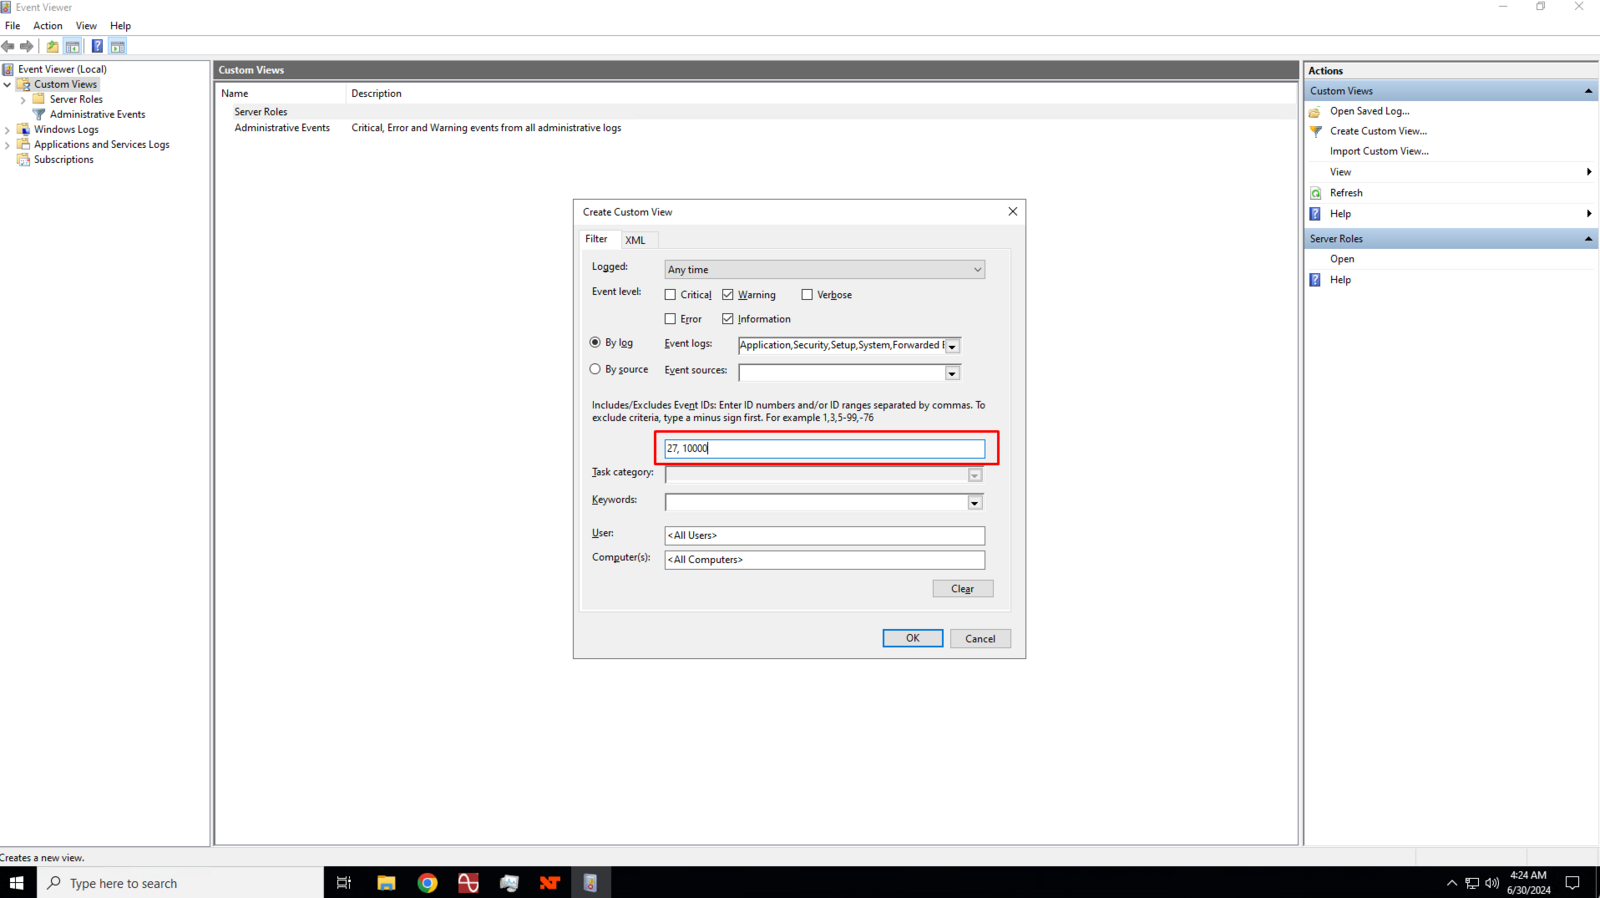
In the Create Custom View dialog box, click to check the Warning and Information boxes.
4
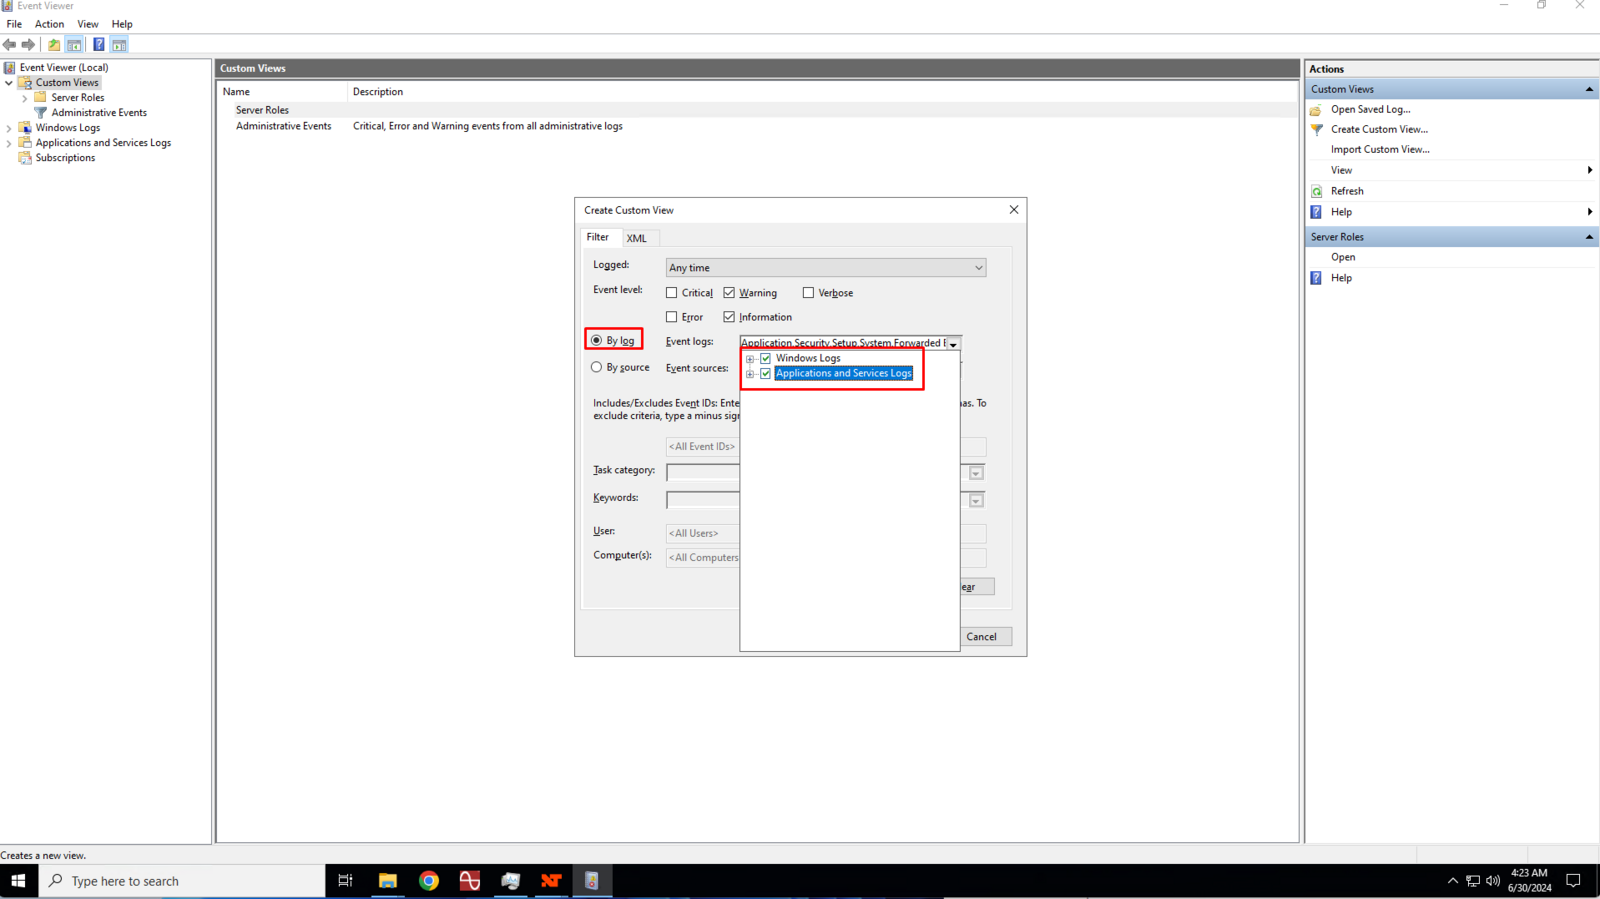
Ensure that the By log is selected and then click the Event Logs drop down box and click to check the Windows Log and Applications and Services Logs boxes.
5
In the Event ID text box, enter 27 and 10000 separated by a comma then click the Ok button to save the custom view.
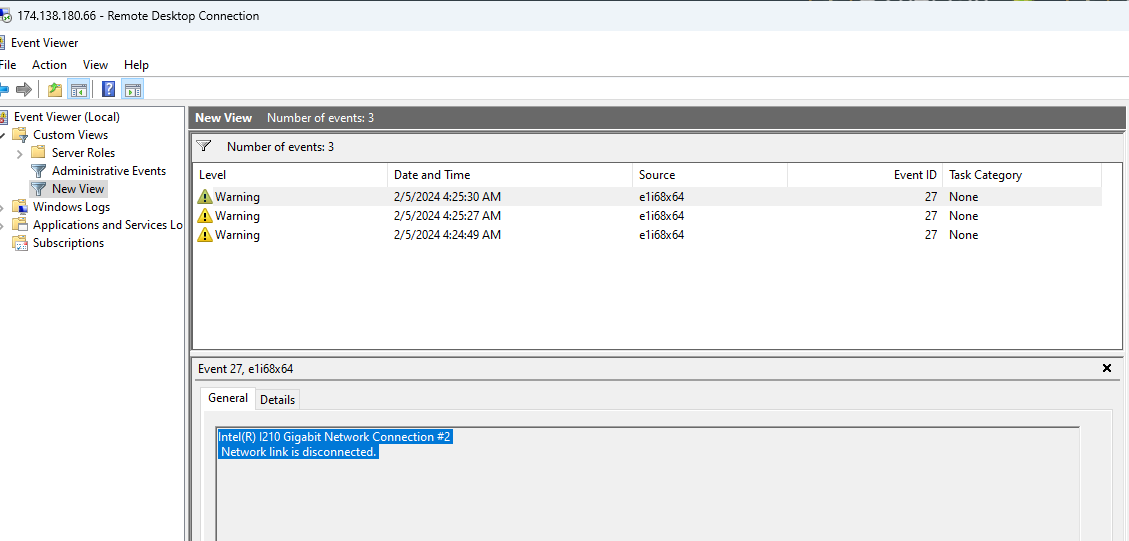
Event ID 27 in Windows Server 2022 typically pertains to a network-related issue, specifically to the network adapter. This event is logged when the network link is disconnected, meaning the network adapter has lost its connection to the network. This can occur for various reasons, including hardware issues, driver problems, or network configuration changes.
Event ID 10000 in Windows Server 2022 is typically associated with the DistributedCOM (DCOM) component. DCOM is a Microsoft technology that enables software components to communicate over a network. This event ID usually indicates a problem related to DCOM, such as permission issues, network connectivity problems, or other errors involving COM components.
6
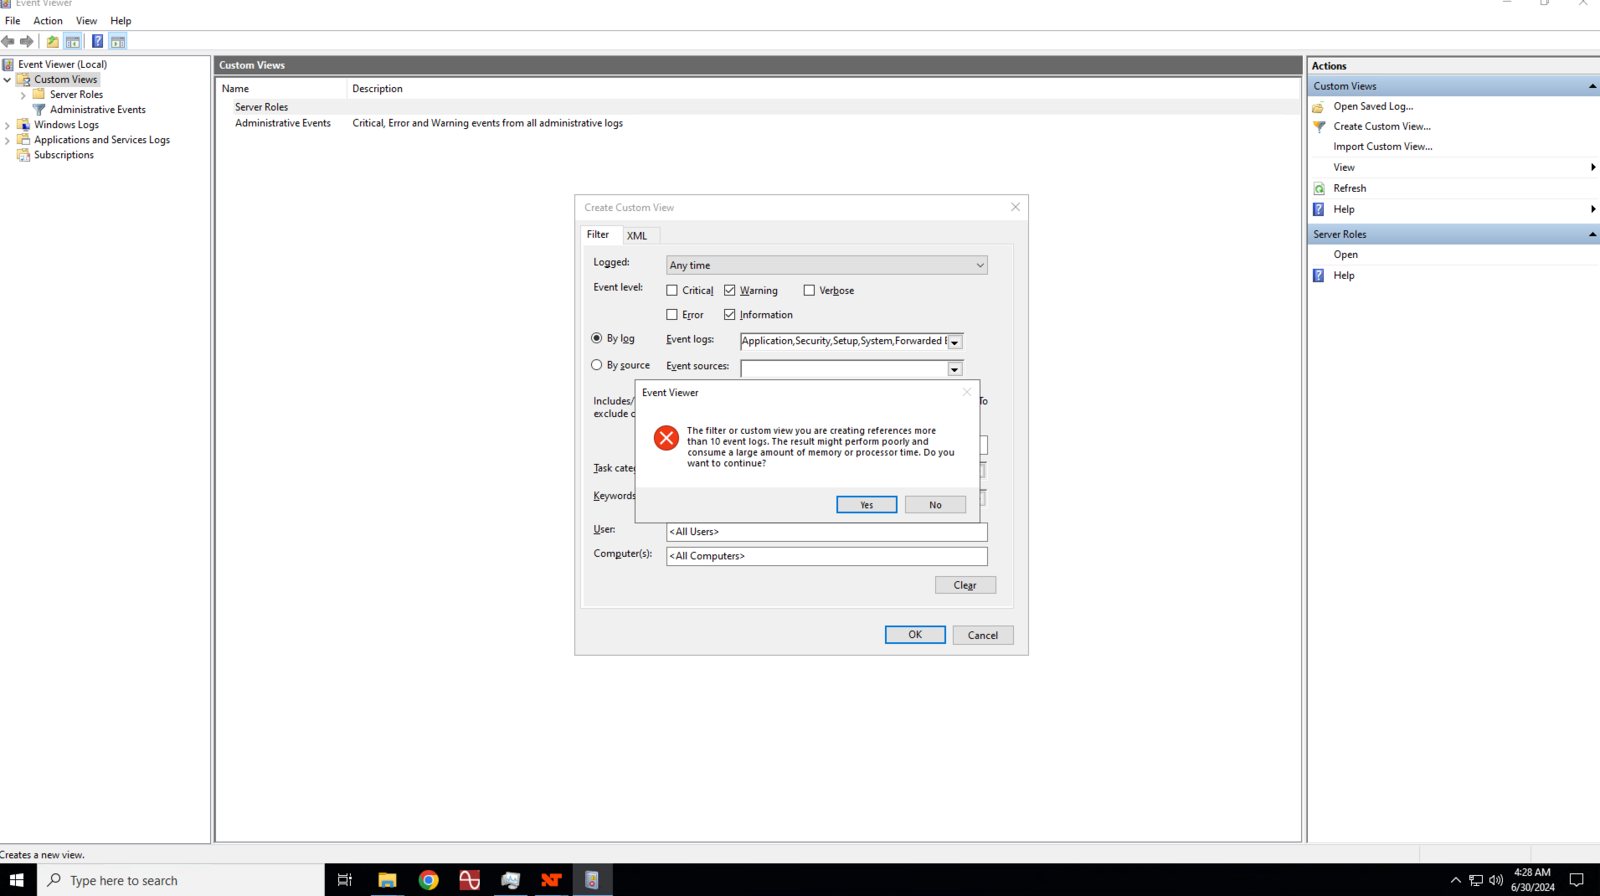
You will get a prompt regarding memory and processor time, simply click the Yes button to proceed.
7
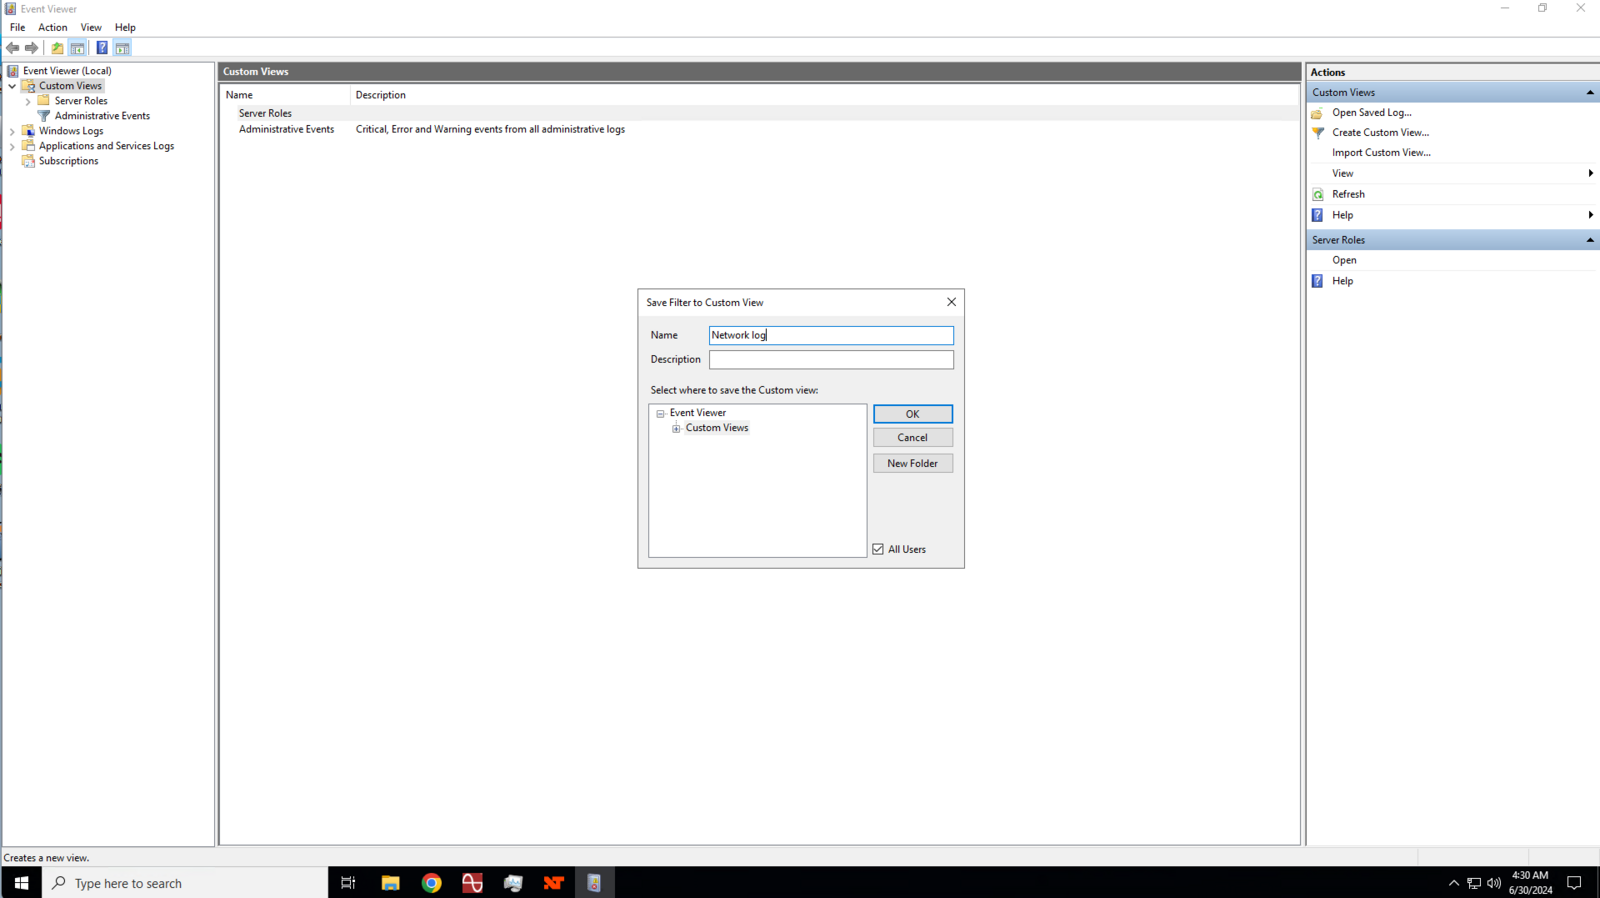
Enter a name for your custom view.
8
If there were no network disconnects or errors, logs won’t show any warnings.
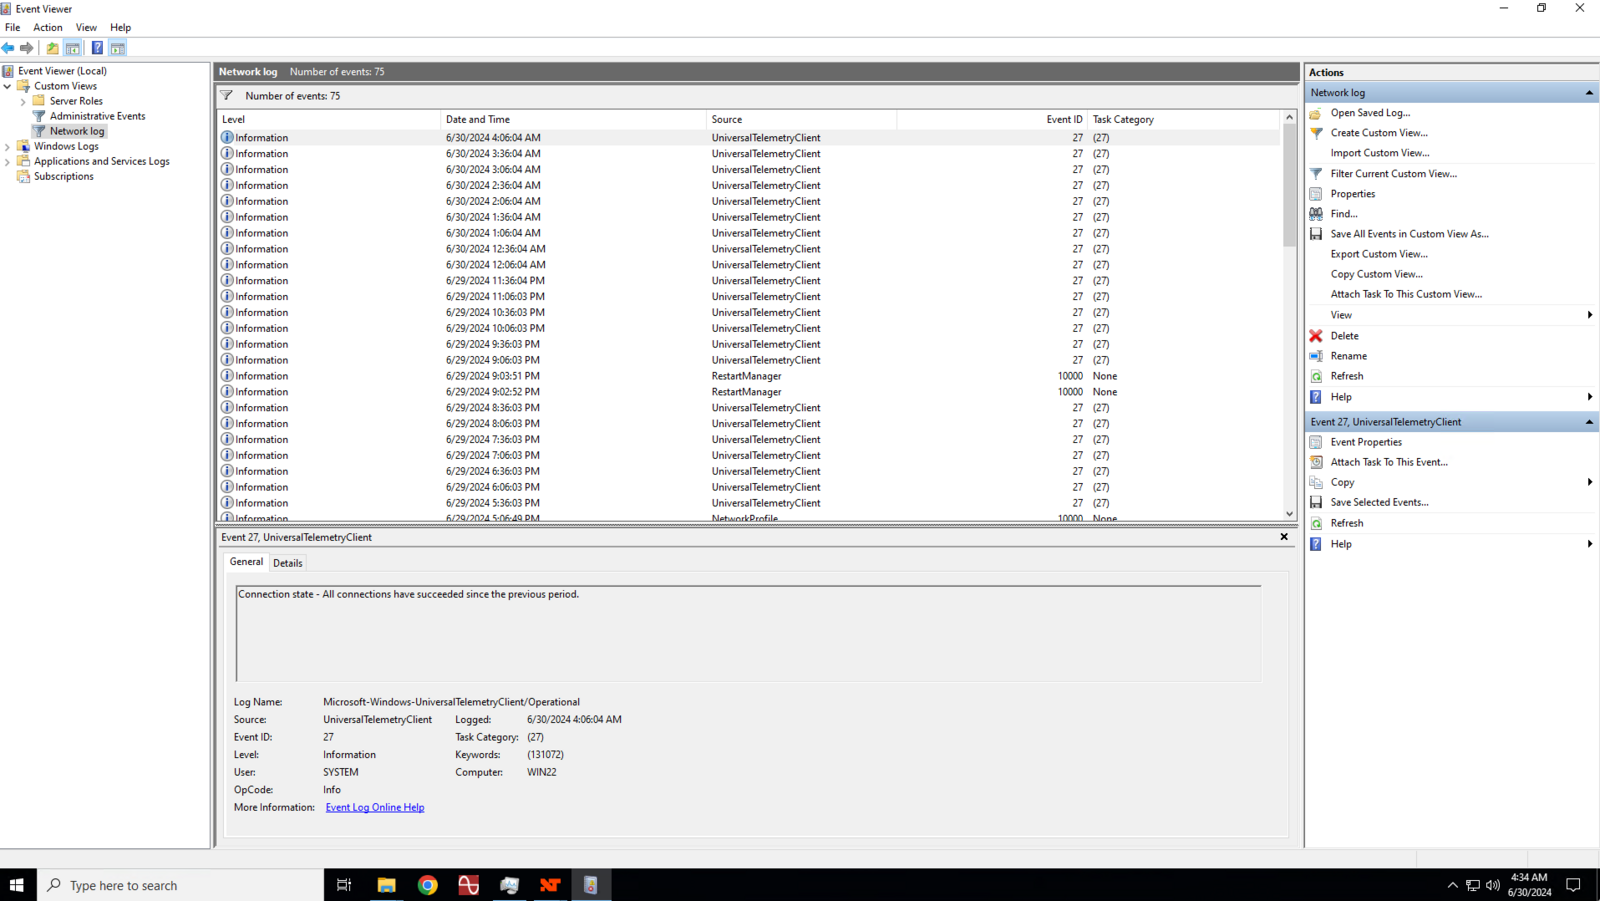
On the other hand, if there were network disconnect, it will show warning.
9
Compare the dates between the event viewer and your trading platform.
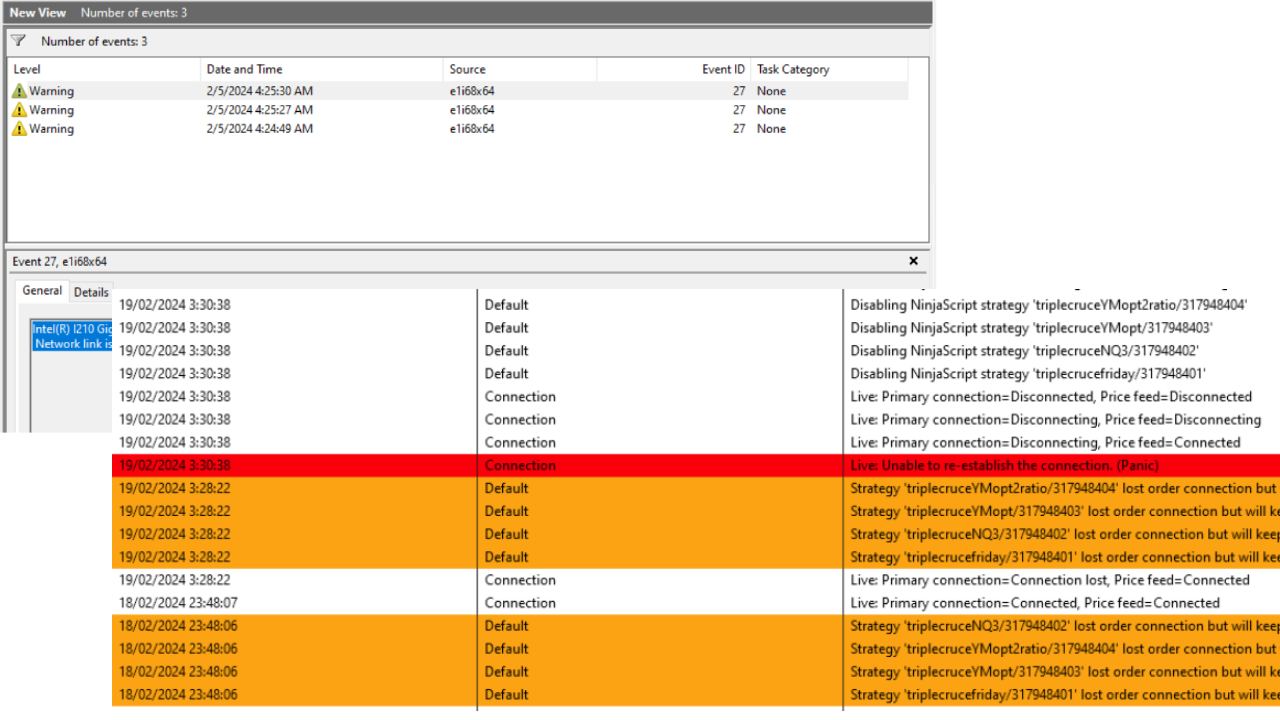
If the dates between the warning shown in the Event Viewer matches the date shown in your trading platform’s Logs, that would mean that your platform’s disconnect was caused by network failure, while if the dates between Event Viewer and trading platform logs are not matching, the disconnect happened between your trading platform and your broker.
How to check network disconnection events in the Windows system event log
Accessing your internet logs can vary depending on the device, operating system, and browser you are using. Here’s a detailed guide for different scenarios:
1. Accessing Internet Logs on a Windows PC
Using Windows Event Viewer:
- Open Event Viewer:
- Press
Win + R, typeeventvwr, and hitEnter.
- Press
- Navigate to Network Logs:
- In the left pane, expand Windows Logs, then click on Security or System logs.
- Filter for Network Events:
- You can filter the events to find those related to network or internet connections.
Using Browser History:
-
Most web browsers keep a history of the websites you visit.
-
Google Chrome:
- Open Chrome.
- Click on the three vertical dots (menu) in the upper right corner.
- Hover over “History” and click on “History” again. You can view the list of visited sites along with the timestamps.
-
Mozilla Firefox:
- Open Firefox.
- Click on the three horizontal lines (menu) in the upper right corner.
- Click on “Library” > “History” > “Show All History.”
-
Microsoft Edge:
- Open Edge.
- Click on the three horizontal dots (menu) in the upper right.
- Click on “History” to view your browsing records.
2. Accessing Internet Logs on macOS
Using Console Application:
- Open Console:
- You can find this in Applications > Utilities > Console.
- View Logs:
- Look at the logs for network-related entries. You can filter by typing «network» in the search bar.
Using Browser History:
- Similar to Windows, each browser has its own method:
- Safari:
- Open Safari.
- Click on «History» in the menu bar to see your browsing history.
3. Accessing Logs on Mobile Devices
Android:
-
Using Browser History:
- Open your browser (Chrome, Firefox, etc.) and follow similar steps as on a PC to access the history.
-
Using Device Settings:
- Go to Settings > Network & internet > Data usage to see some network activity.
iOS (iPhone/iPad):
- Using Browser History:
- Open Safari, tap the book icon, and then tap the clock icon to access your history.
4. Accessing Router Logs
If you want to access logs of all devices connected to your network, you can check your router’s logs:
-
Access Router Settings:
- Enter the router’s IP address in a web browser (usually something like
192.168.1.1or192.168.0.1). - Log in with the admin credentials (often found on the router or in the manual).
- Enter the router’s IP address in a web browser (usually something like
-
Find Logs:
- Look for a section labeled Logs, System Log, or Traffic Monitor. The exact terminology can vary based on the router brand.
5. Using Third-Party Software
There are applications available that can keep a more detailed log of internet usage:
- GlassWire: Monitors your network activity in real-time and logs it.
- Wireshark: A more advanced tool for capturing and analyzing packets over your network.
Tips for Reviewing Logs
- Keep in mind that logs can contain a lot of information. You may want to filter or search for specific URLs or timestamps.
- Regularly clearing your browser history can help maintain privacy but will also erase your logs.
- Remember that your internet service provider (ISP) may also keep logs of your internet activity, which you typically cannot access directly.
Conclusion
Accessing your internet logs can be straightforward depending on your needs and the tools you choose to use. Whether it’s through browser history, system logs, or router settings, you have several options to see your internet activity. If you have specific requirements or further questions, feel free to ask!
This question has been answered using artificial intelligence. If there is any problem please contact us.
Did you like this answer?
Similar Questions
- How do I access my router log?
- How do I log into my Huawei access point?
- How do I access network logs?
- log to base 9(log to base 4 16) evaluate?
- Is log into or log in to?
- Do I log in or log on?
- How do I log into my CCTV through the internet?
Monitoring network activity can be a complicated, tedious process, but it is also essential in finding out which programs connect to the Internet, and how much data they upload or download in the process.
While you can use all sorts of programs for that, from the built-in Windows Firewall which reveals if a program requests Internet connection access over third-party solutions like the excellent NetBalancer, Networx or Free Process-Traffic Monitor to hardware-based solutions.
Microsoft built a solution right into its Windows 10 operating system that is good for a quick overview of what is going on as it reveals network activity for all apps and programs that ran on the computer in the past 30-days.
Network Activity History
Windows logs the information automatically even if users of the system don’t make use of it. This means that you will get a full network activity history even if you never configured Windows 10 to provide you with those information or even opened the interface that highlights the information.
Microsoft built the information into the task manager of the operating system. Here is what you need to do to list the network activity of apps and programs on Windows 10 machines:
- Use the shortcut Ctrl-Shift-Esc to open the Windows Task Manager.
- Select «More details» if you only see a list of programs but nothing else to switch to the detailed view.
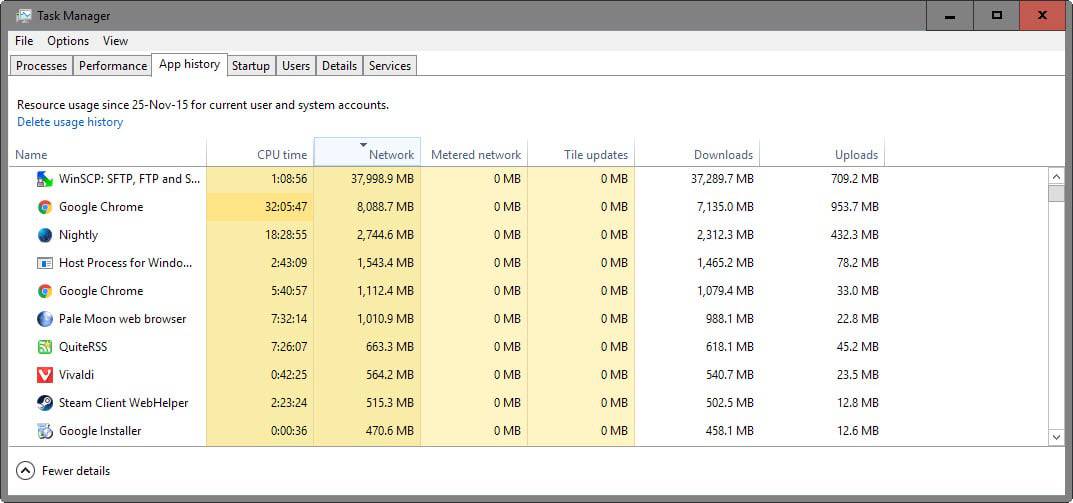
- Switch to the App History tab in the window. You will notice that only apps are listed on the page by default.
- Select Options > Show history for all processes. Doing so adds legacy programs to the listing so that you get traffic information for all programs as well.
The page lists the following information for each program:
- CPU Time.
- Network utilization.
- Metered network utilization.
- Non-metered network utilization.
- Tile updates (apps only)
- Downloads.
- Uploads.
Downloads, uploads and non-metered network are not displayed by default. You need to right-click on the header of the table to enable those options individually.
Network, as well as downloads or uploads are good indicators of a program’s network activity. You can click on any column header to sort the list of programs using it.
This way you can sort programs by how much network traffic they have used, or by how much they have uploaded to the Internet.
The latter can reveal interesting privacy-related information, for instance if a program is listed as having uploaded data even though it does not really require an Internet connection to work.
You could then block certain programs from accessing the Internet, or even remove them from the system if suspicious behavior is recorded.
Closing Words
Windows 10’s App History Task Manager page provides you with a quick — but thorough — overview of network activity of processes running on the system. It can also highlight processes that use the most cpu time for example, which can also be valuable information.
It may make sense to go through the listing from time to time to check up on processes to make sure they behave and don’t communicate with the Internet.
You do need other software, network monitors like Wireshark to find out more about the data that is transferred by a listed process.
Summary
Article Name
Windows 10: display 30-days worth of network activity
Description
Find out how to display the network activity of all programs running on Windows 10 machines for the past 30 days.
Author
Martin Brinkmann
Publisher
Ghacks Technology News
Logo
Advertisement
Если вы подозреваете, что встроенный Windows Defender Firewall блокирует некоторые сетевые подключений (от определенной программы или сервиса), плохим решением будет его полное отключение. Вместо этого вы можете включить логирование сетевого трафика, проходящего через брандмауэр, определить заблокированные используемые порты и/или IP адреса источника/назначения и создать корректное разрешающее правило.
В этой статье мы покажем, как включить логирование сетевых подключений в Windows Firewall и выполнить поиск по логам.
Настройка логирования Windows Firewall в текстовый файл
Содержание:
- Запись логов Windows Firewall в журнал событий Windows
Windows Defender Firewall позволяет записывать в лог файл как успешные так и заблокированные сетевые подключения. Логирование можно включить отдельно для каждого сетевого профиля (частная, общедоступная или доменная сеть). По умолчанию логирование трафика в брандмауэре отключено. Чтобы включить ведение логов в Windows Firewall:
- Откройте MMC оснастку Windows Firewall with Advanced Security (
wf.msc
). - Щелкните правой кнопкой по корню консоли и выберите Properties;
- Затем выберите вкладку сетевого профиля Windows, для которого вы хотите включить логирование (Domain, Private или Public Profile).
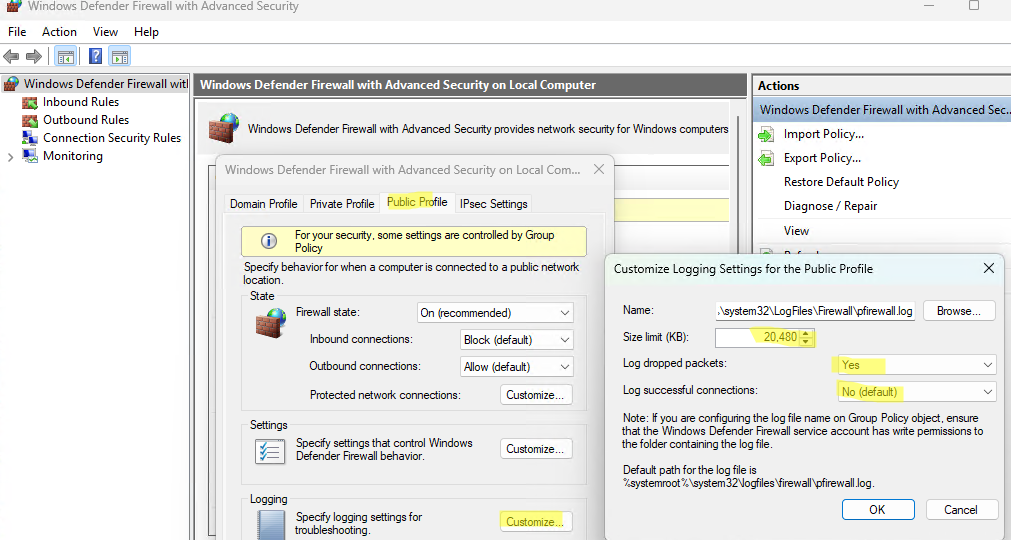
- На вкладке профиля в секции Logging нажмите кнопку Customize.
- Здесь можно изменить следующие настройки:
Файл лога: по умолчанию
%systemroot%\system32\LogFiles\Firewall\pfirewall.logМаксимальный размер лога: увеличьте с 4 Мб до 20 Мб (
20480
Кб)Log dropped packets: нужно ли записывать в лог отфильтрованные сетевые пакеты
Log successful connections: нужно ли логировать успешные сетевые подключения (может получиться очень большой лог)

Чтобы понять, какой сетевой профиль заблокировал или пропустил определенное сетевое подключение, можно писать лог файервола в отдельный файл для каждого профиля. Например:
-
%windir%\system32\logfiles\firewall\pfirewall_domain.log -
%windir%\system32\logfiles\firewall\pfirewall_private.log -
%windir%\system32\logfiles\firewall\pfirewall_public.log
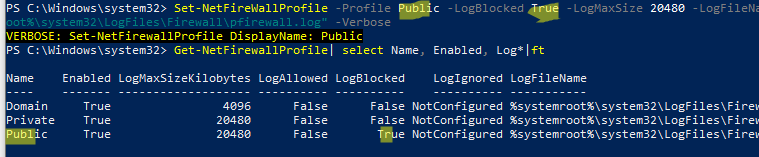
Также можно включить эти же параметры логирования Windows Firewall с помощью PowerShell:
Set-NetFireWallProfile -Profile Public -LogBlocked True -LogMaxSize 20480 -LogFileName "%systemroot%\system32\LogFiles\Firewall\pfirewall.log" -Verbose
Вывести текущие настройки логирования брандмауэра для всех профилей:
Get-NetFirewallProfile| select Name, Enabled, Log*|ft
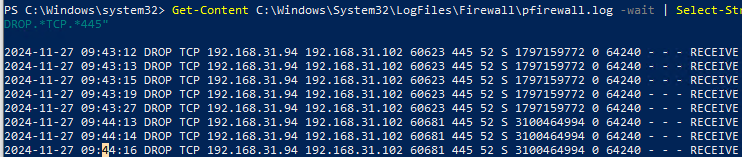
Теперь Windows Firewall будет записывать в лог файлы все сетевые подключения. Вы можете открыть файл лога вручную или выполнить поиск по нему с помощью PowerShell. Командлет Select-String совмещает в себе аналог grep и tail для Windows.
Например, следующая команда будет выводить в реальном времени на экран все отфильтрованные (DROP) сетевые подключения на порт TCP порт 445 (SMB):
Get-Content C:\Windows\System32\LogFiles\Firewall\pfirewall.log -wait | Select-String -pattern "DROP.*TCP.*445"
Используется такой формат лог файла:
date time action protocol src-ip dst-ip src-port dst-port size tcpflags tcpsyn tcpack tcpwin icmptype icmpcode info path pid
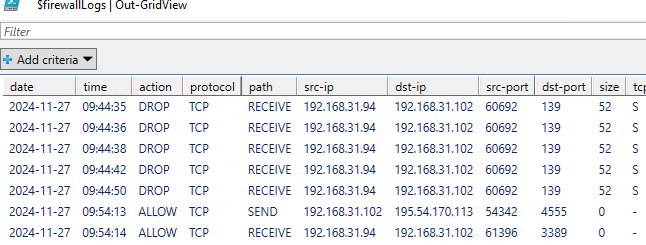
Для анализа лог файлов файервола можно воспользоваться такой PowerShell функцией, которая представит лог в виде удобной графической таблицы Out-GridView:
function Get-WindowsFirewallLog {
param(
[parameter(Position=0,Mandatory=$false)]
[ValidateScript({Test-Path $_})]
[string]$LogFilePath = "$env:SystemRoot\System32\LogFiles\Firewall\pfirewall.log"
)
$headerFields = @("date","time", "action","protocol","src-ip","dst-ip","src-port","dst-port","size", "tcpflags","tcpsyn", "tcpack","tcpwin","icmptype","icmpcode", "info","path")
$firewallLogs = Get-Content $LogFilePath | ConvertFrom-Csv -Header $headerFields -Delimiter ' '
$firewallLogs | Out-GridView
}
Get-WindowsFirewallLog
Запись логов Windows Firewall в журнал событий Windows
По сравнению с текстовыми файлам иногда более удобно записывать логи сетевых подключений Windows Firewall в журнал событий (Event Viewer). Для этого нужно включить политики аудита в локальной GPO:
- Откройте редактор локальной GPO (
gpedit.msc
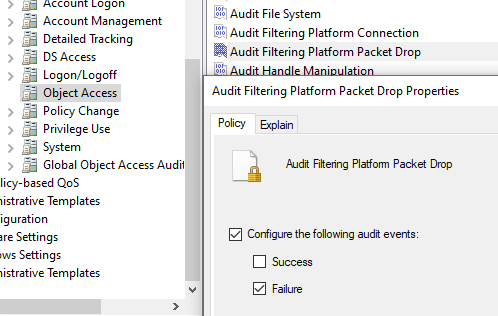
) - Перейдите в раздел Computer Configuration -> Windows Settings -> Security Settings -> Advanced Audit Policy Configuration -> System Audit Policies — Local Group Policy Object -> Object Access
- Параметр Audit Filtering Platform Packet drop позволяет включить аудит заблокированных подключений Windows Firewall. Откройте настройки политики и активируйте опцию Failure.

- Audit Filtering Platform Connection позволяет логировать успешные подключения. Используется эта политика аудита довольно редко, т.к. в лог будет писаться очень много событий (потребуется увеличение размеров журнала Event Viewer)
- Обновите настройки локальной GPO командой
gpupdate /force
Такую политику аудита можно включить командой:
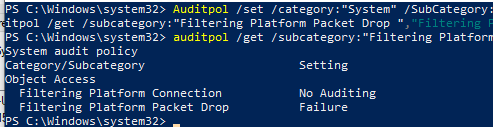
Auditpol /set /category:"System" /SubCategory:"Filtering Platform Packet Drop" /failure:enable
Вывести текущие настройки политика аудита Windows Firewall:
auditpol /get /subcategory:"Filtering Platform Packet Drop","Filtering Platform Connection"
Чтобы посмотреть события Windows Firewall, откройте Event Viewer (
eventvwr.msc
). Разверните Windows Logs -> Security. Включите фильтр событий по категории Filtering Platform Packet Drop.
В списке событий появится все сетевые подключения, заблокированные Windows Firewall. Такие события будут иметь Event ID 5152 (
The Windows Filtering Platform has blocked a packet
). В описании события можно получить сетевую информацию: номер протокола (TCP-6, UDP-17, ICMP-1), IP адрес и порт источника/приемника, направление (Inbound, Outbound), процесс (для исходящих подключений).
Для поиска и фильтрации событий Windows Firewall в Event Viewer можно использовать PowerShell командлет Get-WinEvent. Следующий PowerShell скрипт выполнит поиск всех заблокированных брандмауэром событий (попыток) подключений на порт 3388 и выведет таблицу с временем подключения и источником:
$destinationPort = "3388"
$filterXml = @"
<QueryList>
<Query Id="0" Path="Security">
<Select Path="Security">
*[System[(EventID=5152)]]
and
*[EventData[Data[@Name='DestPort'] and (Data='$destinationPort')]]
</Select>
</Query>
</QueryList>
"@
$FirewallLogs = @()
$events=Get-WinEvent -FilterXml $filterXml
foreach ($event in $events) {
$eventXml = [xml]$event.ToXml()
$SourceAddress = $eventXml.Event.EventData.Data | Where-Object { $_.Name -eq 'SourceAddress' } | Select-Object -ExpandProperty '#text'
$DestPort = $eventXml.Event.EventData.Data | Where-Object { $_.Name -eq 'DestPort' } | Select-Object -ExpandProperty '#text'
$FirewallLog = New-Object PSObject -Property @{
SourceAddress= $SourceAddress
Time=$event.TimeCreated
DestPort=$DestPort
}
$FirewallLogs += $FirewallLog
}
$FirewallLogs
Таким образом, включив логи брандмауэра вы можете детально инспектировать все отброшенные и разрешенные взодящие/исходящие сетевые соединения, найти ошибки в своих правилах Windows Firewall и создать корректные.