
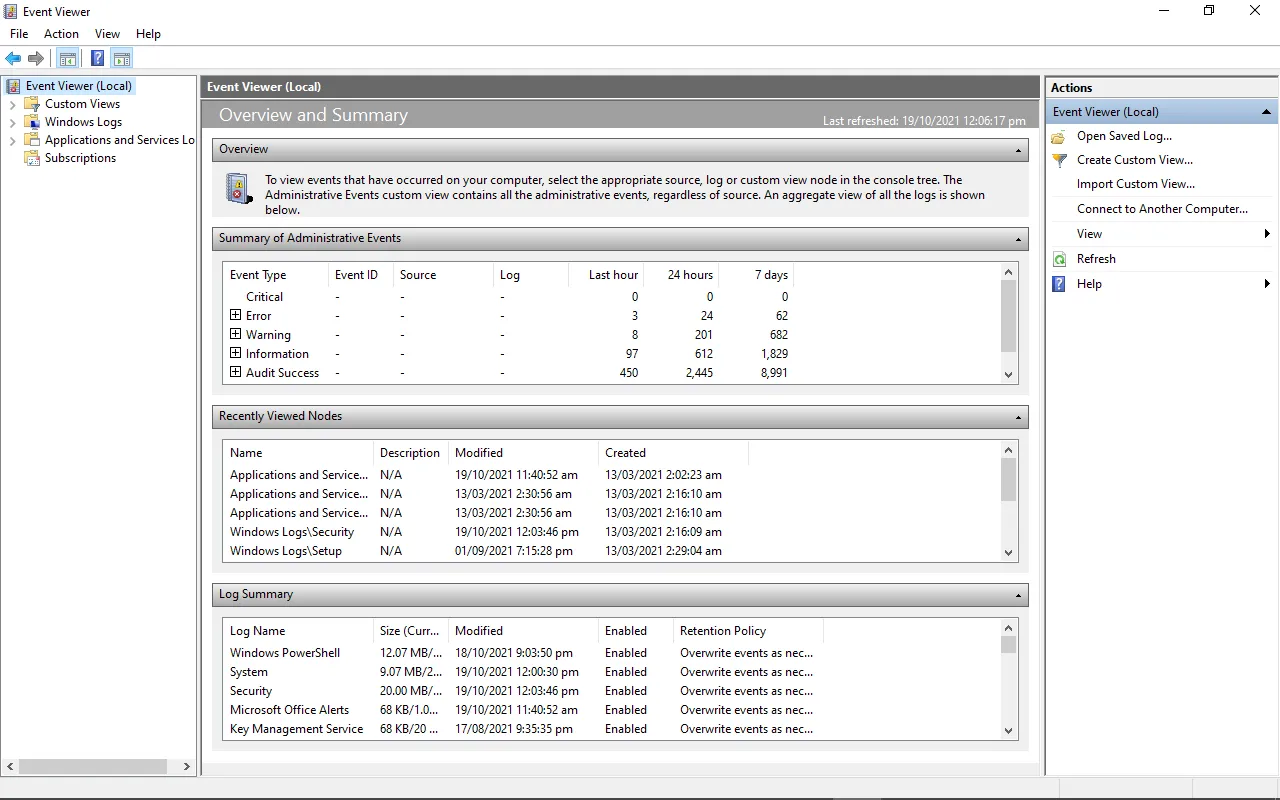
The Windows 10 Event Viewer is an app that shows a log detailing information about significant events on your computer. This information includes automatically downloaded updates, errors, and warnings.
In this article, you’ll learn what the event viewer is, the different logs it has, and most importantly, how to access it on a Windows 10 computer.
What is the Event Viewer?
Each program you open on your Windows 10 computer sends a notification to a particular activity log in the Event Viewer.
All other activity such as OS changes, security updates, driver quirks, hardware failure, and so on are also posted to a particular log. So you can think of the event viewer as a database that records every activity on your computer.
With the event viewer, you can troubleshoot different Windows and application issues.
If you explore the event viewer in-depth, you will see different information, warnings, and plenty of errors. Don’t freak out – this is normal. Even the best-maintained computers show plenty of errors and warnings.
There are 3 main ways you can gain access to the event viewer on Windows 10 – via the Start menu, Run dialogue, and the command line.
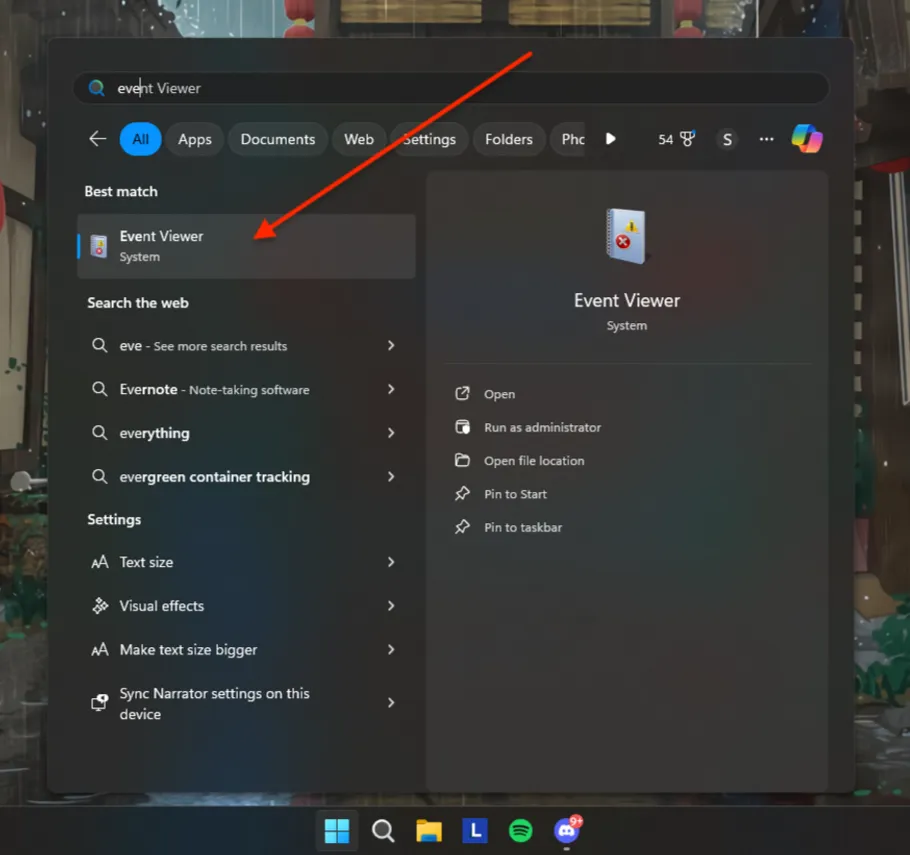
Step 1: Click on Start or press the WIN (Windows) key on your keyboard
Step 2: Search for “Event Viewer”
Step 3: Click on the first search result or press ENTER
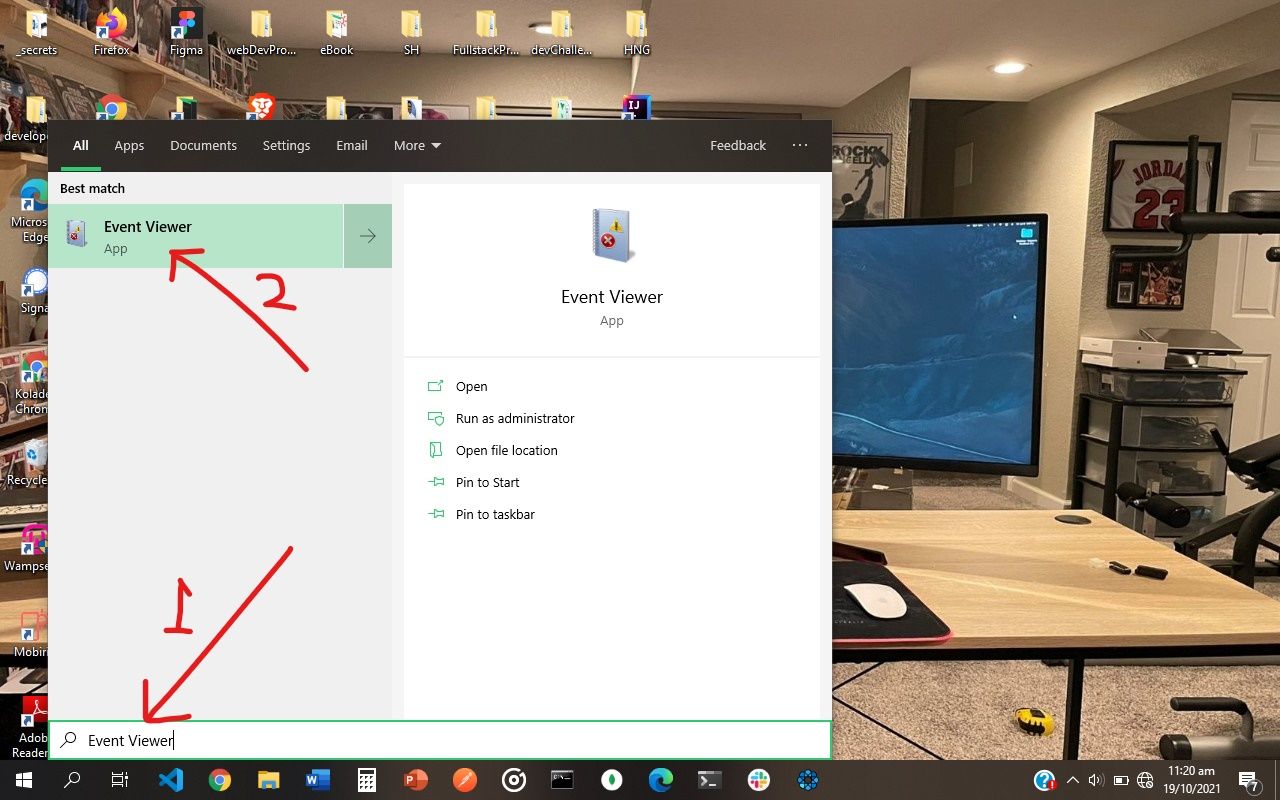
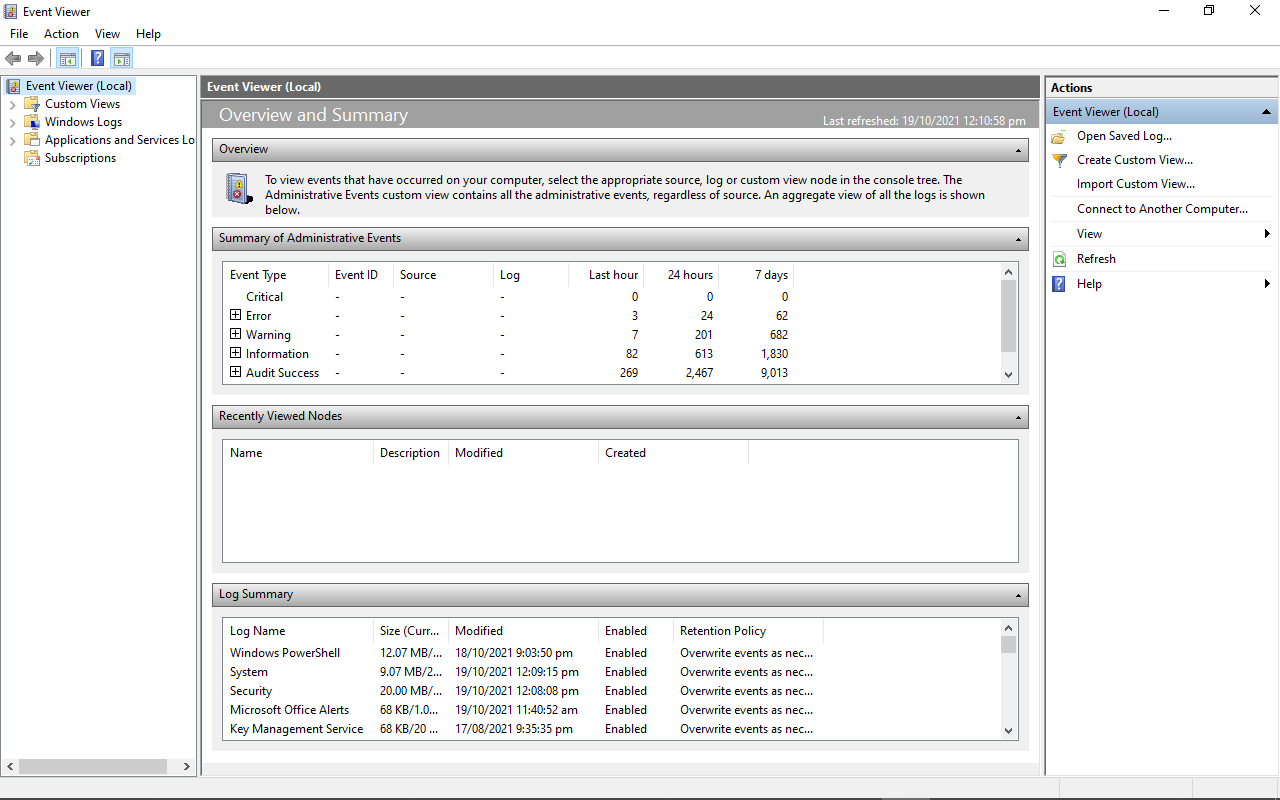
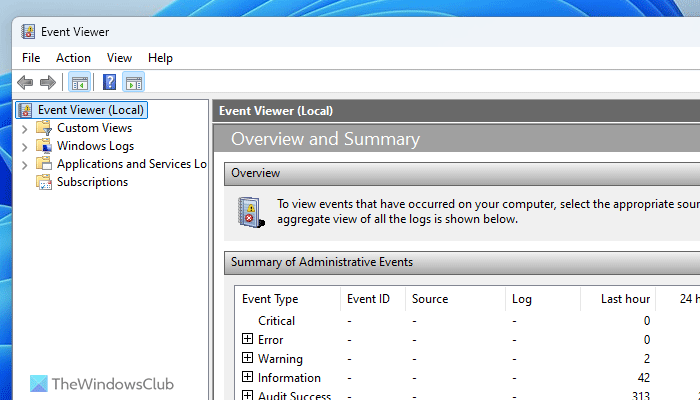
You will be greeted with this page:

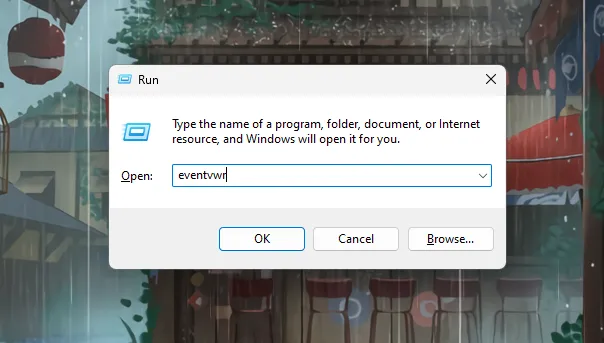
How to Access the Windows 10 Activity Log through the Run Dialogue
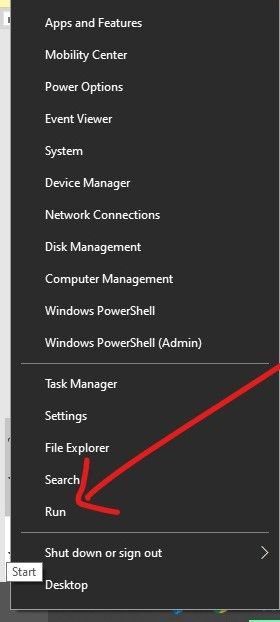
Step 1: Right-click on Start (Windows log) and select “Run”, or press WIN (Windows key) + R on your keyboard
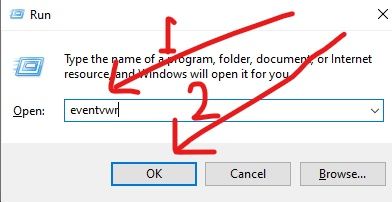
Step 2: Type in “eventvwr” to the editor and click “Ok” or hit ENTER
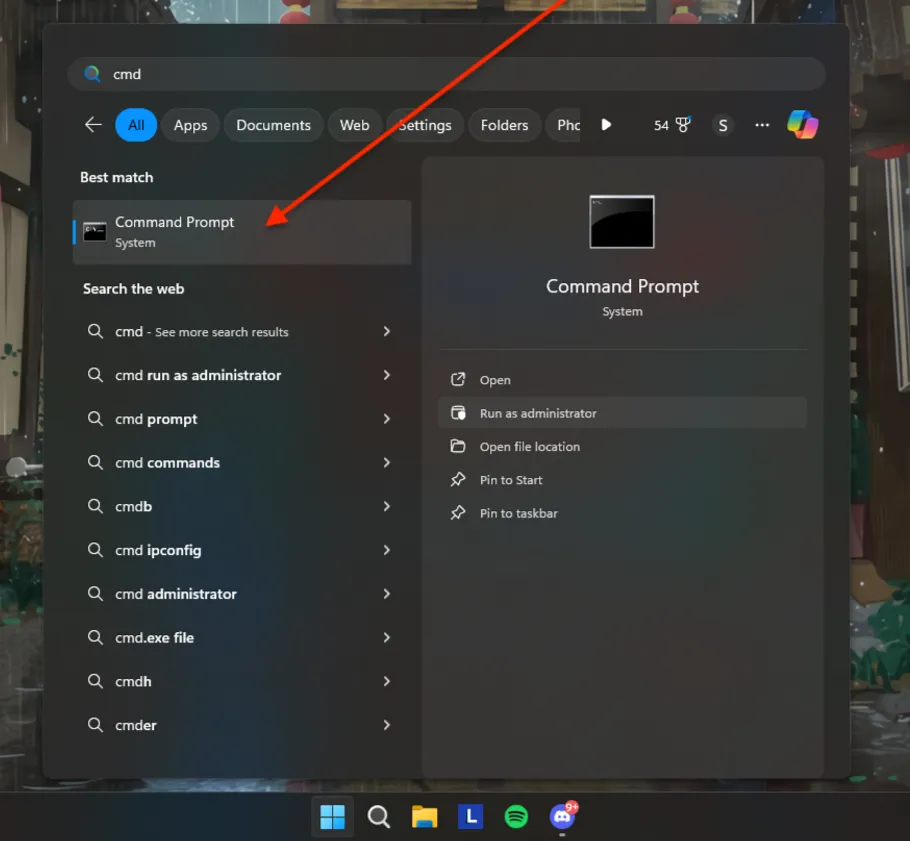
How to Access the Windows 10 Activity Log through the Command Prompt
Step 1: Click on Start (Windows logo) and search for “cmd”
Step 2: Hit Enter or click on the first search result (should be the command prompt) to launch the command prompt
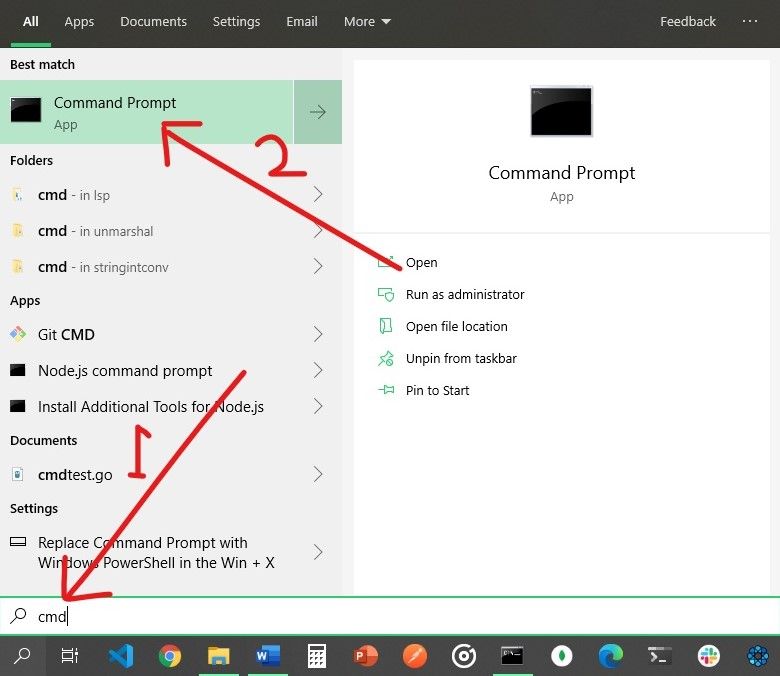
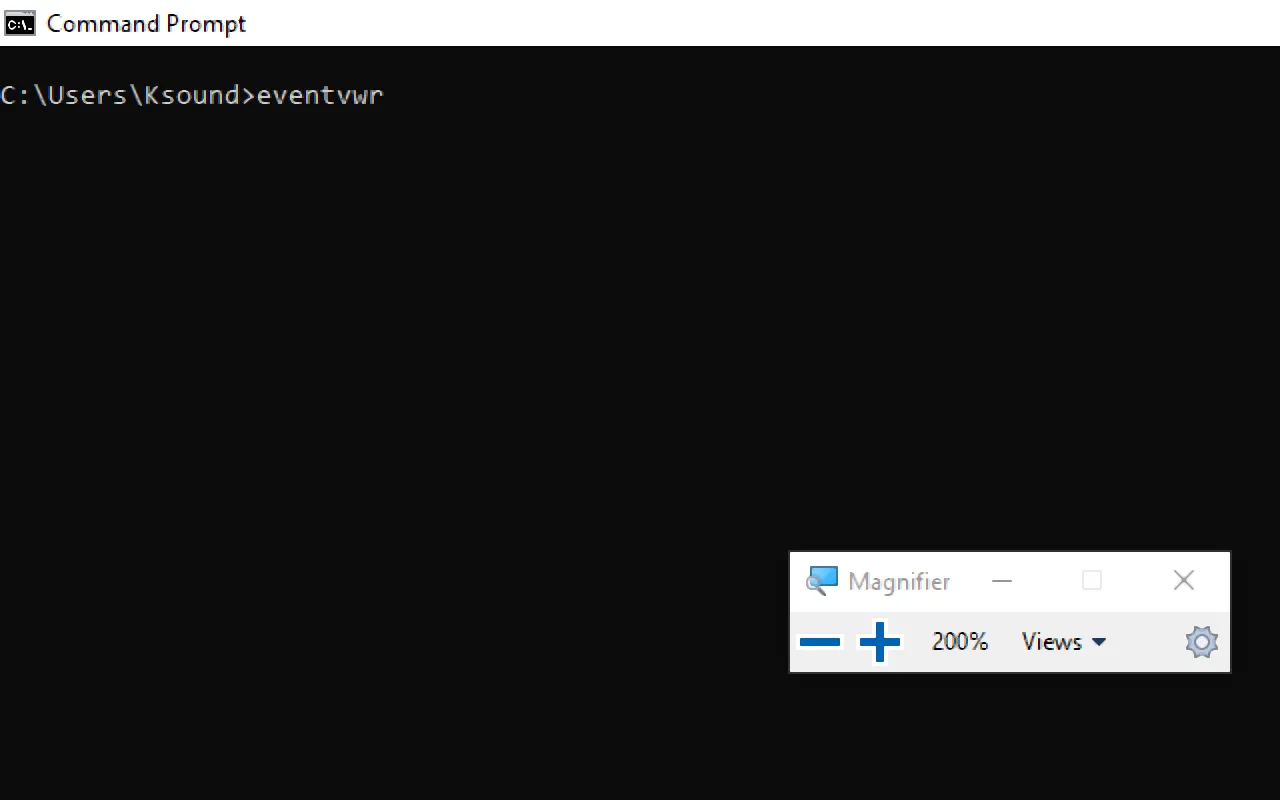
Step 3: Type in “eventvwr” and hit ENTER

Event Viewer Activity Logs
When you open the event viewer to see your computer’s activity logs, you are automatically shown the Event Viewer (Local) tab. But this might not contain the details you need, as it’s just a page you are greeted with when you open the Event Viewer.
There is lots more to the Event Viewer than this.
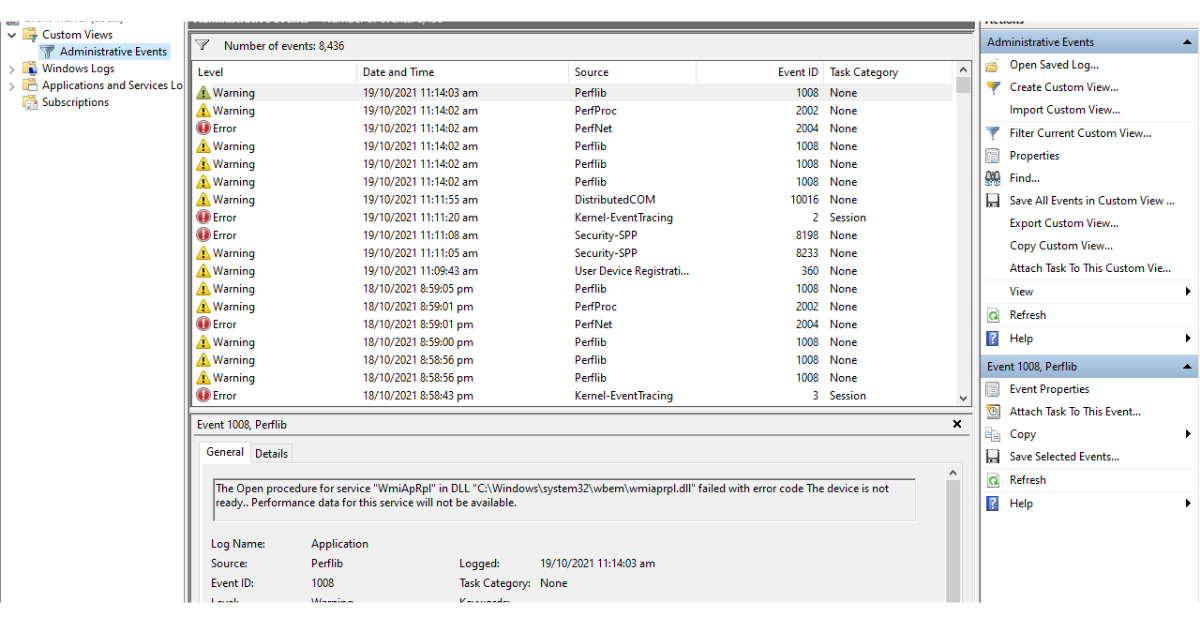
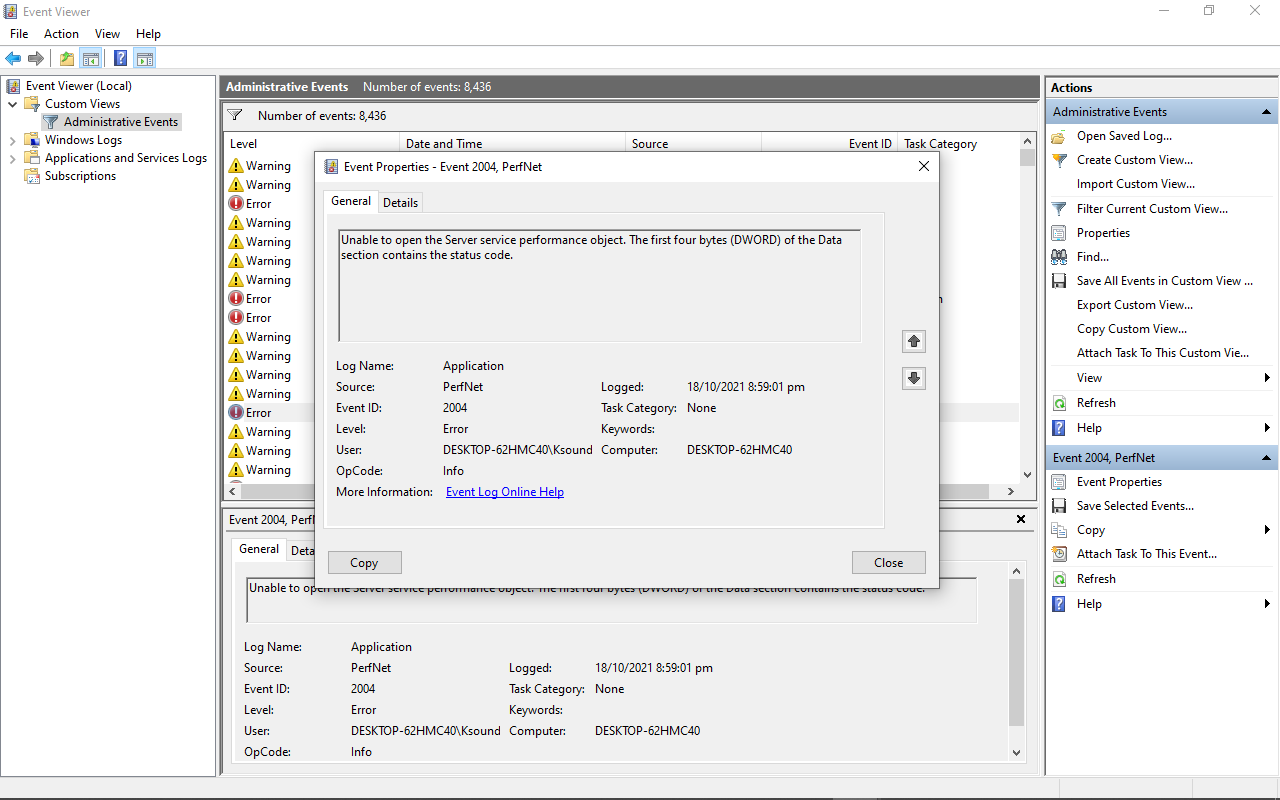
The Administrative Events Log
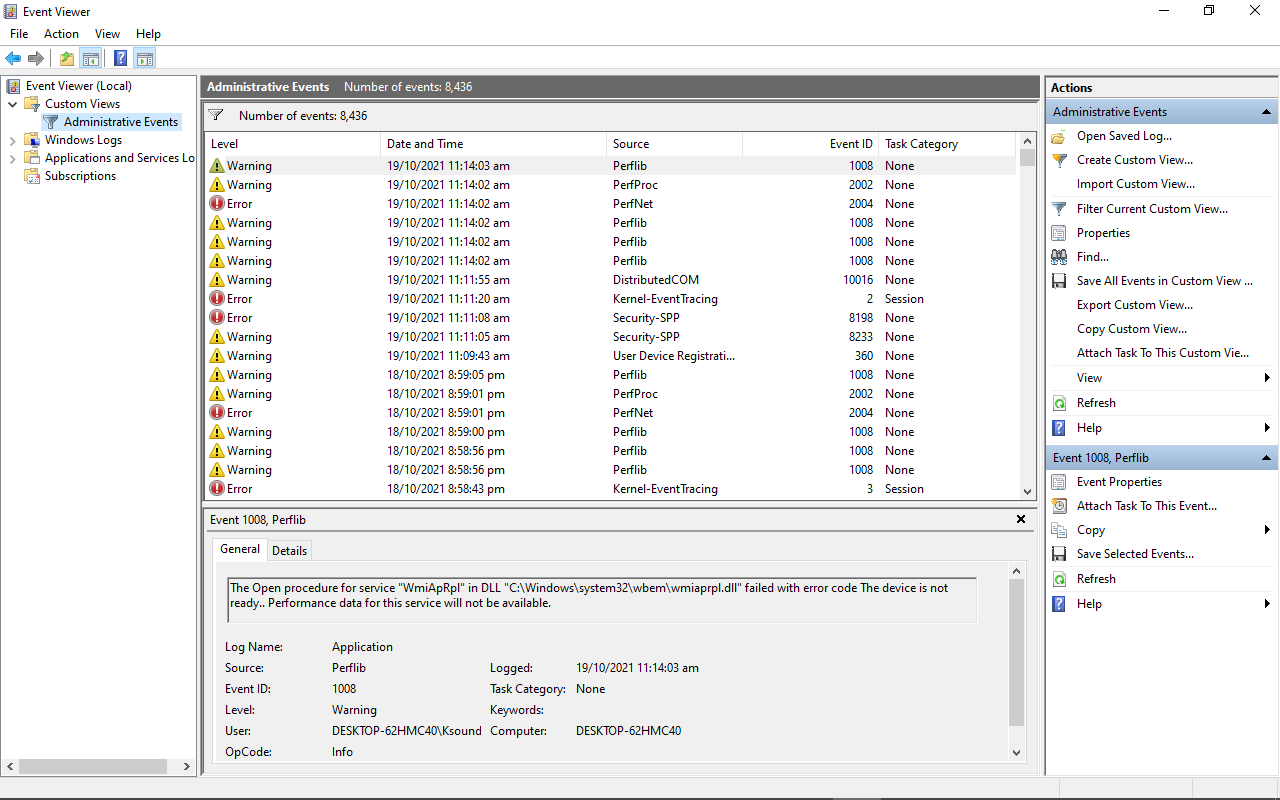
You can expand the Custom Views tab to see your computer’s administrative events, like this:
The Windows Activity Logs
You can also expand the Windows Logs to show various activities such as:
-
Application Events: Information, errors, and warning reports of program activities

-
Security Events: This shows the results of various security actions. They are called audits and each of them can be a success or a failure
-
Setup Event: this has to do with domain controllers, which is a server that verifies users on computer networks. You shouldn’t worry about them day-to-day.
-
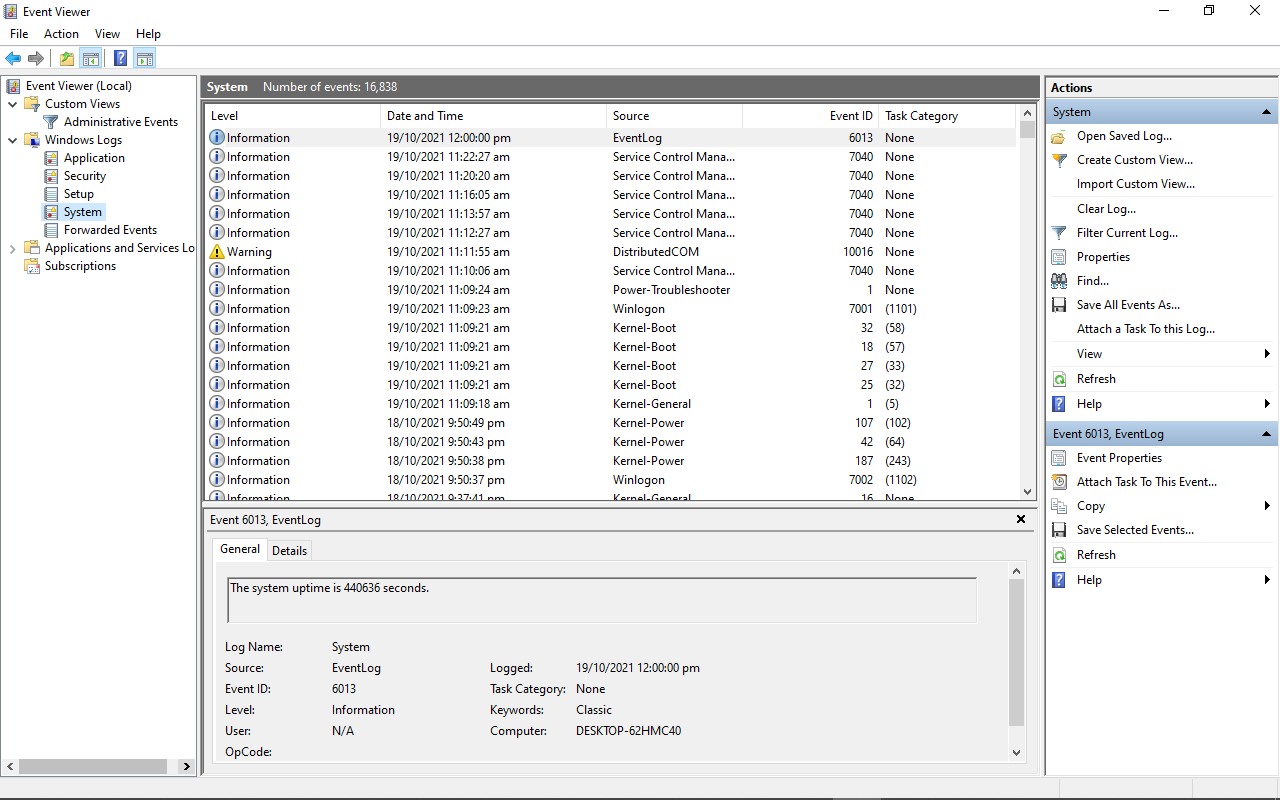
System Events: these are reports from system files detailing the errors they have encountered
-
Forwarded Events: these are sent to your computer from other computers in the same network. They help you keep track of the event logs of other computers in the same newtwork.
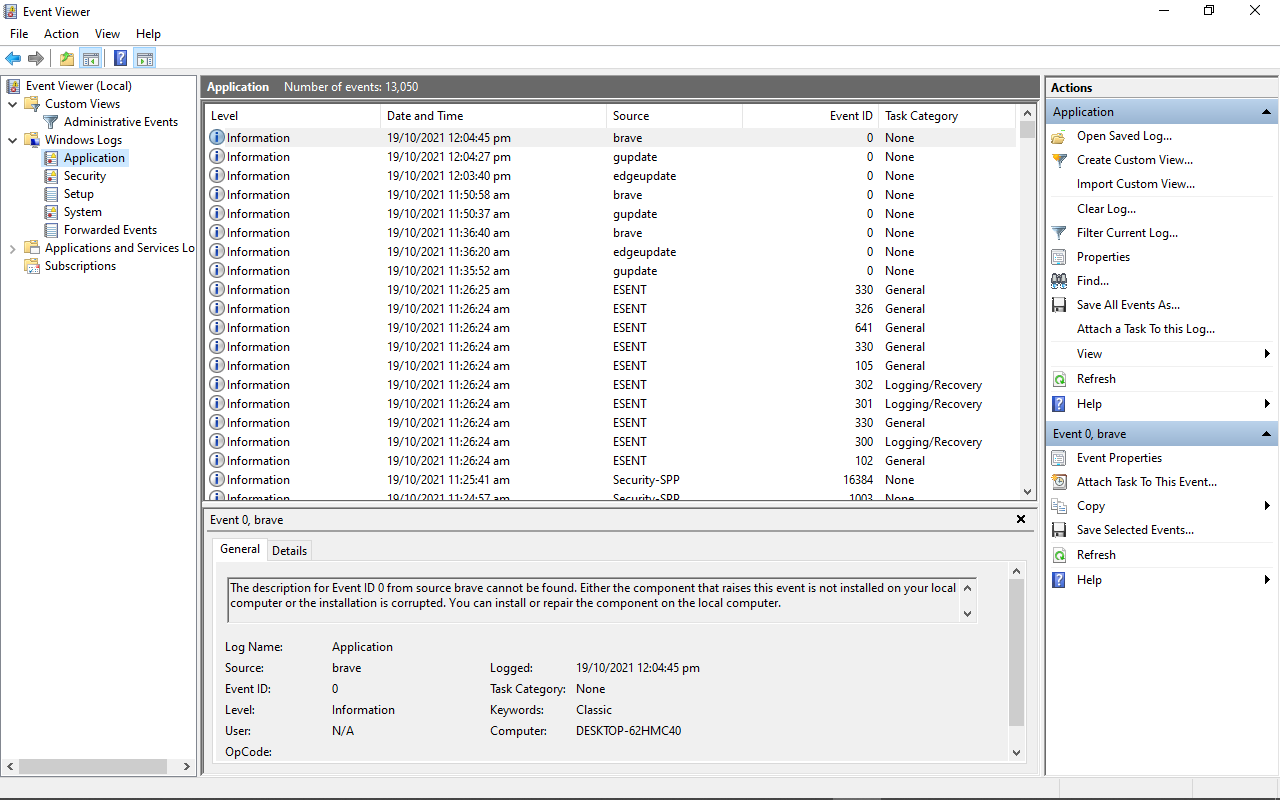


In addition, there are the Application and Service logs, which show hardware and Internet Explorer activities, alongside Microsoft Office apps activities.
You can double click on an error to check its properties, and look up the event ID of the error online. This can help you discover more information on the error so you can fix it if you need to.
Conclusion
In this article, you learned about the Windows 10 Event Viewer, which is a very powerful tool Windows users should know how to use.
Apart from viewing various activity logs, it also helps you be aware of what’s happening on your computer.
Thank you for reading. If you consider this article helpful, please share it with your friends and family.
Learn to code for free. freeCodeCamp’s open source curriculum has helped more than 40,000 people get jobs as developers. Get started
If you’re using a Windows server and want to know what happened to your machine, Windows logs are an essential resource. Windows logs record various system activities, errors, and other significant events, providing valuable information for troubleshooting, auditing, and ensuring system integrity. Understanding how to access, interpret, and utilise these logs enables efficient, problem solving, enables security measures and ensures the smooth operation of your system.
In this guide, you will learn about Windows event logs, its different categories, how to filter and create Custom Views.
What is a Windows Event Log?
A Windows event log is a file that keeps track of system events and errors, application issues, and security events. Windows Event log can also provide insights into an application’s behavior by tracking its interactions with other processes and services. With the right knowledge of the information stored in these logs, you can easily diagnose and easily resolve issues within your system and applications.
You can access the windows events logs as follows:
Using the Start Menu:
- Click on the Start button or press the Windows key.
- Type
Event Viewerin the search box and select it from the search results.
Using the Run Dialog:
- Press
Windows + Rto open the Run dialog. - Type
eventvwrand press Enter.
Using the Control Panel:
- Open the Command Prompt and run as administrator.
- Type
eventvwrand press Enter.
You can see the detailed steps below. Now let’s discuss and understand windows events logs in detail.
Understanding Windows Event Logs categories & Types
There are different Windows logs, each serving a specific purpose in tracking and recording events related to your system, applications, and security. They include:
- System Events: System events log information is about the core operations of your Windows operating system. System events are essential for maintaining your system’s health and functionality because it records events related to the system’s hardware and software components. Some system events are as follows:
- Hardware Failures: Logs any issues related to hardware components, such as disc failures or memory errors.
- Driver Issues: Records events related to the loading, unloading, or malfunctioning of device drivers. This helps in identifying driver-related problems that could affect system stability.
- System Startups and Shutdowns: Tracks the times when the system starts up or shuts down. This can be useful for understanding system uptime and diagnosing issues related to improper shutdowns or startup failures.
- Application Events: Data related to software applications running on the system includes application errors, warnings, and informational messages. If you are using a Windows server to run your production-level application, you can use the application errors, warnings, and messages provided here to solve the issue. There are different types of Application events some are as follows:
- Application Errors: Application errors are events generated by software applications when they encounter issues that prevent them from functioning correctly.
- Warnings: Logs warnings from applications about potential issues that might not be critical but could lead to problems if not addressed.
- Informational Messages: Provides general information about application activities, such as successful operations or status updates, helping to understand the normal functioning of applications.
- Security Events: Security events are logs that capture all security-related activities on your Windows system. They are essential for monitoring, maintaining, and auditing the security of your system. These events help detect unauthorised access attempts, monitor access to sensitive resources, and track changes to system policies. Some security events are as follows:
- Successful and Failed Login Attempts: Successful and failed login attempts are critical events that are logged by a system to monitor access and ensure security. These logs provide valuable insights into user activity, helping to detect unauthorised access attempts and identify potential security threats.
- Resource Access: These events log attempts to access protected resources such as files, folders, or system settings. Monitoring these logs ensures that sensitive data is accessed appropriately and helps identify unauthorised access attempts.
- System Policy Changes: These logs record any changes to system policies, including modifications to user permissions or security settings. This is important for auditing purposes and ensuring compliance with security policies, helping to maintain the integrity and security of the system.
- Setup Events: Setup events are logs that contain detailed information about the installation and setup processes on your Windows system. These logs are valuable for diagnosing and resolving issues that occur during the installation or configuration of software and system components. Some Setup events are as follows:
- Installation Processes: Installation processes refer to the series of steps and operations carried out to install software, updates, or system components on a Windows system. It contains log details about software installation, updates, or system components. This helps in diagnosing issues related to incomplete or failed installations.
- Setup Configurations: Records information about system configurations during the setup process. This can be useful for understanding your system’s initial setup and configuration.
- Forwarded Events: Forwarded events are logs sent from other computers to a centralised logging server. This is particularly useful in larger environments where centralised log management is needed. They include:
- Logs from Remote Systems: Collects event logs from multiple systems, allowing for centralised monitoring and management.
- Centralised Logging Scenarios: Useful for organisations that need to aggregate logs from various systems to a single location for easier analysis and monitoring.
Accessing the Windows Event Viewer
Windows Event Viewer is a Windows application that lets you see your computer’s logs, warnings, and other events. Each application you open generates entries that are recorded in an activity log, which can be viewed from the Event Viewer.
There are several ways to access the Windows Event Viewer. Here are some of them:
-
Using the Start Menu:
- Click on the Start button or press the Windows key.
- Type
Event Viewerin the search box.

Using start menu to open Event viewer — Select Event Viewer from the search results which will popup something like this.
Event Viewer main page 2. Using the Run Dialog: — Press
Windows + Rto open the Run dialog. — Typeeventvwrand press Enter.
Windows Run App to open Event Viewer
Windows Event viewer landing page 3. Using Control Panel: — Open the Command Prompt and run as administrator
Open CMD as Administrator from start menu — Once open, type
eventvwrand press enter, and you will be redirected to Event Viewer page.
CMD terminal

Windows Log Location
Windows event logs are stored in files located in the C:\\Windows\\System32\\winevt\\Logs directory. Each log file corresponds to a specific log category, such as System, Application, or Security. It may differ depending on which version of Windows you are using.
The main event log files are:
- Application.evtx: Logs events from applications and programs.
- Security.evtx: Logs security events like successful or failed logins.
- System.evtx: Logs events related to Windows system components and drivers
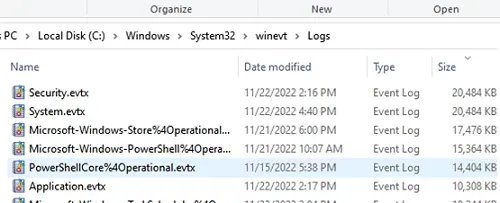
You can find many other log files which could be related to system operations & other processes that are happening inside the Windows System. Windows 11uses the .evtx format rather than using the classic EVT format.
Understanding Event Viewer Entries
Event Viewer entries provide detailed information about each logged event. It is like a log book for your Windows system. They record important happenings within the system, including applications, systems, security, failed events, etc. Understanding these entries is key to effective log management.
The key components of an Event Viewer entry are:
- Date and Time: When the event occurred.
- Source: The application or system component that generated the event.
- Event ID: A unique identifier for the event type.
- Level: The severity of the event (Information, Warning, Error, Critical).
- User: The user account under which the event occurred.
- Computer: The name of the computer where the event was logged.
- Description: Detailed information about the event.
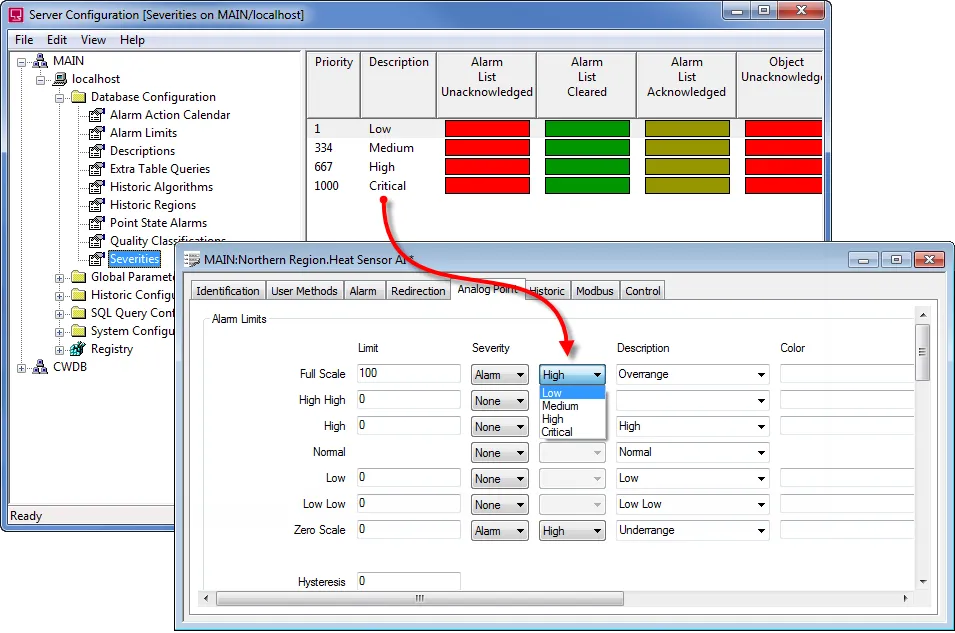
Each event in the Event Viewer has a severity level, indicating the importance and type of the event:
- Information (Green Light): These events resemble a green traffic light, signifying smooth sailing. They indicate successful operations or occurrences within your system.
- Warning (Yellow Light): Treat these entries with caution, like a yellow traffic light. They signal potential issues that warrant attention but might not cause immediate problems.
- Error (Orange Light): Think of error entries as an orange traffic light; proceed with care. They denote significant problems that could affect system functionality. Imagine an error message indicating a driver failure.
- Critical (Red Light): Critical entries are akin to a red traffic light; stop and address the situation immediately. They represent severe errors that have caused a major failure. A critical event might report a complete system shutdown or a critical service crashing.
Filtering and Custom Views
Event Viewer allows you to filter events using a variety of parameters, including date, event level, source, and more. Consider the following scenario: your system exhibits weird behaviour, but the Event Viewer is overflowing with hundreds, if not thousands, of entries. Filtering steps and generating custom views can significantly reduce the workload. You may also construct custom views to focus on specific kinds of events:
- In the Event Viewer, you’ll see Administrative Events, to create special logs right-click on «Custom Views» and select «Create Custom View.»
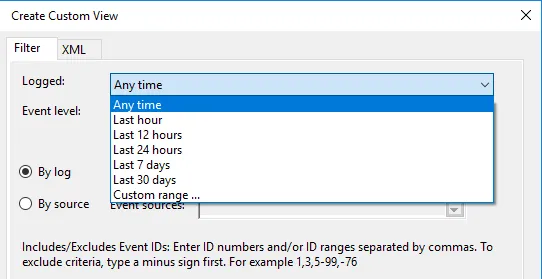
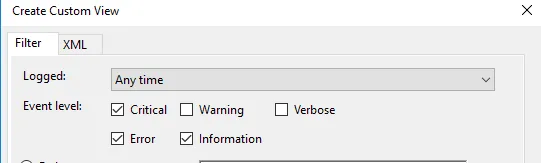
1. In the Custom View page, you can see logged drop down, choose a preferred time or it gives you an option to create a custom time to set. 2. On the Event Level choose an appropriate level for your custom view, You can choose among the 5 levels.
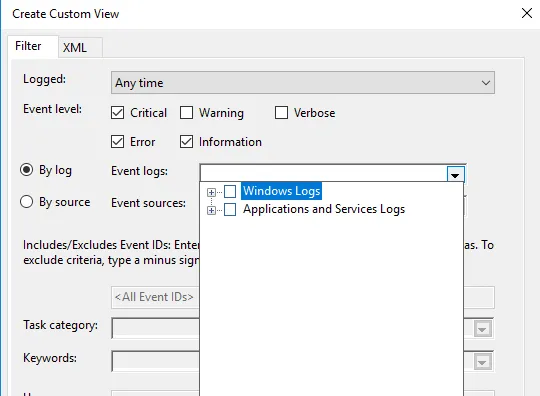
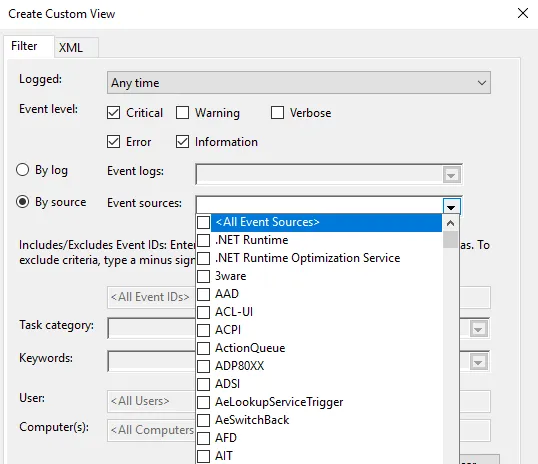
1. Once done, choose how you want the events to be filtered, By log or By source.
Once everything is set up according to your needs, save all events in Custom View as
from the drop-down menu and choose an appropriate location to save the logs. Click on the Save button. (A log file with the extension .evtx will be saved on your device).
Conclusion
This blog provides an understanding how you can use the Windows Event Viewer which is provided by the Windows in default and using it to monitor Windows logs.
- Main event log files are stored in
C:\\Windows\\System32\\winevt\\Logs. - Windows logs are crucial for understanding the activities, errors, and significant events on your machine. They provide valuable information for troubleshooting, auditing, and ensuring system integrity.
- They record a variety of system activities, errors, and other significant events, providing valuable information for troubleshooting, auditing, and ensuring system integrity.
- We learnt how to setup Filtering and Custom Views to optimise what we see and solve the problems and where it happened.
By grasping the significance of different event types such as System, Application, Security, Setup, and Forwarded Events, and knowing how to filter and export logs, you can effectively manage your Windows system.
FAQ’s
How to view Windows logs?
To view Windows logs, use the built-in Event Viewer:
- Press
Win + R, typeeventvwr, and press Enter. - Navigate through the console tree to find the log you want to view (e.g., Windows Logs > Application).
Where are Microsoft logs?
Microsoft logs, including Windows logs, can be found in the Event Viewer under sections like Application, Security, and System. Log files are also located in the C:\Windows\System32\winevt\Logs directory.
How do I audit Windows logs?
To audit Windows logs:
- Open Event Viewer.
- Navigate to Security logs under Windows Logs.
- Configure auditing policies via the Local Security Policy or Group Policy Management Console.
How do I check my Windows activity log
Check your Windows activity log by viewing the Security logs in Event Viewer. These logs record user logins, logoffs, and other security-related activities.
Which is Windows log key?
The Windows log key, often referred to as the Windows key, is the key on your keyboard with the Windows logo. It is used in various shortcuts to open system tools, including Event Viewer (Win + X > Event Viewer).
Where is the logs folder?
The logs folder is located at C:\Windows\System32\winevt\Logs. This folder contains all the event log files in .evtx format.
Why are Windows logs important?
Windows logs are important because they provide detailed information about system operations, security events, and application behavior, which is crucial for troubleshooting, auditing, and ensuring system integrity.
How to view log files?
View log files using Event Viewer:
- Open Event Viewer (
Win + R, typeeventvwr, press Enter). - Expand the Windows Logs section and select the log you want to view.
Where are login logs?
Login logs are located in the Security logs section of Event Viewer. They record all login attempts, both successful and failed.
What are system logs?
System logs contain information about the core operations of the Windows operating system, including hardware events, driver issues, and system startups and shutdowns. They are found under the System section in Event Viewer.
How do I find Windows log files?
Find Windows log files in the Event Viewer or directly in the C:\Windows\System32\winevt\Logs directory.
How do I view user logs in Windows 10?
View user logs in Windows 10 through the Event Viewer:
- Open Event Viewer.
- Go to Windows Logs > Security to see logs related to user activities, including logins and logoffs.
How do I view Windows setup logs?
To view Windows setup logs:
- Open Event Viewer.
- Navigate to Applications and Services Logs > Microsoft > Windows > Setup.
How do I view Windows app logs?
To view Windows application logs:
- Open Event Viewer.
- Navigate to Windows Logs > Application to see logs related to software applications running on your system.
Was this page helpful?
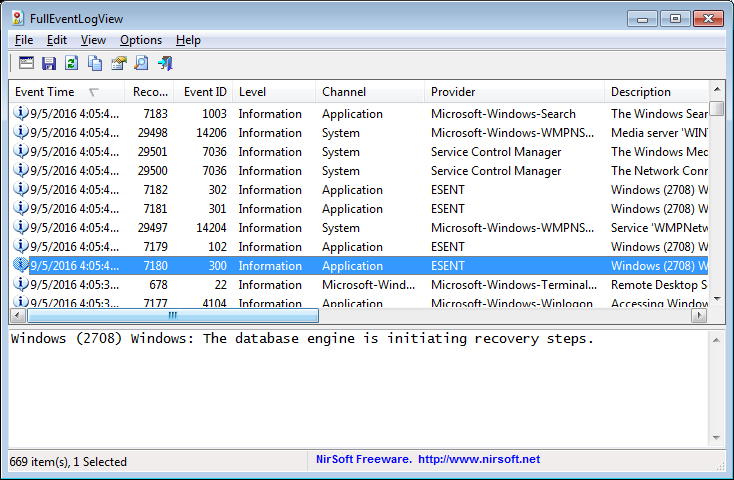
| FullEventLogView v1.80 — Event Log Viewer for Windows 11 / 10 / 8 / 7 / Vista Copyright (c) 2016 — 2023 Nir Sofer |
See Also
- NK2Edit — Edit, merge and fix the AutoComplete files (.NK2) of Microsoft Outlook.
- EventLogChannelsView — enable/disable/clear event log channels.
- UninstallView — Alternative uninstaller for Windows 10/8/7/Vista
Description
FullEventLogView is a simple tool for Windows 11/10/8/7/Vista that displays in a table the details of all events from the event logs of Windows, including the event description.
It allows you to view the events of your local computer, events of a remote computer on your network, and events stored in .evtx files.
It also allows you to export the events list to text/csv/tab-delimited/html/xml file from the GUI and from command-line.
System Requirements
This utility works on any version of Windows, starting from Windows Vista and up to Windows 11. Both 32-bit and 64-bit systems are supported.
For Windows XP and older systems, you can use the MyEventViewer tool.
FullEventLogView vs MyEventViewer
MyEventViewer is a very old tool originally developed for Windows XP/2000/2003.
Starting from Windows Vista, Microsoft created a new event log system with completely new programming interfaces. The old
programming interface still works even on Windows 10, but it cannot access the new event logs added on Windows Vista and newer systems.
MyEventViewer uses the old programming interface, so it cannot display many event logs added on Windows 11/10/8/7/Vista.
FullEventLogView uses the new programming interface, so it displays all events.
Versions History
- Version 1.80:
- Added ‘Black Background’ option (Under the View menu). When it’s turned on, the main table and the lower pane text-box are displayed in black background and white text, instead of default system colors.
- Fixed issue: When copying data to the clipboard or exporting to tab-delimited file, every line contained an empty field in the end of the line.
- Version 1.78:
- Added ‘Full Screen’ mode (View -> Full Screen or F11 key).
- Version 1.77:
- Added ‘Sort By’ toolbar button.
- Version 1.76:
- Fixed issue: The ‘Record ID’ value was limited to the size of 32-bit integer.
- Version 1.75:
- Fixed the filter to work properly when new event items are added in ‘Auto Refresh’ mode.
- Version 1.74:
- Updated to stop the event log scanner when you press the Esc key.
- Version 1.73:
- The status bar now displays the current scanned event log channel/filename.
- Version 1.72:
- Fixed to work properly when specifying to filter more than 23 event IDs (Workaround for limitation of event log queries).
- Version 1.71:
- Fixed to display the time properly in AM/PM format.
- Fixed the default columns size in high DPI mode.
- Version 1.70:
- Added option to choose a single event log filename (.evtx or .etl file) in the ‘Choose Data Source’ window.
- You can also load a single event log file (.evtx or .etl file) by dragging it from Explorer window into the main window of FullEventLogView.
- Version 1.68:
- Added ‘Add Header Line To CSV/Tab-Delimited File’ option (Turned on by default).
- Version 1.67:
- Fixed the /srawxml command-line option to save the raw xml much faster than the previous versions.
- Version 1.66:
- ‘Show Event Strings In Columns’ option — You can now change the number of event string columns displayed when this option is turned on.
You can do it by editing the following line in FullEventLogView.cfg (The default value is 10):
EventStringColumns=10 - You have to edit this value while FullEventLogView is not running.
- ‘Show Event Strings In Columns’ option — You can now change the number of event string columns displayed when this option is turned on.
- Version 1.65:
- Added option to save the selected events as raw event XML (In ‘Save Selected Items’ option), which is the same XML you see in the lower pane when choosing Options -> Lower Pane Display Mode -> Show Event XML.
- Added /srawxml command-line option to save the raw event XML from command-line.
- Updated the HTML export feature to HTML5.
- Added option to change the sorting column from the menu (View -> Sort By). Like the column header click sorting, if you click again the same sorting menu item, it’ll switch between ascending and descending order. Also, if you hold down the shift key while choosing the sort menu item, you’ll get a secondary sorting.
- Version 1.62:
- Added option to specify user name and password for connecting a remote computer (In the ‘Choose Data Source’ window). You have to use this option if you get ‘Access is denied’ error message when trying to connect the remote computer.
- Version 1.61:
- Fixed some high DPI mode issues.
- Version 1.60:
- Added ‘Tray Balloon On New Event’ option. This feature is active only when both ‘Put Icon On Tray’ and ‘Auto Refresh’ options are turned on.
When it’s active, FullEventLogView displays every new event in a tray balloon. - Added ‘Start As Hidden’ option. When this option and ‘Put Icon On Tray’ option are turned on, the main window of FullEventLogView will be invisible on start.
- Added ‘Tray Balloon On New Event’ option. This feature is active only when both ‘Put Icon On Tray’ and ‘Auto Refresh’ options are turned on.
- Version 1.58:
- Added ‘New FullEventLogView Instance’ under the File menu, for opening a new window of FullEventLogView.
- Version 1.57:
- Added ‘Log File’ column, which displays the log filename if the event was loaded directly from .evtx or .etl file.
- Version 1.56:
- In the the channel and provider fields of the ‘Advanced Options’ window — you can now choose the desired channel/provider from a combo-box.
- Version 1.55:
- When reading .etl files that store the event data inside EventPayload element of the XML, FullEventLogView now automatically converts the EventPayload
from hexadecimal string to readable text, and displays it as the decsription of the event.
For example, you can use this feature to view the Windows Update logs from C:\windows\logs\WindowsUpdate on Windows 10. - Added ‘Copy Clicked Cell’ option to the right-click context menu, which copies to the clipboard the text of cell that you right-clicked with the mouse.
- When reading .etl files that store the event data inside EventPayload element of the XML, FullEventLogView now automatically converts the EventPayload
- Version 1.53:
- Fixed bug: Wildcards didn’t work when using the ‘Search in full description string’ option.
- Fixed to save the ‘Case Sensitive’ option of the Quick Filter in the .cfg file.
- Version 1.52:
- Added ‘Select All’ and ‘Deselect All’ to the ‘Column Settings’ window.
- Version 1.51:
- Added the ‘Clear All Events Of Selected Channel’ option to the context menu.
- Increase the maximum size of the description filter string.
- Version 1.50:
- Fixed bug: FullEventLogView remained in memory if you closed the main window during events scanning.
- Added ‘Clear All Events Of Selected Channel’ option (Under the file menu). For example: If you select an event that its channel is
‘System’, using this option will delete all system events. - Added /ClearChannelEvents command-line option, which clears all events of the specified channel, for example:
FullEventLogView.exe /RunAsAdmin /ClearChannelEvents «Microsoft-Windows-Bits-Client/Operational» - Added 2 modes to description filter: ‘Search in description parameters’ and ‘Search in full description string’. In previous versions, the search was made inside description parameters,
but some people reported it’s a bug. The search is now made by default inside the full description string, but this search mode is slower because it requires to load the metadata and format the
description string before the filtering process.
- Version 1.38:
- Fixed bug: When trying to export events of remote computer from command-line, FullEventLogView loaded the events from local computer.
- Version 1.37:
- Added ‘Case Sensitive’ option to the Quick Filter window.
- Version 1.36:
- Added /RunAsAdmin command-line option for running FullEventLogView as administrator.
- Version 1.35:
- Added new options to the ‘Quick Filter’ feature, including the option to filter the list by Event ID.
- Version 1.32:
- When choosing to load only specific event IDs (From ‘Advanced Options’ window), the loading process is much faster.
- Version 1.31:
- Fixed bug: When connecting a remote computer the following error was displayed — Error 50: The request is not supported.
- Version 1.30:
- Fixed bug: FullEventLogView failed to display the event strings in the lower pane (‘Show Event Data + Description’ mode) and in the columns (‘Show Event Strings In Columns’ option).
- You can now resize the properties window, and the last size/position of this window is saved in the .cfg file.
- You can now send the data to stdout by specifying empty string as filename, for example:
FullEventLogView.exe /scomma «» | more
- Version 1.28:
- Fixed the lower pane to use the right font size in high DPI mode.
- Added option to choose another font (name and size) to display in the main window.
- Version 1.27:
- When exporting items with multiline description to tab-delimited file (Including the ‘Copy Selected Items’ option), FullEventLogView now put the description in quotes to
ensure the exported data will be displayed properly in Excel and other programs.
- When exporting items with multiline description to tab-delimited file (Including the ‘Copy Selected Items’ option), FullEventLogView now put the description in quotes to
- Version 1.26:
- Added support for saving as JSON file.
- Version 1.25:
- Added ‘Show Event Strings In Columns’ option (Under the Options menu). When it’s turned on, 10 new event string columns are added to the main table (‘String 1’, ‘String 2’, ‘String 3’…).
These columns display the strings from the event decsription and you can click the column header in order to sort the events according to the event strings.
- Added ‘Show Event Strings In Columns’ option (Under the Options menu). When it’s turned on, 10 new event string columns are added to the main table (‘String 1’, ‘String 2’, ‘String 3’…).
- Version 1.22:
- Fixed bug: On some systems, FullEventLogView missed some of the events when using a time filter.
- Version 1.21:
- Added /cfg command-line option, which instructs FullEventLogView to use a config file in another location instead if the default config file, for example:
FullEventLogView.exe /cfg «%AppData%\FullEventLogView.cfg»
- Added /cfg command-line option, which instructs FullEventLogView to use a config file in another location instead if the default config file, for example:
- Version 1.20:
- Added option to filter according to strings of the event description (In ‘Advanced Options’ window).
- Added ‘Quick Filter’ feature (View -> Use Quick Filter or Ctrl+Q). When it’s turned on, you can type a string in the text-box added under the toolbar and FullEventLogView will instantly filter the events table, showing only lines that contain the string you typed.
- Fixed the lower pane to switch focus when pressing tab key.
- Version 1.12:
- Added option to specify time range in GMT (‘Advanced Options’ window).
- Fix bug: When using /SaveDirect command-line option, the file was always saved according to the default encoding, instead of using the selected encoding in Options -> Save File Encoding.
- Version 1.11:
- Fixed bug: the process of exporting large amount of event log items from command-line was very slow, even when using /SaveDirect.
- Version 1.10:
- Added option to automatically read archive log files (In ‘Choose Data Source’ window). This option works only when you run FullEventLogView as administrator.
- Version 1.06:
- Fixed FullEventLogView to display event description properly when reading .evtx files from shadow copy (e.g: \\?\GLOBALROOT\Device\HarddiskVolumeShadowCopy3\Windows\System32\winevt\Logs )
- Fixed bug: FullEventLogView displayed error message when trying to read .etl files.
- Version 1.05:
- FullEventLogView now displays an error message if it fails to load events from external evtx file or from remote computer.
- Added ‘Choose Data Source’ icon to the toolbar.
- Version 1.00 — First release.
Start Using FullEventLogView
FullEventLogView doesn’t require any installation process or additional DLL files.
In order to start using it, simply run the executable file — FullEventLogView.exe
After running FullEventLogView, the main window loads and displays all events from the last 7 days.
You can change the default 7-days time filter and set other filters by using the ‘Advanced Options’ window (F9)
If you want to load the events from remote computer on your network or from event log files (.evtx), you should use the ‘Choose Data Source’ window (F7).
Lower Pane Display Mode
When you select an event in the upper pane, the lower pane displays the details of the selected event, depending on the display mode that you choose (Options -> Lower Pane Display Mode):
- Show Event Description:
Displays the full description of the event. Some event descriptions are too long for watching them in the ‘Description’ column, so you can view the long event description in the lower pane. - Show Event Data + Description:
Displays the full description of the event and additional data stored in this event. - Show Event XML:
Displays the full XML of the event.
Refresh (F5) And Smooth Refresh (F8)
FullEventLogView provides 2 types of refresh actions:
- Refresh (F5): Reloads the entire event log
- Smooth Refresh (F8): FullEventLogView only adds the new event items that have been created since the previous refresh.
Auto Refresh Mode
When Auto Refresh mode is turned on (Options -> Auto Refresh -> Every x seconds), FullEventLogView
automatically executes a smooth refresh according to the refresh interval you choose, so you’ll be able to see when a new event log item is created.
Show Event Strings In Columns
You can turn on the ‘Show Event Strings In Columns’ option if you want to view all event strings in the upper pane table.
By default, FullEventLogView displays 10 event string columns (String 1, String 2, String 3,…).
If you need more than 10 event string columns, You can do it by editing the following line in FullEventLogView.cfg:
EventStringColumns=10
You have to edit this value while FullEventLogView is not running.
Run As Administrator
By default, FullEventLogView doesn’t request elevation (Run As Administrator). If you want to watch events thar are only available with administrator privilege (like the security log),
you have to run FullEventLogView as administrator by press Ctrl+F11.
Command-Line Options
|
/ChannelFilter [1 — 3] /EventIDFilter [1 — 3] /ProviderFilter [1 — 3] /ChannelFilterStr [Filter String] /EventIDFilterStr [Filter String] /ProviderFilterStr [Filter String] . . . |
You can use any variable inside the .cfg file in order to set the configuration from command line, here’s some examples:
In order to show only events with Event ID 8000 and 8001:
In order show only events from Microsoft-Windows-Dhcp-Client/Admin channel:
In order to read events from .evtx files stored in c:\temp\logs :
In order to read events from remote computer:
In order to export events from remote computer into .csv file:
You can find more command-line examples in the following Web pages: |
| /ClearChannelEvents <Channel Name> |
Clear all events of the specified channel, for example: FullEventLogView.exe /RunAsAdmin /ClearChannelEvents «Microsoft-Windows-WLAN-AutoConfig/Operational» |
| /cfg <Filename> |
Start FullEventLogView with the specified configuration file. For example: FullEventLogView.exe /cfg «c:\config\felv.cfg» FullEventLogView.exe /cfg «%AppData%\FullEventLogView.cfg» |
| /RunAsAdmin | Run FullEventLogView as administrator. |
| /stext <Filename> | Save the event log items into a simple text file. |
| /stab <Filename> | Save the event log items into a tab-delimited text file. |
| /scomma <Filename> | Save the event log items into a comma-delimited text file (csv). |
| /stabular <Filename> | Save the event log items into a tabular text file. |
| /shtml <Filename> | Save the event log items into HTML file (Horizontal). |
| /sverhtml <Filename> | Save the event log items into HTML file (Vertical). |
| /sxml <Filename> | Save the event log items into XML file. |
| /sjson <Filename> | Save the event log items into JSON file. |
| /srawxml <Filename> | Save the event log items into raw event XML file. |
| /SaveDirect |
Save the event log items in SaveDirect mode. For using with the other save command-line options ( /scomma, /stab, /sxml, and so on…) When you use the SaveDirect mode, the event log items are saved directly to the disk, without loading them into the memory first. Be aware that the sorting feature is not supported in SaveDirect mode. |
| /sort <column> |
This command-line option can be used with other save options for sorting by the desired column. The <column> parameter can specify the column index (0 for the first column, 1 for the second column, and so on) or the name of the column, like «Record ID» and «Event ID». You can specify the ‘~’ prefix character (e.g: «~Channel») if you want to sort in descending order. You can put multiple /sort in the command-line if you want to sort by multiple columns. |
Translating FullEventLogView to other languages
In order to translate FullEventLogView to other language, follow the instructions below:
- Run FullEventLogView with /savelangfile parameter:
FullEventLogView.exe /savelangfile
A file named FullEventLogView_lng.ini will be created in the folder of FullEventLogView utility. - Open the created language file in Notepad or in any other text editor.
- Translate all string entries to the desired language.
Optionally, you can also add your name and/or a link to your Web site.
(TranslatorName and TranslatorURL values) If you add this information, it’ll be
used in the ‘About’ window. - After you finish the translation, Run FullEventLogView, and all translated
strings will be loaded from the language file.
If you want to run FullEventLogView without the translation, simply rename the language file, or move
it to another folder.
License
This utility is released as freeware.
You are allowed to freely distribute this utility via floppy disk, CD-ROM,
Internet, or in any other way, as long as you don’t charge anything for this and you don’t
sell it or distribute it as a part of commercial product.
If you distribute this utility, you must include all files in
the distribution package, without any modification !
Disclaimer
The software is provided «AS IS» without any warranty, either expressed or implied,
including, but not limited to, the implied warranties of merchantability and fitness
for a particular purpose. The author will not be liable for any special, incidental,
consequential or indirect damages due to loss of data or any other reason.
Feedback
If you have any problem, suggestion, comment, or you found a bug in my utility,
you can send a message to nirsofer@yahoo.com
FullEventLogView is also available in other languages. In order to change the language of
FullEventLogView, download the appropriate language zip file, extract the ‘fulleventlogview_lng.ini’,
and put it in the same folder that you Installed FullEventLogView utility.
| Language | Translated By | Date | Version |
|---|---|---|---|
| Brazilian Portuguese | igorruckert | 25/09/2016 | 1.00 |
| Brazilian Portuguese | Paulo Guzmán | 03/11/2022 | 1.74 |
| Bulgarian | Nikolay Nikolov | 29/09/2017 | 1.22 |
| Dutch | Jan Verheijen | 26/09/2023 | 1.80 |
| French | Largo | 24/09/2023 | 1.80 |
| German | «Latino» | 21/04/2025 | 1.80 |
| Greek | geogeo.gr | 10/12/2017 | 1.25 |
| Hindi | Manish | 10/04/2019 | 1.32 |
| Hungarian | Timinoun | 03/08/2024 | 1.80 |
| Italian | Styb | 30/05/2023 | 1.78 |
| Japanese | youzeeen | 03/04/2021 | 1.61 |
| Persian | ZendegiyeSabz | 28/09/2023 | 1.80 |
| Polish | Hightower | 25/09/2023 | 1.80 |
| Russian | Dmitry Yerokhin | 24/09/2023 | 1.80 |
| Simplified Chinese | DickMoore | 04/06/2023 | 1.78 |
| Simplified Chinese | Qiang | 01/02/2021 | 1.60 |
| Slovak | František Fico | 02/10/2023 | 1.80 |
| Spanish | Fernando Lastra | 14/06/2023 | 1.78 |
| Swedish | I.K.l | 06/07/2017 | 1.22 |
| Traditional Chinese | Danfong Hsieh | 24/09/2023 | 1.80 |
| Turkish | HARUN ARI | 22/09/2023 | 1.80 |
Logs are constantly recording what is going on on your computer. They can
provide help in tracking what happens with your machine or with troubleshooting.
Logs are kept about both actions by a person or by a running process.
In Windows, logs that are saved contain information about applications and the
operating system itself. Moreover, these logs are structured and human-readable.
For viewing the logs, Windows uses its Windows Event Viewer. This
application displays the event logs and allows the user to search, filter,
export, and analyze background info. In this article, you will learn how to use
the features provided with this program. In addition, this article will also
explore the Event Viewer’s interface and features. Finally, you will also learn
about other application that has their own event viewer built-in, and we will
talk about creating your own repeating tasks.
Prerequisites
- Windows 10 installed
- Administration privileges
Step 1 — Accessing Event Viewer
Event viewer is a standard component and can be accessed in several ways. The
easiest way is to type event viewer to the start menu. If you prefer using
command prompt, you can access it by running the eventvwr command.
Event viewer is also accessible through the control panels. Open the control
panels and list them all by viewing them like small or large icons. After that,
select the Administrative Tools and find Event Viewer in the folder.
The application is user-friendly and provides an intuitive interface. The main
screen is divided into three column sections:
- Navigation page
- Detail page
- Action page
You can also create your own section. We will explain how to do that later in
the tutorial.
Step 2 — Understanding Navigation Page
The navigation page, which is by default positioned on the very left, provides
you with an option to choose the event log to view. Five categories can be found
under Windows logs:
- System — Logs created by the operating system
- Application— Logged by an application hosted locally
- Setup — Logs created in the process of installing or changing the Windows
installation - Security — Logs related to logins, privileges, and other similar events
- Forwarded Events — Events forwarded by other computers
There is also a category for Applications and Services Logs, which contains
logs of the individual applications and Hardware Events. Logs from PowerShell
and other command lines will also be stored there.
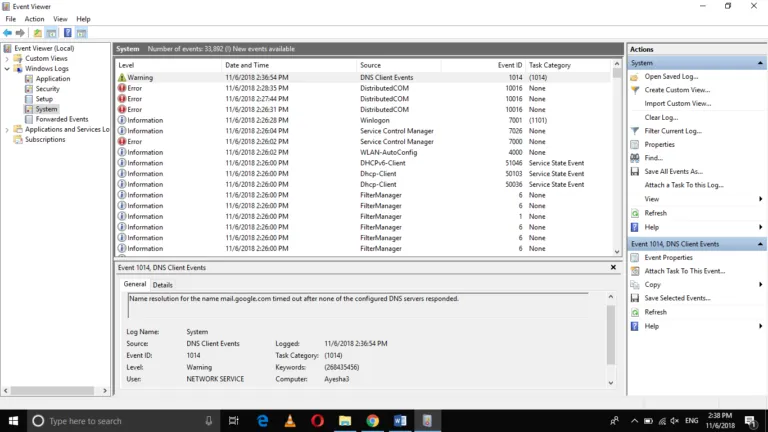
Step 3 — Viewing Log Details On Detail Page
When in the default tab, this page displays the Overview and Summary. Select
some item from the previously mentioned navigation page to see more details.
There are several log levels:
- Information — Successful action
- Warning — Occurring of an event that might bring problems
- Error — Occurring of a significant problem
- Critical — Severe problem occurred
You can also see Audit successes and failures, which are associated with
security events.
Events are listed chronologically, starting with the latest event on the very
top. You can furthermore click on the columns to edit the order and groupings.
You can click on the event to view more detailed information:
You can learn more about an event by double-clicking it:
Here you can see the name of the log, source, and other information about the
log.
The following popup window also has two tabs, General and Details. The
first tab shows more information about the error as described above. The second
tab shows the raw event data. You can switch between Friendly View and XML
View.
Step 4 — Using Actions Page
The last page located by default on the right side is the Actions page,
which provides you quick access to the features available to you at the moment.
This page is divided into two parts, the first containing actions available for
the selected Navigation page. The second contains actions available to the
selected event itself.
Various options are available:
Filtering Current Log
Allows you to set criteria for events to be displayed on the Details page.
Clearing Log Events
You can choose this option if the list becomes too large. This will delete all
events stored in the current log. You can check the total number of events by
going to the top directory in the navigation page:
Exporting Log Events
You can click on the Save All Events Asor Save All Events in Custom View As
to export all of the selected events into the special event file with the
.EVTX extension.
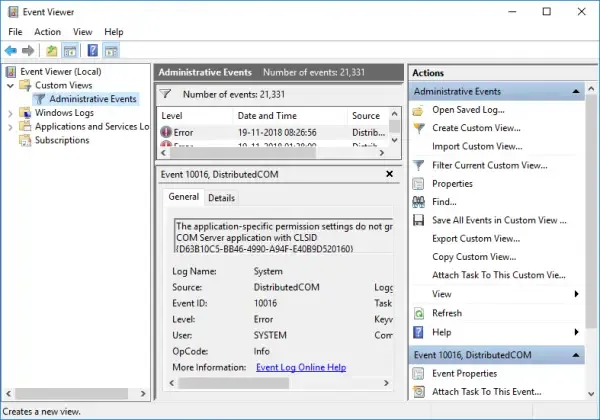
Step 5 — Creating Custom Views
Event Viewer gives you the option to create a custom view. To do so, select the
Custom Views folder on the Navigation page and click Create Custom View
on the Actions page. You can, for example, create a custom view for all Windows
Azure events with log level error that occurred in the last 12 hours:
After saving, your new view will now show in the Navigation tab.
You can also export your Custom View. Select it in the Navigation Page and find
an option called Export Custom View on the Actions Page. Enter the name for
the new .XML file you are about to create, and it is done.
You can import the custom view to any other Event Viewer by selecting the option
Import Custom View.
Navigating Summary View
The summary view is the first thing you will come in contact with when opening
the Event Viewer. It is at the top of the Navigation panel.
It includes:
- Overview
- Summary of Administrative Events — displays data and totals related to the
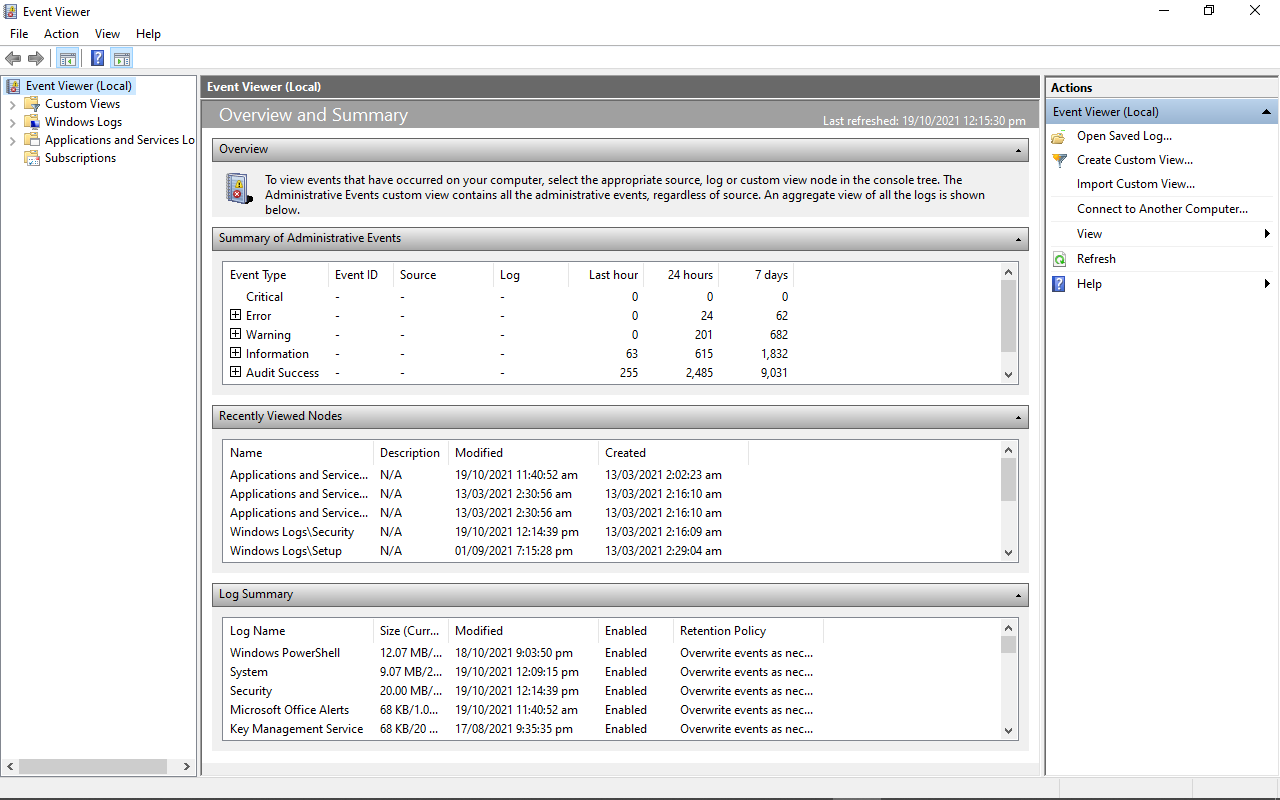
Event Viewer for the past week. - Recently Viewed Nodes — history of the viewed nodes filtered
chronologically while the most recent is at the top. You can double-click on
the node to open the location. - Log Summary — this section displays all of the major properties in each
log file. Double-click to get more details like the events for the viewed log.
Step 6 — Finding Other Application Logs
There are other logs with their event logging:
- DNS Manager
- IIS Access
- Task Scheduler History
- Failover Cluster Manager
- Windows Component Service
DNS Manager
If you run Windows Server that is provisioned as a DNS server, the DNS manager
is available. This manager has its list of events. From there, the DNS manager’s
event viewer works in a similar fashion as the one packed with Windows.
IIS Access
The Internet Information Services logs include info about requested URIs and
statuses. These logs are written in the location specified in the IIS Manager.
By default, the location is:
%SystemDrive%\\inetpub\\logs\\LogFiles
Task Scheduler Library
Task scheduler schedules many sorts of background tasks and applications. The
Task Scheduler Library is associated with it, and you can view it directly from
the application:
From the summary view, you can see the overview, task status, and active tasks.
In the task status, you can view all tasks started in some period.
Double-clicking on the task will give you more information.
In the section underneath, you can see all the active tasks that are currently
enabled and have not expired. Then, by double-clicking on the summary info about
the task, which includes the task name, next run time, triggers, and location,
you can again view more information.
Using this feature, you can display details about every single task and modify
it accordingly. The action page also slightly changes, and a new section for the
selected item is viewed. You can run, end, disable, delete or export information
about the task at your will.
From the action panel, you can also create your own task by selecting the option
Create Basic Task... or adding an existing one with Import Task... After
clicking the first opinion, you are presented with a task creator wizard to add
name, description, triggers, action, and finish statement to your custom task.
Failover Cluster Manager
This is a practical built-in application when running your Windows Server. This
service allows servers to work as a cluster. When one server’s hardware fails,
it is automatically detected and replaced by the other server. All network is
then re-routed to the working instance.
This application also has its local Event Viewer. Using this event viewer, you
can discover more in the events of your clusters failing or not working as
expected.
Windows Component Service
Another application is Windows Component Service Manager. It enables us to
configure DCOM applications on Windows. You can view its logs by clicking on the
local Event Viewer:
Conclusion
Windows and applications installed or associated with the operating system keep
records of various events. Understanding and finding these events can help you
if you are a system administrator, running your Windows server, or even just a
regular user.
Now you should know how to explore and use different methods to use these logs
to your advantage. In addition, you now know how to use the task scheduler and
create your own repeating tasks using it.
Jenda leads Growth at Better Stack. For the past 5 years, Jenda has been writing about exciting learnings from working with hundreds of developers across the world. When he’s not spreading the word about the amazing software built at Better Stack, he enjoys traveling, hiking, reading, and playing tennis.
Got an article suggestion?
Let us know
This work is licensed under a Creative Commons Attribution-NonCommercial-ShareAlike 4.0 International License.
If you want to use Event Viewer in Windows 11 to diagnose a crash or troubleshoot problems effectively, this detailed guide will help you understand every part of the Event Viewer so that you can get started with this in-built utility on your Windows 11/10 computer.
How to open Windows Event Viewer?

Although there are several ways to open the Event Viewer in Windows 11, you can use the Taskbar search box, Start Menu, or Run prompt to open it on your computer. Follow these steps to open the Event Viewer using the Taskbar search box:
- Click on the Taskbar search box and search for “event viewer”.
- Click on the individual search result.
Follow these steps to open the Event Viewer using the Run prompt:
- Press Win+R to open the Run prompt.
- Type eventvwr and hit the Enter button.
We will now take a look at the various features of Windows Event Viewer and how to use them.
Event Viewer sections and definitions
There are four different sections of Event Viewer and they are:
- Custom Views
- Windows Logs
- Applications and Services Logs
- Subscriptions
Custom Views: The Custom Views panel allows you to create custom views with different filters. For example, if you want to see only the error logs, you can create a custom view in this section.
Windows Logs: This is one of the most important sections that you should understand if you want to troubleshoot various problems with Event Viewer.
You can find five sub-sections: Application, Security, Setup, System, and Forwarded Events. You need to learn more about the Application and System sections of these five. The System section is intended for logs related to the core system. Windows Update, restart, shutdown, etc.: you can find almost everything. On the other hand, the Application panel displays information about your apps.
Applications and Services Logs: This section houses many options, such as Hardware Events, Key Management Service, OpenSSH, and Windows PowerShell. It is the best place to get information about these utilities.
Subscriptions: Let’s assume you want to see information about a specific type of errors in a specific application. You can create a subscription according to your requirements.
Read: How to create Custom Views in Event Viewer
Event Viewer levels and definitions
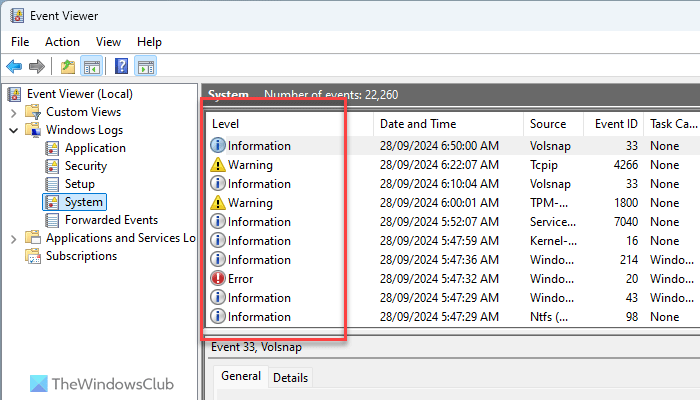
There are four main levels that Event Viewer displays at various times: Critical Error, Error, Warning, and Information. Apart from that, you can find another level called Verbose. These levels indicate the kind of data. For example, if there is a Windows Update-related error, you can find the log as Error. On the other hand, if you have restarted your computer, you can find it as Information.
The levels can be found when you open different sub-sections. For example, if you open Windows Logs > System, the levels are on the right-hand side.
Read: How to enable Print Logging in Event Viewer
Add or remove columns of details in Event Viewer
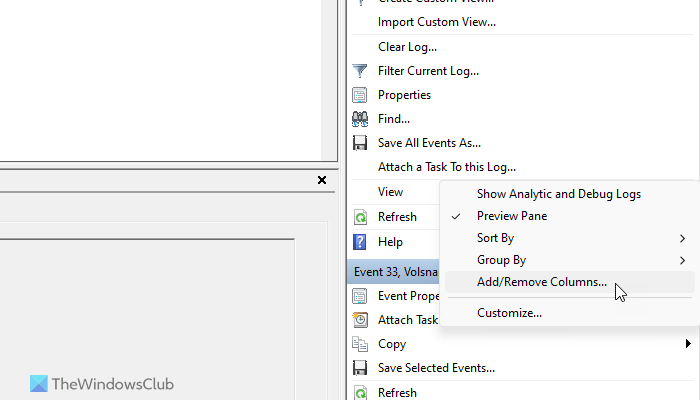
By default, Event Viewer displays a few columns such as Level, Date and Time, Source, Event ID, etc. However, if you want to find more information about a log, you should add more columns of data. To add or remove columns in Event Viewer, follow these steps:
- Open the Event Viewer on your computer.
- Navigate to a path.
- Click on the View button on the right-hand side.
- Select the Add/Remove Columns option.
- Choose a column you want to display and click the Add button.
- On the other side, choose a column and click the Remove button.
- Click the OK button to save the change.
Read: How to check the Shutdown and Startup Log in Event Viewer
Use Event Viewer to filter and find details of any log
It is one of the most important things you can do using Event Viewer. It is possible to find every possible detail of any logged item. First, open the Event Viewer and navigate to a path. For this example, we are selecting Windows Logs > System.
Here, you can find the window that displays all the logs. Click on any log to go to the General/Details panel.
You can find the date/time, the involved app, and more information. However, to filter the data, you need to click on the Filter Current Log option visible on the right-hand side.
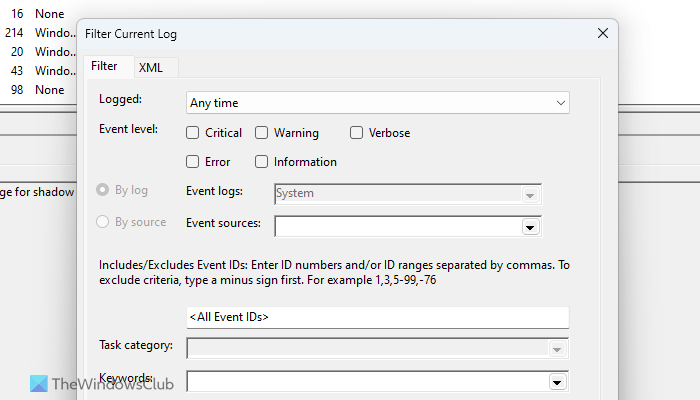
After that, you can choose the time, Event level, event ID,
Category, keyword, user, etc. If you use a networked computer, you can also choose the computer.
Once you click the OK button, your data will be filtered immediately. For your information, you can apply the same filters in multiple sections.
Read: Use Event Viewer to check unauthorized use of Windows computer
How to copy log details in Event Viewer?
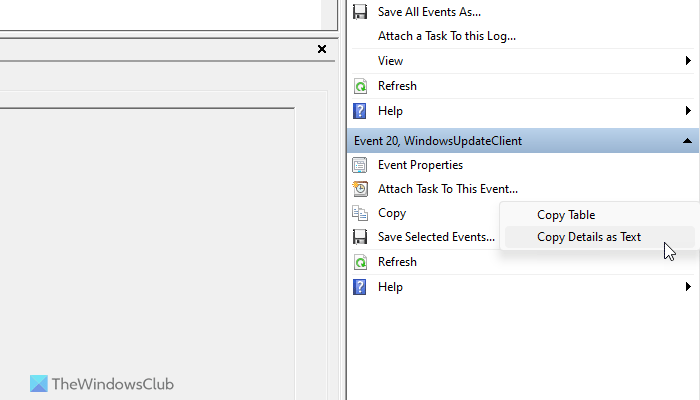
To copy log details to the clipboard, follow these steps:
- Open any section in Event Viewer.
- Select any log you want to copy.
- Click the Copy > Copy Details as Text option on the right-hand side.
- Open Notepad or any text-processing application and paste it.
Read: How to find ChkDsk results in Event Viewer
How to save all events of Event Viewer?
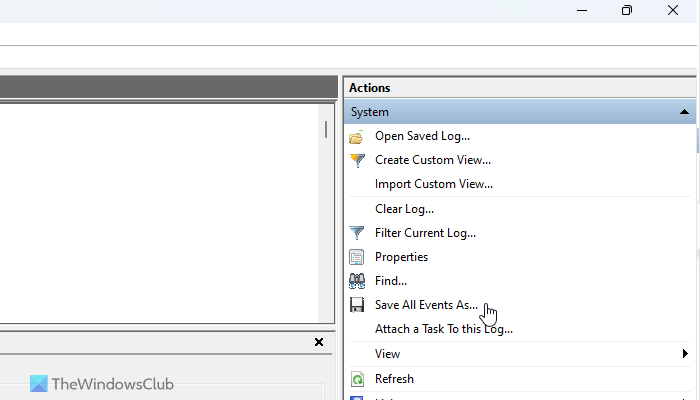
At times, you might need to save the events for further investigation of an error or something like that. In such a situation, you can use the built-in Event Viewer option to get the job done. You can follow these steps to save all logged events of Event Viewer:
- Open the Event Viewer on your computer.
- Navigate to a path.
- Click on the Save All Events As option.
- Select a path where you want to save the file and choose a name.
- Click the Save button.
If you want to open a saved logged file, click on the Open Saved Log option and choose the file you created earlier. Then, click the Open button.
Read: How to export Event Viewer logs in Windows
How to create custom view in Event Viewer?
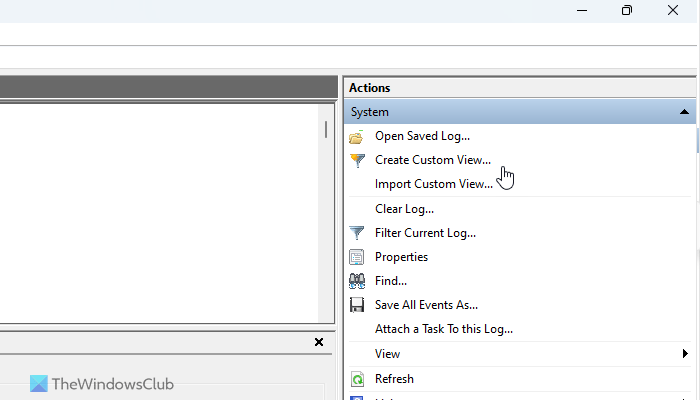
To create a custom view in Event Viewer, follow these steps:
- Open the Event Viewer and click on the Custom Views section.
- Click the Create Custom Views option.
- Enter the filters as per your requirements.
- Click the OK button.
It will be added as a custom view in the Event Viewer.
Read: Event Viewer is missing in Windows 11.
How to clear log or activity history in Event Viewer?
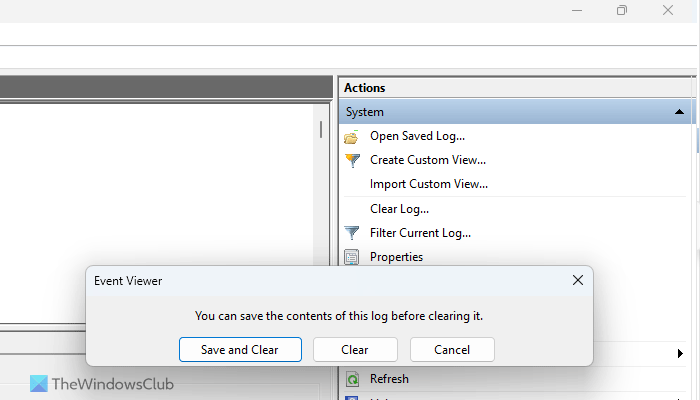
Sometimes, you might want to create a log or activity history from Event Viewer. At such a moment, you can follow these steps:
- Navigate to a specific path in Event Viewer.
- Click on the Clear Log option on the right-hand side.
- Click the Clear button.
However, if you want to save the logged events before clearing, click the Save and Clear button instead of the Clear button.
I hope this guide helps you to use Event Viewer more effectively.
Read: How to clear the Event Log in Windows
How do I see Windows 11 crash logs?
To see Windows 11 crash logs, you need to use Event Viewer. Open the Event Viewer on your computer and go to Windows Logs > System. Then, find the red-marked or “Error” logs. Following that, read the error description in the General and Details tabs.
Read: Event Viewer not working on Windows Server
How do I view Activity log in Windows 11?
There are two separate activity logs in Windows 11. Open Windows Settings and go to Privacy & security > Activity history. You can also open the Event Viewer and go to Windows Logs > System. Here you can find all the activity logs that meet your requirements.
Read: How to find and view BSOD log files in Event Viewer.