
This comprehensive guide explores the most crucial Windows log file locations essential for cybersecurity professionals, including credential logs, system and event logs, malware indicators, and persistence paths. Learn how to use these files for threat hunting, incident response, and digital forensics with actionable insights and a summary table.
Table of Contents
- Credential and Access Logs
- System and Event Logs
- Malware and Threat Hunting Indicators
- Persistence and Startup Investigations
- Windows Log File Locations
- Conclusion
- Frequently Asked Questions (FAQs)
In the world of cybersecurity, access to the right information at the right time can make or break an investigation. When analyzing a compromised Windows system, knowing where to find crucial log files can help you uncover evidence of unauthorized access, malware infections, and persistent threats.
This guide will walk you through the most important Windows log file locations used in digital forensics, incident response, and threat hunting, grouped into four main categories: Credential Logs, Event Logs, Threat Indicators, and Persistence Mechanisms.
Credential and Access Logs
These files are the first stop when you need to investigate how a threat actor may have accessed the system or dumped user credentials.

Key File Locations:
-
C:\Windows\System32\config\SAM
Stores local password hashes. Attackers frequently target this file to extract passwords using tools like Mimikatz. -
C:\Windows\repair\SAM
This is a backup of the SAM file, often overlooked, but can also be targeted to extract credential information. -
C:\Windows\System32\config\SECURITY
Contains security policies and access control settings, which can help track privilege escalations and unauthorized changes.
System and Event Logs
These logs are the backbone of digital forensics, providing information on system changes, user actions, and software behavior.
Key File Locations:
-
C:\Windows\System32\winevt
Stores Windows Event Logs used for event correlation, timeline creation, and alert generation in SIEM systems.
-
C:\Windows\System32\config\SYSTEM
Logs system-wide configuration changes, driver loads, and hardware info. Helps in mapping system behavior before and after compromise. -
C:\Windows\System32\config\SOFTWARE
The registry hive that provides details on installed software, version changes, and potential rogue installations.

Malware and Threat Hunting Indicators
When malware strikes, these files can reveal what was executed, when, and by whom — crucial data for forensic timeline reconstruction and lateral movement detection.
Key File Locations:
-
C:\Windows\Prefetch
Tracks recently executed programs. Useful in building a forensic timeline and understanding attacker behavior. -
C:\Windows\AppCompat\Programs\Amcache.hve
Contains data about executed applications, file hashes, and execution paths. Ideal for detecting malicious binaries. -
C:\Users\\NTUSER.dat
A user-specific registry file that holds data on settings and preferences. Often abused to maintain persistence.
Persistence and Startup Investigations
To survive reboots and maintain presence, attackers plant themselves in startup folders or exploit registry keys. These file paths can help uncover such methods.
Key File Locations:
-
C:\Users\\AppData\Roaming\Microsoft\Windows\Start Menu\Programs\Startup
Location for user-specific startup programs. Used by both legitimate software and malware for persistence. -
C:\ProgramData\Microsoft\Windows\Start Menu\Programs\Startup
A global startup folder for all users. Malware often drops executables here to run on every boot.
Windows Log File Locations
| Category | File Path | Purpose |
|---|---|---|
| Credential & Access Logs | C:\Windows\System32\config\SAM |
Stores local password hashes |
C:\Windows\repair\SAM |
Backup SAM file (credentials) | |
C:\Windows\System32\config\SECURITY |
Security policies & access settings | |
| System & Event Logs | C:\Windows\System32\winevt |
Windows Event Logs for SIEM & incident tracking |
C:\Windows\System32\config\SYSTEM |
System-wide config and change logs | |
C:\Windows\System32\config\SOFTWARE |
Installed software & registry changes | |
| Malware & Threat Indicators | C:\Windows\Prefetch |
Tracks recently executed files |
C:\Windows\AppCompat\Programs\Amcache.hve |
Logs executed binaries with metadata | |
C:\Users\\NTUSER.dat |
User-specific registry for persistence | |
| Persistence & Startup | C:\Users\\AppData\Roaming\...\Startup |
User startup folder |
C:\ProgramData\Microsoft\Windows\...\Startup |
Global startup folder |
Conclusion
If you’re in digital forensics, threat hunting, or incident response, knowing these Windows log locations can dramatically speed up investigations and help identify suspicious activity more effectively. Tools like Sysinternals, Autoruns, and SIEM platforms can help automate the parsing and monitoring of these logs.
Pro Tip: Always monitor these paths using endpoint detection and response (EDR) tools and alert on unauthorized changes or newly added executables in startup folders.
FAQs
What are Windows log file locations used for in cybersecurity?
They are used to track activities, detect malware, and investigate security breaches on Windows systems.
Where is the SAM file located in Windows?
Located at C:\Windows\System32\config\SAM, it stores local user credentials.
What is the purpose of the SECURITY file in Windows?
It contains security policy and access control data crucial for forensic analysis.
How do attackers use the Prefetch folder?
They analyze Prefetch to determine recently executed files, often revealing attacker activity.
What is Amcache.hve used for?
This registry file logs metadata about executed applications, helpful in threat hunting.
What can be found in NTUSER.dat?
User-specific registry settings often targeted for persistence.
Where are Windows Event Logs stored?
In the C:\Windows\System32\winevt folder.
How does SYSTEM log file help in investigations?
It shows system-wide changes, like driver loads or hardware modifications.
What does the SOFTWARE registry hive track?
It tracks installed applications and configuration changes.
What is a global startup folder?
C:\ProgramData\Microsoft\Windows\Start Menu\Programs\Startup — used by all users for automatic program execution.
How is the Startup folder used in malware attacks?
Malware often places itself here to run every time the system boots.
Can attackers modify NTUSER.dat?
Yes, attackers modify it for stealthy persistence mechanisms.
Why are Prefetch files important in timeline analysis?
They show when and how often applications were executed.
What is the significance of AppCompat Programs logs?
They record execution history, helping spot lateral movement.
What is the difference between SAM and SECURITY file?
SAM stores credentials, while SECURITY handles policy and access rights.
How can I detect persistence via startup paths?
Check both user and global startup folders for suspicious programs.
Are Event Logs useful for SIEM systems?
Yes, they are essential for correlation, alerting, and investigation.
Can deleted logs be recovered?
Sometimes, using forensic tools that read slack or unallocated space.
How do malware authors abuse the Registry?
By adding keys or values that launch malware at startup.
Is it safe to delete the Prefetch folder?
It is not recommended unless necessary, as it impacts system performance and forensic value.
Can the Amcache file be cleared?
Yes, but doing so removes valuable forensic data.
How do I access registry hives for forensic analysis?
Use tools like RegRipper or load them in offline registry editors.
What are common indicators of persistence in logs?
Repeated startup entries, modified NTUSER.dat, and unusual registry keys.
Can logs indicate a brute-force attack?
Yes, via failed login attempts in the SECURITY log.
Are log files readable in plain text?
Some are, while others require tools to parse them.
How do I monitor Windows logs in real-time?
Use EDR tools, Windows Event Viewer, or PowerShell scripts.
What tools analyze these log paths?
Tools like Autoruns, Volatility, RegRipper, and SIEM platforms.
How often should logs be reviewed?
Regularly—daily for high-risk environments or as part of SOC monitoring.
Do attackers delete log files?
Yes, it’s a common tactic to cover tracks post-breach.
What is the best practice for preserving logs during incident response?
Create a forensic image and avoid writing to the drive directly.
В журналах событий Windows хранится полезная информация, которая нужна при анализе состояния служб и приложений в Windows, отладки ошибок и аварийный ситуаций, аудите различных событий безопасности. По умолчанию для журналов Event Viewer в Windows заданы максимальные размеры, при достижении которых новые события начинают перезаписывать более старые. Если на вход Event Viewer попадает слишком большое количество событий, может случится, что в журнал помещаются события лишь за последние несколько часов, что может быть не достаточно.
Чтобы предотвратить перезапись старых событий и всегда иметь под рукой события за достаточно большой промежуток времени, вы можете увеличить максимальный размер журналов Event Viewer.
Содержание:
- Получить информацию о журналах событий Windows с помощью PowerShell
- Изменить размер журнала событий из консоли Event Viewer
- Увеличить размер журнала событий Windows через GPO
Получить информацию о журналах событий Windows с помощью PowerShell
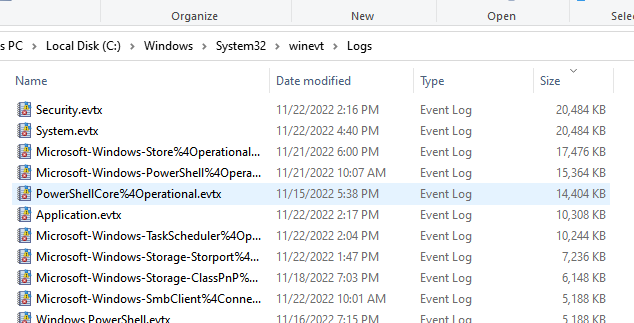
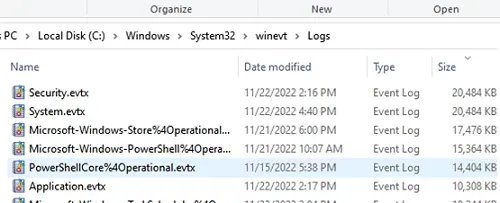
Файлы журналы событий Windows хранятся в каталог
%SystemRoot%\System32\Winevt\Logs\
в виде файлов с расширением .EVTX. Обратите внимание, что для каждого журнала используется собственный файл. Соответственно, вы можете управлять размерами только того лога Windows, который вам нужен и оставить остальные значения по-умолчанию.
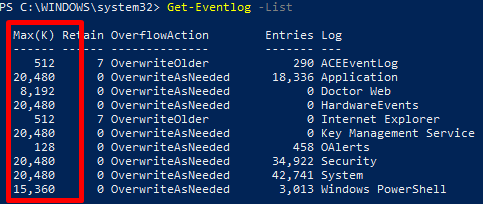
Текущие лимиты на все включенные журналы событий в Windows можно вывести с помощью PowerShell:
Get-Eventlog -List
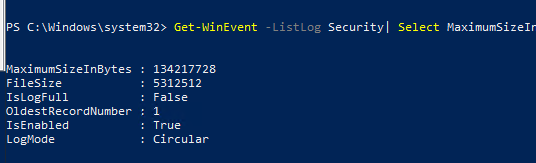
Вы можно вывести размер определенного лога с помощью командлета Get-WinEvent. Например, получим текущий и максимальный размер журнала Security:
Get-WinEvent -ListLog Security| Select MaximumSizeInBytes, FileSize, IsLogFull, OldestRecordNumber, IsEnabled, LogMode
Суммарный размер паки с файлами журналов событий можно получить с помощью PowerShell:
«{0:N2} MB» -f ((gci c:\windows\System32\Winevt\Logs\| measure Length -s).sum / 1Mb)
Чтобы увеличить максимальный размер лога, можно использовать утилиту wevtutul (новый размер задается в Кб):
wevtutil sl "Application" /ms:200000
Или с помощью PowerShell:
Limit-Eventlog -Logname Application -MaximumSize 200MB -OverflowAction OverwriteOlder
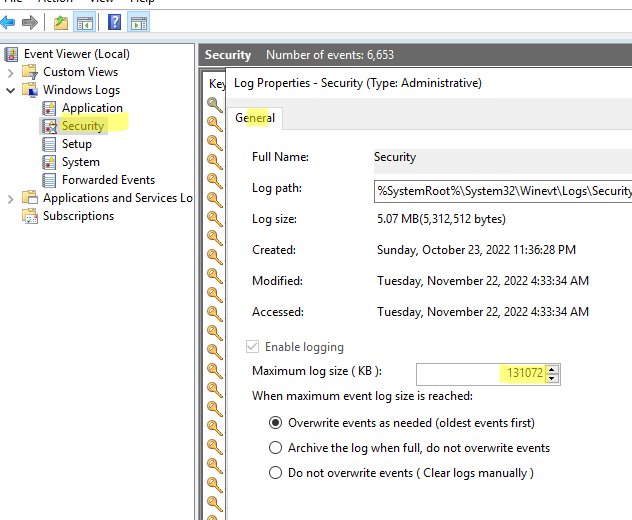
Изменить размер журнала событий из консоли Event Viewer
Проще всего увеличить максимальный размер журнала прямо из консоли Event Viewer.
- Откройте
eventvwr.msc
; - Найдите в консоли свойства нужного журнала и откройте его свойства (например, Security);
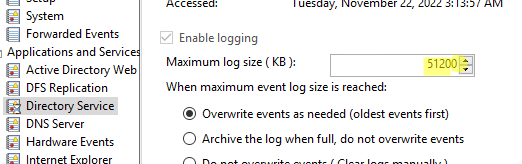
- Задайте ограничение в разделе Maximum log size (KB) и сохраните изменения;

- Здесь же можно изменить поведение при достижение максимального размера:
Owerwrite events as needed (oldest events first) – этот режим исопльзуется по умолчанию. Новые события просто перезаписывают более старые.
Archive the log when full, do not owerwrite events – текущий журнал событий при заполнении архивируется в папке \System32\Winevt\Logs\ и новые события записываются в новый evtx файл. Архивные файлы событий можно открыть через меню Open Saved Log в Event Viewer.
Do not owerwrite events (Clear log manually) – события никогда не перезатираются. Для записи новых событий нужно очистить журнал.
Увеличить размер журнала событий Windows через GPO
Чтобы централизованно управлять размерами журналов событий на компьютерах или серверах в домене Active Directory, можно использовать групповые политики.
- Запустите консоль Group Policy Management (
gpmc.msc
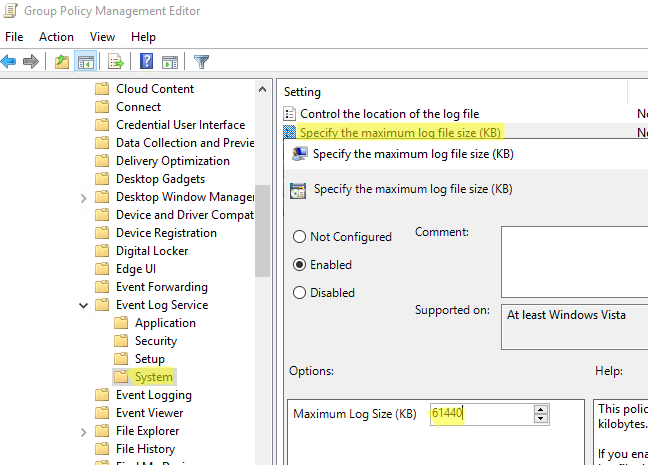
), создайте новую GPO и назначьте на OU с компьютерами или серверами, для которых вы хотите изменить настройки Event Viewer (или назначьте GPO на корень домена); - Перейдите в раздел GPO Computer Configuration -> Policies -> Administrative Templates -> Windows Components -> Event Log Service. Как вы видите, в этом ветке есть подразделы для управления базовыми журналами Windows:
Application
Security
Setup
System
- Чтобы увеличить максимальный размер любого из журналов, откройте параметр Specify the maximum log file size (KB), включите его и задайте нужный вам размер;

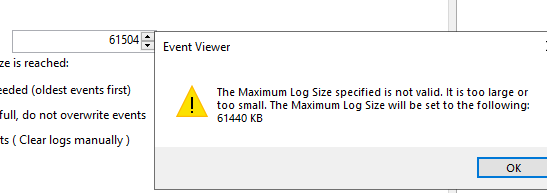
- Обновите настройки политики на клиентах и проверьте, что в свойствах журнала теперь указан новый размер, который вы не можете изменить. При попытке задать другой размер появится ошибка:

Event Viewer
The Maximum Log Size specified is not valid. It is too large or too small. The Maximum Log Size will be set to the following: 61440 KB
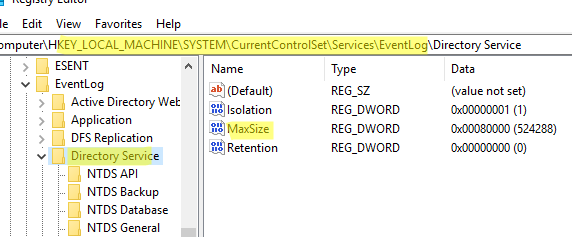
Обратите внимание, что в описанном выше разделе GPO отсутствуют настройки для других журналов из раздела Applications and Services Logs -> Microsoft.Если вам нужно увеличить размер любого другого журнала событий (кроме стандартного), это можно сделать через реестр. Настройки журналов событий Windows хранятся в разделе реестра HKEY_LOCAL_MACHINE\SYSTEM\CurrentControlSet\Services\EventLog\<log_name>. Размер журнала задается с помощью параметра MaxSize (тип REG_DWORD). Вы можете распространить нужное вам значение параметра реестра MaxSize на компьютеры домена с помощью Group Policy Preferences.
Подробнее о настройке ключей и параметров реестра через GPO здесь.
В этом примере мы увеличим размер журнала Directory Service на контроллерах домена. Настройки этого лога хранятся в ветке HKLM\SYSTEM\CurrentControlSet\Services\EventLog\Directory Service.
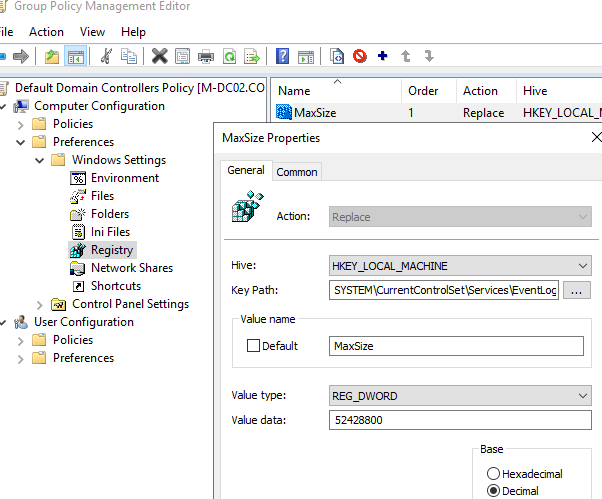
- Откройте GPO и перейдите в раздел Computer Configuration -> Preferences -> Windows Settings -> Registry;
- Выберите New -> Registry Item;
- Создайте новый параметр со следующими настройками:
Hive: HKEY_LOCAL_MACHINE
Key path: SYSTEM\CurrentControlSet\Services\EventLog\Directory Service
Value name: MaxSize
Value type: REG_DWORD
Value data: 52428800 (значение задается в байтах. В нашем примере это 50 Мб)

- Проверьте, что после обновления GPO на DC увеличится максимальный размер журнала.
Например, если вам нужно хранить историю RDP подключений к RDS хосту за продолжительное время, нужно увеличить размер лога Terminal-Services-RemoteConnectionManager.
За счет увеличения размеров журналов событий Windows вы можете получить различную информацию за более длительный промежуток времени. Например, из журналов событий можно получить историю перезагрузок Windows, понять кто удалил файл в сетевой папке или кто изменил NTFS права доступа.
Для различных событий и ошибок системы и приложений Windows ведёт журналы событий, которые можно просмотреть и получить дополнительную информацию, которая может быть полезной при решении проблем с компьютером.
В этой инструкции для начинающих — способы открыть просмотр событий Windows 11/10 и дополнительная информация на тему, которая может пригодиться. На близкую тему: Как отключить журнал событий в Windows.
Контекстное меню кнопки Пуск и поиск
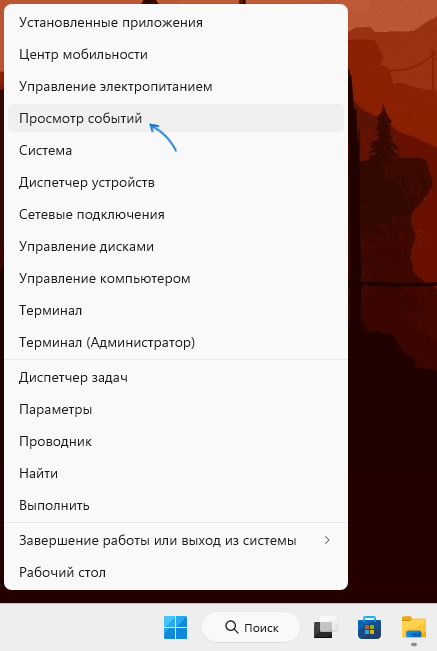
Самый быстрый способ перейти к просмотру журналов событий в Windows 11 и 10 — нажать правой кнопкой мыши по кнопке «Пуск» или нажать клавиши Win+X на клавиатуре и выбрать пункт «Просмотр событий» в открывшемся меню.
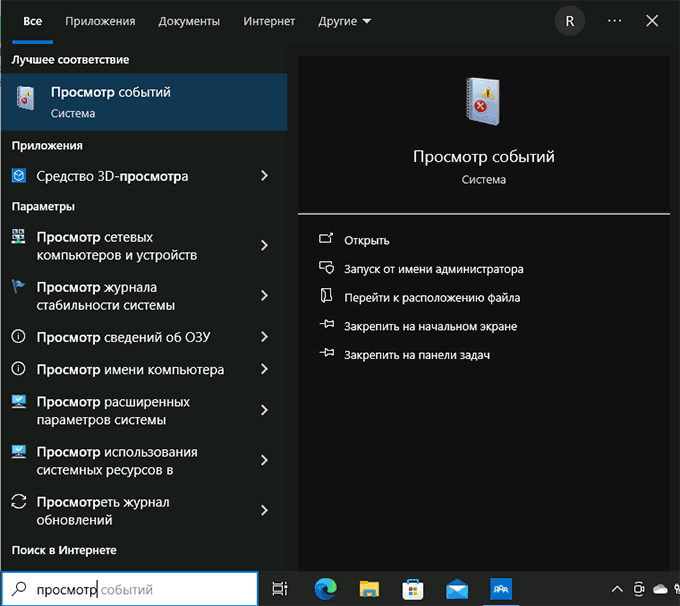
Ещё один простой и в большинстве случаев работающий способ открыть какой-либо системный инструмент, расположение которого вам неизвестно — использовать поиск в панели задач.
Начните вводить «Просмотр событий» в поиске, после чего запустите найденный результат:
Почему не «Журнал событий» или «Журнал ошибок», которые пользователи обычно ищут? Причина в том, что сами журналы — это файлы на диске в папках
C:\Windows\System32\winevt\Logs
C:\Windows\System32\LogFiles
Пользователи, задавая вопрос о том, где журнал событий в Windows, обычно имеют в виду именно системный инструмент «Просмотр событий» для удобного просмотра соответствующих журналов.
Команда «Выполнить»
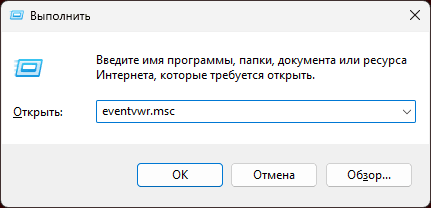
Самый быстрый и часто используемый метод запуска просмотра журналов событий Windows — использование команды «Выполнить»:
- Нажмите клавиши Win+R на клавиатуре, либо нажмите правой кнопкой мыши по кнопке «Пуск» и выберите пункт «Выполнить».
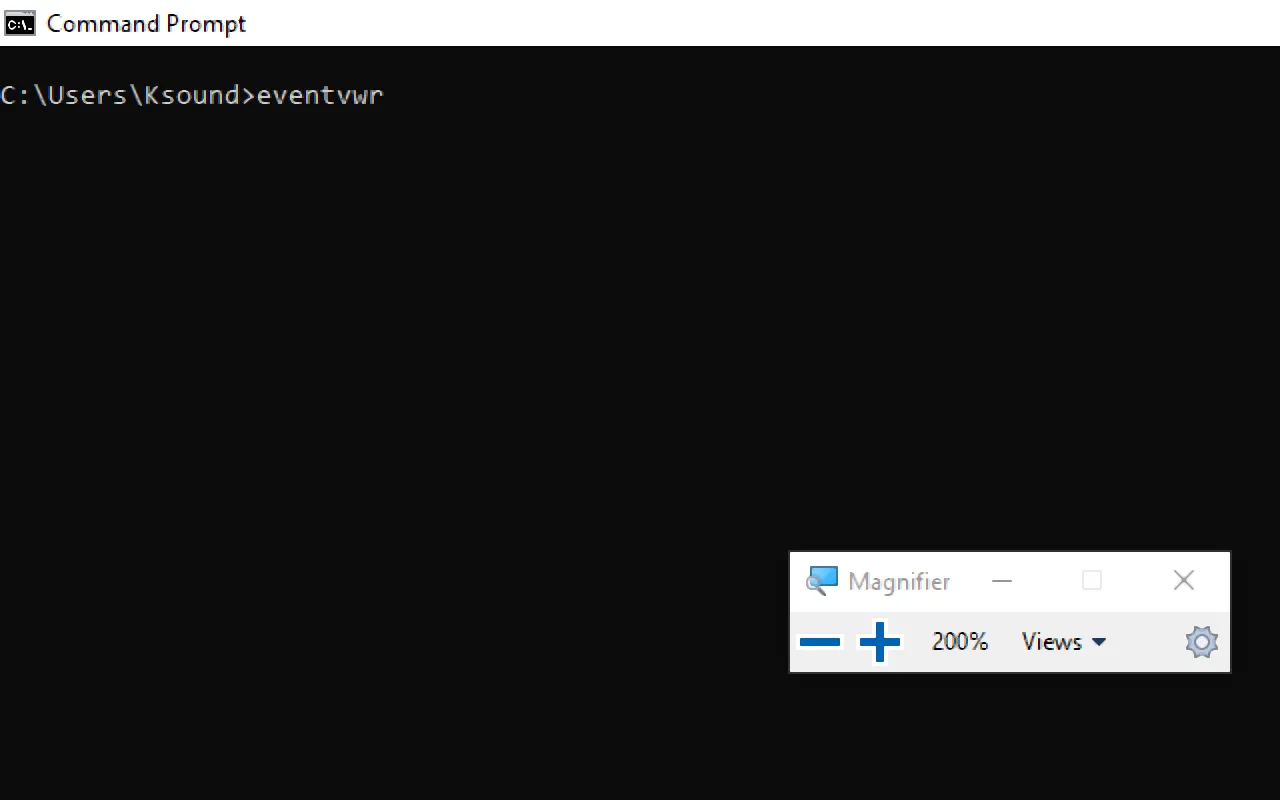
- Введите eventvwr.msc (или просто eventvwr) и нажмите Enter.

- Откроется «Просмотр событий».
Эту же команду можно использовать для создания ярлыка или для открытия журнала событий в командной строке. Возможно, вам пригодится информация о других полезных командах «Выполнить».
Обычно описанных выше вариантов бывает достаточно для открытия просмотра журналов событий и ошибок в Windows, но есть и другие подходы:
Помимо просмотра журнала событий, в Windows присутствует ещё один полезный инструмент — Монитор стабильности системы, позволяющий наглядно получить информацию о работе вашей системы по дням на основании данных из журнала событий.
If you’re using a Windows server and want to know what happened to your machine, Windows logs are an essential resource. Windows logs record various system activities, errors, and other significant events, providing valuable information for troubleshooting, auditing, and ensuring system integrity. Understanding how to access, interpret, and utilise these logs enables efficient, problem solving, enables security measures and ensures the smooth operation of your system.
In this guide, you will learn about Windows event logs, its different categories, how to filter and create Custom Views.
What is a Windows Event Log?
A Windows event log is a file that keeps track of system events and errors, application issues, and security events. Windows Event log can also provide insights into an application’s behavior by tracking its interactions with other processes and services. With the right knowledge of the information stored in these logs, you can easily diagnose and easily resolve issues within your system and applications.
You can access the windows events logs as follows:
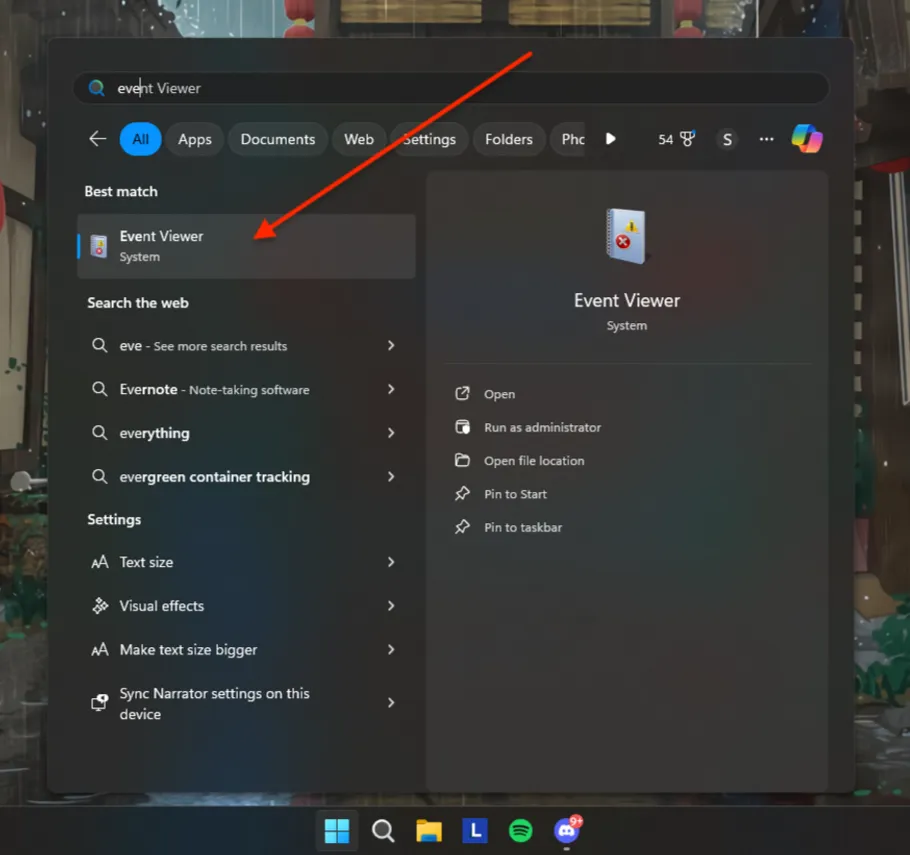
Using the Start Menu:
- Click on the Start button or press the Windows key.
- Type
Event Viewerin the search box and select it from the search results.
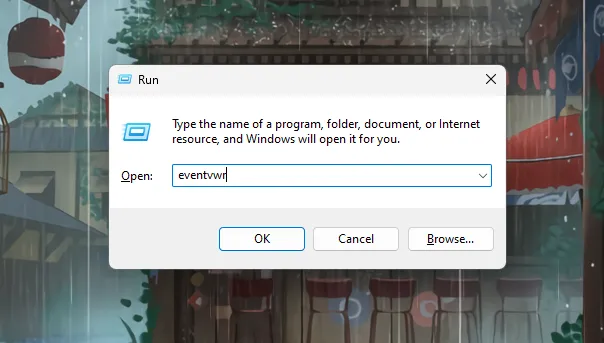
Using the Run Dialog:
- Press
Windows + Rto open the Run dialog. - Type
eventvwrand press Enter.
Using the Control Panel:
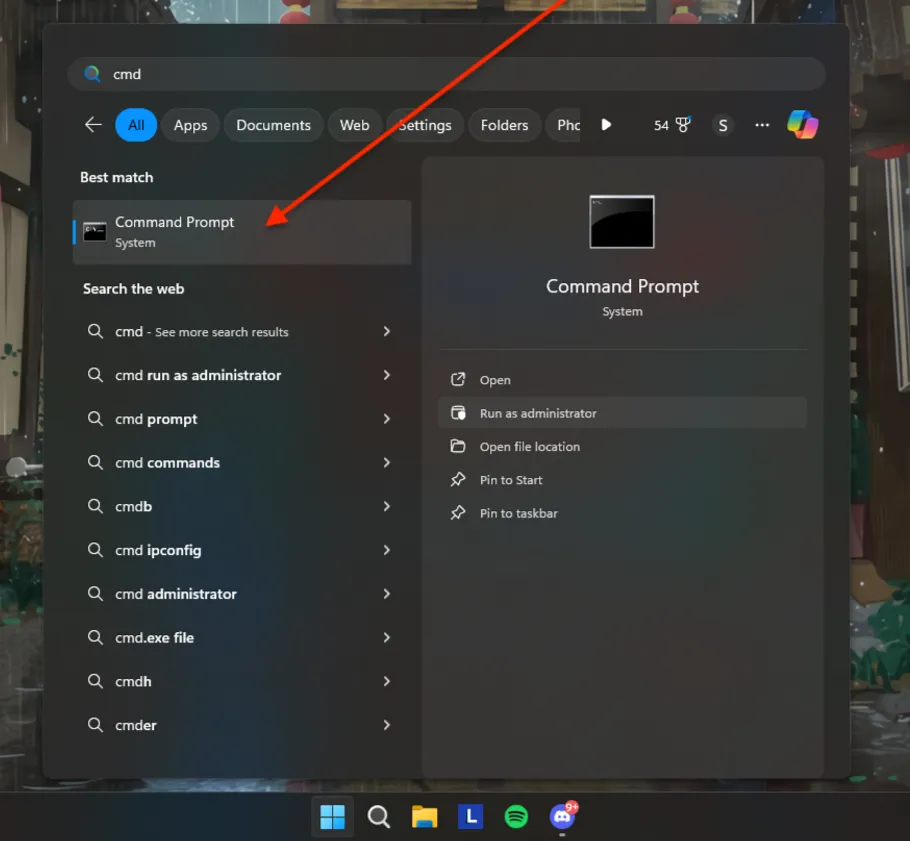
- Open the Command Prompt and run as administrator.
- Type
eventvwrand press Enter.
You can see the detailed steps below. Now let’s discuss and understand windows events logs in detail.
Understanding Windows Event Logs categories & Types
There are different Windows logs, each serving a specific purpose in tracking and recording events related to your system, applications, and security. They include:
- System Events: System events log information is about the core operations of your Windows operating system. System events are essential for maintaining your system’s health and functionality because it records events related to the system’s hardware and software components. Some system events are as follows:
- Hardware Failures: Logs any issues related to hardware components, such as disc failures or memory errors.
- Driver Issues: Records events related to the loading, unloading, or malfunctioning of device drivers. This helps in identifying driver-related problems that could affect system stability.
- System Startups and Shutdowns: Tracks the times when the system starts up or shuts down. This can be useful for understanding system uptime and diagnosing issues related to improper shutdowns or startup failures.
- Application Events: Data related to software applications running on the system includes application errors, warnings, and informational messages. If you are using a Windows server to run your production-level application, you can use the application errors, warnings, and messages provided here to solve the issue. There are different types of Application events some are as follows:
- Application Errors: Application errors are events generated by software applications when they encounter issues that prevent them from functioning correctly.
- Warnings: Logs warnings from applications about potential issues that might not be critical but could lead to problems if not addressed.
- Informational Messages: Provides general information about application activities, such as successful operations or status updates, helping to understand the normal functioning of applications.
- Security Events: Security events are logs that capture all security-related activities on your Windows system. They are essential for monitoring, maintaining, and auditing the security of your system. These events help detect unauthorised access attempts, monitor access to sensitive resources, and track changes to system policies. Some security events are as follows:
- Successful and Failed Login Attempts: Successful and failed login attempts are critical events that are logged by a system to monitor access and ensure security. These logs provide valuable insights into user activity, helping to detect unauthorised access attempts and identify potential security threats.
- Resource Access: These events log attempts to access protected resources such as files, folders, or system settings. Monitoring these logs ensures that sensitive data is accessed appropriately and helps identify unauthorised access attempts.
- System Policy Changes: These logs record any changes to system policies, including modifications to user permissions or security settings. This is important for auditing purposes and ensuring compliance with security policies, helping to maintain the integrity and security of the system.
- Setup Events: Setup events are logs that contain detailed information about the installation and setup processes on your Windows system. These logs are valuable for diagnosing and resolving issues that occur during the installation or configuration of software and system components. Some Setup events are as follows:
- Installation Processes: Installation processes refer to the series of steps and operations carried out to install software, updates, or system components on a Windows system. It contains log details about software installation, updates, or system components. This helps in diagnosing issues related to incomplete or failed installations.
- Setup Configurations: Records information about system configurations during the setup process. This can be useful for understanding your system’s initial setup and configuration.
- Forwarded Events: Forwarded events are logs sent from other computers to a centralised logging server. This is particularly useful in larger environments where centralised log management is needed. They include:
- Logs from Remote Systems: Collects event logs from multiple systems, allowing for centralised monitoring and management.
- Centralised Logging Scenarios: Useful for organisations that need to aggregate logs from various systems to a single location for easier analysis and monitoring.
Accessing the Windows Event Viewer
Windows Event Viewer is a Windows application that lets you see your computer’s logs, warnings, and other events. Each application you open generates entries that are recorded in an activity log, which can be viewed from the Event Viewer.
There are several ways to access the Windows Event Viewer. Here are some of them:
-
Using the Start Menu:
- Click on the Start button or press the Windows key.
- Type
Event Viewerin the search box.
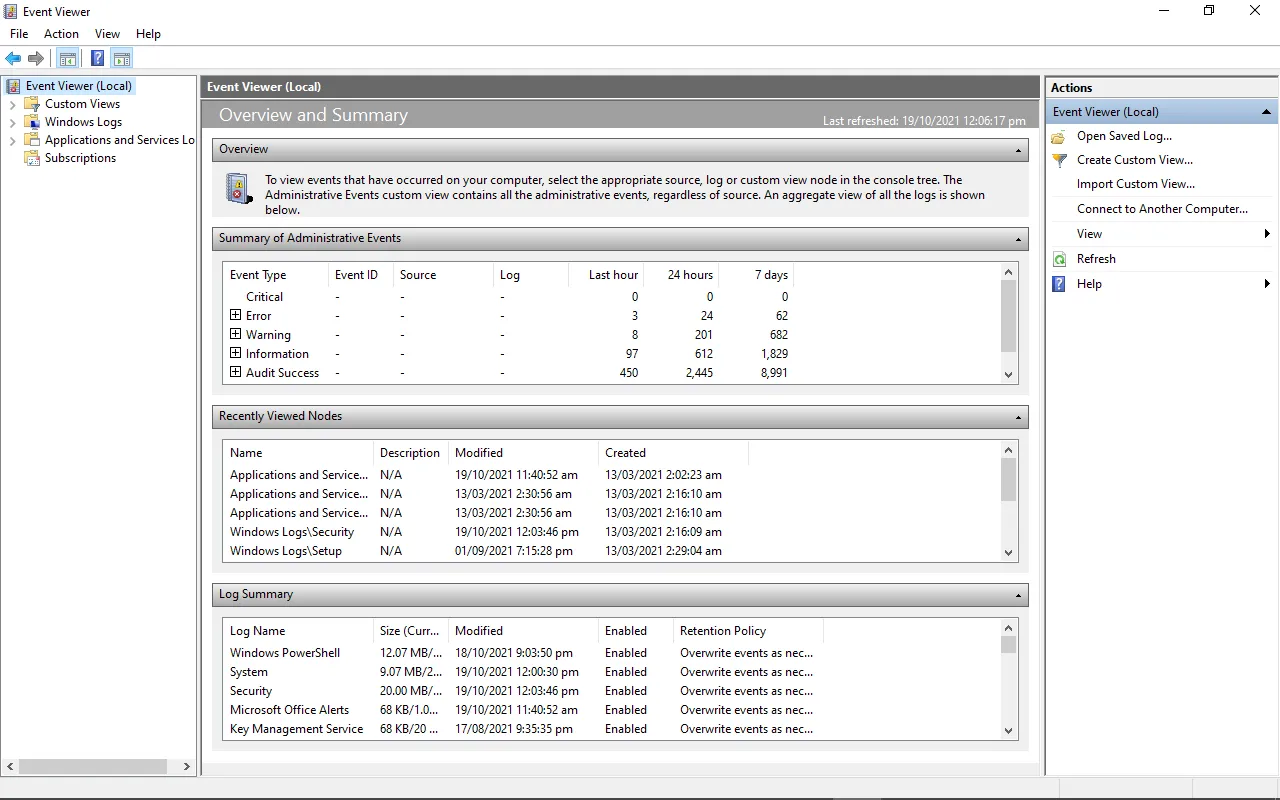
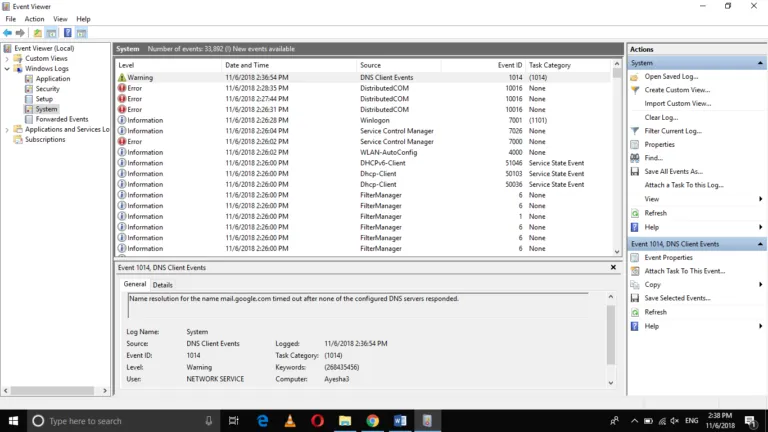
Using start menu to open Event viewer — Select Event Viewer from the search results which will popup something like this.
Event Viewer main page 2. Using the Run Dialog: — Press
Windows + Rto open the Run dialog. — Typeeventvwrand press Enter.
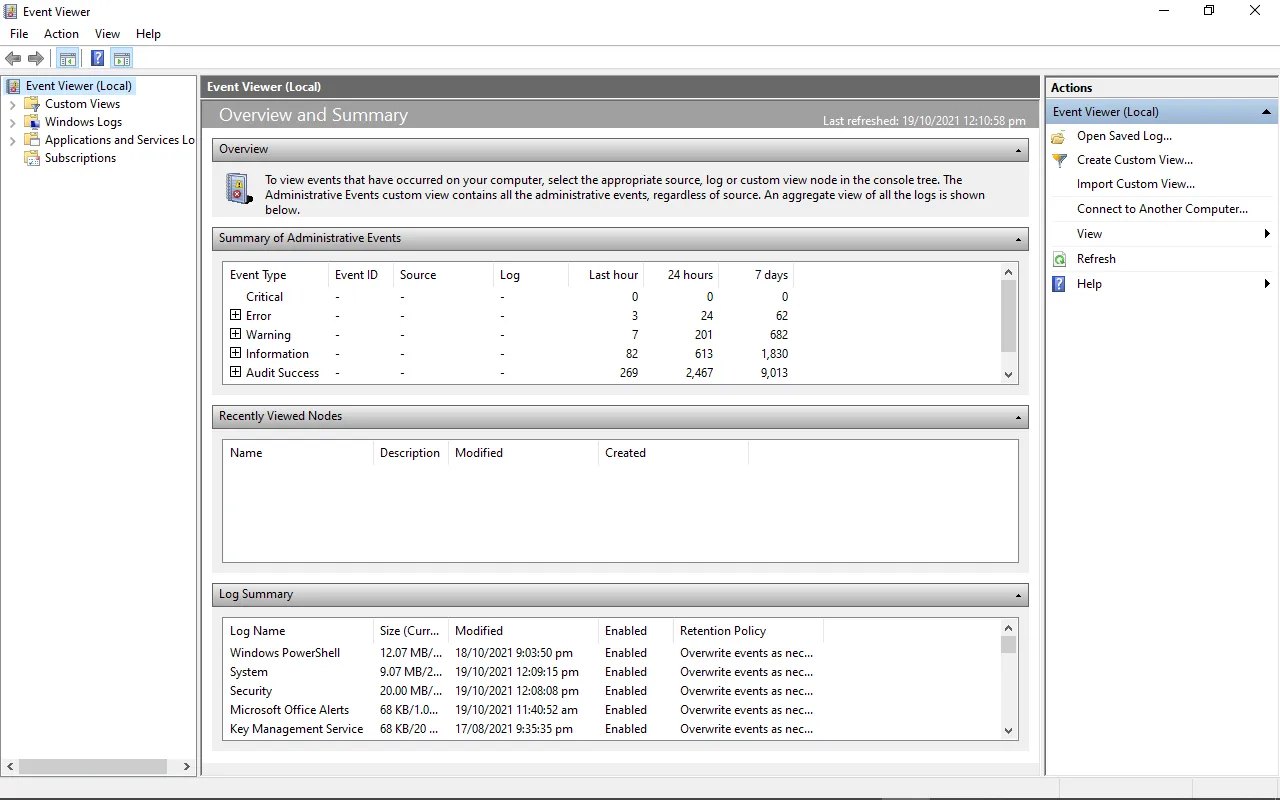
Windows Run App to open Event Viewer
Windows Event viewer landing page 3. Using Control Panel: — Open the Command Prompt and run as administrator
Open CMD as Administrator from start menu — Once open, type
eventvwrand press enter, and you will be redirected to Event Viewer page.
CMD terminal
Windows Log Location
Windows event logs are stored in files located in the C:\\Windows\\System32\\winevt\\Logs directory. Each log file corresponds to a specific log category, such as System, Application, or Security. It may differ depending on which version of Windows you are using.
The main event log files are:
- Application.evtx: Logs events from applications and programs.
- Security.evtx: Logs security events like successful or failed logins.
- System.evtx: Logs events related to Windows system components and drivers
You can find many other log files which could be related to system operations & other processes that are happening inside the Windows System. Windows 11uses the .evtx format rather than using the classic EVT format.
Understanding Event Viewer Entries
Event Viewer entries provide detailed information about each logged event. It is like a log book for your Windows system. They record important happenings within the system, including applications, systems, security, failed events, etc. Understanding these entries is key to effective log management.
The key components of an Event Viewer entry are:
- Date and Time: When the event occurred.
- Source: The application or system component that generated the event.
- Event ID: A unique identifier for the event type.
- Level: The severity of the event (Information, Warning, Error, Critical).
- User: The user account under which the event occurred.
- Computer: The name of the computer where the event was logged.
- Description: Detailed information about the event.
Each event in the Event Viewer has a severity level, indicating the importance and type of the event:
- Information (Green Light): These events resemble a green traffic light, signifying smooth sailing. They indicate successful operations or occurrences within your system.
- Warning (Yellow Light): Treat these entries with caution, like a yellow traffic light. They signal potential issues that warrant attention but might not cause immediate problems.
- Error (Orange Light): Think of error entries as an orange traffic light; proceed with care. They denote significant problems that could affect system functionality. Imagine an error message indicating a driver failure.
- Critical (Red Light): Critical entries are akin to a red traffic light; stop and address the situation immediately. They represent severe errors that have caused a major failure. A critical event might report a complete system shutdown or a critical service crashing.
Filtering and Custom Views
Event Viewer allows you to filter events using a variety of parameters, including date, event level, source, and more. Consider the following scenario: your system exhibits weird behaviour, but the Event Viewer is overflowing with hundreds, if not thousands, of entries. Filtering steps and generating custom views can significantly reduce the workload. You may also construct custom views to focus on specific kinds of events:
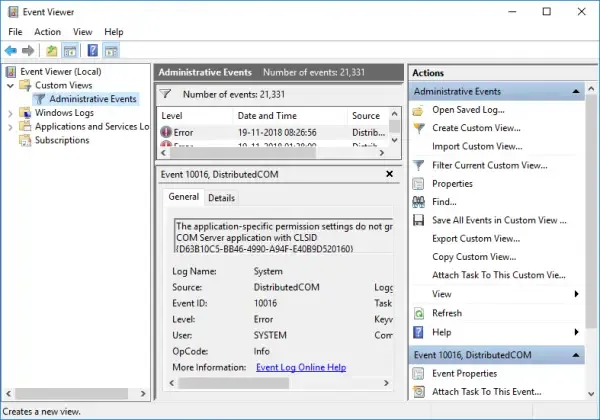
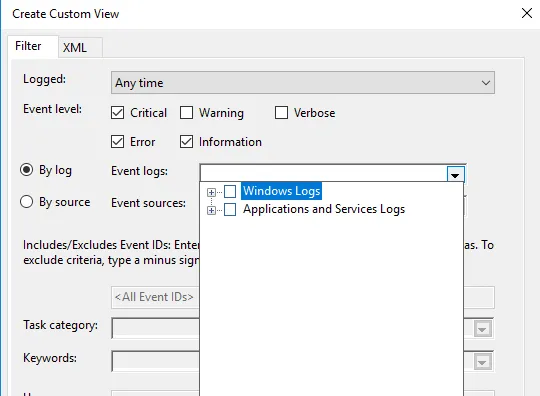
- In the Event Viewer, you’ll see Administrative Events, to create special logs right-click on «Custom Views» and select «Create Custom View.»
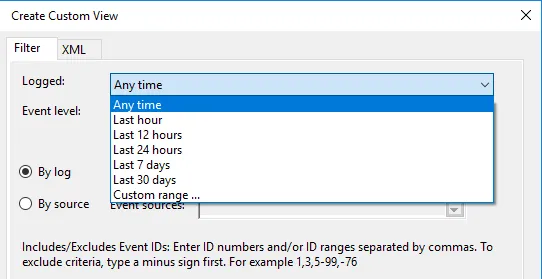
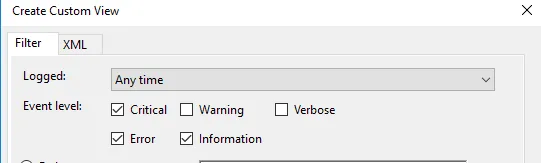
1. In the Custom View page, you can see logged drop down, choose a preferred time or it gives you an option to create a custom time to set. 2. On the Event Level choose an appropriate level for your custom view, You can choose among the 5 levels.
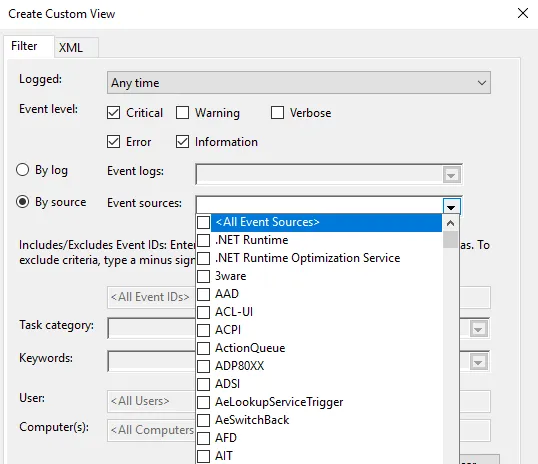
1. Once done, choose how you want the events to be filtered, By log or By source.
Once everything is set up according to your needs, save all events in Custom View as
from the drop-down menu and choose an appropriate location to save the logs. Click on the Save button. (A log file with the extension .evtx will be saved on your device).
Conclusion
This blog provides an understanding how you can use the Windows Event Viewer which is provided by the Windows in default and using it to monitor Windows logs.
- Main event log files are stored in
C:\\Windows\\System32\\winevt\\Logs. - Windows logs are crucial for understanding the activities, errors, and significant events on your machine. They provide valuable information for troubleshooting, auditing, and ensuring system integrity.
- They record a variety of system activities, errors, and other significant events, providing valuable information for troubleshooting, auditing, and ensuring system integrity.
- We learnt how to setup Filtering and Custom Views to optimise what we see and solve the problems and where it happened.
By grasping the significance of different event types such as System, Application, Security, Setup, and Forwarded Events, and knowing how to filter and export logs, you can effectively manage your Windows system.
FAQ’s
How to view Windows logs?
To view Windows logs, use the built-in Event Viewer:
- Press
Win + R, typeeventvwr, and press Enter. - Navigate through the console tree to find the log you want to view (e.g., Windows Logs > Application).
Where are Microsoft logs?
Microsoft logs, including Windows logs, can be found in the Event Viewer under sections like Application, Security, and System. Log files are also located in the C:\Windows\System32\winevt\Logs directory.
How do I audit Windows logs?
To audit Windows logs:
- Open Event Viewer.
- Navigate to Security logs under Windows Logs.
- Configure auditing policies via the Local Security Policy or Group Policy Management Console.
How do I check my Windows activity log
Check your Windows activity log by viewing the Security logs in Event Viewer. These logs record user logins, logoffs, and other security-related activities.
Which is Windows log key?
The Windows log key, often referred to as the Windows key, is the key on your keyboard with the Windows logo. It is used in various shortcuts to open system tools, including Event Viewer (Win + X > Event Viewer).
Where is the logs folder?
The logs folder is located at C:\Windows\System32\winevt\Logs. This folder contains all the event log files in .evtx format.
Why are Windows logs important?
Windows logs are important because they provide detailed information about system operations, security events, and application behavior, which is crucial for troubleshooting, auditing, and ensuring system integrity.
How to view log files?
View log files using Event Viewer:
- Open Event Viewer (
Win + R, typeeventvwr, press Enter). - Expand the Windows Logs section and select the log you want to view.
Where are login logs?
Login logs are located in the Security logs section of Event Viewer. They record all login attempts, both successful and failed.
What are system logs?
System logs contain information about the core operations of the Windows operating system, including hardware events, driver issues, and system startups and shutdowns. They are found under the System section in Event Viewer.
How do I find Windows log files?
Find Windows log files in the Event Viewer or directly in the C:\Windows\System32\winevt\Logs directory.
How do I view user logs in Windows 10?
View user logs in Windows 10 through the Event Viewer:
- Open Event Viewer.
- Go to Windows Logs > Security to see logs related to user activities, including logins and logoffs.
How do I view Windows setup logs?
To view Windows setup logs:
- Open Event Viewer.
- Navigate to Applications and Services Logs > Microsoft > Windows > Setup.
How do I view Windows app logs?
To view Windows application logs:
- Open Event Viewer.
- Navigate to Windows Logs > Application to see logs related to software applications running on your system.
Was this page helpful?
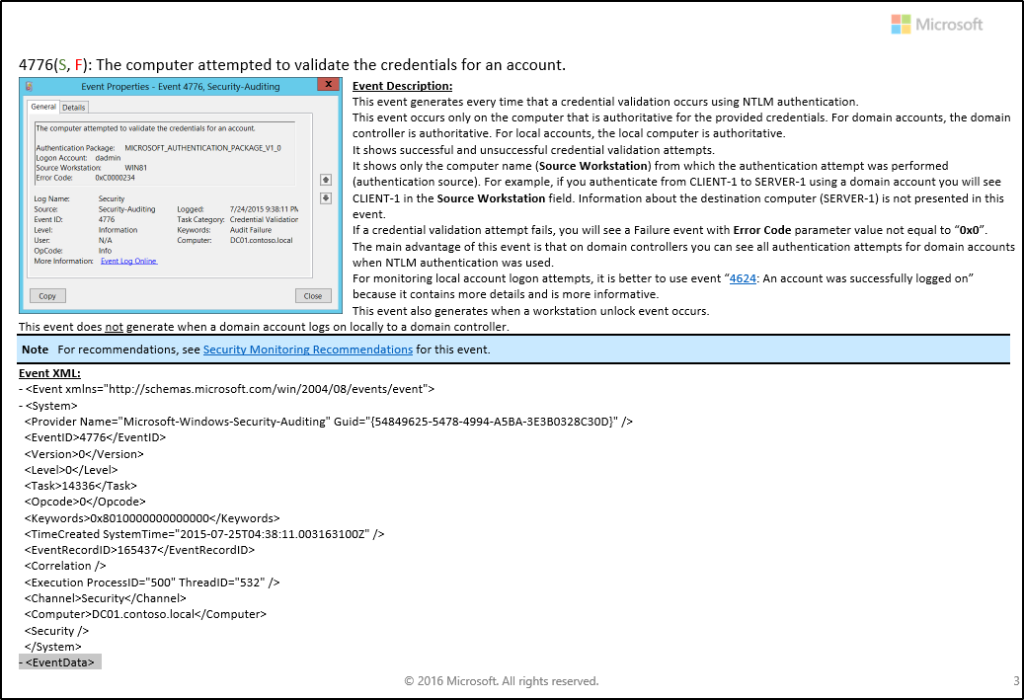
This is my write-up on THM’s Windows Event Logs Room.
Task 1: What are event logs?
Event logs essentially contain the records of events or activities that have transpired in a machine or host, that would help system administrators, IT technicians, etc, audit and trouble shoot issues in the system.
But for blue teams, windows event logs serve a different purpose. These logs are analyzed for malicious activities or indicators of compromise. Windows Event Logs can also be forwarded to SIEMs where analyst can aggregate, analyze, and correlate log data from various sources to provide security insights of a network.
For a Linux system, the logging system is knows as Syslog.
Task 2: Event Viewer
The Windows Event Logs are stored with an .evt or .evtx extension and are located in C:\\Windows\\System32\\winevt\\Logs.
Before moving on to Event Viewer, we first need to understand the different elements of a Windows Event Logs system. This would help us understand where to look at if we are trying to solve an issue or analyzing a specific kind of event.
- System Logs: Records events associated with the Operating System segments. They may include information about hardware changes, device drivers, system changes, and other activities related to the device.
- Security Logs: Records events connected to logon and logoff activities on a device. The system’s audit policy specifies the events.
- Application Logs: Records events related to applications installed on a system. The main pieces of information include application errors, events, and warnings.
- Directory Service Events: Active Directory changes and activities are recorded in these logs, mainly on domain controllers.
- File Replication Service Events: Records events associated with Windows Servers during the sharing of Group Policies and logon scripts to domain controllers, from where they may be accessed by the users through the client servers.
- DNS Event Logs: DNS servers use these logs to record domain events and to map out
- Custom Logs: Events are logged by applications that require custom data storage. This allows applications to control the log size or attach other parameters, such as ACLs, for security purposes.
The following table describes the five event types used in event logging.
| Event type | Description |
|---|---|
| Error | An event that indicates a significant problem such as loss of data or loss of functionality. For example, if a service fails to load during startup, an Error event is logged. |
| Warning | An event that is not necessarily significant, but may indicate a possible future problem. For example, when disk space is low, a Warning event is logged. If an application can recover from an event without loss of functionality or data, it can generally classify the event as a Warning event. |
| Information | An event that describes the successful operation of an application, driver, or service. For example, when a network driver loads successfully, it may be appropriate to log an Information event. Note that it is generally inappropriate for a desktop application to log an event each time it starts. |
| Success Audit | An event that records an audited security access attempt that is successful. For example, a user’s successful attempt to log on to the system is logged as a Success Audit event. |
| Failure Audit | An event that records an audited security access attempt that fails. For example, if a user tries to access a network drive and fails, the attempt is logged as a Failure Audit event. |
Event Viewer
The Windows Event Logs can be accessed with three methods; Event Viewer, Wevtutil.exe (command-line), and Get-WinEvent (PowerShell). The latter two methods will be discussed in the succeeding tasks.
Event Viewer allows interaction with and analyzing the logs in a GUI application.
Event Viewer can be started by right-clicking the Windows icon and selecting Event Viewer.
Or by typing “eventvwr.msc” in the command line.
Answer the questions below
For the questions below, use Event Viewer to analyze Microsoft-Windows-PowerShell/Operational log.
What is the Event ID for the first recorded event?
Answer: 40961
Open Event Viewer and go to Applications and Services Logs then to Microsoft > Powershell > Operational log.
The first event is found at the bottom of the window pane. We can also click on “Date and Time” column to sort the events based on the date and time of the occurrence of events.
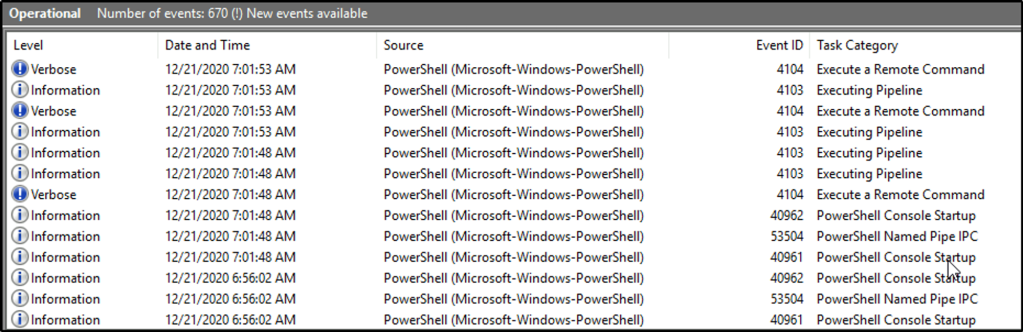
Filter on Event ID 4104. What was the 2nd command executed in the PowerShell session?
Answer: whoami
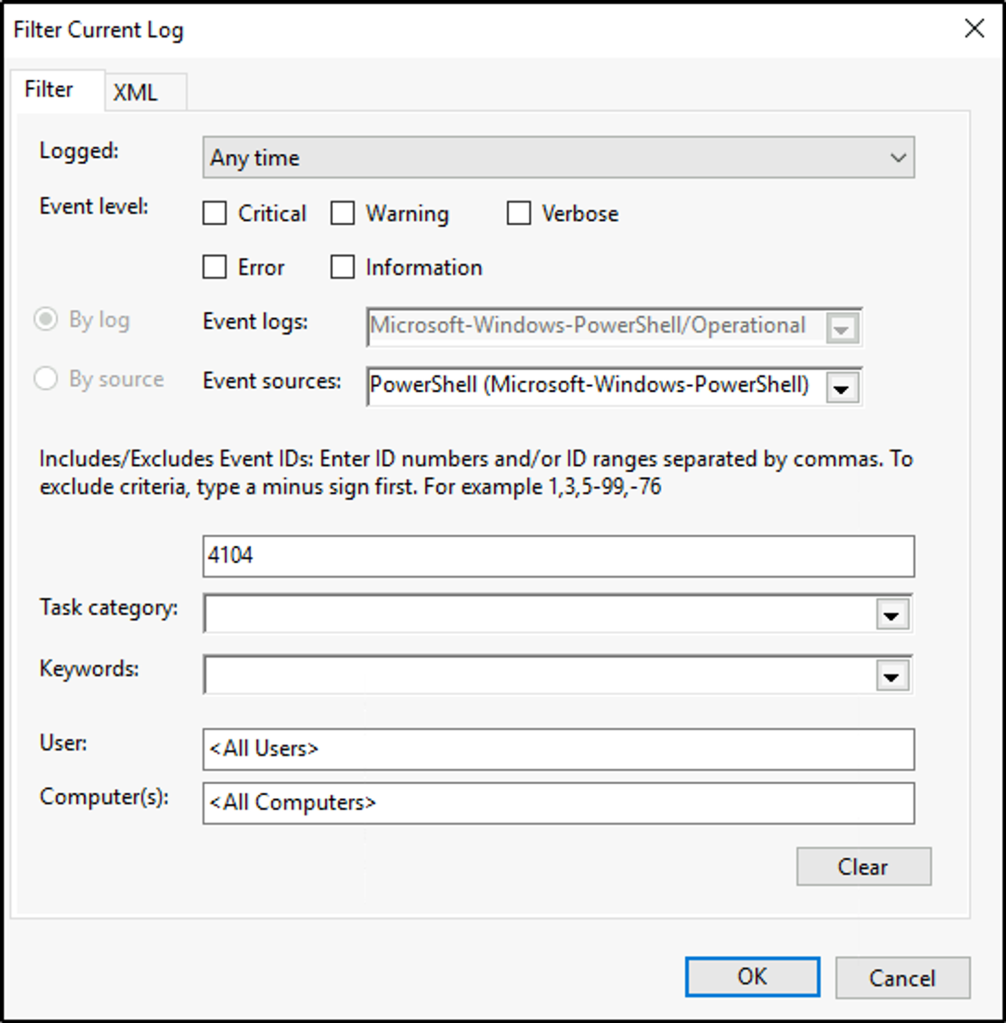
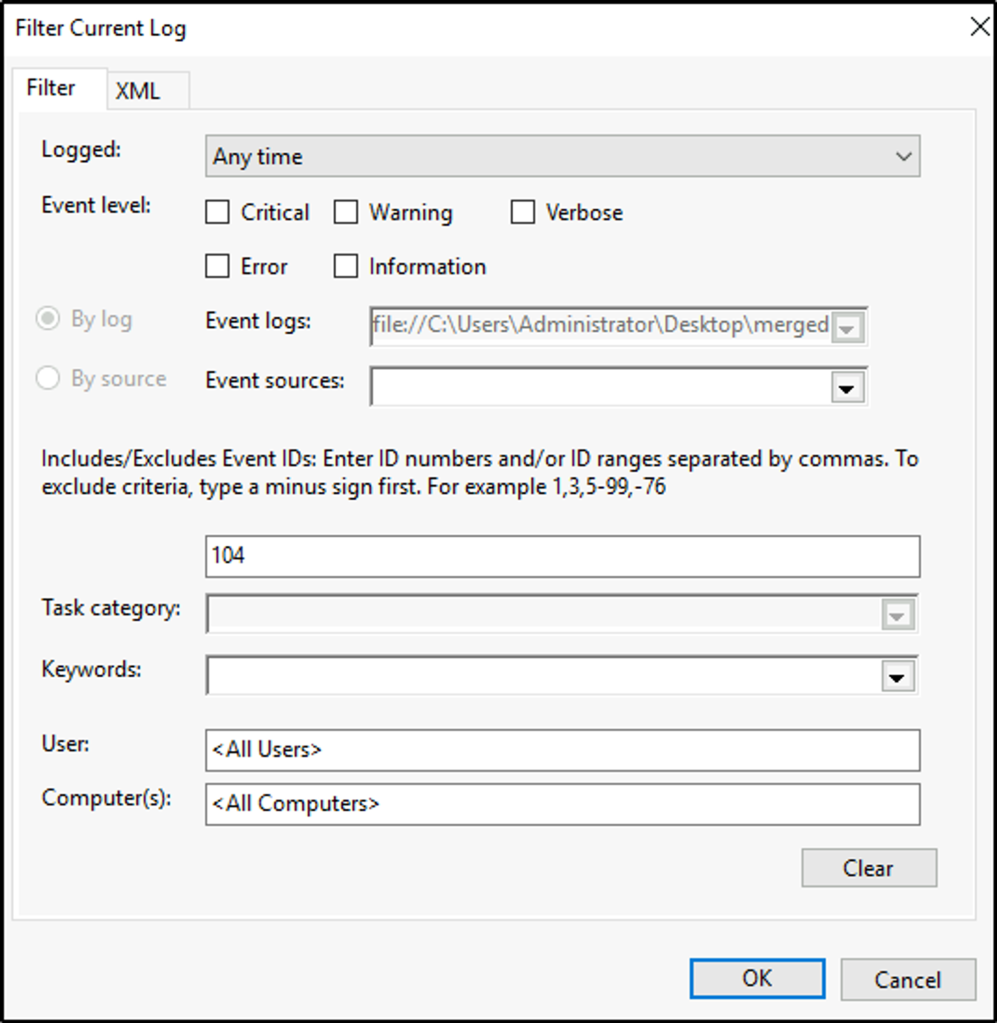
To create a filter, go to the right pane. Under “Operational” click on “Filter current Log”
We will filter the events with the Event ID 4104.
Once the results are in, sort the events based on date and time. Select the second event. Select the “Details” tab and the PowerShell command is displayed with the tag “ScriptBlockText”.
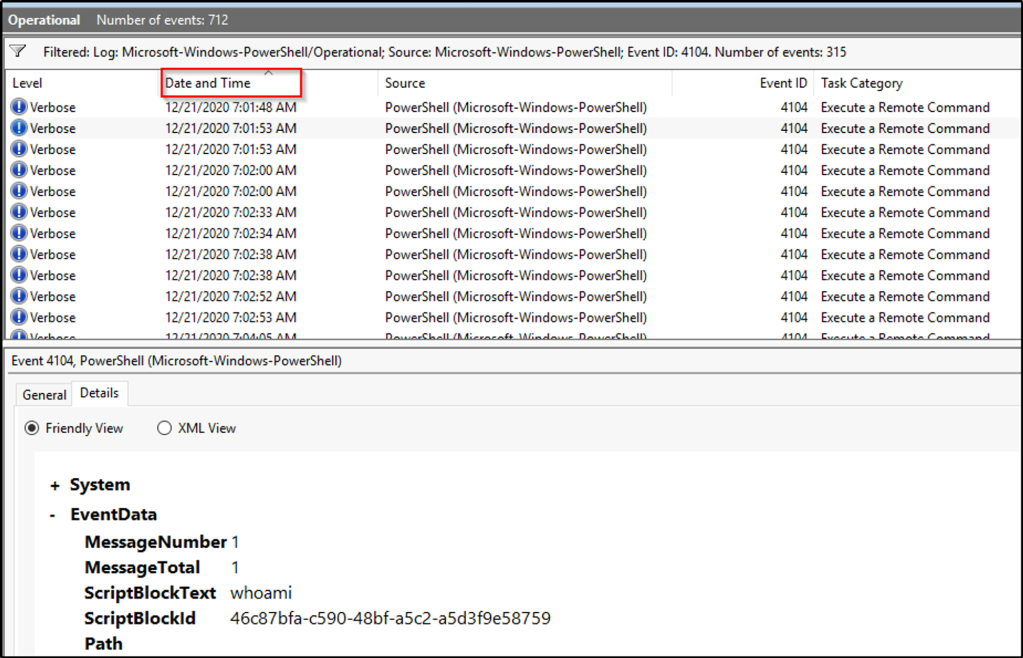
What is the Task Category for Event ID 4104?
Answer: Execute a Remote Command
We can find the answer by looking at the middle pane, similar to the image above. The “Task Category” column shows the category for Event ID 4104.
Analyze the Windows PowerShell log. What is the Task Category for Event ID 800?
Answer: Pipeline Execution Details
Clear the filter first. We would be returned to the same PowerShell event logs.
The middle pane, under the “Task Category” column would show the task category for Event ID 800.

Task 3: wevtutil.exe
Wevtutil.exe (Windows Event Utility) is a command line tool that would help us query event logs. By writing scripts with this tool, we would be more efficient in sifting through thousands of event logs.
To access its help files, we will run wevtutil.exe /?.
The tool would follow this syntax.
- wevtutil COMMAND [ARGUMENT [ARGUMENT] …] [/OPTION:VALUE [/OPTION:VALUE] …]
The commands are the following:
el  | enum-logs        List log names.
gl  | get-log          Get log configuration information.
sl  | set-log          Modify configuration of a log.
ep  | enum-publishers  List event publishers.
gp  | get-publisher    Get publisher configuration information.
im  | install-manifest Install event publishers and logs from manifest.
um  | uninstall-manifest Uninstall event publishers and logs from manifest.
qe  | query-events     Query events from a log or log file.
gli | get-log-info     Get log status information.
epl | export-log       Export a log.
al  | archive-log      Archive an exported log.
cl  | clear-log        Clear a log.
Note: We can use the short or long versions of the command, example el or enum-logs
Common options are;
Common Options:

/{r | remote}:VALUE
If specified, run the command on a remote computer. VALUE is the remote computer name. Options /im and /um do not support remote operations.

/{u |username}:VALUE
Specify a different user to log on to the remote computer. VALUE is a user name in the form of domain\\user or user. Only applicable when option /r is specified.

/{p | password}:VALUE
Password for the specified user. If not specified, or if VALUE is "*", the user will be prompted to enter a password. Only applicable when the /u option is specified.

/{a | authentication}:[Default|Negotiate|Kerberos|NTLM]
Authentication type for connecting to remote computer. The default is Negotiate.

/uni | unicode}:[true|false]
Display output in Unicode. If true, then output is in Unicode.

To learn more about a specific command, type the following:

wevtutil COMMAND /?
If we want to know how to use a specific command, as provided in the help files, we will use wevtutil COMMAND /?. For example, if we want to get more information on the command qe (query-events), we would use wevtutil qe /?.
More info can be found on docs.microsoft.com.
Answer the questions below
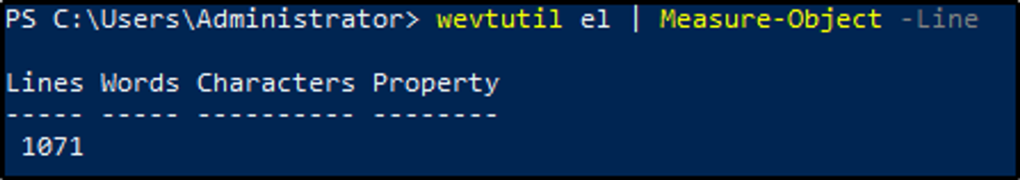
How many log names are in the machine?
Answer: 1071
The command el would list the log names and the results would then be piped to the next command to count the list of log names by line.
wevtutil el | Measure-Object -Line
What event files would be read when using the query-events command?
Answer: event log, log file, structured query
For us to find more info about the command, we would use wevtutil qe /?.

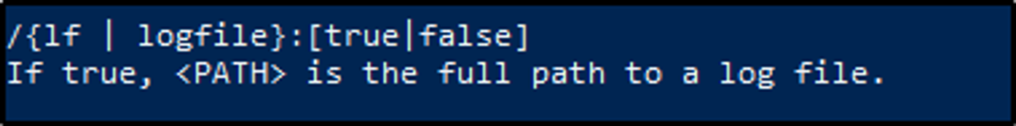
What option would you use to provide a path to a log file?
Answer: /lf:true
After running the command, we see the options we can use with qe. The option we would use to include a log file path is /lf:true.
What is the VALUE for /q?
Answer: query XPATH
Scrolling through the options, we can see the value for /q? is XPATH query.

The questions below are based on this command: wevtutil qe Application /c:3 /rd:true /f:text
What is the log name?
Answer: Application
From the command given to us, wevtutil is querying events from Application logs.
What is the /rd option for?
Answer: event read redirection
When we run wevtutil qe /?, we would see the options for this command. /rd would refer to event read redirection.

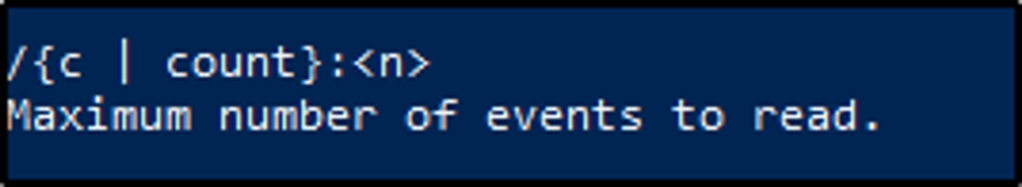
What is the /c option for?
Answer: Maximum number of events to read
/c option refers to the number of events that we wold want to query from the logs.
Task 4: Get-WinEvent
Get-WinEventis a Powershell cmdlet. Per Microsoft, the Get-WinEvent cmdlet “gets events from event logs and event tracing log files on local and remote computers.” The tool can provide information on event logs and event log providers. We can also combine events from different sources by using a single command and filtering these events with XPath queries, structured XML queries, and hash table queries.
Note: The Get-WinEvent cmdlet replaced the Get-EventLog cmdlet.
Refer to the Get-Help information online at docs.microsoft.com.
Examples of how to use Get-WinEvent
Example 1: Get all logs from a computer
The first list will be classic logs, then by new Windows Event logs. RecordCount can have zero or null logs.
Example 2: Get event log providers and log names
This will get us the event log providers and their associated logs. The Name is the provider, and LogLinks is the log that is written to.
Get-WinEvent -ListProvider *
Example 3: Log filtering
Log filtering allows us to select events from an event log. We can then filter event logs from a specific Provider using the Where-Object cmdlet:
Get-WinEvent -LogName Application | Where-Object { $_.ProviderName -Match 'WLMS' }
Where-Object is inefficient to use when working with large event logs. Therefore, the suggested Get-WinEvent cmdlet’s FilterHashtable parameter is recommended to filter event logs.
Get-WinEvent -FilterHashtable @{
LogName='Application'
ProviderName='WLMS'
}
Get-WinEvent -FilterHashtable @{ LogName='Application'; ProviderName= 'WLMS'}
The syntax of a hash table is as follows:
@{ <name> = <value>; [<name> = <value> ] ...}
Guidelines for defining a hash table are:
- Begin the hash table with an @ sign.
- Enclose the hash table in braces {}
- Enter one or more key-value pairs for the content of the hash table.
- Use an equal sign (=) to separate each key from its value.
Note: Using semicolon is not needed if each key/value are separated with a new line, as in the first set of commands above for the -FilterHashtable for ProviderName='WLMS'.
Below is a table that displays the accepted key/value pairs for the Get-WinEvent FilterHashtable parameter.
| Key name | Value data type | Accepts wildcard characters? |
|---|---|---|
| LogName | <String[]> |
Yes |
| ProviderName | <String[]> |
Yes |
| Path | <String[]> |
No |
| Keywords | <Long[]> |
No |
| ID | <Int32[]> |
No |
| Level | <Int32[]> |
No |
| StartTime | <DateTime> |
No |
| EndTime | <DateTime> |
No |
| UserID | <SID> |
No |
| Data | <String[]> |
No |
<named-data> |
<String[]> |
No |
Check the official Microsoft documentation docs.micro-soft.com for more info on querying using Filterhashtable.
Here is a command by @mubix on using Get-WinEvent -FilterHashtable
Get-WinEvent -FilterHashtable @{LogName='Microsoft-Windows-PowerShell/Operational'; ID=4104} | Select-Object -Property Message | Select-String -Pattern 'SecureString'
Answer the questions below
Answer the following questions using the online help documentation for Get-WinEvent
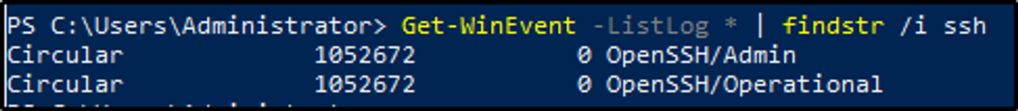
Execute the command from Example 1 (as is). What are the names of the logs related to OpenSSH?
Answer: OpenSSH/Admin,OpenSSH/Operational
We will use the command from example 1, then pipe the result to find the strings that matches ssh. We see two logs being displayed.
Get-WinEvent -ListLog * | findstr /i ssh
Execute the command from Example 8. Instead of the string Policy search for PowerShell. What is the name of the 3rd log provider?
Answer: Microsoft-Windows-PowerShell-DesiredStateConfiguration-FileDownloadManager
We will simply copy the command and change the string policy to Powershell. This will display all events relatd to the filter.
Get-WinEvent -ListProvider *Powershell*
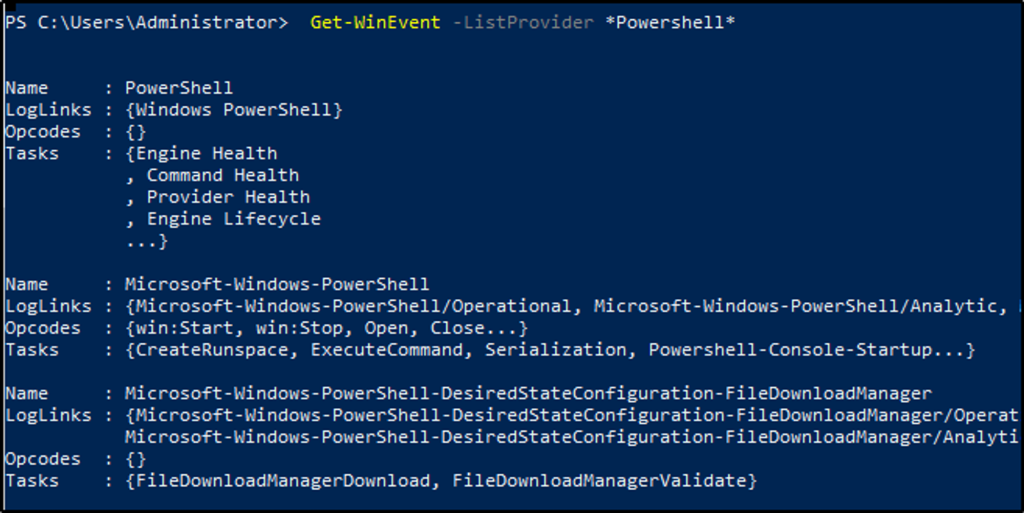
Alternatively, we can modify the command to display only the third log provider.
Get-WinEvent -ListProvider *Powershell* | Select-Object -Property Name -Skip 2 -First 1
Execute the command from Example 9. Use Microsoft-Windows-PowerShell as the log provider. How many event ids are displayed for this event provider?
Answer: 192
We will be using the provided command and changing the log provider to Microsoft-Windows-PowerShell. We will also be modifying it by adding Measure-Object -Line to count the results by line.

(Get-WinEvent -ListProvider Microsoft-Windows-PowerShell).Events | Format-Table Id, Description | Measure-Object -Line
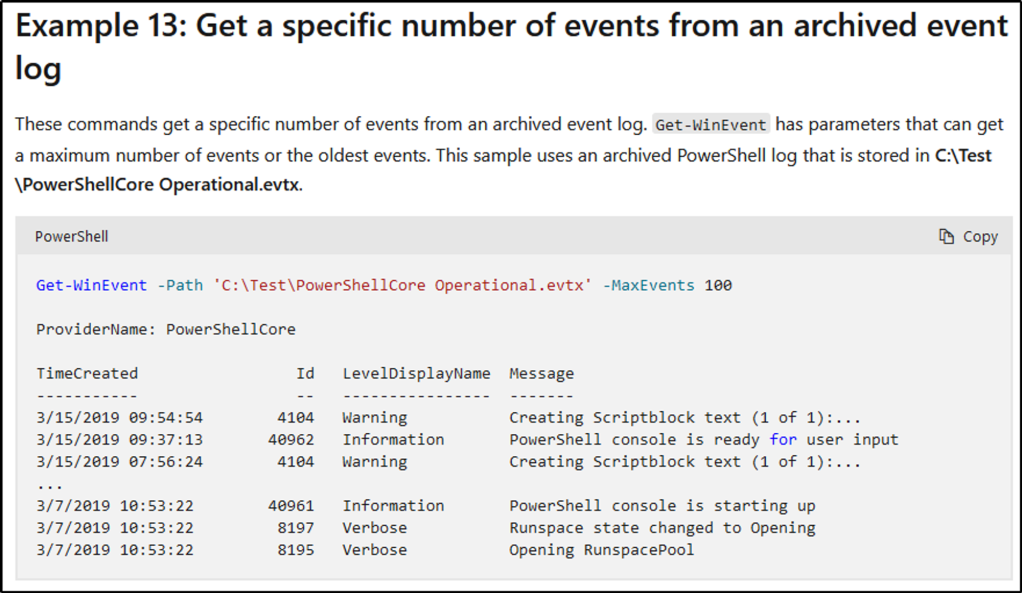
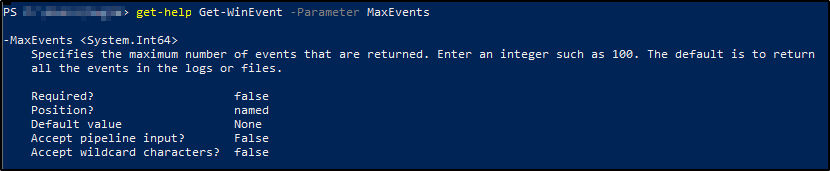
How do you specify the number of events to display?
Answer: -MaxEvents
Example 13 provided us the options we can use to display only a certain number of events.
If we want to know more about -MaxEvents, we could use the Get-Help cmdlet.
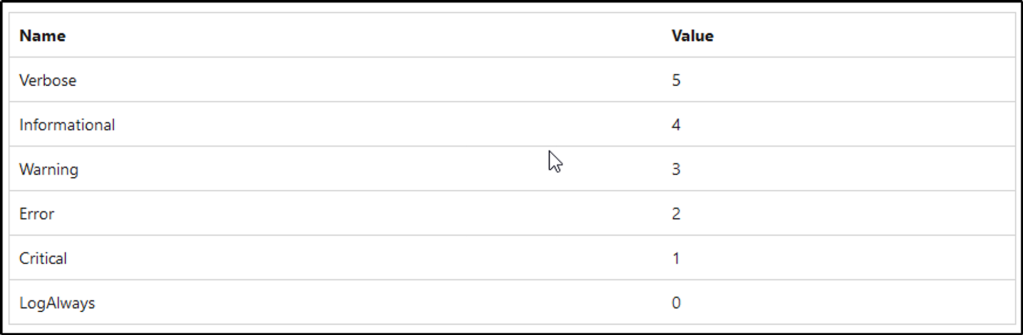
When using the FilterHashtable parameter and filtering by level, what is the value for Informational?
Answer: 4
This resource for FilterHashtable contains the numerical value of each Level.
Task 5: XPath Queries
The third method of filtering events is by using XPath or XML Path Language, which was created by W3C. The Windows Event Log supports a subset of XPath 1.0.
Here is an example of an XPath query along with its explanation:
// The following query selects all events from the channel or log file where the severity level is less than or equal to 3 and the event occurred in the last 24 hour period.
XPath Query: *[System[(Level <= 3) and TimeCreated[timediff(@SystemTime) <= 86400000]]]
See docs.microsoft.com for more examples of XPath queries.
Note: An XPath event query starts with ‘*’ or ‘Event‘. wevtutil and Get-WinEvent support XPath queries.
To create an XPath query, Event Viewer would be the reference point.
We look at the bottom of the middle pane, click on the “Details” tab and select the “XML View”. The sructure presented would help use construct a valid XPath query.
The first tag is the starting point. This can either be an ‘*' or Event.
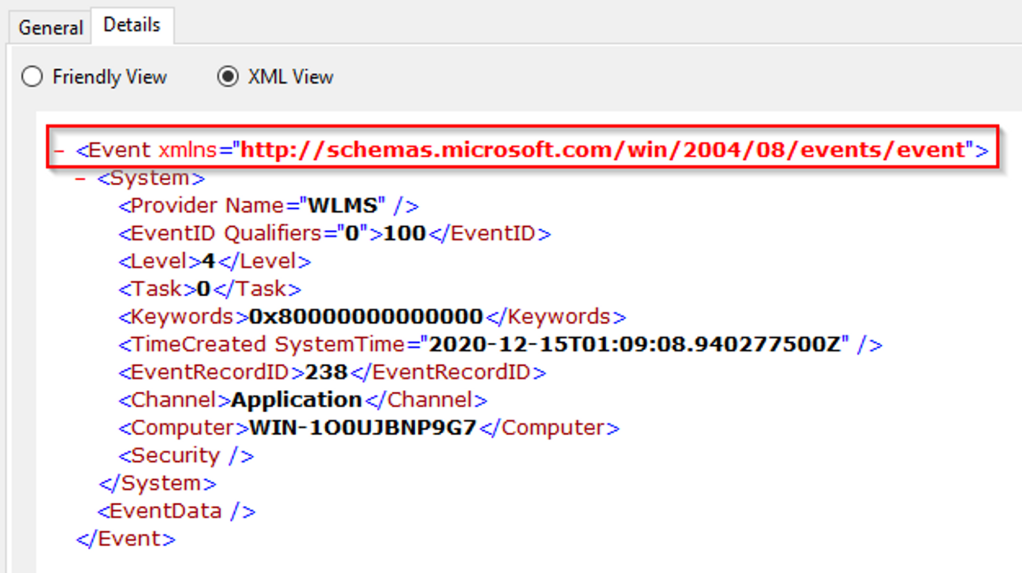
The command would look like this:
Get-WinEvent -LogName Application -FilterXPath '*'Working our way down, the next tag is System.

Let’s add that to our command:
Get-WinEvetnt -LogName Application -FilterXPath '*/System/'Next is the EventID tag. We would use the tag name and include the Event ID we want to filter. In this example, the Event ID is 100.
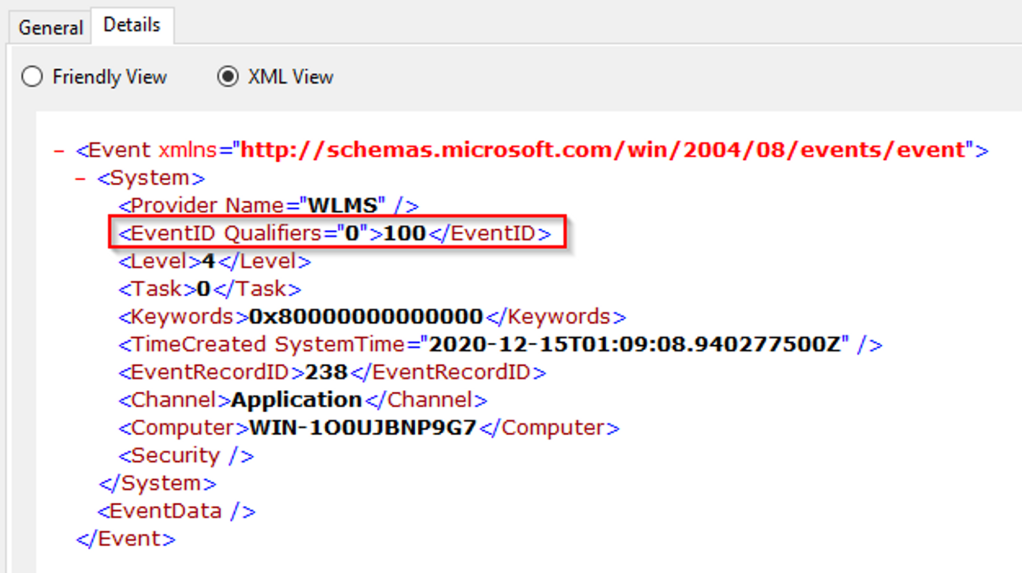
The command would look like something like this:
Get-WinEvetnt -LogName Application -FilterXPath '*/System/EventID=100'The following would be the result if using wevtutil.exe and XPath to query for the same event log and ID.:
wevtutil.exe qe Application /q:*/System[EventID=100] /f:text /c:1
Two additional options were added to filter only one event with no XML tags.
If we want to query a different element, such as the Provider Name, we need to use the Name attribute of Provider.
Therefore, to query for the Provider name with XPath:
Get-WinEvent -LogName Application -FilterXPath '*/System/Provider[@Name="WLMS"]'
We can also combine two queries in one command.
For example, if we want to query Event IDs of 100 with the Provider Name “WLMS”, we would arrive at this command:
Get-WinEvent -LogName Application -FilterXPath '*/System/Provider[@Name="WLMS"]'
Creating XPath queries with EventData
Querying for elements within EventData with XPath will be a little bit different
Note: The EventData element doesn’t always contain information.
We will use the below XML view of an event to build the XPath query
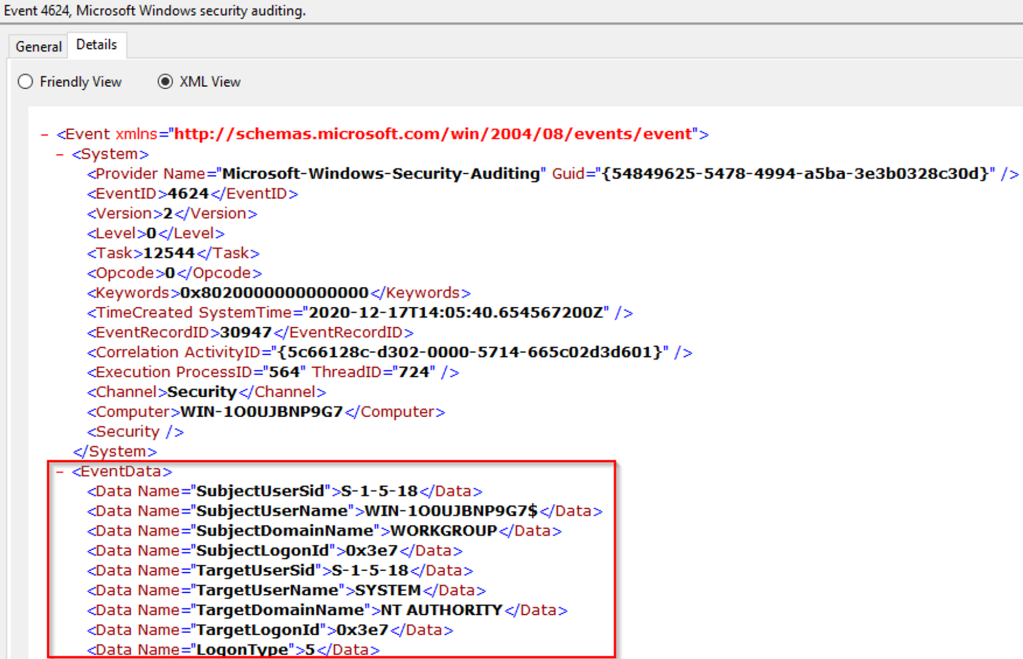
For this example, we will be creating a query for the TargetUserName of System. The XPath query would be:
Get-WinEvent -LogName Security -FilterXPath '*/EventData/Data[@Name="TargetUserName"]="System"' -MaxEvents 1
The parameter -MaxEvents will return just 1 event.
Read the official Microsoft XPath Reference for more information.
Answer the questions below
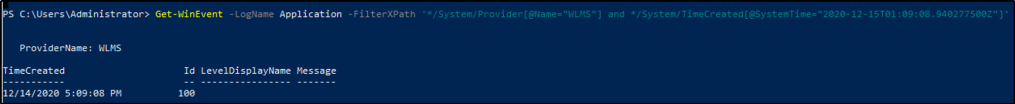
Using the knowledge gained on Get-WinEvent and XPath, what is the query to find WLMS events with a System Time of 2020-12-15T01:09:08.940277500Z?
Answer: Get-WinEvent -LogName Application -FilterXPath ‘*/System/Provider[@Name=”WLMS”] and */System/TimeCreated[@SystemTime=”2020-12-15T01:09:08.940277500Z”]’
The steps provided above in building an XPath query would help us create the command.
Using Get-WinEvent and XPath, what is the query to find a user named Sam with an Logon Event ID of 4720?
Answer: Get-WinEvent -LogName Security -FilterXPath ‘*/EventData/Data[@Name=”TargetUserName”]=”Sam” and */System/EventID=4720’
We will be be creating two queries in one command. The first query is to query within the EventData the tag TargetUsername, and specifying the username to be “Sam”. The second query is within Event, looking through System, and specifying the EventID of 4720.
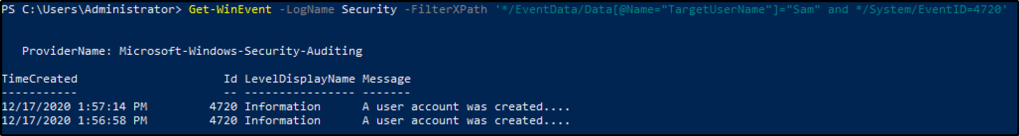
Based on the previous query, how many results are returned?
Answer: 2
We got two results.
Based on the output from the question #2, what is Message?
Answer: A user account was created
The query filters user account creation.
Still working with Sam as the user, what time was Event ID 4724 recorded? (MM/DD/YYYY H:MM:SS [AM/PM])
Answer: 12/17/2020 1:57:14 PM
Working with the same command from above, we just need to change the EventID to 4724.
Get-WinEvent -LogName Security -FilterXPath '*/EventData/Data[@Name="TargetUserName"]="Sam" and */System/EventID=4724'
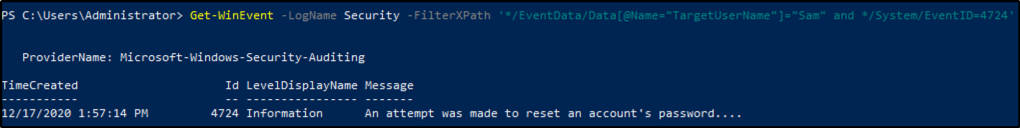
What is the Provider Name?
Answer: Microsoft-Windows-Security-Auditing
We found the answer when we run the command from above.
Task 6: Event IDs
With the large number of Event IDs in use, we will definitely need resources to help us monitor and hunt events. This section will be covering us in that aspect.
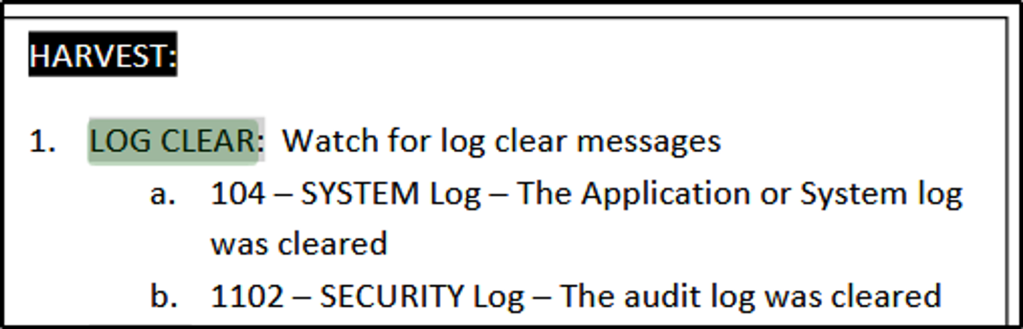
First on the list is The Windows Logging Cheat Sheet (Windows 7 – Windows 2012). The last version update is October 2016, but it’s still a good resource. The document covers a few things that need to be enabled and configured and what event IDs to look for based on different categories, such as Accounts, Processes, Log Clear, etc.
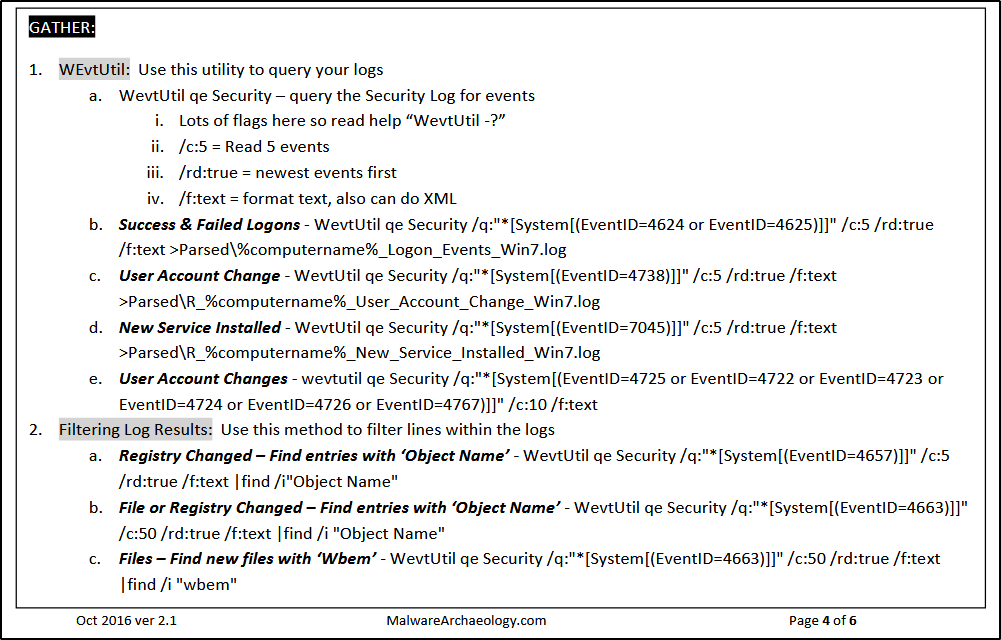
From the resource, if we want to detect if a new service was installed, look for Event ID 7045 within the System Log. The command would be as follows
wevtutil qe System /q:"*/System[EventID=7045]" /c:5 /rd:true /f:text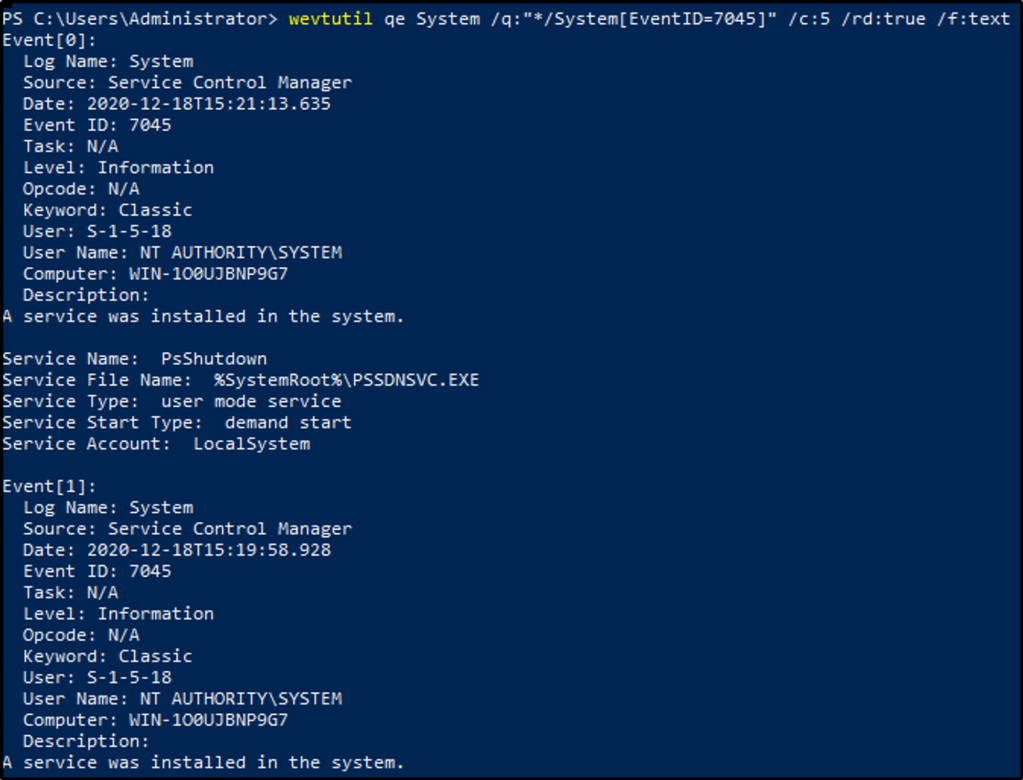
Spotting the Adversary with Windows Event Log Monitoring is another resource.
I was unable though to connect and download the resource.
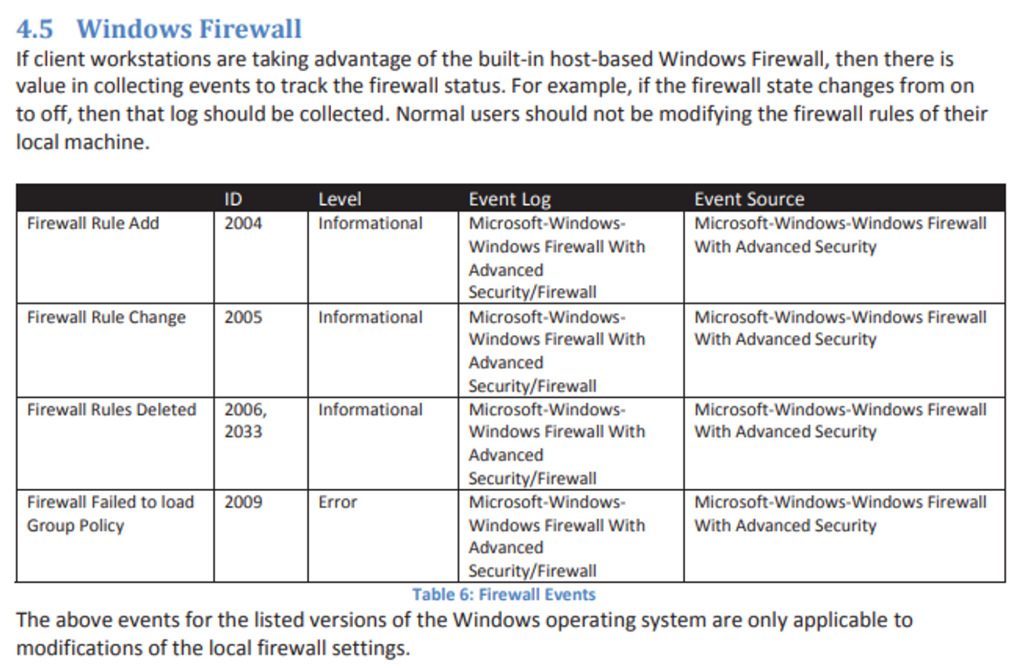
But from the room, a snippet is provided from the document where we see Event IDs related to Firewall Rules.
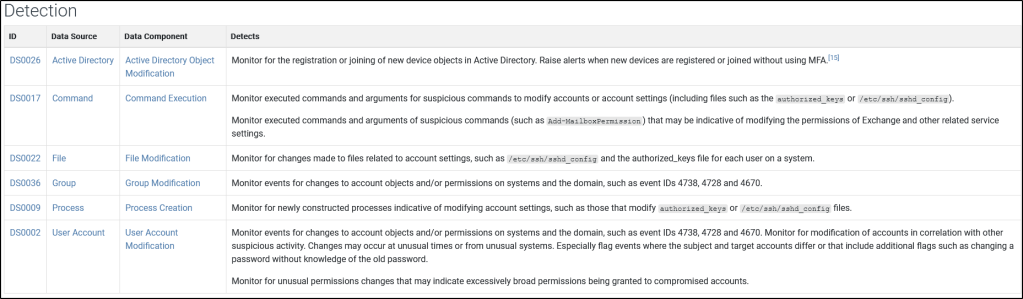
MITRE ATT&CK is also on the list for monitoring or hunting Event IDs.
We can look at a Technique and identify the related Event IDs that we should monitor and hunt. For example, if we look at ATT&CK ID T1098 (Account Manipulation), the “Detection” section contains the Event IDs that are triggered.
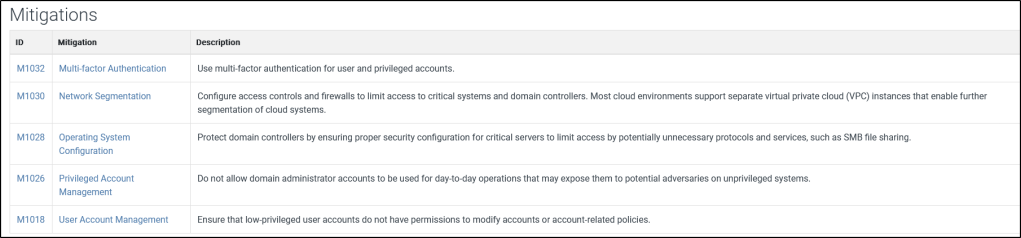
The MITRE ATT&CK framework also contains information on how to mitigate each techniques.
The last two resources are from Microsoft:
- Events to Monitor (Best Practices for Securing Active Directory)
- The Windows 10 and Windows Server 2016 Security Auditing and Monitoring Reference (a comprehensive list [over 700 pages])
- Here is a snippet of the 700-page Windows 10 and Windows Server 2016 Security Auditing and Monitoring Reference
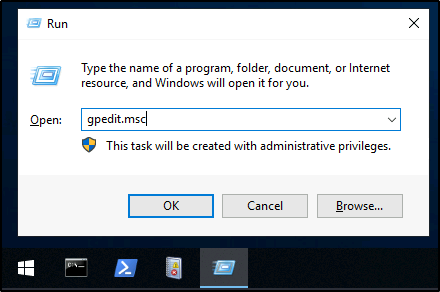
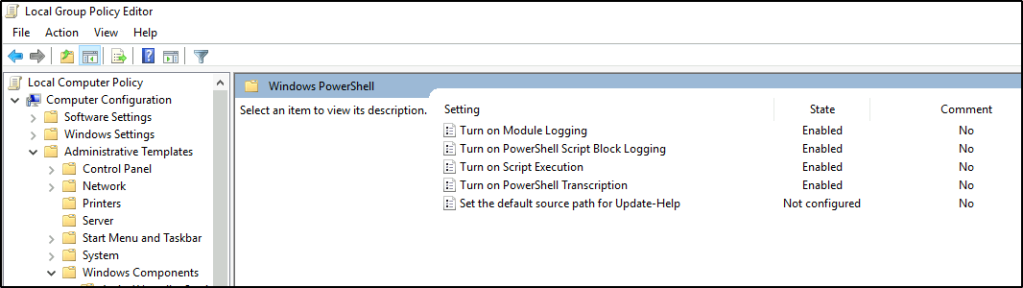
Note: There are certain events that are not generated by default, one of them is PowerShell logging. This feature can be enabled via Group Policy or the Registry.
Local Computer Policy > Computer Configuration > Administrative Templates > Windows Components > Windows PowerShell
Press the Windows icon on the keyboard + R to open the Run dialog and type gedit.msc to open the Group Policy Management Console.
Some resources to provide more information about enabling this feature, along with its associated event IDs:
- About Logging Windows
- Greater Visibility Through PowerShell Logging
- Configure PowerShell logging to see PowerShell anomalies in Splunk UBA
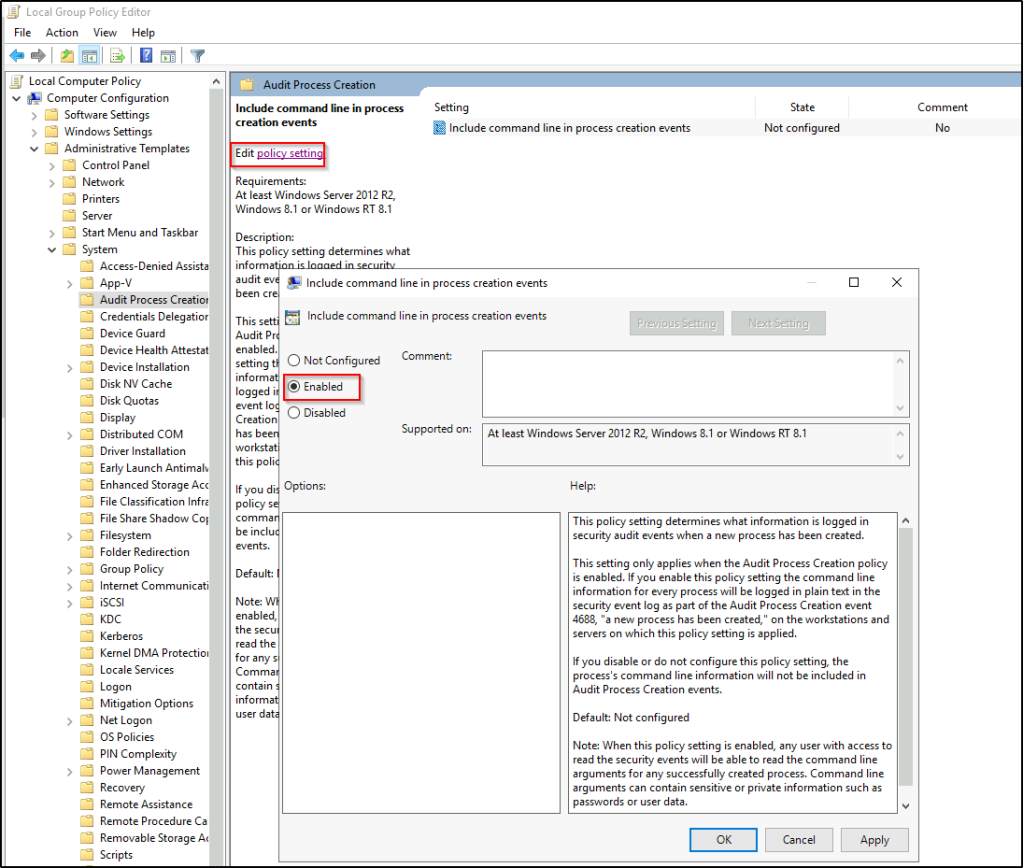
Another feature to enable/configure is Audit Process Creation, which will generate event ID 4688 and will allow command-line process auditing.
Local Computer Policy > Computer Configuration > Administrative Templates > System > Audit Process Creation

We have already enabled Audit Process Creation
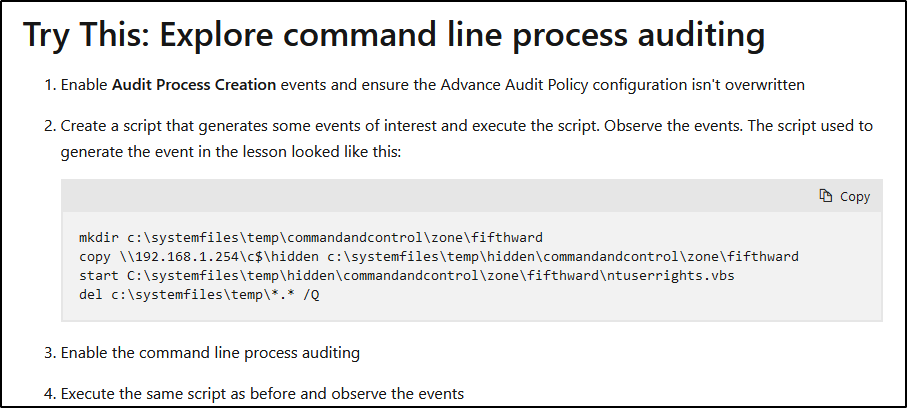
We will now perform step 2.
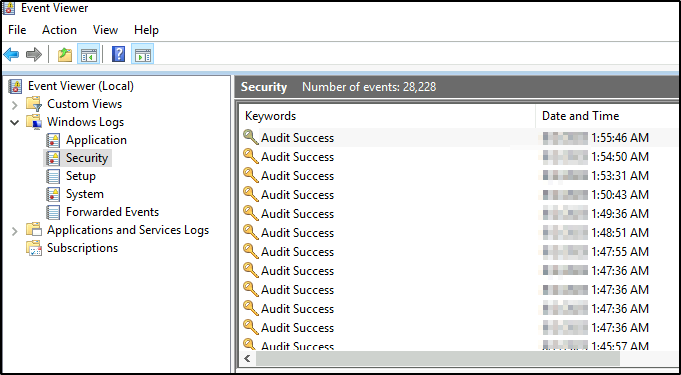
I run a simple command of whoami
Go to Event Viewer to see if the command was logged. We should look under Windows Logs > Security. It can be observed that it was not logged at all.
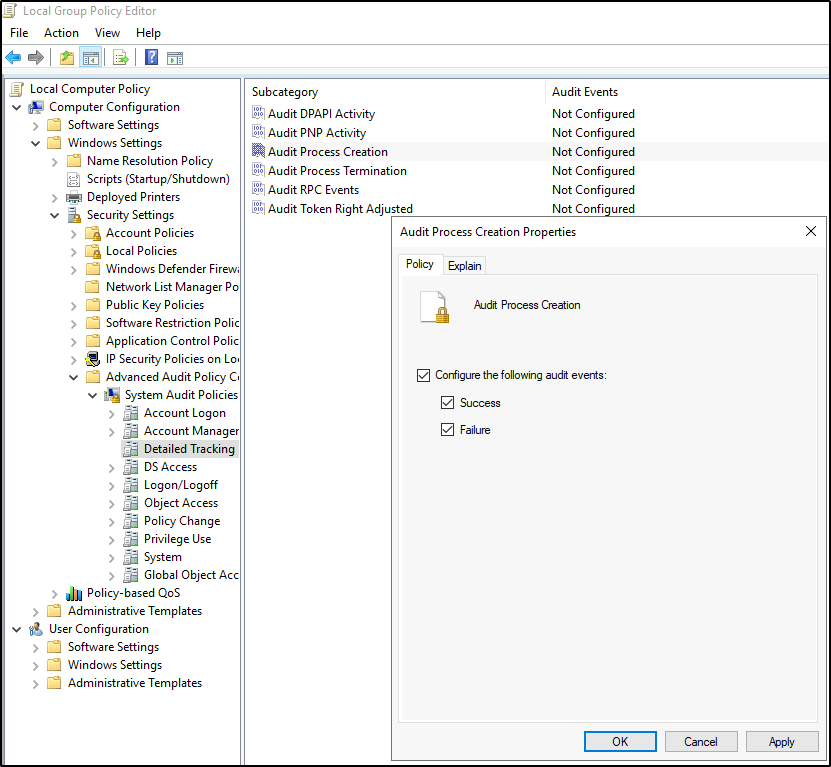
Now for step 3, Enable the command line process auditing.
- In the Group Policy Editor, go to “Computer Configuration” > “Windows Settings” > “Security Settings” > “Advanced Audit Policy Configuration” > “Audit Policies” > “Detailed Tracking.”
- In the right pane, locate the “Audit Process Creation” policy, and double-click on it to open the properties.
- In the properties window, select the “Define these policy settings” option.
- Check the “Success” and “Failure” boxes to enable auditing for successful and failed process creations. Click Apply and Ok.
We’ll run the same command and notice if there’s a difference.
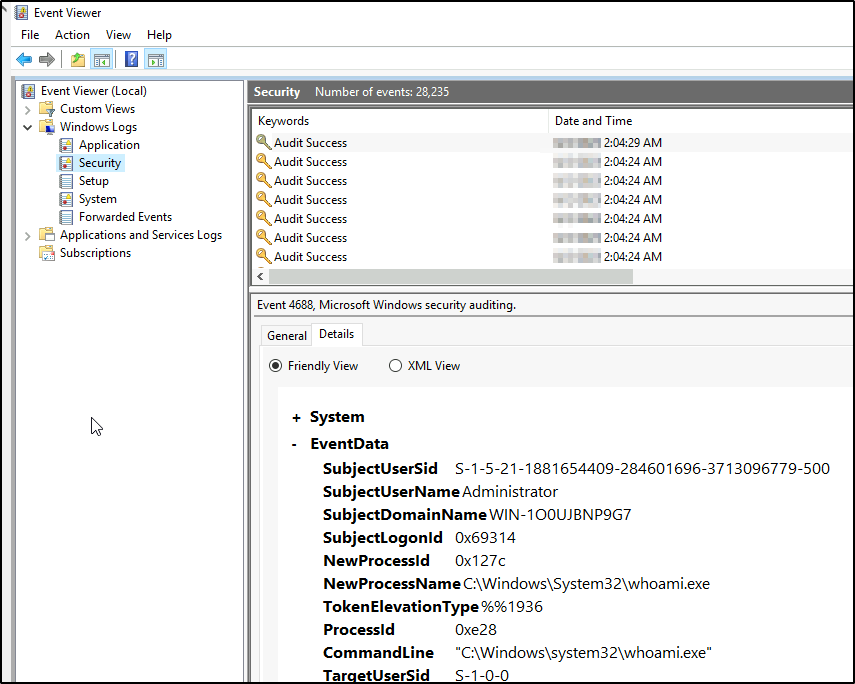
The command was logged this time.
The steps to test the configuration are at the bottom of the document.
The resources are not exhaustive list, hence we need to read more about this topic.
To effectively monitor and hunt, we need to know what to look for.
Answer the questions below
I’m ready to look at some event logs…
Task 7: Putting theory into practice
Let’s now test our newly acquired pool of knowledge on Windows Event Logs with the different scenarious presented below.
The next scenarios/questions are based on the external event log file titled merged.evtx found on the Desktop.
Scenario 1 (Questions 1 & 2): The server admins have made numerous complaints to Management regarding PowerShell being blocked in the environment. Management finally approved the usage of PowerShell within the environment. Visibility is now needed to ensure there are no gaps in coverage. You researched this topic: what logs to look at, what event IDs to monitor, etc. You enabled PowerShell logging on a test machine and had a colleague execute various commands.
Scenario 2 (Questions 3 & 4): The Security Team is using Event Logs more. They want to ensure they can monitor if event logs are cleared. You assigned a colleague to execute this action.
Scenario 3 (Questions 5, 6 & 7): The threat intel team shared its research on Emotet. They advised searching for event ID 4104 and the text “ScriptBlockText” within the EventData element. Find the encoded PowerShell payload.
Scenario 4 (Questions 8 & 9): A report came in that an intern was suspected of running unusual commands on her machine, such as enumerating members of the Administrators group. A senior analyst suggested searching for “C:\\Windows\\System32\\net1.exe“. Confirm the suspicion.
Answer the questions below
Open the merged.evtx file with event viewer
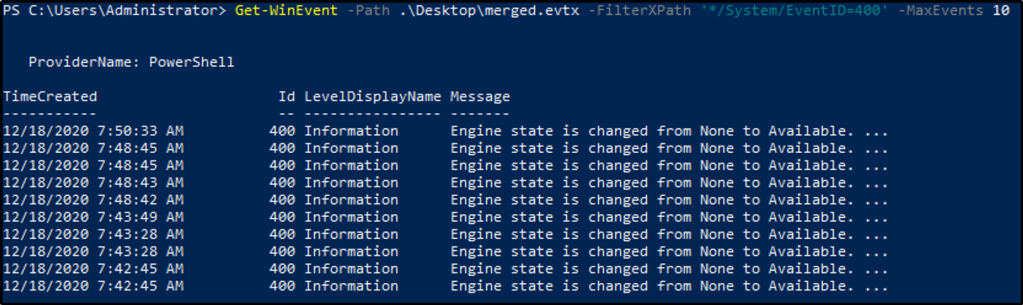
What event ID is to detect a PowerShell downgrade attack?
Answer: 400
A search on google would yield us about detecting PowerShell downgrade attacks. Here is an interesting article why attackers would downgrade to older versions of PowerShell.

What is the Date and Time this attack took place? (MM/DD/YYYY H:MM:SS [AM/PM])
Answer: 12/18/2020 7:50:33 AM
I used PowerShell for this task, added –Path parameter to indicate the source of the log file.
Get-WinEvent -Path .\\Desktop\\merged.evtx -FilterXPath '*/System/EventID=400' -MaxEvents 10
We can add the following to sort the results.
Sort-Object -Property TimeCreated -Descending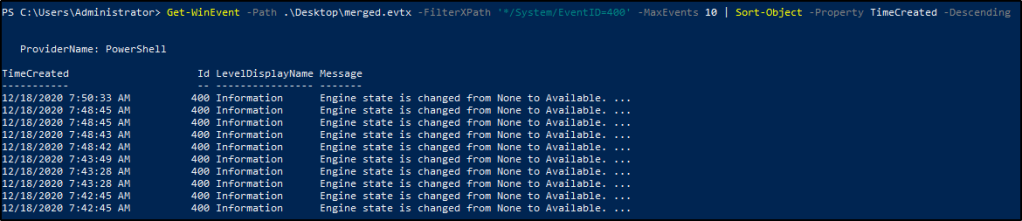
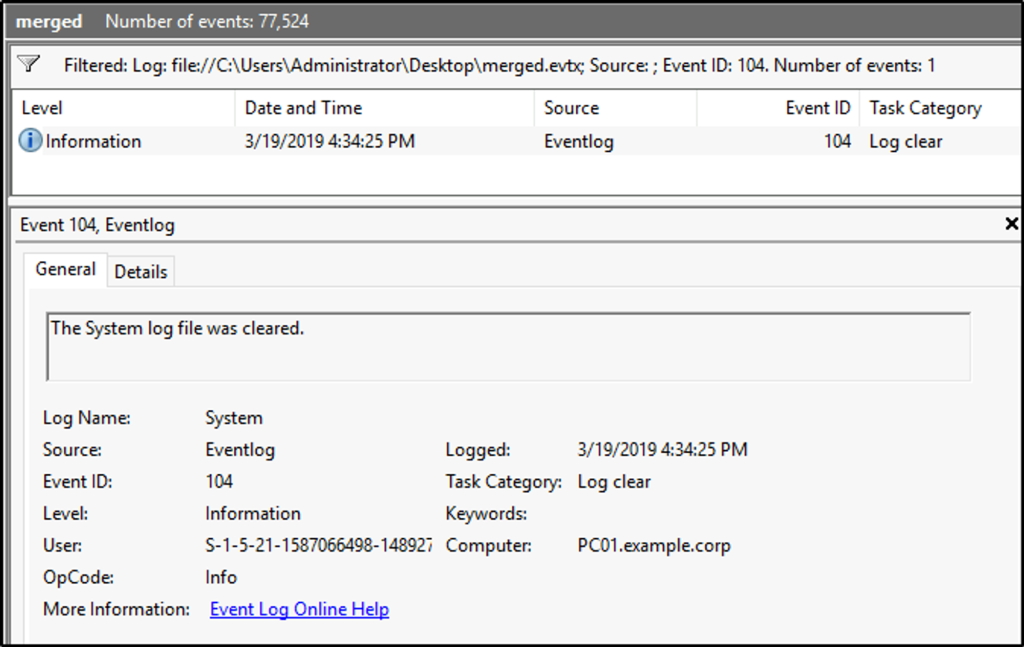
A Log clear event was recorded. What is the ‘Event Record ID’?
Answer: 27736
In one of the resources provided, an EventID of 104 is generated when the Application or System log were cleared.
Now that we know the Event ID, let’s filter the logs with eEentID 104.
Select the windows event. In the lower pane, click on the “Details” tab and select “XML View”. We now see the ID for the recorded event.
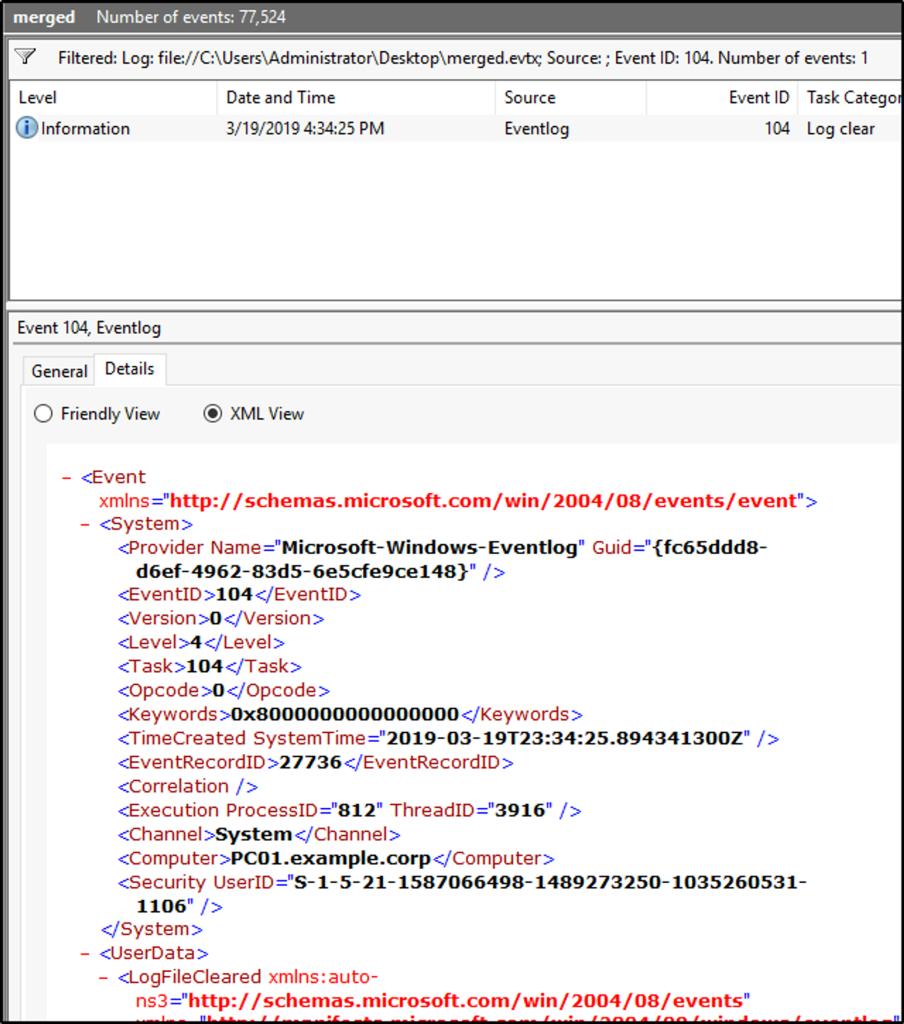
What is the name of the computer?
Answer: PC01.example.corp
The computer name is seen in the tag “Computer” or in the “General” tab.
What is the name of the first variable within the PowerShell command?
Answer: $Va5w3n8=
It is important to know, that only when Script Block Logging is enabled, that these blocks of code, when executed by PowerShell are logged. Such events are recorded with EventID 4104.
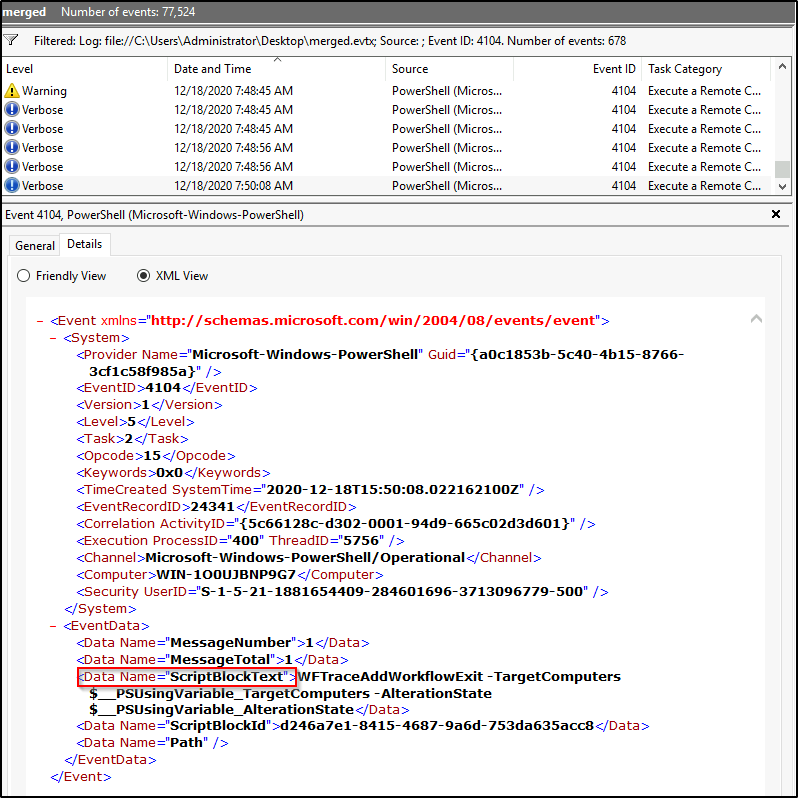
The following command would query, using XPath, all events with a 4104 ID, within “EventData” focusing on the tag “Data” that has the strings “ScriptBlockText”. Note: Variables always start with ‘$’.
Get-WinEvent -Path .\\Desktop\\merged.evtx -FilterXPath '*/System/EventID=4104 and */EventData/Data[@Name="ScriptBlockText"]' -Oldest -MaxEvents 1 | Format-List
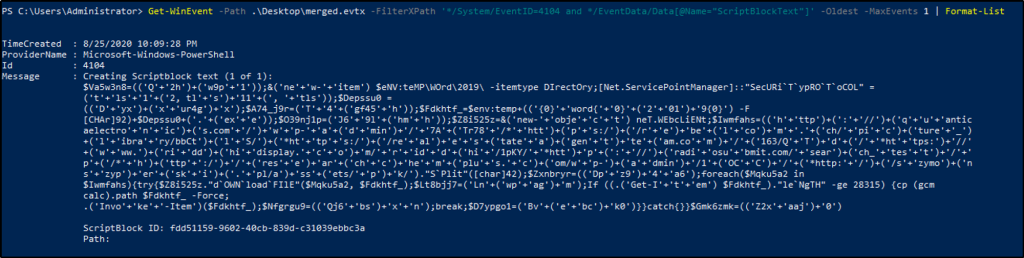
It took me a while to realize that the details displayed are incomplete, and I try not to rely on Event Viewer too much, because imagine if we have thousands of events to crumb through.
These commands would display all the info about the events and would also provide the answer for the next two questions.
Get-WinEvent -Path .\Desktop\merged.evtx -FilterXPath '*/System/EventID=4104 and */EventData/Data[@Name="ScriptBlockText"]' -Oldest -MaxEvents 1 | Select-Object -Property *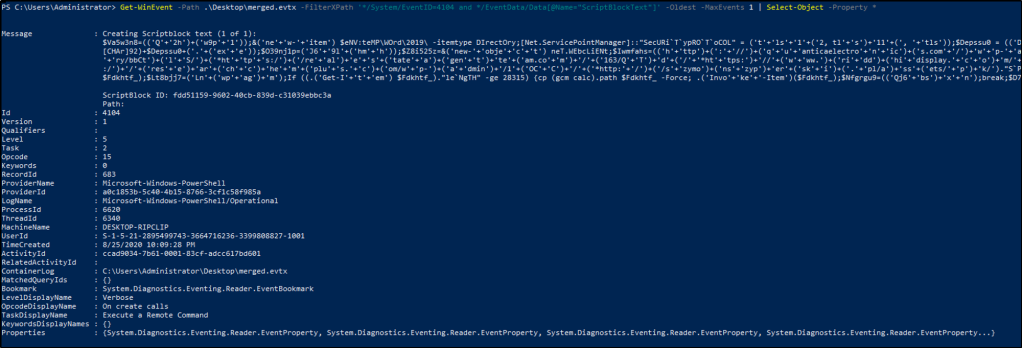
What is the Date and Time this attack took place? (MM/DD/YYYY H:MM:SS [AM/PM])
Answer: 8/25/2020 10:09:28 PM
What is the Execution Process ID?
Answer: 6620
What is the Group Security ID of the group she enumerated?
Answer:S-1-5-32-544
To confirm if she enumerated the “Administrators” group in her local machine, we would run the following commands. We will filter events with XPath within the elements of “EventData” and include the location of the suspected executed file. The piped results would display all the information about the queried events.
Get-WinEvent -Path .\merged.evtx -FilterXPath '*/EventData/Data[@Name="CallerProcessName"]="C:\Windows\System32\net1.exe"' | Select-Object -Property *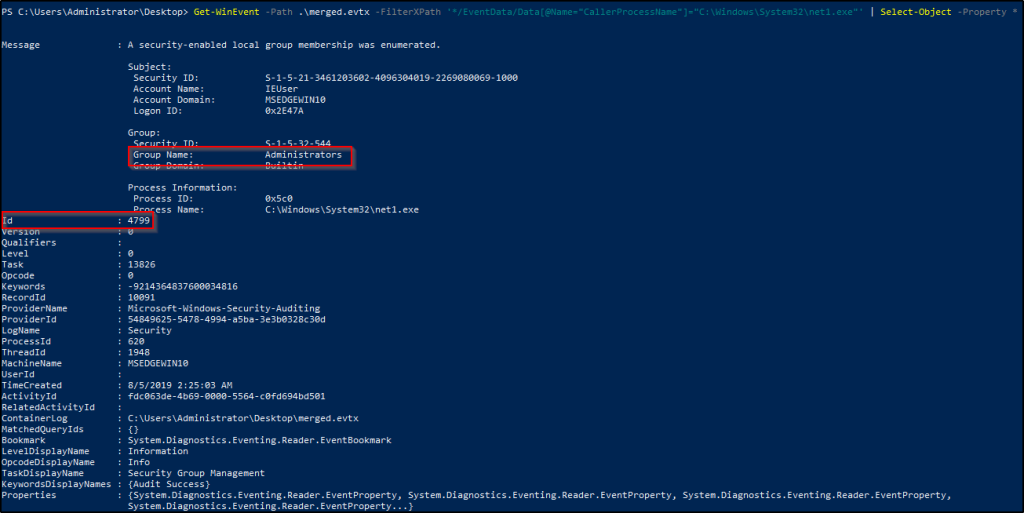
There were three events logged, but we are interested in the event where the local group “Administrators” was enumerated.
What is the event ID?
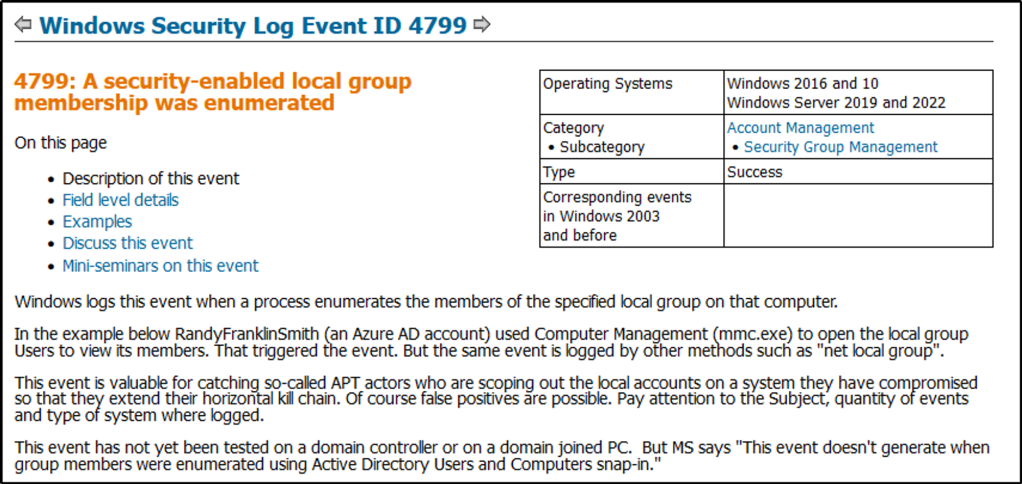
Answer: 4799
For reference, check this out.
Task 8: Conclusion
We have covered a lot about Windows Event Logs, the important Event IDs we should monitor and hunt, and how to query them with the different tools and techniques.
We also touched on the features that need to be enabled or configured so that they can be logged for further visibility.
Windows event logs from various endpoints are also forwarded to SIEMs for easy filtering of evnts, correlating rules, generating reports, and detecting suspicous activities.
TryHackme provided us parting gifts for additional reading:
- EVTX Attack Samples (a few were used in this room)
- PowerShell ❤ the Blue Team
- Tampering with Windows Event Tracing: Background, Offense, and Defense
That concludes this room.
Thank you for reading 🙂
Happy learning!.