
How to check Windows server logs (Windows Event Log Types. Microsoft Windows Server is an operating system that provides network administrators with a collection of enterprise level management features. Accordingly, some of these features include data storage, applications, security, network, and hardware management.
Similarly, Microsoft’s collection of desktop operating systems allow you to view event logs through a set of Administrative Tools. So, Windows Server offers similar features but in a more enterprise capacity. After all, event logging and tracing are important parts of running servers. Thus, this guide will explore how you can find Windows server logs and how to interpret the information from them.
Shall we start with How to check Windows server logs (Windows Event Log Types).
Understanding The Windows Event Log
If your servers are positioned in a fairly medium or large company, they may be collecting thousands of events hourly. Especially if you have not configured your Windows Server Event Logs. Basically, the event log is separated into channels. The four most important are:
- System: Features events related to system software and/or hardware. For instance, driver failures or installations.
- Application: Contains events logged by (mostly) Windows applications.
- Security: Contains events pertaining to the security of the Windows system. This may include failed login attempts.
- Setup: Features system related event logs for setups and updates. For instance, Windows updates.
Besides, Microsoft also has channels for its features such as BitLocker, AppLocker, and Windows Firewall. Additionally, the event log may also contain channels for third party software. As a result, Windows Server allows you to collect all your events from separate servers and combine them in a central location. Alternatively, you could feed event logs to a Security Information and Event Management (SIEM) solution that isn’t Microsoft based.
While there is a lot of information collected by the events log by default, it is the auditing feature in Windows that determines what information gets collected and logged.
How to Check Windows Server Logs
There are two main graphical ways you can access the Windows Server event log:
- Event Viewer Microsoft Management Console (MMC)
- Windows Admin Center (WAC)
The WAC isn’t as fully-featured as the Event Viewer. Nonetheless, you can access the Event Viewer from the server or client machine(s) using Windows Administrative Tools. Alternatively, you can use the Windows Server Manager to run the Event Viewer.
Launching The Windows Server Manager
Again, there are quite a few ways you can check server event logs from Windows Server. One of the best ways is using Windows Server Manager which acts as a central hub for our server. By default, Windows Server Manager is a Windows Server start up application. This means that it’s one of the first applications to run when you launch Windows Server. However, you can also run the Server Manager from the start menu or search bar:
- Open the Start Menu (WinKey).
- Search through the applications list for Server Manager or type it into the search field.
- Double click on the Server Manager item.

How to Launch The Event Viewer
Once again, the best way to check Windows Event Logs is through the Event Viewer. You can launch it from the Server Manager using the following steps:
- Click on the top Tools menu button.
- Search the list for Event Viewer.
- Double click on it to open it .

Using The Roles and Server Groups Section To Check Events
You may have noticed that the Events Viewer isn’t the only place you can view events from the Server Manager. As seen, the Server Manager also allows you to view roles and server specific events on the dashboard. You can view File and Storage, Local Server, and All Servers events by using the various widgets in the dashboard.

Clicking on one of the Events options in these widgets will launch a screen similar to this one:

This is called the Events Detail View. It gives you a list of filtration options including:
- Event Security Levels: Filter events according to their severity.
- Event Sources: Origin of an event (applications, services, etc).
- Servers: The machine the event occurred on.
- Time Period: The hours and/or minutes the event occurred in between.
- Event IDs: Each event has a unique ID. You can filter events using these IDs.
Again, we’ll stick to using the Event Viewer because it’s the most fully featured option.
Navigating Through the Event Viewer

One of the most unfortunate facts about Windows Server’s event management system is its lack of built in alerts or notifications. However, you can apply a script or run a program that is triggered when a particular event enters one of your custom views.
Nevertheless, you should be able to see the four channels we previously mentioned under the Windows Logs folder. You can use the above image as a reference. Ultimately, this is where you will check your Windows Servers Log.
You will notice that the above image features an additional channel called Forwarded Events. This channel is used by servers that have been set up as event collectors. It allows you to see events from other servers.
If you scan through the Event Viewer tree, you should notice a top folder labeled Applications and Services Log. It contains event channels related to installed server software and hardware.
Event Log Levels
When checking Windows Server Logs through the Event Viewer, you’re bound to run into a plethora of event types. They include:
- Information: Logs information event. For instance, when a task is completed successfully or when the system informs the user of something.
- Warning: Used to log system and software warnings. They don’t demand immediate action. However, they may warn you of a future problem, like disk space running out.
- Error: Indicates a system, software, or hardware issue that requires immediate action. For instance, a driver failing to load upon start up.
- Success Audit (Security log): This signifies the success of an audited security event. For instance, a user successfully logging onto the server or client.
- Failure Audit (Security log): This signifies the success of an audited security event. For instance, a user failing to log onto a server or client.
It is time to explain How to Check Windows Server Logs (Windows Event Log Types).
Event Log Types
In this section of the guide, you’ll explore the event types (Event Sources) you should be monitoring. Ultimately, keeping track of important logs requires you to use event sources to identify vulnerabilities in your system. Certainly, you’ll be able to find the event source by using the Source tab for each event.

Alternatively, you can create a custom view by:
- Right clicking on any one of the folders or objects on the right tree panel eg. Windows Logs.
- Next, select Create Custom View… from the context menu.
If you execute the above steps correctly, you should be presented with this screen.
You can then use either the filer screen or XML screen to create an event source-based view.
1. Application Whitelisting
As shown, you should have a list of approved services and applications. Anything that doesn’t appear on your whitelist should be flagged as suspicious. Consequently, there are two systems built into the latest versions of Windows for application control:
- AppLocker
- Microsoft Defender Device Guard
You can either use these systems individually or in tandem. Regardless, DeviceGuard is considered the most difficult to configure but also the most secure. As such, admins may elect to use it over AppLocker. AppLocker is easy to bypass by compromising the Windows NT Kernel. Comparatively, the Device Guard is much more robust and much more secure against exploits against the Windows NT Kernel.
However, if it’s your first time working with application control software, it is recommended that you use AppLocker with the Event Viewer.
What Should You Do When You Encounter This Event?
Your event source is dependent on the application control solution you’ve chosen to use for black and whitelisting. For instance, any event related to the AppLocker will use AppLocker as a source. Likewise, if you use Microsoft Defender, Device Guard events will use DeviceGuard as a source. It’s important that you investigate any suspicious events related to these sources. Correspondingly, bad actors may be trying to whitelist apps that you’ve previously blacklisted because of the vulnerabilities they impose on your system. You should:
- Check your app control configurations.
- Consult with a network security specialist to track down the person that may have changed your rules.
- Change all necessary Passovers.
2. Randomly Cleared Events and Audit Logs
If you notice that some of your events have been randomly cleared, then your network/system has most likely been compromised by bad actors. Especially, these bad actors may be trying to hide malicious activity by purging events. At this time it’s important to remember that event logs are not typically cleared during normal operations. As such, if you notice the following event logs, you should be worried:

What Should You Do When You Encounter This Event?
Nevertheless, collecting logs centrally on a server that only you (or your network’s admin) can access is the best way to protect yourself against cleared event logs. This will allow you to view deleted or cleared event logs without restoring your server from a backup. You can then confirm if a bad actor compromised your system.
3.Account Usage
A variety of users will log in to your server(s). You can use these event types and IDs to detect unauthorized account usage and remote desktop logins. Some users can use Windows Remote Desktop to configure systems that they should not be allowed to. Equally, users should not be logging into your server using Remote Desktop when there are other tools such as Power Share, Windows Admin Console (WAC), etc.
You (or your network administrator) should especially be paying attention to privileged Active Directory groups such as the domain and enterprise admin groups. Furthermore, you must make sure that your system isn’t adding or removing users from these groups without permission.
Account lockouts are important events that should be monitored. They can often signify brute force attempts by malicious actors. These bad actors may be trying to guess a user’s password. Nevertheless, the following are the events that fall under this category:

What Should You Do When You Encounter This Event?
When you encounter this event, it’s important to connect all related users and/or groups. First step is to investigate why a specific user was locked out. Was it indeed a bad actor or have they forgotten their password? Once you’ve fully ascertained the reasons for the user’s failed login attempts, you can act accordingly.
4. Group Policy Errors
Evidently, you use Group Policy Objects (GPOs) to configure and enforce your organization’s security policy. Thus, if the group policies you’ve set aren’t enforced, then your system may be compromised. In most cases, it may be the result of a bad actor attempting to prevent your system from enforcing certain policies so they can enact their own.
However, it can also be something benign or innocent. For instance, the group policy client may be failing for some reason. Regardless, it’s always important to monitor your group policies as they may indicate something nefarious occurring on your network..

What Should You Do When You Encounter This Event?
Your group policies can be viewed in the GroupPolicy channel (Microsoft > Windows > GroupPolicy). It allows you to see if your system is applying Group Policy Objects (GPOs) successfully. Once you encounter any errors in this view, you should first determine why the error is concerning. It may not be the result of a breach or attempted exploit. One of your machines may be struggling with low system resources. Make sure to check if your GroupPolicies are operational.
5. Software and Service Installation
By the same token, you may be regularly installing and updating software and services on your server. However, installations occur daily. Of course, this depends on the server’s usage and age. Freshly commissioned servers may require daily installations, backups, and updates. Nonetheless, if you see suspicious software and service-related events, then it may be a sign of malicious activity carried out by a bad actor.
What Should You Do When You Encounter This Event?
Look out for keywords in events such as “Installed”, “New”, “Removed”, “Update”, and ”Updated”. You can find the above keywords by using a search or a custom view of your creation. You must investigate every suspicious occurrence you find and review logs to ensure that every software/service installation and removal has been approved.
6. Windows Updates
As with the desktop version of the operating system, Windows Server also requires regular updates. These updates are imperative because they often contain important system patches. If these Windows updates fail, it may leave your system vulnerable.
Consequently, you must check the WindowUpdateClient and Servicing event sources from the System channel. Alternatively, you can create a custom view filtered according to these event sources. Nevertheless, you must validate that there are no errors or information events that indicate Windows Update failures.
What Should You Do When You Encounter This Event?
The first thing you must do is investigate why your Windows Updates are being interrupted. It may not be a result of a malicious. Your server(s) may be low on system resources or your system may be experiencing a network error. As you investigate the source of the issue, you must ensure that your Windows Server operating system is up to date. You can manually download and install Windows Server Cumulative Updates.
7. Windows Firewall
The Windows Firewall is enabled by default. It protects servers and clients against malicious activities from your internal trusted network. Henceforth, it’s just as important as any firewall you have segregated in your network. Thus, you must check that your firewall is it’s working, and if the status and/or rules have been updated or changed, etc.
Event sources to look out for include: Firewall, Firewall-Client, Firewall-CPL, Firewall-Driver, and Firewall-Service. Again, you can create a custom view with these event sources.
What Should You Do When You Encounter This Event?
Again, you must determine the source of the issue. Is someone trying to reconfigure your firewall? You should consider using third party firewalls for your internal system. There are other steps you can take to improve your overall cybersecurity.
8. Application Crashes
Application crashes are fairly common. However, they may indicate a malicious attack where a bad actor is forcing processes and services to shut down. Therefore, you or your system administrator must check the event logs for instances of Blue Screen of Death (BSOD), Windows Error Reporting (WER), Application Crashes, and Hang events.

What Should You Do When You Encounter This Event?
Again, you should determine the source of the crash, freeze, etc. Are the affected applications important to the security of your network? Which machines are they specifically related to? This will help you decide if you must investigate further or change the posture of your network’s security.
Thank you for reading How to Check Windows Server Logs (Windows Event Log Types Explained). We shall conclude.
How to Check Windows Server Logs (Windows Event Log Types) Conclusion
JustAnotherAdmin

This is my site for sharing back with the IT world.
View the Project on GitHub soccershoe/JustAnotherAdmin
- About
- Blog
- More
28 October 2019
by This Guy
Let’s start Logging All The Things! …Part 1
This is a long one. I’ll eventually break this article into several posts and better organize it.
Let’s set up a WEF environment!
What has a free log centralization platform built into it’s operating system? Windows. Using Windows Event Forwarding (WEF) and some Active Directory GPO’s, we can create a system where you can centralize all your logging to do what you like with. You can then send your logs on forward to Splunk or ELK or some other searching platform. Or just keep it on the centralized WEF server.
Let’s implement Windows Event Forwarding for the whole of your Windows environment.
Let’s start off with some Definitions:
- WEF – Windows Event Forwarding (WEF) is a powerful log forwarding solution integrated within modern versions of Microsoft Windows.
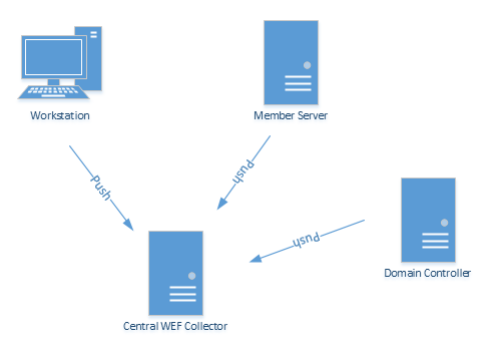
WEF allows for event logs to be sent, either via a push or pull mechanism, to one or more centralized Windows Event Collector (WEC)
servers. WEF is agent-free, and relies on native components integrated into the operating system. - Windows Event Channels — Event Channels are queues that can be used for collecting and storing event log entries on a collector server.
- Windows Event Collector – Windows Event Collector (WEC) is the central server collecting all the event logs sent from the clients.
- Subscriptions – Eventlog Subscriptions are the configuration item polled by client machines to tells the client specific eventlog entries to
send to the WEF server. - Push/Pull – Subscriptions can be configured to push or pull the eventlog entries to/from the WEF server. In my example here I use push Subscriptions.
What are the Requirements
- Group Policy Objects (GPOs) to control security auditing and event logging.
- One or more servers with a configured Windows Event Log Collector service (often referred to as the “WEF Server” or “WEF
Collector”). - Functional Kerberos for all endpoints (domain) or a valid TLS certificate (non-domain) for the Event Log Collector servers. Note: My install doesn’t include directions for non-domain joined WEF servers or clients.
- Windows Remote Management (WinRM) enabled on all workstations and servers that will forward events.
- Firewall rules permitting WinRM connectivity (TCP 5985/5986) and WEF between the devices.
- GPOs to specify the URL of the WEF subscription manager(s) that the clients use.
- One or more event log subscriptions. A subscription is a collection of events based on Event IDs or other criteria to tell the
endpoints which event logs to forward. - A GPO that is linked at the root of the domain labeled with the relevant settings. The setting in the GPO directs each client machine in
the domain which WEF server to talk to, every 15 minutes (configurable), to check if it has any Subscriptions specific to that
computer and what events to send. - The WEC server is then configured with the Eventlog MMC. The subscriptions are created with the relevant info for the client
machines. - Optional: From there, Splunk or ELK or Syslog, can be configured to pull the collected logs
How’s this work really?
Don’t worry so much about details, just that this is kind of how it goes down on the client side.
The following actions occur upon first receiving appropriate GPOs on a workstation:
- The workstation configures security auditing GPO settings and starts writing to the local event log.
- As configured via GPO, the workstation connects to the subscription manager(s) using WinRM, authenticated either via Kerberos or TLS. In both cases, transport-layer encryption is applied.
- The workstation registers itself (writing an entry in the registry) with the Event Log Collector (WEC server), and downloads a list of all relevant WEF Subscriptions.
- The workstation periodically sends events to the Event Log Collector(s) as defined in the subscription files. Additionally, the
workstation connects on a periodic heartbeat as scheduled via the GPO. - As new devices are added to the domain and receive the appropriate security logging and WEF subscription GPOs. So they will automatically
begin forwarding events, and we are now hands off and reducing the administration of making sure there is log coverage for everyone. - In my environment we have lots of users in remote offices. A WEC server is deployed for an AD site, or group of AD sites (depending on load), as configured via Site-Linked GPO’s. A group policy object instructs all clients in the site to communicate with the WEF server, which provides a copy of the subscriptions that the workstation should use.
A few limits on things
While WEF provides immense value, it is not without limitations. These limitations should be considered when evaluating a WEF
deployment for your organization.
- Load balancing is difficult. When using Kerberos, it is difficult —if not impossible— to effectively load balance the forwarded events
between multiple nodes. While events can be forwarded to multiple WEF servers, traditional methods of load balancing the traffic
do not work as the Service Principle Name (SPN) cannot be duplicated. - Diagnosis and troubleshooting is limited. When WEF fails, it is often difficult to diagnose why. There are limited tools for
troubleshooting client issues, or validating the health of a given node. We have dedicated a section to addressing these issues later
in this article. - WEF supports a subset of XPath 1.0. This limits Subscriptions in size and scope. This will create more log files for growth if needed.
- When you start getting up over 2000 clients on a WEF server, the eventvwr.msc GUI starts to loose it. I believe it’s because it takes so long to read all the client info from the registry. You can get around it using the wevutil command line, or limit the total number of client machines per server using your GPO’s.
Defining what’s in your WEF Subscriptions
The meat of a WEF subscription ruleset is defined by a collection of XML documents. The XML files can be imported and exported into the
configuration of the WEF server Subscriptions using the command line tool, wecutil.exe. The XML schema is explained in the Microsoft
MSDN documentation (links below). You can also use the GUI to define what events you are collecting. I’ve supplied some example .XML files if you prefer that route.
Custom Windows Event Channels
More details here that we don’t have to worry about quite yet. This can be a bit of a technical task and not quite a requirement for this to be successful. This is great for organizing your collected events. My example here is set up with multiple channels. Maybe I’ll provide a post or section to making this work. There are some separate requirements if you want to create your own or go beyond the example provided here.
WEF can be extended with additional custom event channels. Extending the number of event channels available provides a few primary
benefits:
- Each event channel can have an independent maximum size and rotation strategy.
- Each event channel can be used as a unique identifier for tagging data for ingestion into a SIEM (splunk or whatever else).
- Event channels may be placed on different disks or storage devices for improving disk I/O.
- Creating new event logs can be completed with the directions here: https://blogs.technet.microsoft.com/russellt/2016/05/18/creatingcustom-windows-event-forwarding-logs/
- NOTE: The WEF configuration can only have one .DLL deployed. Use the existing .MAN file to build the new .DLL to maintain the current
event logs while adding new ones. - The Windows SDK is required to build the DLL. From Microsoft: “Developers who rely on
ecmangenfor event manifest creation are advised
to install the Windows Creators Edition of the SDK to obtain the file”
Here’s a link to all the files used in my deployment:
Please see tomorrow’s post for the next steps.
-Laters
tags:
Windows Event Log
Supported OS
Overview
This integration watches for Windows Event Logs and forwards them to Datadog.
Enable this integration to:
- Track system and application events in Datadog.
- Correlate system and application events with the rest of your application.
For more information, see the Windows Event Logging documentation.
Setup
Installation
The Windows Event Log check is included in the Datadog Agent package. There is no additional installation required.
Configuration
Windows Event Logs can be collected as one or both of the following methods.
- As Datadog Events
- As Datadog Logs
Both methods are configured in win32_event_log.d/conf.yaml in the conf.d/ folder at the root of your Agent’s configuration directory. See the sample win32_event_log.d/conf.yaml for all available configuration options. For a quickstart option to send Security event logs, see Send default Security logs.
This integration also comes with an out-of-the-box Windows Event Log Overview dashboard available in-app.
List Windows Event channels
First, identify the Windows Event Log channels you want to monitor.
Depending on collection method, the channel name can be used for the following configuration parameters:
- Datadog Logs:
channel_path - Datadog Events:
path - Datadog Events (legacy):
log_file
PowerShell
To see a list of channels, run the following command in PowerShell:
To see the most active channels, run the following command in PowerShell:
Get-WinEvent -ListLog * | sort RecordCount -Descending
This command displays channels in the format LogMode MaximumSizeInBytes RecordCount LogName.
Example response:
LogMode  MaximumSizeInBytes RecordCount LogName
Circular          134217728      249896 Security
Circular            5242880        2932 <CHANNEL_2>
The value under the column LogName is the name of the channel. In the example above, the channel name is Security.
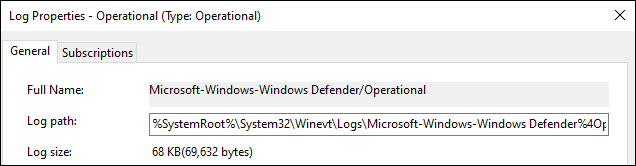
Windows Event Viewer
To find the channel name for an Event Log in the Windows Event Viewer, open the Event Log Properties window and refer to the Full Name field. In the following example, the channel name is Microsoft-Windows-Windows Defender/Operational.
Log collection
Available for Agent versions 6.0 or later
Log collection is disabled by default in the Datadog Agent. To collect Windows Event Logs as Datadog logs, activate log collection by setting logs_enabled: true in your datadog.yaml file.
To collect Windows Event Logs as Datadog logs, configure channels under the logs: section of your win32_event_log.d/conf.yaml configuration file. This example shows entries for the Security and <CHANNEL_2> channels:
logs:
  - type: windows_event
    channel_path: Security
    source: windows.events
    service: Windows

  - type: windows_event
    channel_path: "<CHANNEL_2>"
    source: windows.events
    service: myservice
Set the corresponding source parameter to windows.events to benefit from the integration automatic processing pipeline.
Event collection using the Event Log API (Recommended)
The Datadog Agent can be configured to collect Windows Event Logs as Datadog events using the Event Log API. Datadog recommends using the Event Log API because it has better performance than the legacy method below. Note, each method has its own configuration syntax for channels and for filters. For more information, see Filtering Events.
To collect Windows Event Logs as Datadog events, configure channels under the instances: section of your win32_event_log.d/conf.yaml configuration file.
Set legacy_mode: false in each instance. If legacy_mode: false is set, the path is required to be set in the \win32_event_log.d\conf.yaml file.
This example shows entries for the Security and <CHANNEL_2> channels:
init_config:
instances:
  - # Event Log API
    path: Security
    legacy_mode: false
    filters: {}

  - path: "<CHANNEL_2>"
    legacy_mode: false
    filters: {}
Agent versions 7.49 and later support setting legacy_mode in the shared init_config section. This sets the default for all instances and no longer requires you to set legacy_mode individually for each instance. However, the option can still be set on a per-instance basis.
init_config:
    legacy_mode: false
instances:
  - # Event Log API
    path: Security
    filters: {}

  - path: "<CHANNEL_2>"
    filters: {}
Event collection using Legacy Mode (Deprecated)
The legacy method uses WMI (Windows Management Instrumentation) and was deprecated in Agent version 7.20.
To collect Windows Event Logs as Datadog events, configure channels under the instances: section of your win32_event_log.d/conf.yaml configuration file.
To use Legacy Mode, set legacy_mode to true. Then, set at least one of the following filters: source_name, event_id, message_filters, log_file, or type.
This example shows entries for the Security and <CHANNEL_2> channels:
init_config:
instances:
  - # WMI (default)
    legacy_mode: true
    log_file:
      - Security

  - legacy_mode: true
    log_file:
      - "<CHANNEL_2>"
For more information, see Add event log files to the Win32_NTLogEvent WMI class.
Edit the <CHANNEL_2> parameters with the Windows channel name you want to collect events from.
Finally, restart the Agent.
Note: For the Security logs channel, add your Datadog Agent user to the Event Log Readers user group.
Filtering events
Configure one or more filters for the event log. A filter allows you to choose what log events you want to get into Datadog.
You can use the query, as well as the log_processing_rules regex option, to filter event logs. Datadog recommends using the query option which is faster at high rates of Windows Event Log generation and requires less CPU and memory than the log_processing_rules filters. When using the log_processing_rules filters, the Agent is forced to process and format each event, even if it will be excluded by log_processing_rules regex. With the query option, these events are not reported to the Agent.
You can use the query option to filter events with an XPATH or structured XML query. The query option can reduce the number of events that are processed by log_processing_rules and improve performance. There is an expression limit on the syntax of XPath and XML queries. For additional filtering, use log_processing_rules filters.
Datadog recommends creating and testing the query in Event Viewer’s filter editor until the events shown in Event Viewer match what you want the Agent to collect.
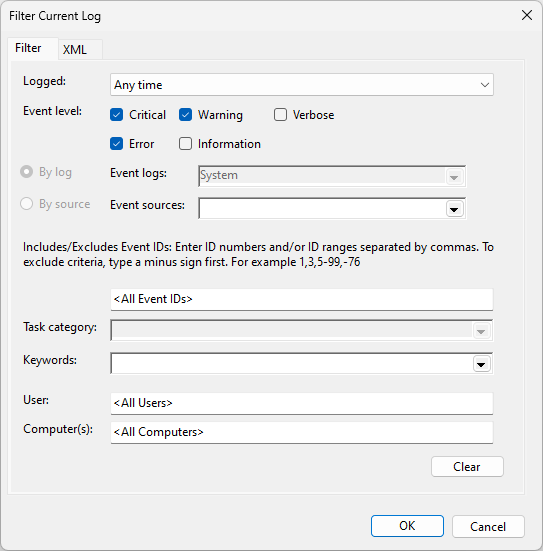
Then, copy and paste the query into the Agent configuration.
# collect Critical, Warning, and Error events
- type: windows_event
channel_path: Application
source: windows.events
service: Windows
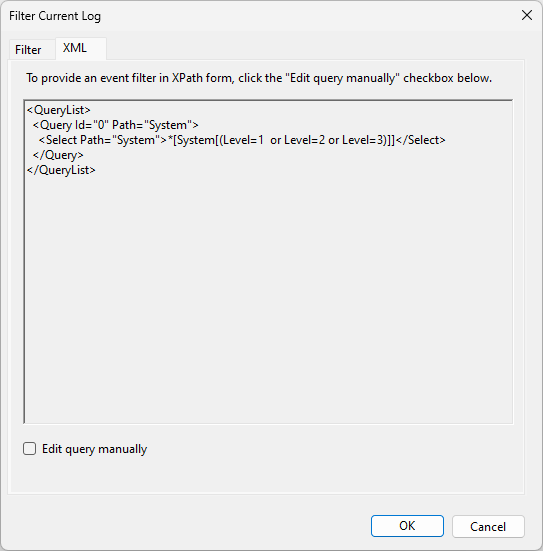
query: '*[System[(Level=1 or Level=2 or Level=3)]]'
- type: windows_event
channel_path: Application
source: windows.events
service: Windows
query: |
<QueryList>
<Query Id="0" Path="Application">
<Select Path="Application">*[System[(Level=1 or Level=2 or Level=3)]]</Select>
</Query>
</QueryList>
In addition to the query option, events can be further filtered with log processing rules.
Some example filters include the following:
  - type: windows_event
    channel_path: Security
    source: windows.events
    service: Windows
    log_processing_rules:
    - type: include_at_match
      name: relevant_security_events
      pattern: '"EventID":(?:{"value":)?"(1102|4624|4625|4634|4648|4728|4732|4735|4737|4740|4755|4756)"'

  - type: windows_event
    channel_path: Security
    source: windows.events
    service: Windows
    log_processing_rules:
    - type: exclude_at_match
      name: relevant_security_events
      pattern: '"EventID":(?:{"value":)?"(1102|4624)"'

  - type: windows_event
    channel_path: System
    source: windows.events
    service: Windows
    log_processing_rules:
    - type: include_at_match
      name: system_errors_and_warnings
      pattern: '"level":"((?i)warning|error)"'

  - type: windows_event
    channel_path: Application
    source: windows.events
    service: Windows
    log_processing_rules:
    - type: include_at_match
      name: application_errors_and_warnings
      pattern: '"level":"((?i)warning|error)"'
Here is an example regex pattern to only collect Windows Events Logs from a certain EventID:
logs:
  - type: windows_event
    channel_path: Security
    source: windows.event
    service: Windows
    log_processing_rules:
      - type: include_at_match
        name: include_x01
        pattern: '"EventID":(?:{"value":)?"(101|201|301)"'
Note: The pattern may vary based on the format of the logs. The Agent stream-logs subcommand can be used to view this format.
For more examples of filtering logs, see the Advanced Log Collection documentation.
Legacy events
Applies to Agent versions < 7.41
Legacy Provider EventIDs have a Qualifiers attribute that changes the format of the log, as seen in the Windows Event Schema. These events have the following XML format, visible in Windows Event Viewer:
<EventID Qualifiers="16384">3</EventID>
The following regex must be used to match these EventIDs:
logs:
  - type: windows_event
    channel_path: Security
    source: windows.event
    service: Windows
    log_processing_rules:
      - type: include_at_match
        name: include_legacy_x01
        pattern: '"EventID":(?:{"value":)?"(101|201|301)"'
Agent versions 7.41 or later normalize the EventID field. This removes the need for the substring, (?:{"value":)?, from legacy pattern as it is no longer applicable. A shorter regex pattern can be used from versions 7.41 or later as seen below:
logs:
  - type: windows_event
    channel_path: Security
    source: windows.event
    service: Windows
    log_processing_rules:
      - type: include_at_match
        name: include_x01
        pattern: '"EventID":"(101|201|301)"'
Use the Windows Event Viewer GUI to list all the event logs available for capture with this integration.
To determine the exact values, set your filters to use the following PowerShell command:
Get-WmiObject -Class Win32_NTLogEvent
For example, to see the latest event logged in the Security log file, use the following:
Get-WmiObject -Class Win32_NTLogEvent -Filter "LogFile='Security'" | select -First 1
The values listed in the output of the command can be set in win32_event_log.d/conf.yaml to capture the same kind of events.
Get-EventLog PowerShell command or the Windows Event ViewerGUI may slightly differ from Get-WmiObject.Double check your filters’ values with
Get-WmiObject if the integration does not capture the events you set up.Filtering events using the Event Log API (Recommended)
The configuration option using the Event Log API includes the following filters:
path:Application,System,Setup,Securitytype:Critical,Error,Warning,Information,Success Audit,Failure Auditsource: Any available source nameid: event_id: Windows EventLog ID
See the sample win32_event_log.d/conf.yaml for all available filter options.
This example filter uses Event Log API method.
instances:
  - legacy_mode: false
    path: System
    filters:
      source:
      - Microsoft-Windows-Ntfs
      - Service Control Manager
      type:
      - Error
      - Warning
      - Information
      - Success Audit
      - Failure Audit
      id:
      - 7036
You can use the query option to filter events with an XPATH or structured XML query. Datadog recommends creating the query in Event Viewer’s filter editor until the events shown in Event Viewer match what you want the Datadog Agent to collect. The filters option is ignored when the query option is used.
init_config:
instances:
  # collect Critical, Warning, and Error events
  - path: Application
    legacy_mode: false
    query: '*[System[(Level=1 or Level=2 or Level=3)]]'

  - path: Application
    legacy_mode: false
    query: |
      <QueryList>
        <Query Id="0" Path="Application">
          <Select Path="Application">*[System[(Level=1 or Level=2 or Level=3)]]</Select>
        </Query>
      </QueryList>
Filtering events using Legacy Mode (Deprecated)
The configuration option using the Legacy Mode includes the following filters:
log_file:Application,System,Setup,Securitytype:Critical,Error,Warning,Information,Audit Success,Audit Failuresource_name: Any available source nameevent_id: Windows EventLog ID
This example filter uses the Legacy Mode method.
instances:
  # Legacy
  # The following captures errors and warnings from SQL Server which
  # puts all events under the MSSQLSERVER source and tag them with #sqlserver.
  - tags:
      - sqlserver
    type:
      - Warning
      - Error
    log_file:
      - Application
    source_name:
      - MSSQLSERVER

  # This instance captures all system errors and tags them with #system.
  - tags:
      - system
    type:
      - Error
    log_file:
      - System
The legacy method does not support the query option. Only the Event Log API method (setting legacy_mode: false) and the Logs Tailer supports the query option.
When you’re done setting up filters, restart the Agent using the Agent Manager, or restart the service.
Validation
Check the information page in the Datadog Agent Manager or run the Agent’s status subcommand and look for win32_event_log under the Logs Agent section.
It should display a section similar to the following:
Logs Agent
==========

  [...]

  win32_event_log
  ---------------
    - Type: windows_event
      ChannelPath: System
      Status: OK
Check the information page in the Datadog Agent Manager or run the Agent’s status subcommand and look for win32_event_log under the Checks section.
It should display a section similar to the following:
Checks
======

  [...]

  win32_event_log
  ---------------
      - instance #0 [OK]
      - Collected 0 metrics, 2 events & 1 service check
Send Default Security logs
Starting with Agent 7.54, you can automatically send Security Events to Datadog as logs by using the dd_security_events flag. These logs can be used with Datadog’s Cloud SIEM to automatically detect threats and suspicious activity in real-time. These default security events are compatible with Datadog’s out-of-the-box Windows detection rules to create security signals when a user clears the Security logs, disables the Windows firewall, changes the Directory Services Restore Mode (DSRM) password, and more.
-
Enable collecting logs in your
datadog.yamlfile. It is disabled by default in the Datadog Agent. -
In the integration configuration file, (
win32_event_log.d/conf.yaml) set thedd_security_eventsflag toloworhighto start sending Security Events to Datadog.init_config: legacy_mode: false instances: - dd_security_events: highlow: sends only the most important and critical Security events, including Audit log cleared (1102), Replay attack detected (4649), and System audit policy was changed (4719). For a full list of events collected on thelowsetting, see here.high: sends a higher volume of Security events, including Encrypted data recovery policy was changed (4714), Domain policy was changed (4739), and Security-disabled group was deleted (4764). For a full list of events collected on thehighsetting, see here.
Teams can change which event IDs are associated with low or high settings by editing these profiles.
- Restart the Agent.
Data Collected
Metrics
The Windows Event Log check does not include any metrics.
Events
All Windows events are forwarded to Datadog.
Service Checks
The Windows Event Log check does not include any service checks.
Troubleshooting
Need help? Contact Datadog support with an Agent Flare.
Log processing rules are not working
If you are using log processing rules to filter out logs, verify that the raw logs match the regular expression (regex) pattern you configured. In the configuration below, log levels must be either warning or error. Any other value is excluded.
    - type: windows_event
      channel_path: System
      source: windows.events
      service: Windows
      log_processing_rules:
      - type: include_at_match
        name: system_errors_and_warnings
        pattern: '"level":"((?i)warning|error)"'
To troubleshoot your log processing rules:
- Remove or comment out the
log_processing_rulesstanza. - Restart the Agent.
- Send a test log that includes the values you’re attempting to catch. If the log appears in Datadog, there is probably an issue with your regex. Compare your regex against the log file to make sure you’re capturing the right phrases.
Further Reading
Additional helpful documentation, links, and articles:
- Advanced Log Collection
- Monitoring Windows Server 2012
- How to collect Windows Server 2012 metrics
- Monitoring Windows Server 2012 with Datadog
- Monitor Windows event logs with Datadog
- Monitor your Windows event logs with Datadog Cloud SIEM]
|
|
Request a personalized demo
Get Started with Datadog
This blog discusses, mentions, or contains links to an Elastic training program that is now retired. For more Elastic resources, please visit the Getting Started page.
Last week we covered the essentials of event logging: Ensuring that all your systems are writing logs about the important events or activities occurring on them. This week we will cover the essentials of centrally collecting these Event Logs on a Window Event Collector (WEC) server, which then forwards all logs to Elastic Security.
WEF and WEC
Modern versions of Windows include the Windows Remote Management (WinRM) services that implement the WS-Management (WSman) protocol, and just to add to the acronym spaghetti soup, this is all part of Windows Management Instrumentation (WMI). One component of WinRM is the Windows Event Forwarding (WEF) service, this is why WinRM and co. need to be enabled. WEF can forward Windows Event Logs to a Windows Server running the Windows Event Collector (WEC) service.
There are two modes of forwarding:
- Source Initiated: The WEF service connects to the WEC server
- Collector Initiated: The WEC service connects to the WEF service
Both use WSman to forward the logs and require WinRM to be running.
There are a number of pitfalls and hurdles when setting up WEF and WEC. Following our WEC Cookbook, you can avoid these. However, for a higher-level view with richer context, we will discuss them here, as well as the solution taken in the Cookbook.
‘Forwarded Events’ event log file
In the Windows Event Log system there are Channels. These Channels are ultimately backed by an event log file that stores all the event logs written to that Channel. A Windows system comes with a set of predefined Channels and applications can add their own Channels by registering new “Providers.”
This means that out of the box, a WEC server only has the Channels that a normal Windows server has anyway for its own logs. Then where should one store all the logs that are being forwarded to the WEC server? There are three options; let’s look at them:
1. Store in the local Channel matching the remote Channel (i.e., the remote “Security” Channel events are stored in the WEC’s local “Security” Channel).
Pitfalls:
- All your remote logs are mixed with your local logs
- The WEC server may loop its own event logs to this Channel
- Log management and access control are made very difficult
2. Store all the remote logs in the local “Forwarded Events” Channel.
Pitfalls:
- Poor write performance, since all writes are to a single file
- Poor search/read performance, as events are not partitioned in separate files
- Poor data life cycle management, as this is per log file, therefore all forwarded events are treated as equal
- Poor resource utilisation of the WEC server, because all work is bottle-necked to a single file
- Poor access management, separate files would allow differentiated file access controls
- Poor coverage/visibility — due to the issues above, many heavily restrict what event logs are forwarded, leaving gaps in their visibility
3. Create new Channels for the WEC server.
This is not as obvious as it might seem, and most would be forgiven for not knowing that it was an option.
Many WEC servers have been set up with options 1 or 2 (above), until Microsoft’s own internal Security team wrote a blog post (about 15 years ago) on how they used the Windows SDK to implement option 3. Here is a similar revision posted in 2016.
New WEC event Channels
Armed with the ability to create arbitrary event Channels, what should we create? How should we organise and architect our WEC server? There are many schools of thought — the WEC Cookbook groups enterprise assets together so that you can manage your log’s access control and data lifecycle accordingly.
Before we delve deeper, let’s look at another approach. Some of you might have come across Palantir’s WEC architecture and guideline. Here, they created a Channel per event log type: Powershell, WMI, DNS, Firewall, etc. These Channels contain logs from all asset types (Domain Controllers, Domain Server, Domain Workstation) and Departments/Biz-Units/OU. They’re also not organised into a hierarchy, so they’d just be a long list in Event Viewer. The Channels therefore also have their WEC subscriptions. Palantir also has a recommended audit policy.
I like to point out other approaches, such as this one from Palantir, as not one size fits all and their approach might suit your organisation better then the one set out in our Cookbook.
If you have looked at Palantir’s Channel list, you will have noticed their “WEC#-Something” format, where the number ‘#’ increases every seven Channels. This is because in the Windows Event Log system, Channels are defined by what is known as a “Provider” and can only define up to eight Channels:
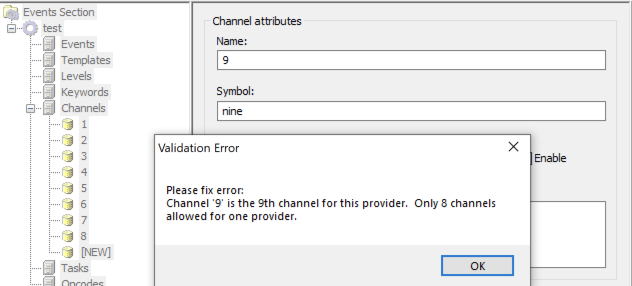
However, an off-by-bug in the “ecmangen” tool that all of us non-Windows-SDK-developer security people used made it frustrating to have more than seven Channels per Provider in it.
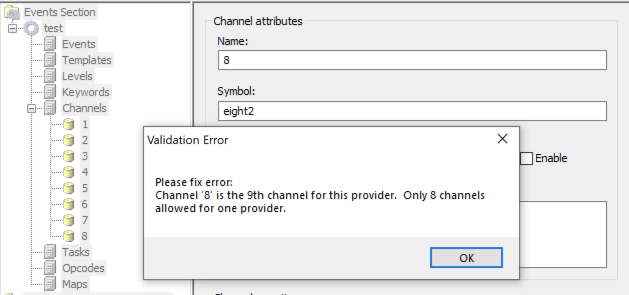
Instead of fixing the many bugs in it, it appears that Microsoft dropped ecmangen from the Windows SDK. Meaning you either use an older SDK or create the Manifest XML file yourself — perhaps with your favourite XML editor.
Like everyone else, I used ecmangen (originally) and stuck to seven Channels to make life easier. The current Cookbook is based on PowerShell scripts that generate the XML. Ecmangen is no longer needed, so you are free to have eight Channels if you want, although the Cookbook still only uses seven recommended Channels.
Note: Think of a Provider as a box of eight Channels, where each Channel is ultimately a separate log file.
Organise by asset
Taking advantage of the fact that you can have as many Providers as you want, we can use this to organise by asset. In your AD environment, you have probably already grouped domain members by asset type (e.g., Domain servers, Domain Controllers, workstations, etc.) and/or by the department (dare I say organisational unit) that those assets are in.
So in the Cookbook you can easily create Providers to match your AD’s organisation, along the lines of Providers per department (Biz Unit or OU) and/or per Asset type and/or per Asset criticality (Lab/Test/Production).
When you seperate by asset type you get the added benefit of being able to better manage access control and log life cycle. If you need to look at the logs of a specific asset type you know where they are.
To make things simple all Providers then get the same set of (up to eight Channels). Then systems are mapped to a Provider (via OU) and the event logs on that system map to Channels in that Provider.
Out of the box, the “wec_config.ps1” script that is used to configure the WEC server to match your AD architecture has some Providers and asset assignment defined:
- Domain Controllers: I think member assignment is clear here
- Domain Servers: The servers in your domain
- Domain Clients: User workstations (desktop/laptops)
- Domain Privileged: More privileged systems (e.g., Jumphosts or WEC Server)
- Domain Members: Catch-all for normal domain members; not in the other groups
- Domain Misc: Miscellaneous, for those hosts that don’t fit
You are encouraged to refine and edit the list to match your AD environment.
Then the out-of-the-box Channel list is:
- Application: “Application” and similar logs
- Security: “Security” and similar logs
- Sysmon: “Microsoft-Windows-Sysmon/Operational”
- System: “System”, “HardwareEvents”, DNS-Client, DHCP-Client, “Setup” and similar logs
- Script: “Windows PowerShell” and similar logs
- Service: DNS-Server, DHCP-Server, and other service logs
- Misc: Any other miscellaneous logs
Again, you are free to change this to suit your needs.
WEC subscriptions
A WEC subscription defines the following:
- An event log (XPath) filter, selecting what events should be forwarded
- A destination Channel, stating where to store the received events on the WEC server
- Type:
- Collector Initiated, the WEC connects to the WEF service
- Target computers, a list of computers to connect to
- Source Initiated, the WEF connects to the WEC server
- Computer groups, the AD groups whose (computer) members may access this subscription
- Collector Initiated, the WEC connects to the WEF service
- Event delivery options to control bandwidth/latency and/or HTTP/HTTPS
- Format type: RenderedText or just the Event XML
The cookbook scripts (notably setup_subscriptions.ps1) configure the Event XML format type. These are much smaller, so it means more throughput, more logs stored, less load, and less bandwidth. However, the drawback is that if the source Provider (on the remote system) is not registered locally on the WEC server’s Event Log System, then the Event Viewer won’t be able to display a text description of the message in your local language. However, sending Rendered Text events is so resource intensive that it’s difficult to justify.
I mentioned at the start that WEF is a function of WinRM. Well, this WinRM component runs as the local system’s “Network Service” user. This means that WEF can’t actually read most of your system logs, and your WEC server will receive a very nondescript Event ID 111 message and no other logs. For this reason, the Cookbook guides you through creating a GPO to add “Network Service” to the local “Event Log Readers” group.
How does WinRM get the configuration for WEF? In the same GPO as mentioned above, we also publish a WSman URL that lists all the WEC subscriptions on that server. In fact, we can list multiple WSman subscriptions URLs from multiple WEC servers, and the WEF service will try to get and execute them all — thus allowing for redundant WEC servers.
All the subscriptions? I don’t want my Workstation sending event logs to my Domain Controller log files! The WSman entries that represent a subscription have AD group permissions applied to them as set up in the Subscription configuration. This means if the computer that WEF is running on is not a member of an AD group that has permission to read the subscription, it can’t get and execute the subscription. It also means that if you’re not careful and a computer is a member of more than one WEC subscription AD group, you will get multiples of the same event log from that WEF host on your WEC!
Computer Groups? But I want to map computers based on the OU that they are placed in! Unfortunately, that is not how WEF/WEC/WinRM/WSman work. However, the Cookbook provides a mechanism to keep a given group’s membership in sync with specified OU locations. Thus you can pretend everything is done via OU!
Bringing it all together
There is a lot of complexity and moving parts to get right when setting up WEF & WEC for good observability or security use cases.
Fear not, however, for our Cookbook is here, accompanied by a set of Powershell scripts to automate most of the steps. This means there is less room for mistakes, actions are reproducible, and thus mistakes are more easily fixable.
It all starts with the wec_config.ps1 script, which you are expected to edit to your heart’s content. All the following scripts will take their lead from that. Therefore, you can easily, for example, change the event log filter used to select what event logs get forwarded in wec_config.ps1, and then re-run setup_subscriptions.ps1 to apply the change.
Let’s take a look at what the scripts do (the Cookbook goes into far more detail on how to use them):
- wec_config.ps1 — The configuration of your WEC server, sourced by the other scripts
- gen_manifest.ps1 — This will create the Manifest XML that describes all your Providers and their Channels for the Windows SDK (no need to use ecmangen anymore!)
- build_man2dll.ps1 — Taking your manifest, this will build the Windows Event Subsystem Module DLL that implements all your new Providers and Channels on any system you install it (usually the WEC server)
- install_channels.ps1 — Takes the DLL and Manifest and installs them on the Local system
- configure_channels.ps1 — Will apply the Log Path and Log Size configuration (from wec_config.ps1) to all your newly installed Channels
- setup_subscriptions.ps1 — Will setup (create or reconfigure) all the subscriptions for your Provider/Channels on the WEC server
- map_ou2group.ps1 — You probably want to use your AD’s OUs, but WEC Subscriptions select computers via AD Groups. This script will sync the membership of given groups to the computers under specified OUs, again using the configuration in wec_config.ps1
- gen_winlogbeat_config.ps1 — The config that ships with Winlogbeat won’t know about all your extra WEC subscription Channels, so this will update that configuration for you
- beat_cmd.ps1 — A helper script for interacting with Beat commands on PowerShell
Unfortunately, all the configuration on the AD side, such as Group Policies, still have to be done manually — but the Cookbook has step-by-step guides with screenshots. I may write scripts for that too one day, stay tuned.
Finally Winlogbeat needs to be configured to send all the WEC logs to Elastic Security. The cookbook will guide you through this too.
Conclusion
I hope after reading this blog post, and possibly the Cookbook itself, you have a good idea of the decisions you need to make before you start, as well as now having all the guidance and tools you need to create that perfect WEC server for your enterprise.
Now that you have the proper audit policies in place, WEF configured, and a WEC server setup to forward your AD domain’s event logs to Elastic Security, in our following blog post we will look at what you can do with this extremely important and useful log data in Elastic Security.
If you’re new to Elastic Security, you can experience our latest version on Elasticsearch Service on Elastic Cloud. Also be sure to take advantage of our Quick Start training to set yourself up for success.
See other Cookbook guides that I have written: https://ela.st/tjs-cookbook-lib