
It’s an unfortunate and inevitable fact that while developing software, sometimes your software will crash. This also happens, sometimes, hopefully very infrequently, in production code. Each time this happens, Windows stores information about each crash in the Windows Event Log, along with many other events in the Windows crash log.
You can inspect these using the Windows Event Viewer, but to find them you’ll be wading through lots of other data about the behaviour of the operating system. It’s needle in a haystack time.
There is a better way.
In this article, I will explain two event log entry types which encode crashes and how to read them. Then, I’ll also introduce some tools that take the drudgery out of converting this information into a symbol, filename and line number to enable you to identify the location of the crash and possibly its root cause.
The Event Log Services
The Windows error reporting service and Windows event collector work together to collect and store detailed information about successful events, operation failures, critical errors, faulty drivers and application crashes in the Windows event log.
Three services work together to provide the Windows Event Log. These are the event log service names:
- Windows Error Reporting Service
- Windows Event Collector
- Windows Event Log
The Windows Event Log
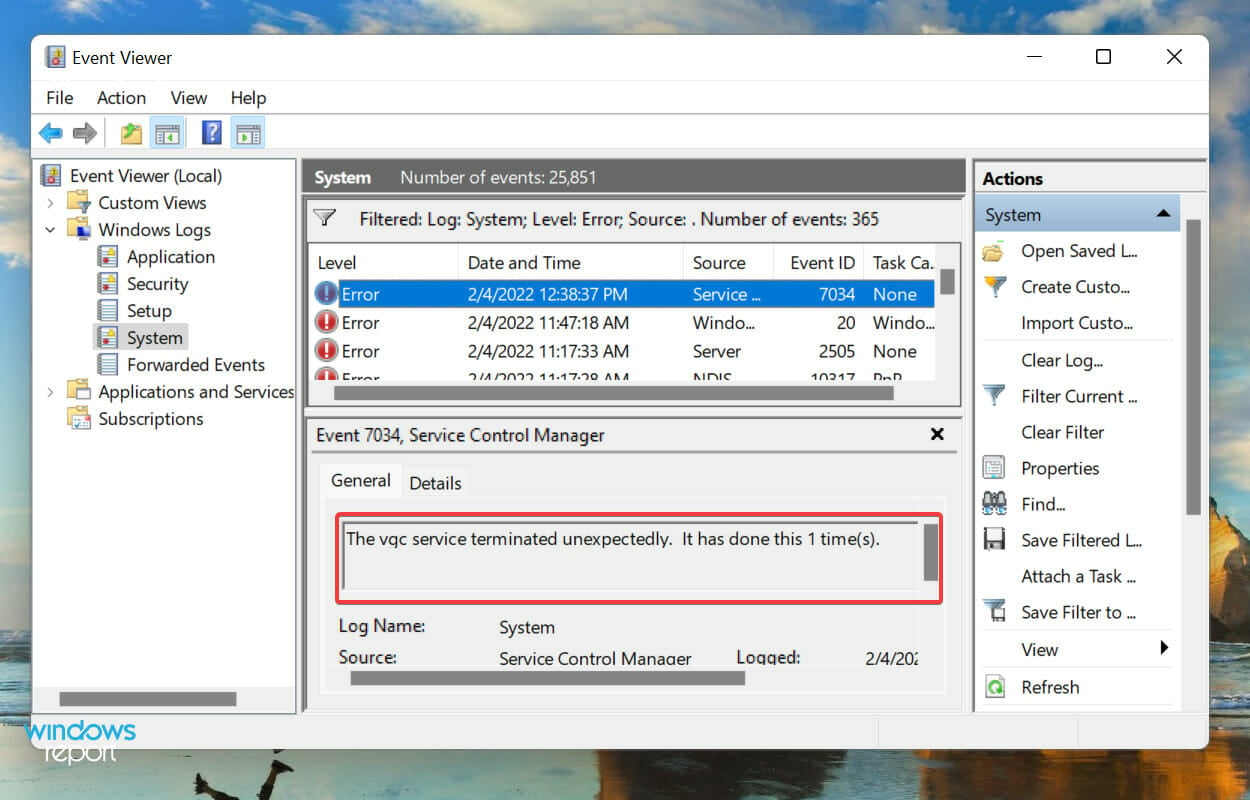
The Windows event log can be viewed using Microsoft’s Event Viewer. Just type “Event Viewer” in the start menu search box and press return. That should start it.
Crash information is stored in the sub category “Application” under “Windows Logs”. The two event sources that describe crashes are Windows Error Reporting and Application Error. These are event id 1000 and 1001.
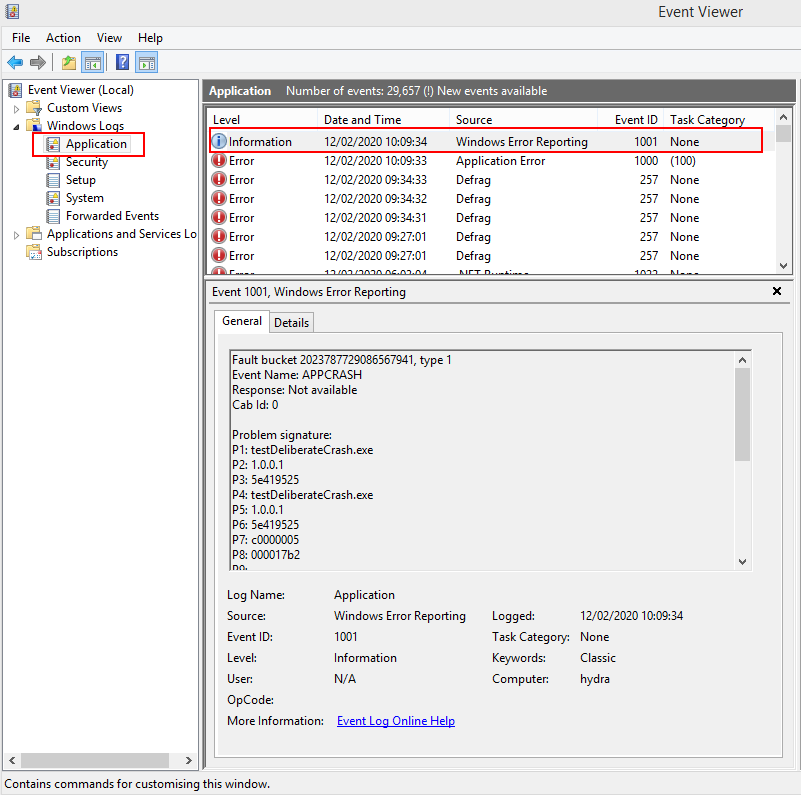
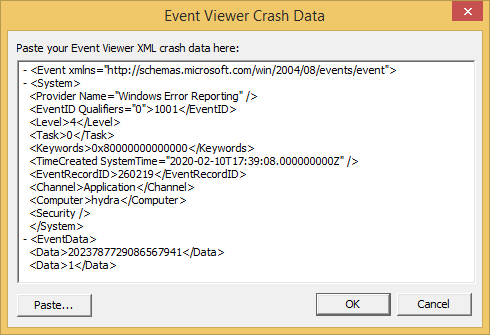
The image above shows a Windows Error Reporting event has been selected. The human readable form is shown below in the General tab. Although I say human readable, it really is unintelligible gibberish. None of the fields are identified and you have nothing to work with. The details tab isn’t any better – the raw data is present in text or XML form. Here’s the XML for the crash shown above.
<Event xmlns="http://schemas.microsoft.com/win/2004/08/events/event">
  <System>
    <Provider Name="Windows Error Reporting" />
    <EventID Qualifiers="0">1001</EventID>
    <Level>4</Level>
    <Task>0</Task>
    <Keywords>0x80000000000000</Keywords>
    <TimeCreated SystemTime="2020-02-12T10:09:34.000000000Z" />
    <EventRecordID>260507</EventRecordID>
    <Channel>Application</Channel>
    <Computer>hydra</Computer>
    <Security />
  </System>
  <EventData>
    <Data>2023787729086567941</Data>
    <Data>1</Data>
    <Data>APPCRASH</Data>
    <Data>Not available</Data>
    <Data>0</Data>
    <Data>testDeliberateCrash.exe</Data>
    <Data>1.0.0.1</Data>
    <Data>5e419525</Data>
    <Data>testDeliberateCrash.exe</Data>
    <Data>1.0.0.1</Data>
    <Data>5e419525</Data>
    <Data>c0000005</Data>
    <Data>000017b2</Data>
    <Data />
    <Data />
    <Data>C:\Users\stephen\AppData\Local\Temp\WERC24C.tmp.WERInternalMetadata.xml</Data>
  <Data>C:\Users\stephen\AppData\Local\Microsoft\Windows\WER\ReportArchive\AppCrash_testDeliberateCr_c31b903842d94a84d4621dceaac377462674f7a_eb589596_139ec4bd</Data>
    <Data />
    <Data>0</Data>
    <Data>c3d360b2-4d7f-11ea-83d3-001e4fdb3956</Data>
    <Data>0</Data>
    <Data>54756af49aec84f97c15f03794ffd605</Data>
  </EventData>
</Event>
There’s quite a bit of data in here, the purpose of each field implied, not stated. Towards the end is some information related to a crash dump, but if you go searching for it, the minidump will no longer be present.
The format for Application Error crashes is different.
Windows Error Reporting
The event log data for a Windows Error Reporting event contains many fields that we don’t need if we’re just investigating a crash address. Each event starts with an <Event> tag and ends with an </Event> tag.
We need to correctly identify the event. Inside the event is a <System> tag which contains a tag with an attribute “Provider Name” set to “Windows Error Reporting” and “Event ID” set to 1001.
Once the event is identified we need to find the <EventData> tag inside the event. The <EventData> contains 14 <Data> tags.
The first four tags are always the same:
- 1. Timestamp.
- 2. Number of data items.
- 3. Information Type.
- 4. Information Status.
We can use the Information Type to determine how to process all the data. There are two Information Types that interest us.
APPCRASH
APPCRASH data is for a most application crashes.
If Information Type is “APPCRASH”, the data is:
- 1. Timestamp.
- 2. Number of data items.
- 3. Information Type.
- 4. Information Status.
- 5. Unknown.
- 6. Crashing executable.
- 7. Executable version.
- 8. Executable timestamp.
- 9. Crashing DLL. This will be the same as 6 if the crash is in the .exe.
- 10. DLL version. This will be the same as 7 if the crash is in the .exe.
- 11. DLL timestamp. This will be the same as 8 if the crash is in the .exe.
- 12. Exception code.
- 13. Fault offset.
- 14. Class. This may or may not be present
We’re interested in tags 9, 12 and 13.
If we want to version the crashing DLL we also need tags 10 and 11.
BEX
BEX data is for a buffer overflow exception or Data Execution Prevention exception.
If Information Type is “BEX” or “BEX64”, the data is different:
- 1. Timestamp.
- 2. Number of data items.
- 3. Information Type.
- 4. Information Status.
- 5. Unknown.
- 6. Crashing executable.
- 7. Executable version.
- 8. Executable timestamp.
- 9. Crashing DLL. This will be the same as 6 if the crash is in the .exe.
- 10. DLL version. This will be the same as 7 if the crash is in the .exe.
- 11. DLL timestamp. This will be the same as 8 if the crash is in the .exe.
- 12. Fault offset.
- 13. Exception code.
- 14. Class. This may or may not be present
Note that the order of the fault offset and exception code has been reversed compared to APPCRASH.
We’re interested in tags 9, 12 and 13.
If we want to version the crashing DLL we also need tags 10 and 11.
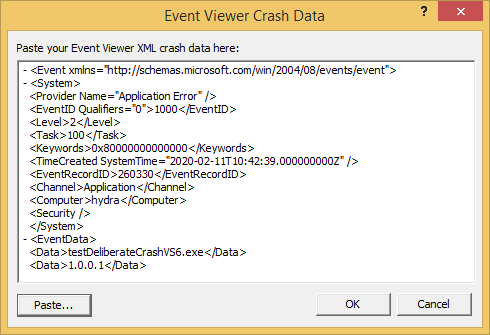
Application Error
The event log data for an Application Error event contains many fields that we don’t need if we’re just investigating a crash address. Each event starts with an <Event> tag and ends with an </Event> tag.
We need to correctly identify the event. Inside the event is a <System> tag which contains a tag with an attribute “Provider Name” set to “Application Error” and and “Event ID” set to 1000.
Once the event is identified we need to find the <EventData> tag inside the event. The <EventData> contains at least 12 <Data> tags, some of which may not be present, or which may be empty. These tags are present:
- 1. Crashing executable.
- 2. Executable version.
- 3. Executable timestamp.
- 4. Crashing DLL. This will be the same as 1 if the crash is in the .exe.
- 5. DLL version. This will be the same as 2 if the crash is in the .exe.
- 6. DLL timestamp. This will be the same as 3 if the crash is in the .exe.
- 7. Exception code.
- 8. Fault offset.
- 9. Process id.
- 10. Application start timestamp.
- 11. Application path.
- 12. Module path.
Of these tags we’re interested in tags 7, 8 and 12.
If we want to version the crashing DLL we also need tags 5 and 6. If 12 isn’t available, use 4.
Removing the drudgery
The previous two sections have described which fields to extract data from. If you’re doing this manually this is tedious and error prone:
- You have to search for the event id or event name. In most Windows event logs there will be multiple items to examine.
- For each item that matches your event id search you need to select the correct values from the correct fields and then use another application to turn them into a symbol, filename and line number.
- Our tools DbgHelpBrowser, DWARF Browser, TDS Browser and MapFileBrowser are designed to take a crash offset inside a DLL and turn it into a human readable symbol, filename and line number. But that still requires you to do the hard work of fishing the correct data out of the XML dump.
Now there is a better way, we’ve added an extra option to these tools that allows you to paste the entire XML data from a crash event and the tool then extracts the data it needs to show you the symbol, filename and line number.
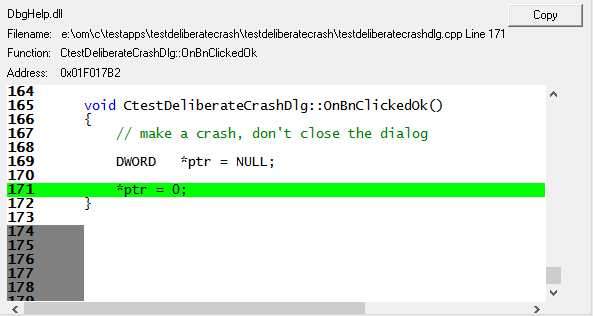
DbgHelpBrowser
Load the crashing exe (or DLL) into DbgHelpBrowser. This will cause the symbols to be loaded for the DLL (assuming symbols have been created and can be found). We’re not covering versioning the DLL as most likely you will have your own methods for this.
Choose the option Find Symbol from Event Viewer XML crash log… on the Query menu. The Event Viewer Crash Data dialog is displayed.
Paste the XML data into the dialog and click OK.
The main display will select the appropriate symbol in the main grid and display the relevant symbol, filename, line number and source code in the source code viewer below.
The process for DWARF Browser and TDS Browser is the same as for DbgHelp Browser, but these tools operate on different types of debug information.
MapFileBrowser
Load the MAP file for the crashing exe (or DLL) into MapFileBrowser. We’re not covering versioning the DLL as most likely you will have your own methods for this.
Choose the option Find Symbol from Event Viewer XML crash log… on the Query menu. The Event Viewer Crash Data dialog is displayed.
Paste the XML data into the dialog and click OK.
The main display will select the appropriate symbol in the main grid and display the relevant symbol, filename, line number and source code in the source code viewer below.
Conclusion
Windows Event Logs can be hard to read and error prone to use.
However when paired with suitable tools you can quickly and easily turn event log crashes into useful symbol, filename and line number information to inform your debugging efforts.
Use Event Log Crash Browser to discover crash information in your event log today.
Additional Reading
Whenever you encounter an error in Windows, it certainly is a cause for concern. But, we often do not bother discovering what caused it or don’t know how to.
Error logs, as the name suggests, are the log files that store all the information as to why the error happened, the program or process that led to it, along the exact date and time of it.
How do I view error logs in Windows 11?
Here are a few ways to see error logs in Windows 11:
-
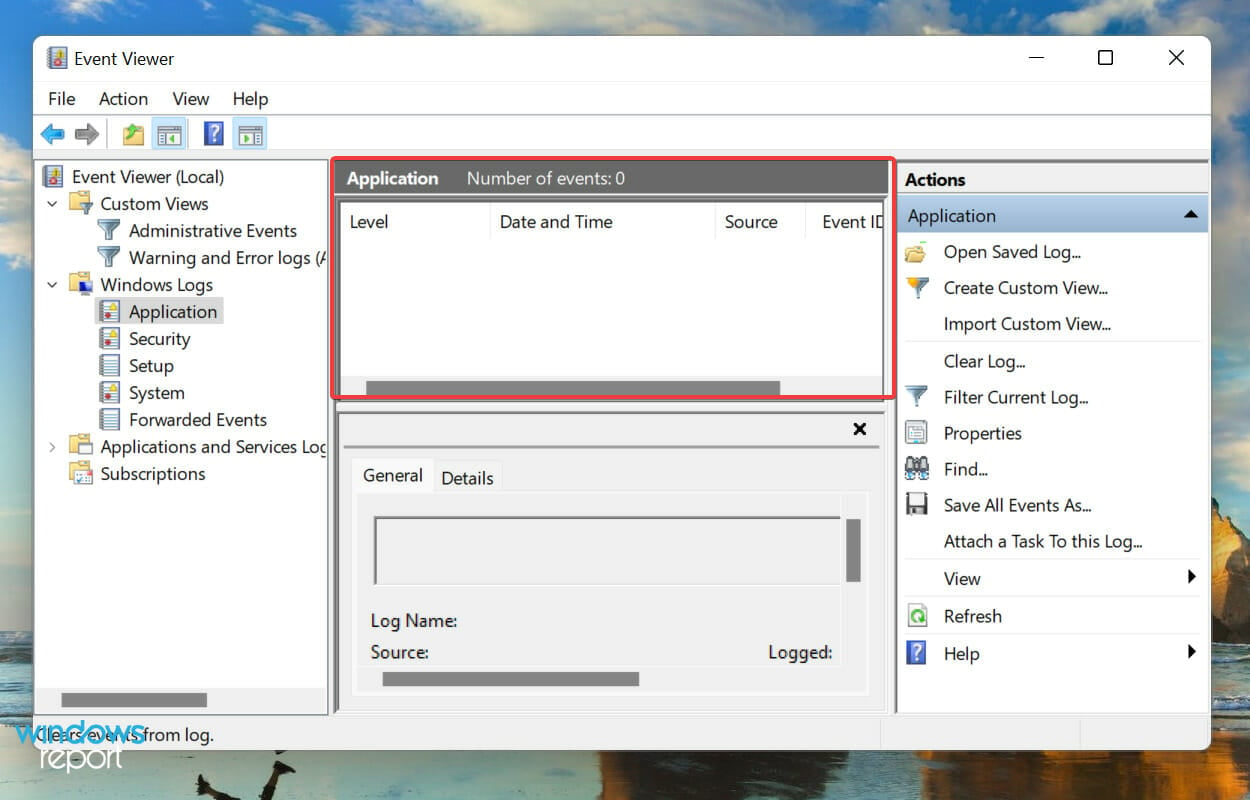
1. Press Windows + S to launch the Search menu, enter Event Viewer in the text field at the top, and click on the relevant search result.

-
2. Double-click on Windows Logs in the navigation pane on the left.
-
3. You will now find the five different categories. Select any of these, and all the error logs under it will be listed on the right.
-
4. Now, click on any of the error logs to view all the relevant information about them.
It’s pretty simple and quick to access the error logs on your Windows 11 OS, but in case you didn’t used before, the steps below will surely help you find them.


You now know how to check the Windows 11 error logs, but just knowing that won’t suffice.
There’s still a lot out there to understand before you can actually make some sense out of these logs, and use them to your advantage.
How to understand Windows 11 error logs?
When you view a Windows 11 crash log, the general details and the Event ID is critical in identifying and eliminating the error. Apart from that, there’s an Event Log Online Help link at the bottom, which may provide some valuable insights.
For instance, here’s a Windows 11 error log when the relevant driver for a device failed to load.
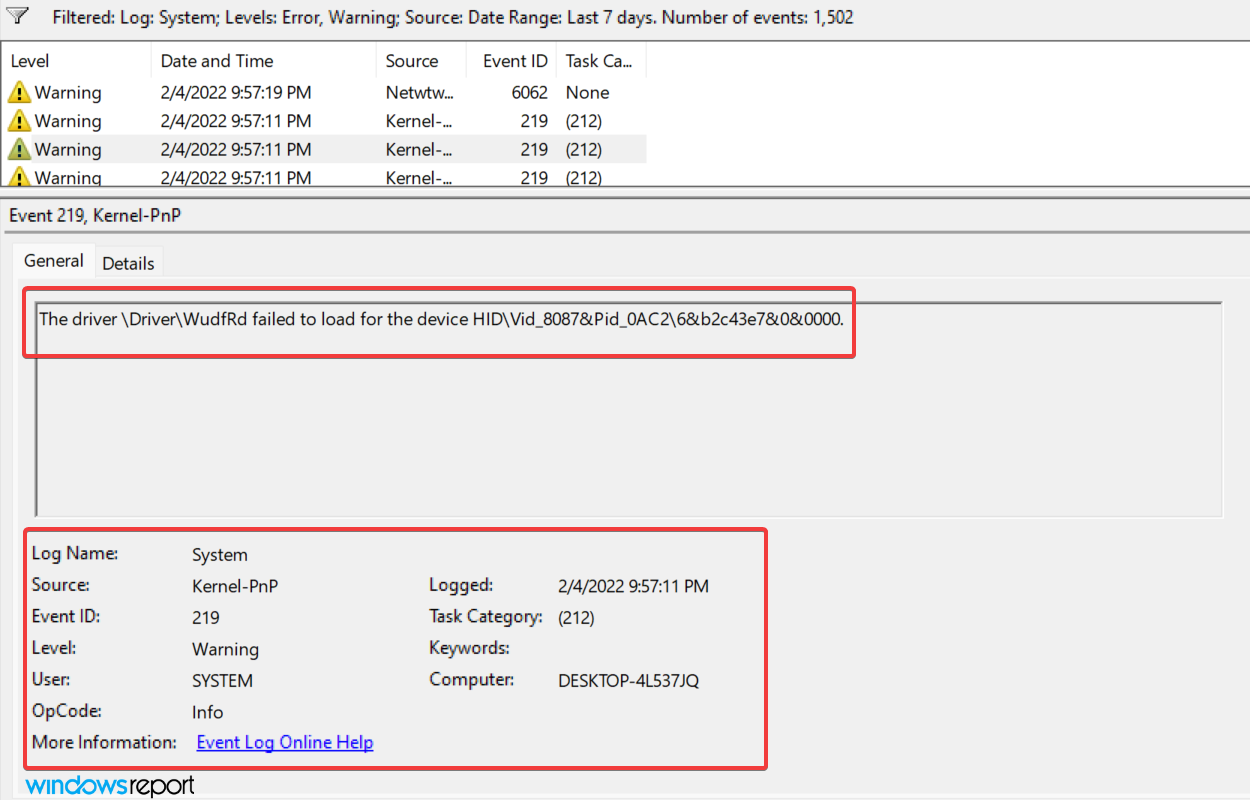
The 219 Event ID helped find out a lot of information along with the relevant fixes for the problem.
We just did a Google search for this Event ID and there were a plethora of results. But this requires a proper understanding of Windows 11 error logs.
But, it’s important to mention here that not all error logs will be as descriptive. Some might have things that you wouldn’t be able to comprehend or use jargon excessively. No matter the case, a simple Google search would suffice.
And if Event Viewer is not working in Windows 10 and 11, rest assured that our detailed guide will help you.
What are the different types of error logs?
When you go through the Windows 11 error logs, there are three important categories, referred to as Event Level, under which these are placed.
And, the categories define the severity of the event for which the log is created. The three categories are as follows:
- Information: These are created when an operation goes through successfully. For instance, when a driver is loaded or an application is launched without encountering any issues.
- Warning: These are created when the OS finds an issue with the system. These issues do not pose an imminent risk, but could be problematic in the future. For instance, if you are running low on disk space, a log will be created.
- Error: These indicate a major problem, though most of the time, Windows takes care of these as well. For example, an error log will be created if a driver or service does not load. But, these are the most critical ones of all.
If you are identifying problems with the PC, ignore the Information logs, go through the Warning logs, but pay special attention to the ones categorized as Error, since these are most likely to record the problem you are looking for.
When you open the Event Viewer in Windows 11, it will list out all three. The view will remain the same if you have not changed the Windows 11 Error Reporting logs location in the in the Group Policy.
However, identifying all logs for one of these levels will take up a lot of your time. This is where filtering error logs come to your aid. Check the next section to find out how you can do that.
How can I filter error logs?
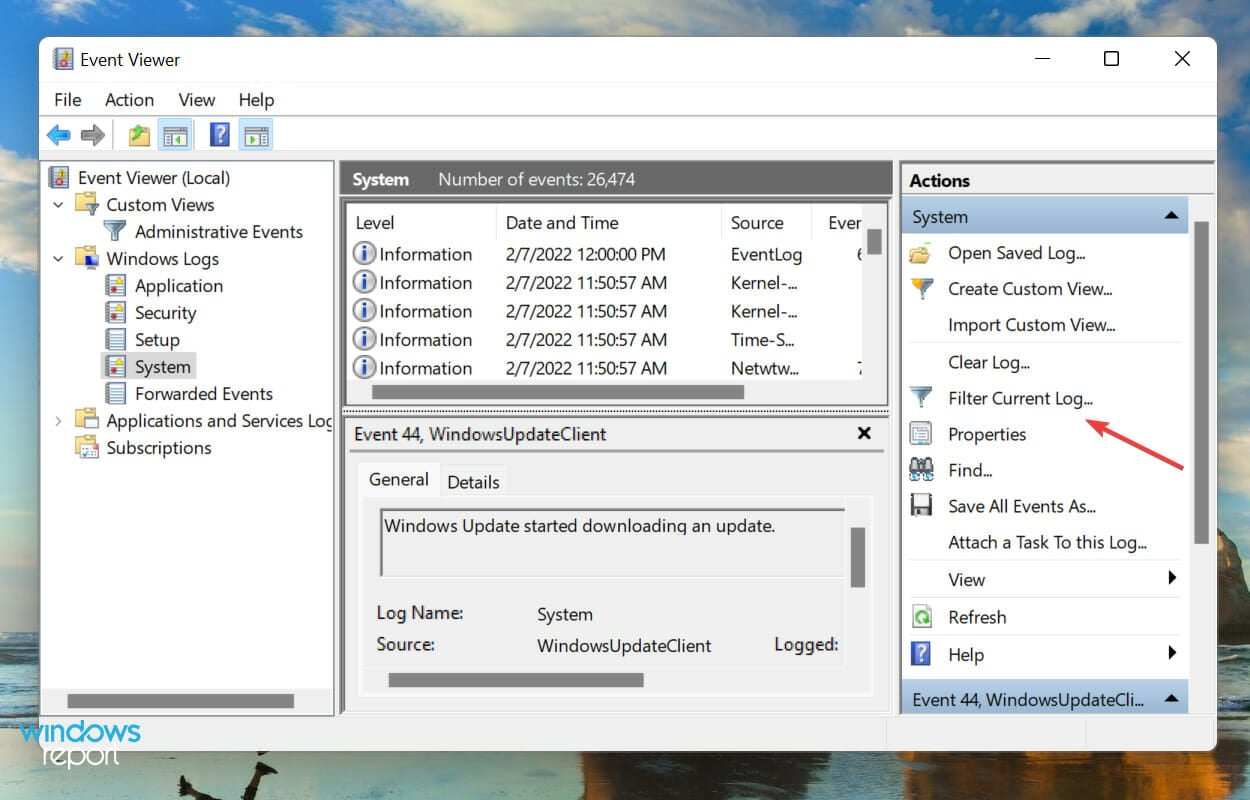
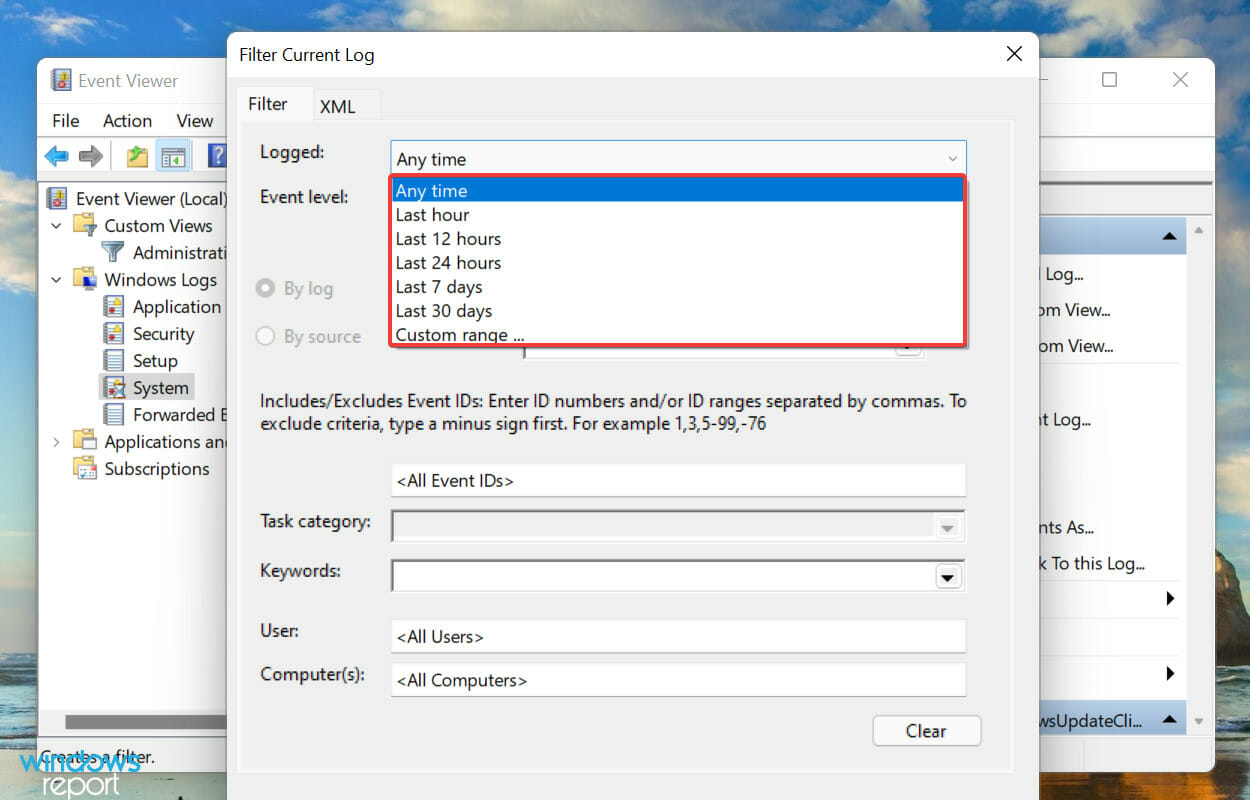
- Open the Event Viewer, navigate to the particular category of logs from the left, and then click on Filter Current Log on the right.
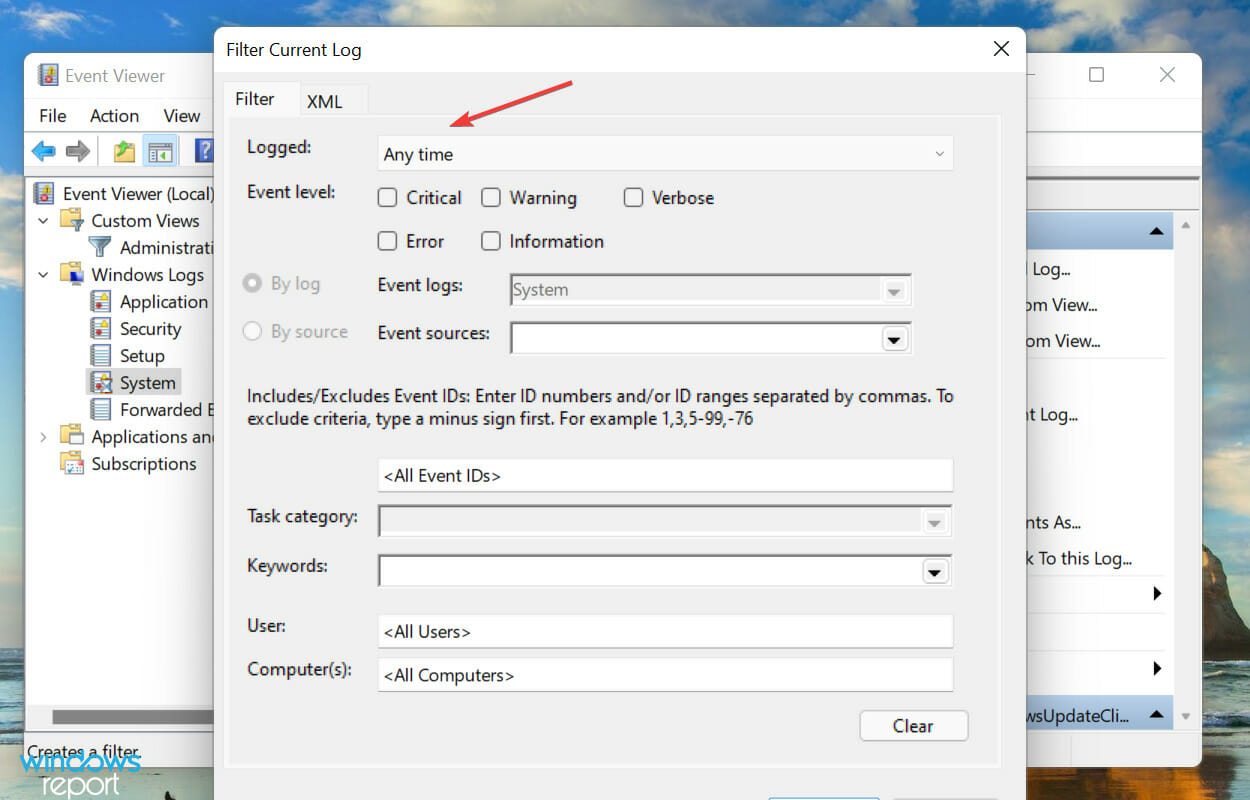
- Next, click on the Logged dropdown menu to select the duration for which you want to check the logs.
- Now, select a time duration from the list of options. You can also choose the last option to create a custom range.
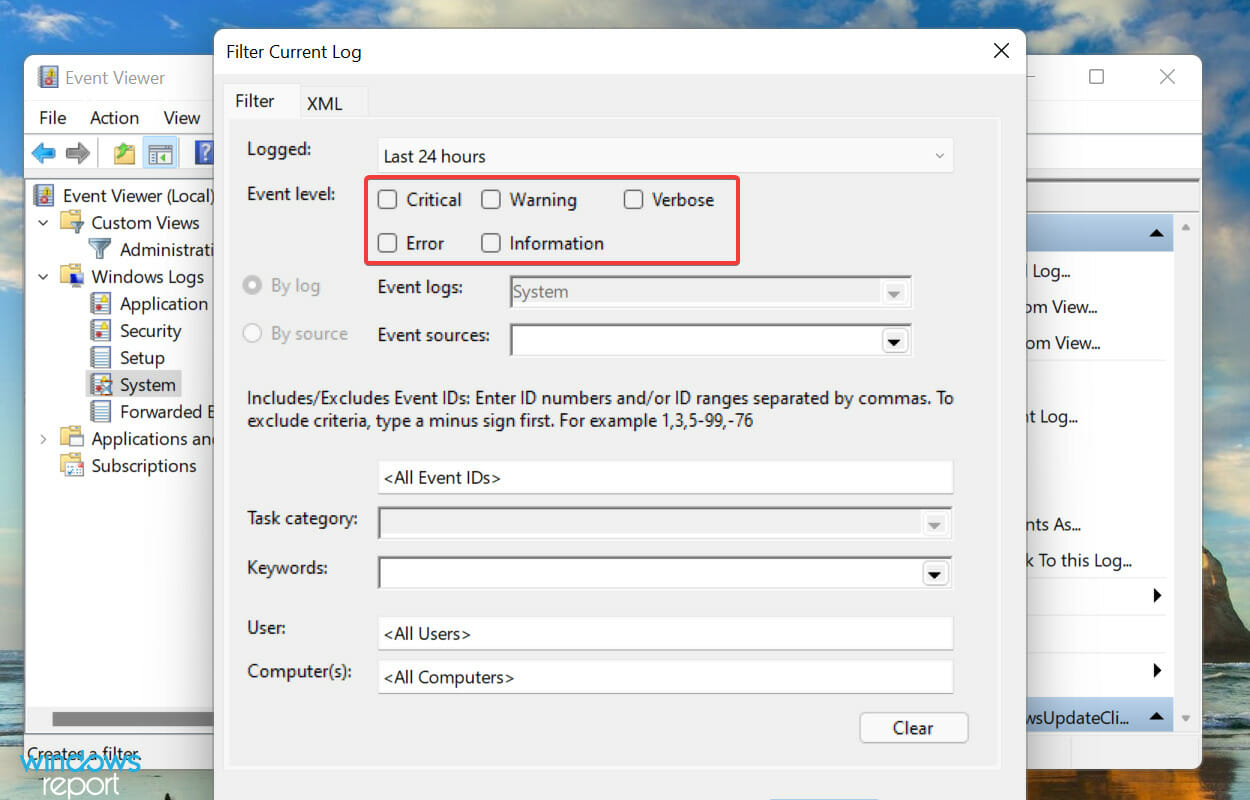
- Once done, tick the checkboxes for the Event Levels that you want to filter.
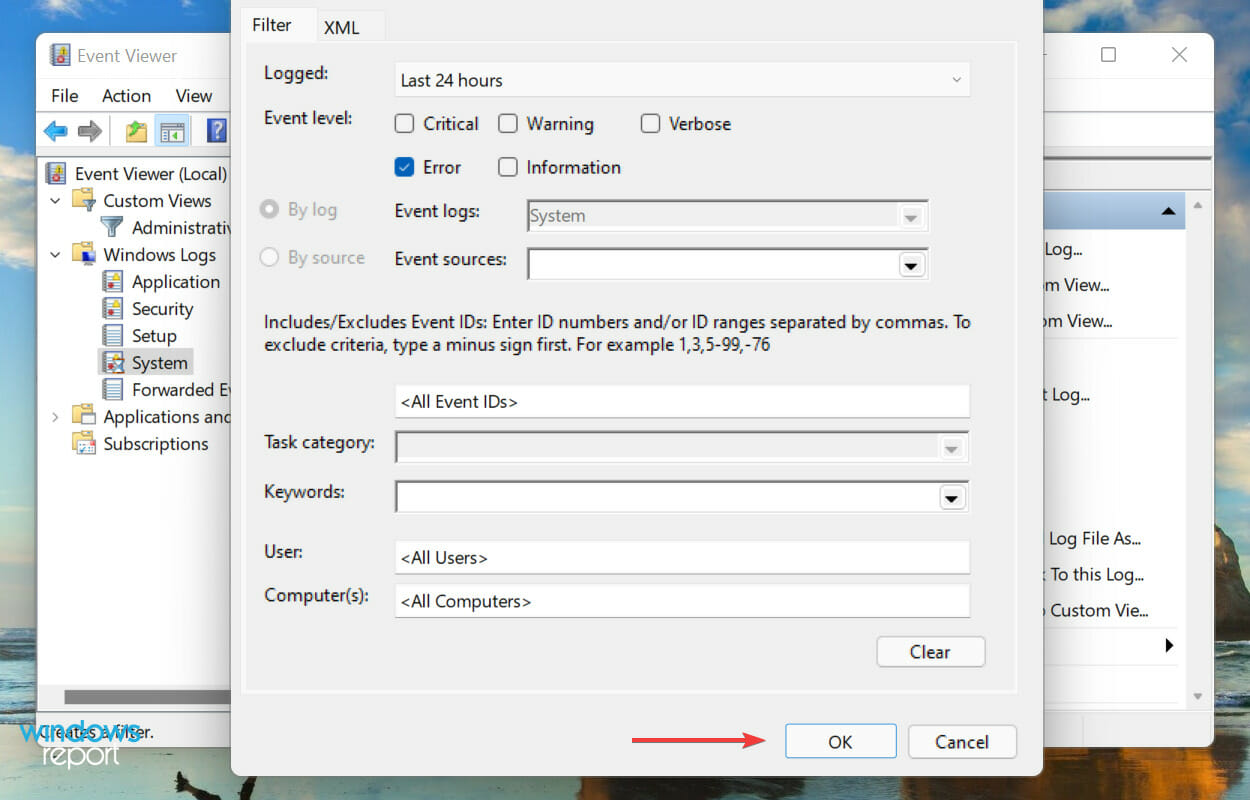
- Finally, click on OK at the bottom to filter the error logs.
- All the errors logs that fall under the choosen filters will now be listed.
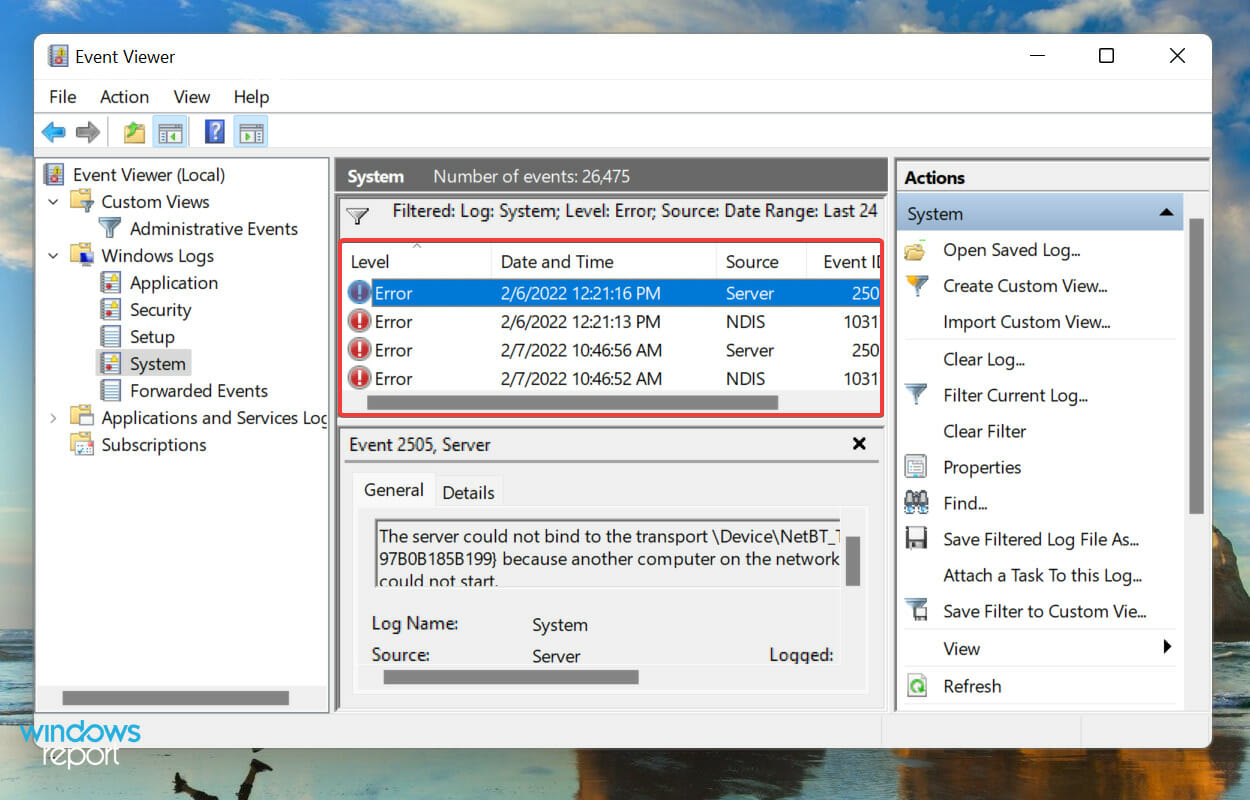
We selected the duration as 24 hours, and level as Error, and filtered the logs. Event Viewer then listed the four Windows 11 error logs that were created during that time.
- Recent Windows 11 update lets you disable profanity filter in voice typing
- Microsoft wants Windows 10 users to upgrade to Windows 11 or Copilot + PCs
- Windows 11 KB5055627 update makes File Explorer more fluid
- A few keyboard settings are moving from Control Panel to Settings app in Windows 11
How to create a custom view to check a particular category and level of logs in Windows 11?
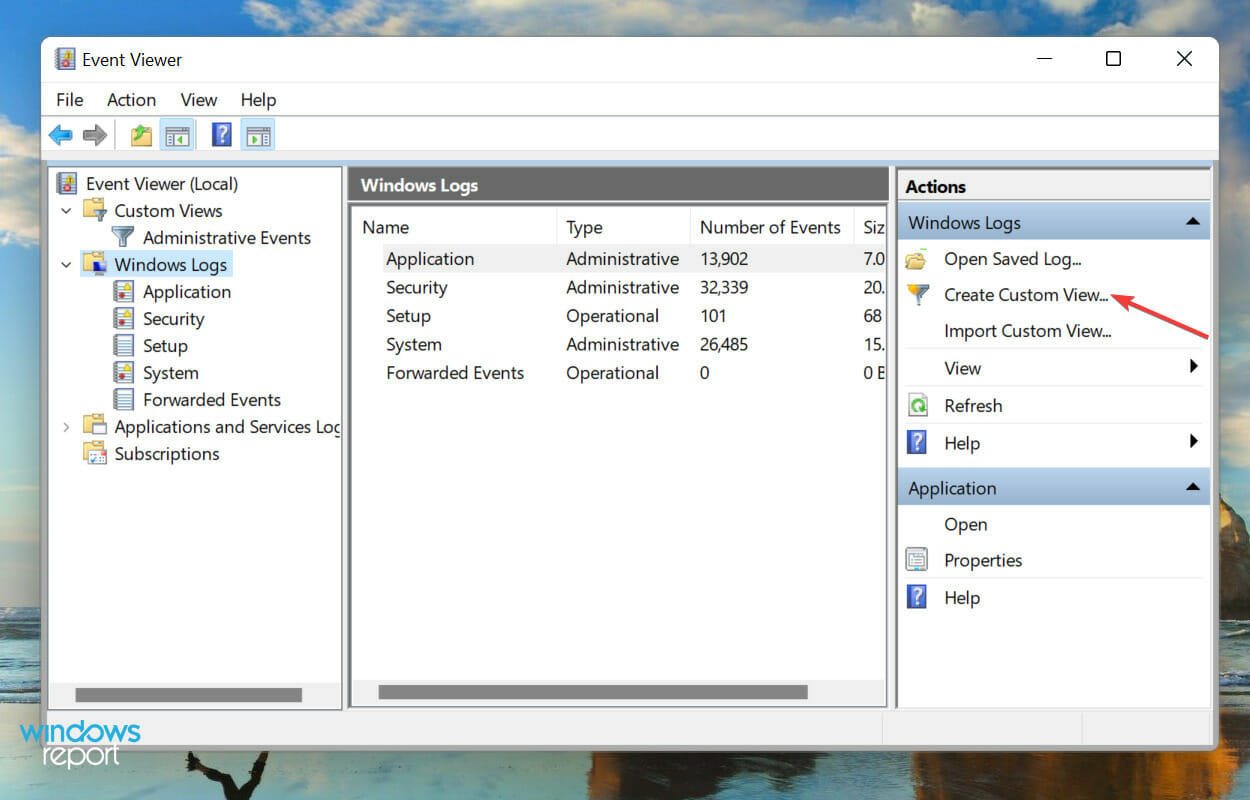
- Open the Event Viewer and click on Create Custom View on the right.
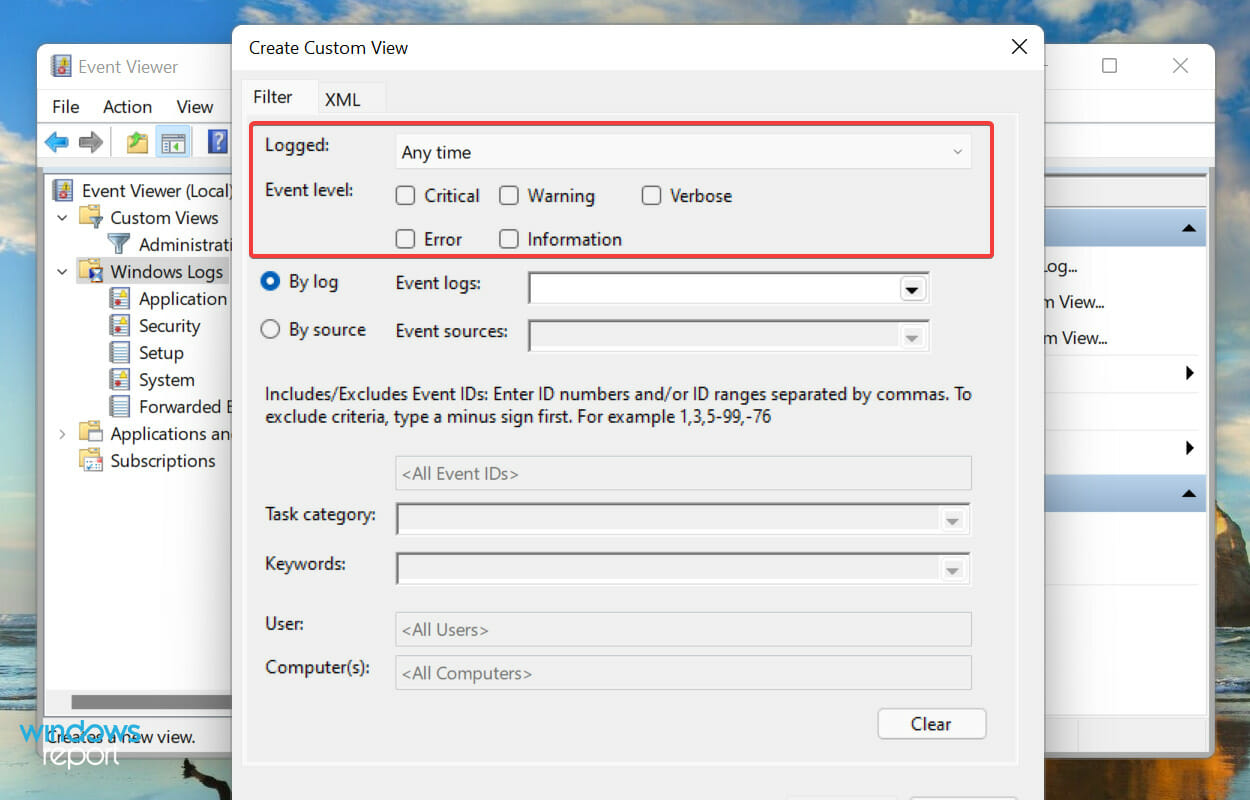
- Next, select the duration and Event Level, as you did earlier when creating a filter.
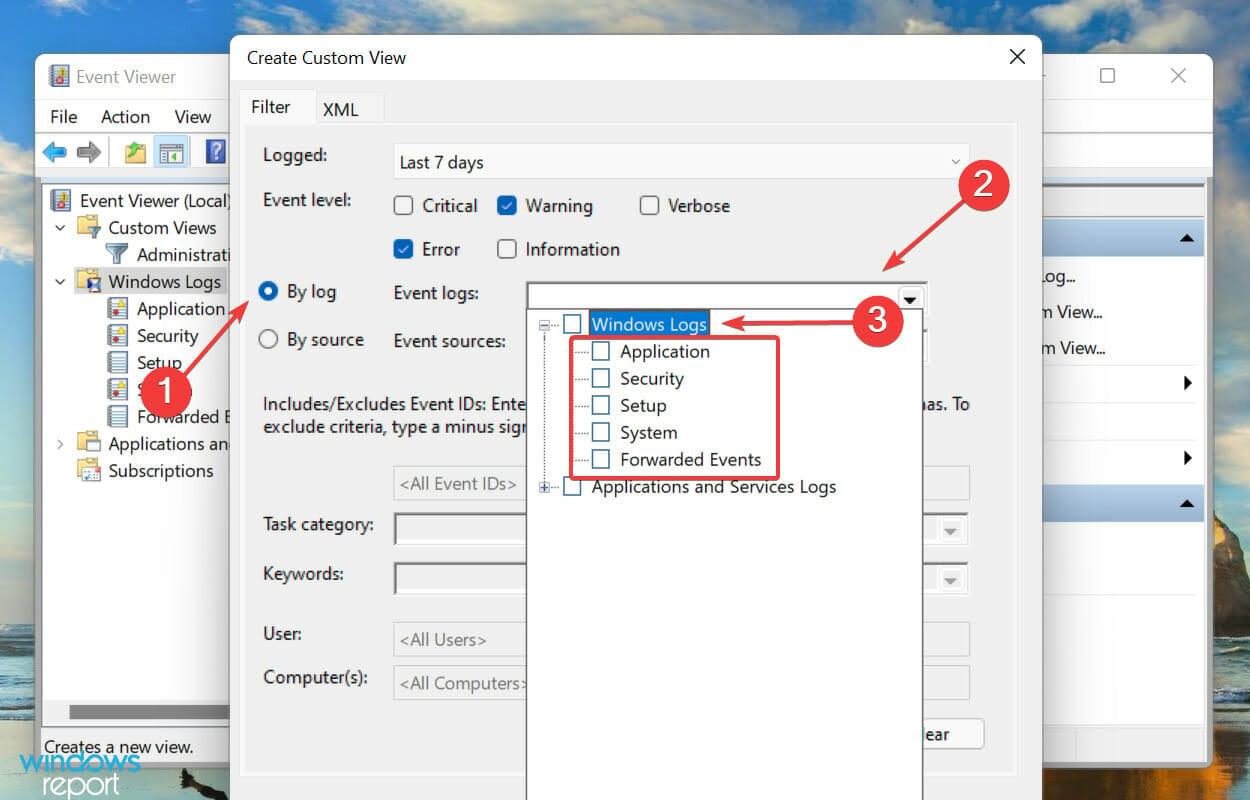
- With the By logs option selected, click on the Event logs dropdown menu, double-click on the Windows Logs entry to expand and view the various categories, and tick the checkboxes for the desired ones.
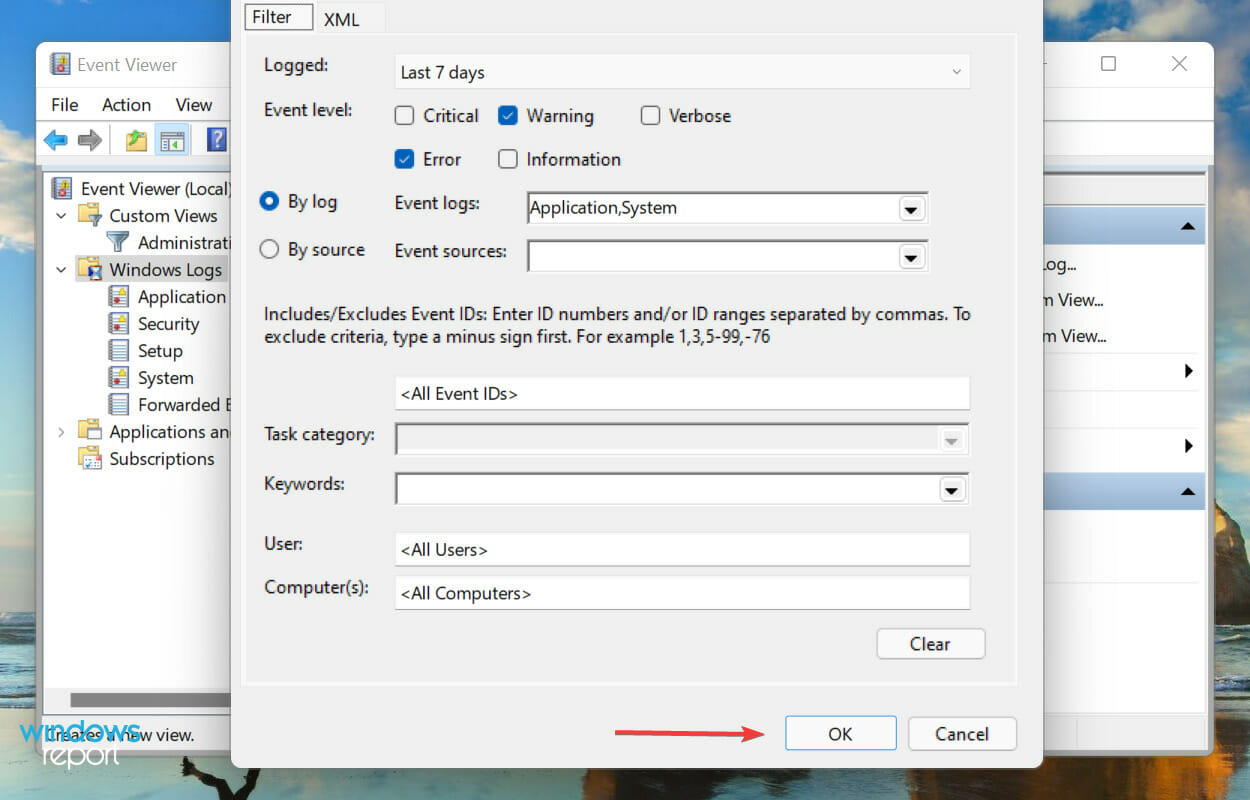
- Now, click on OK at the bottom to set filters for the new custom view.
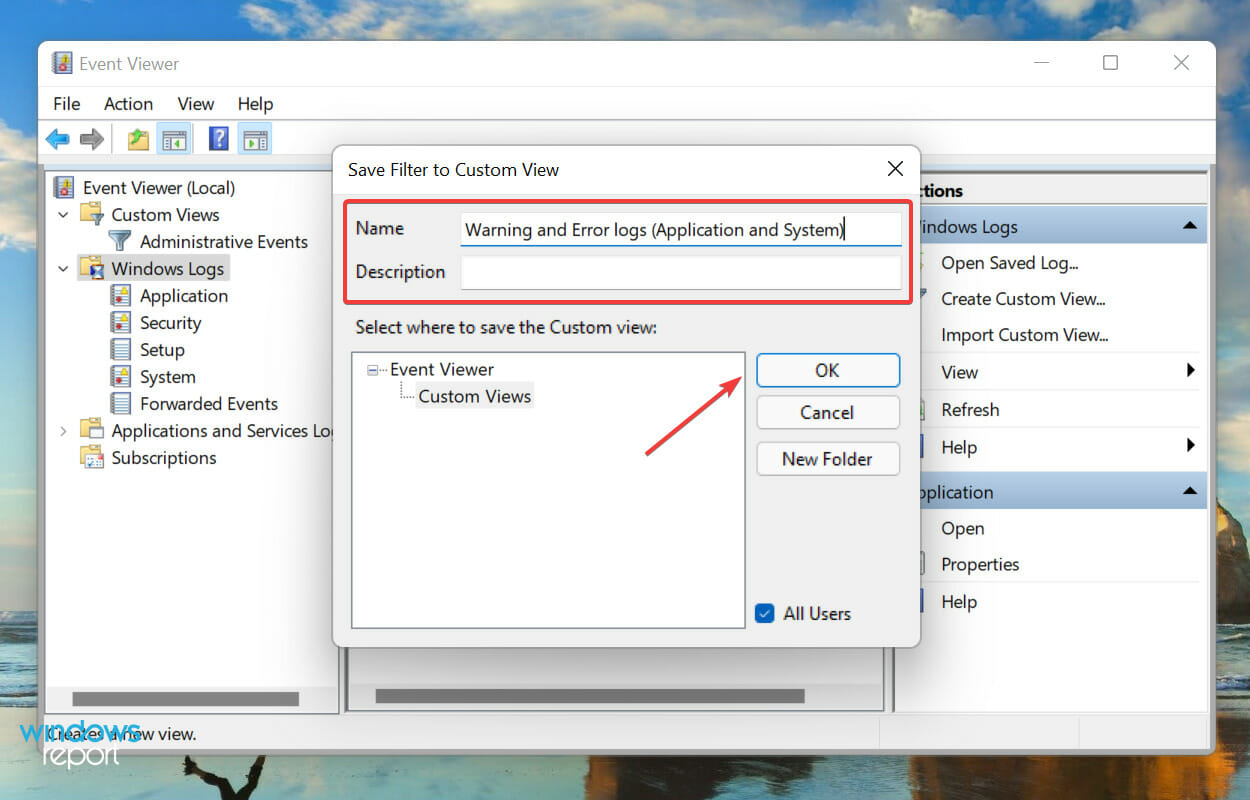
- Enter a Name and Description for the custom view and click on OK.
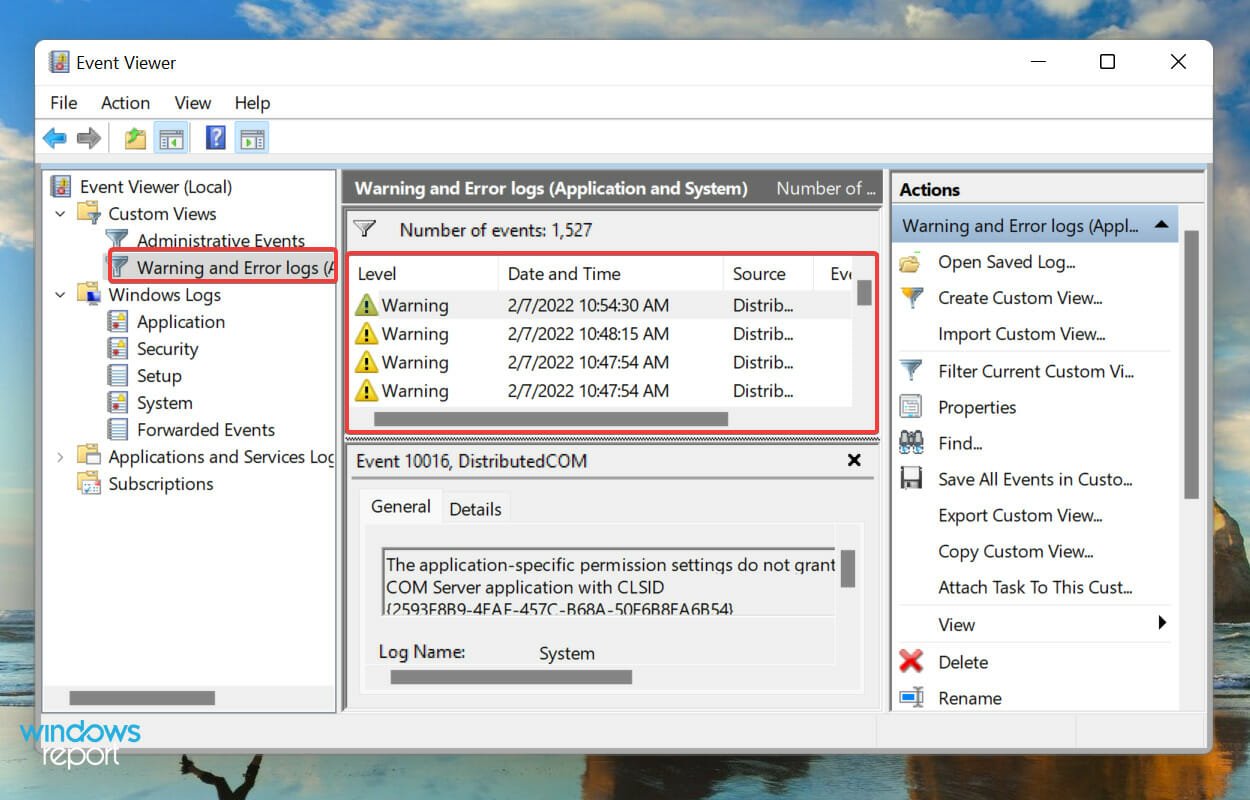
- The new custom view will now be listed on the left, and all logs falling under it on the right.
How can I clear error logs in Windows 11?
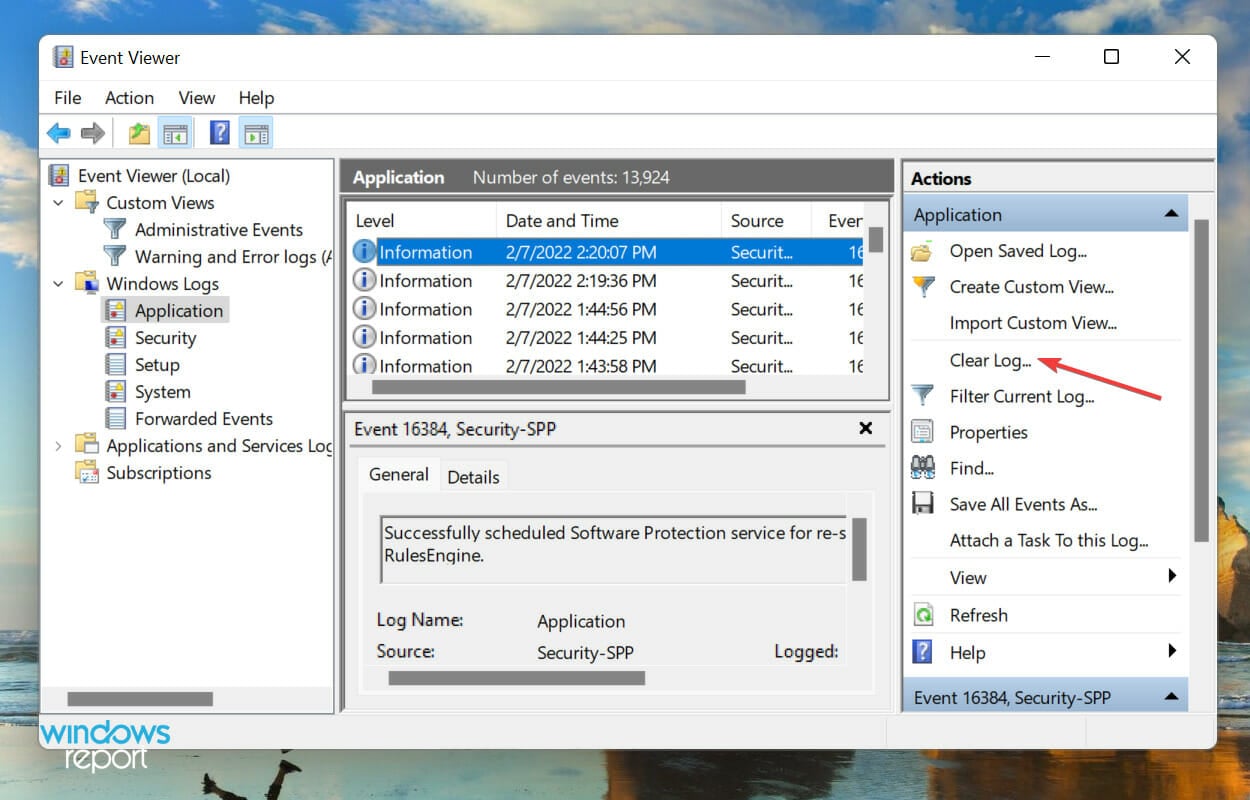
- Launch the Event Viewer, navigate to the relevant category, and click on Clear Log from the list of options on the right.
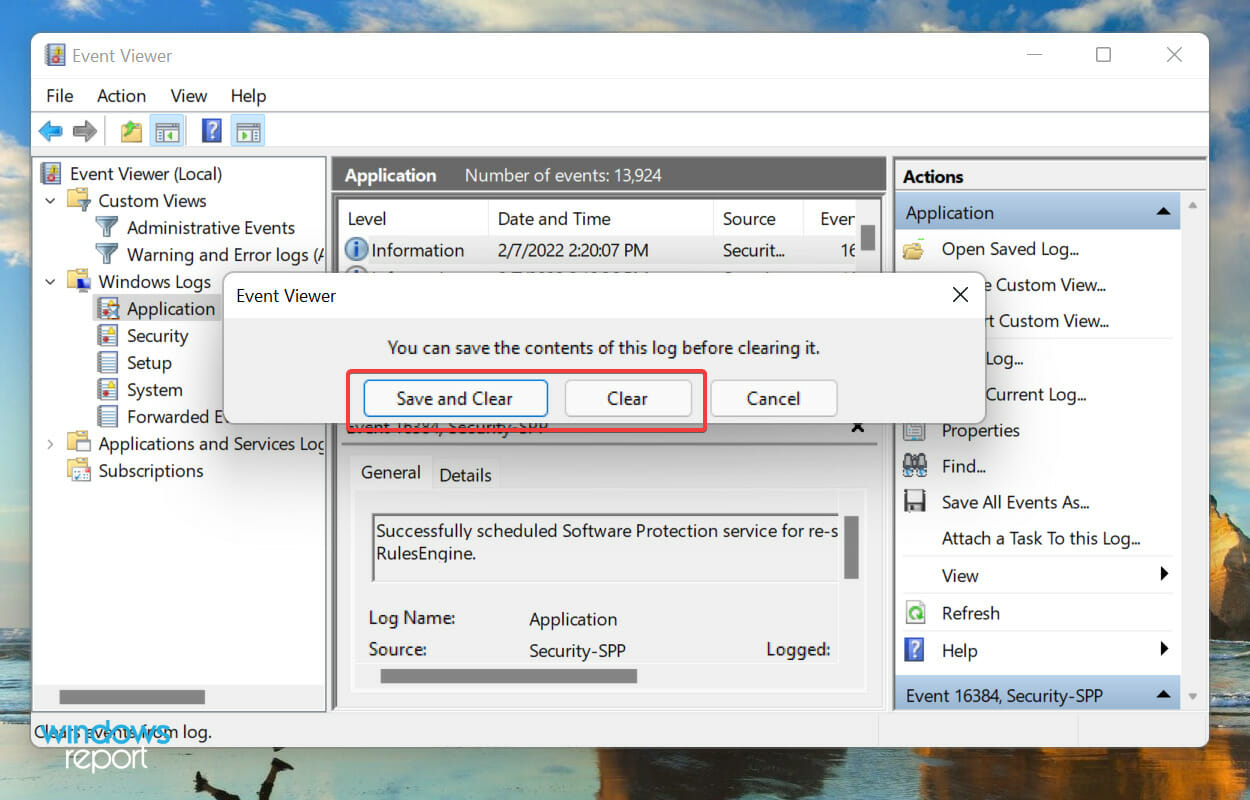
- You now have two options, either Save and Clear the error logs or directly Clear them. Choose the desired option.
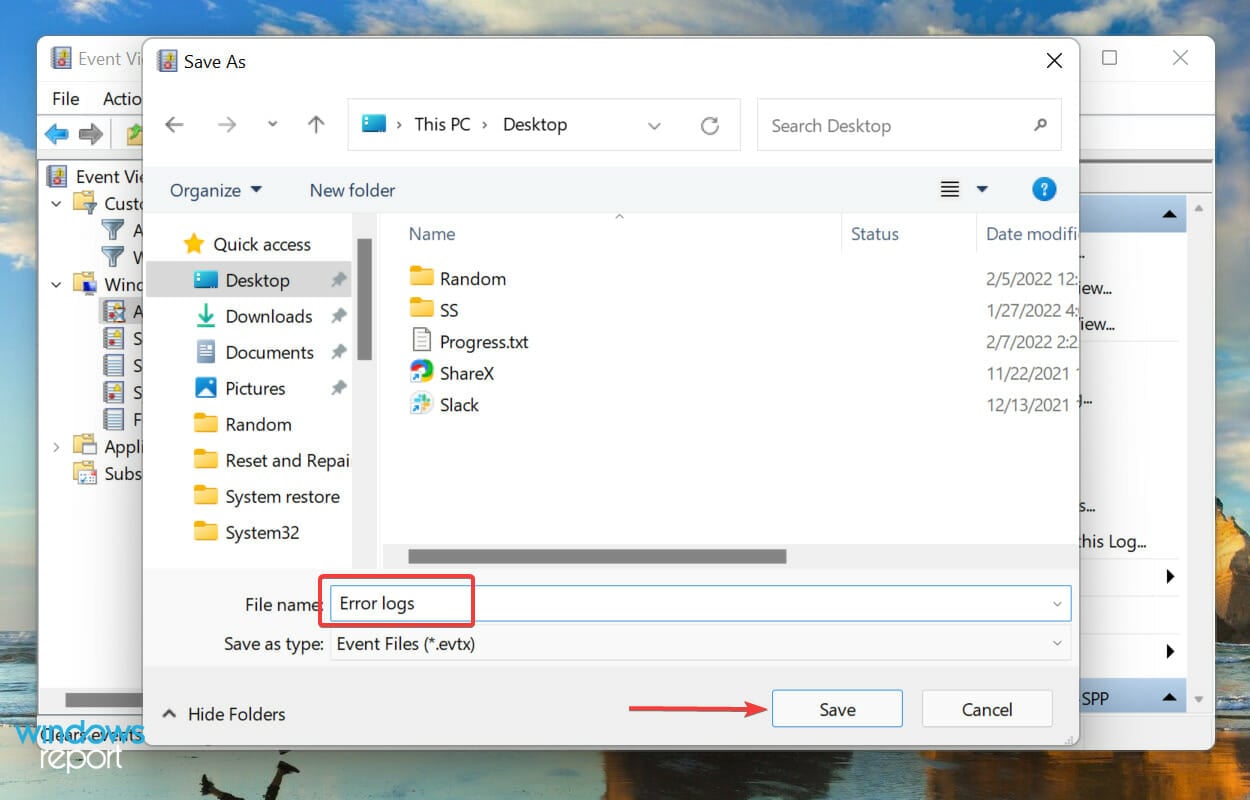
- If you selected Save and clear, choose the location for the file, add a name for it and click on Save.
- Once saved, they error logs will be cleared right away and there will be none listed under that particular category.
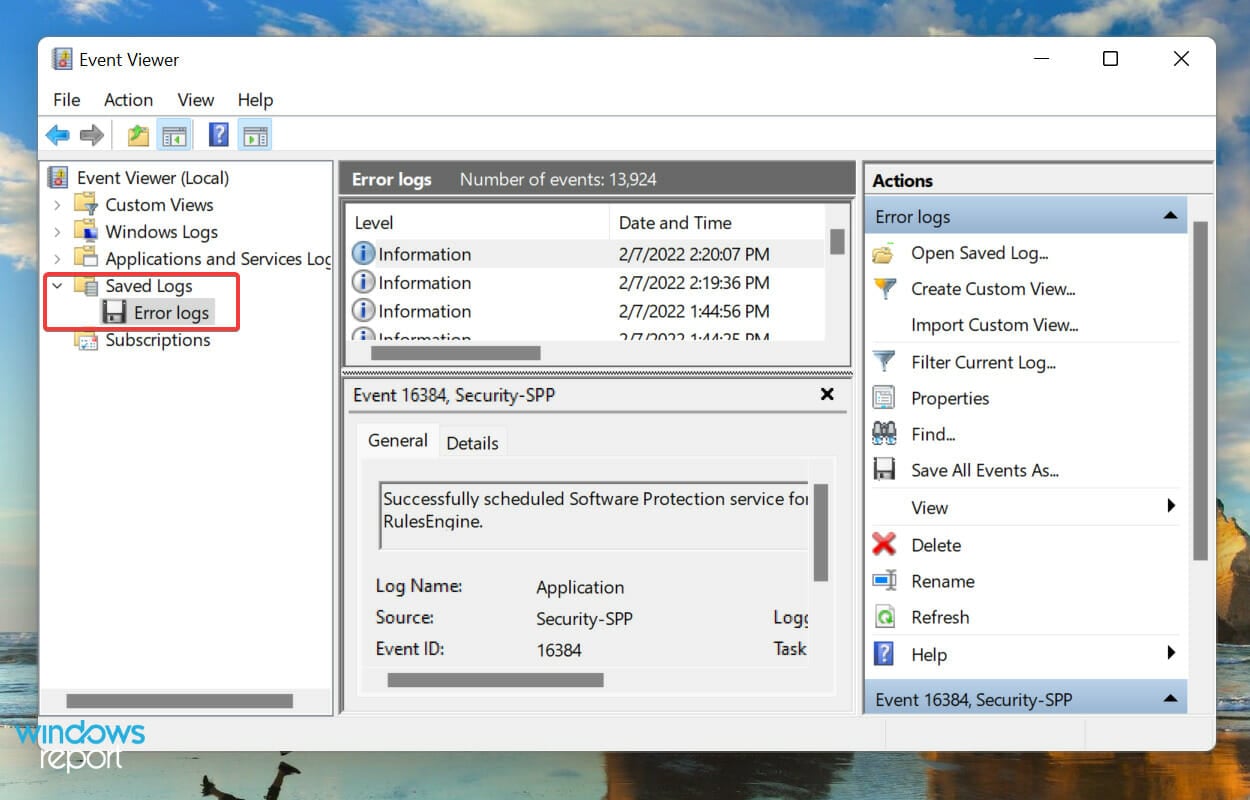
- In case you saved the error logs before deleting them, these can be found under Saved Logs in the navigation pane on the left.
The OS creates thousands of logs for each type of event, be it the successful launch of a driver and service or the most fatal errors. Like any other file, these too consume space on your hard disk, no matter how small it is.
So, if you are running out of space, or just want a more organized Event Viewer, clearing the Windows 11 error logs may help.
Checking the error logs can help you understand the BSoD errors like 139, and point you in the right direction to fix it.
How do I create my own log file in Windows 11?
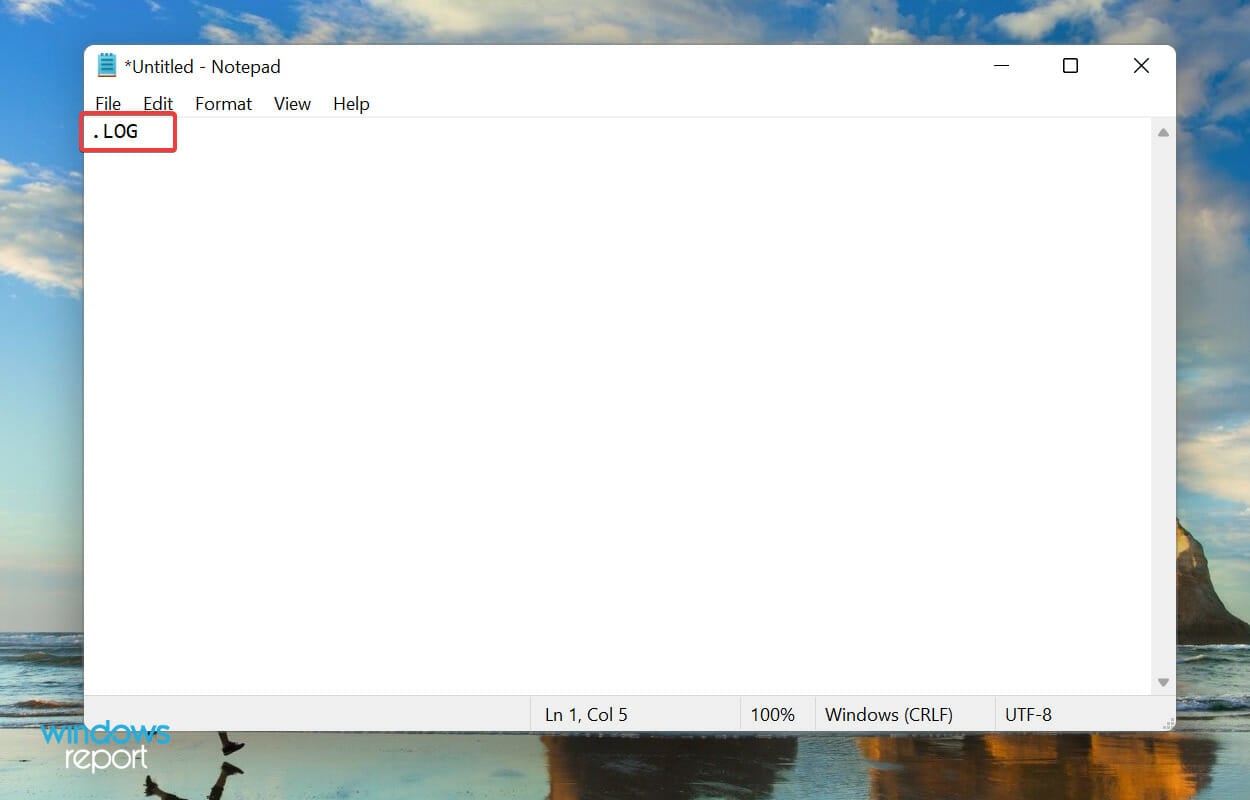
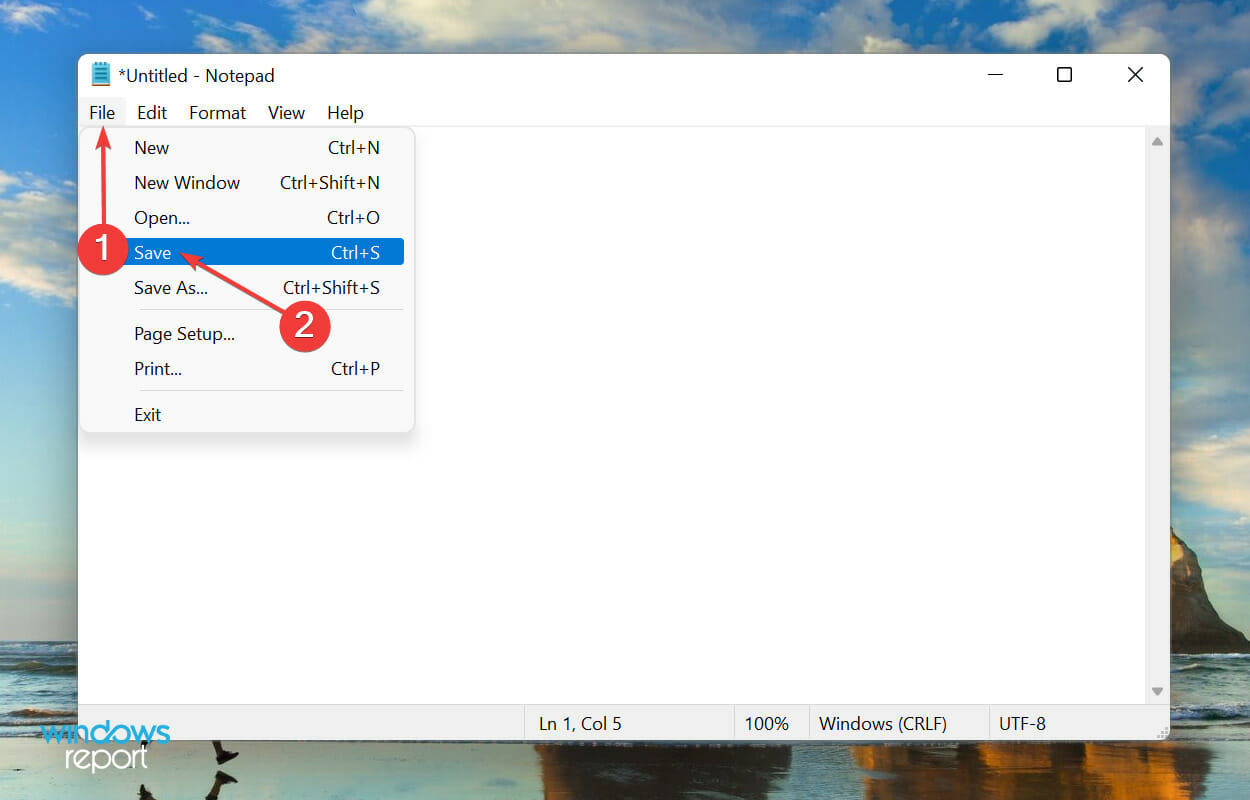
- Press Windows + S to launch the Search menu, enter Notepad in the text field at the top, and click on the relevant search result that appears.
- Enter .LOG in the very first line of the Notepad.
- Click on the File menu, and select Save from the list of options.
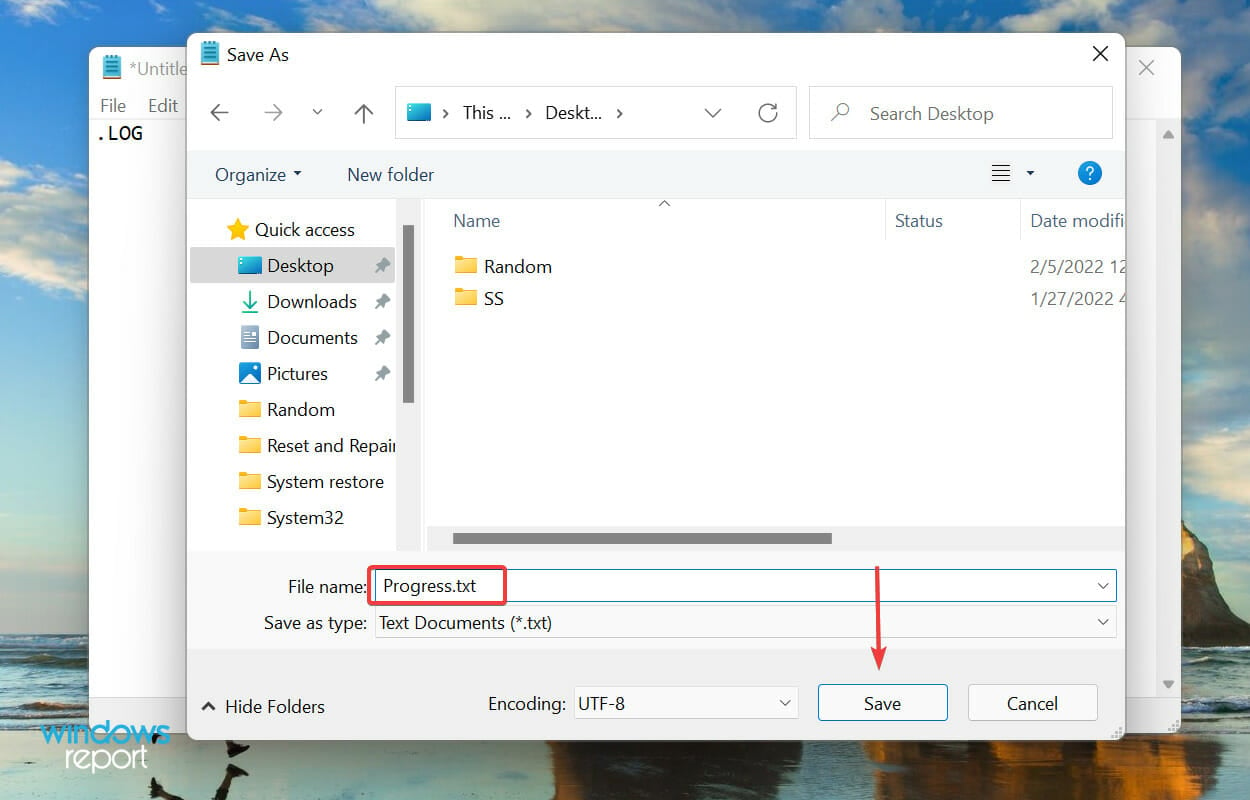
- Next, choose the location and name for the file, and click on Save at the bottom. Now, close the Notepad.
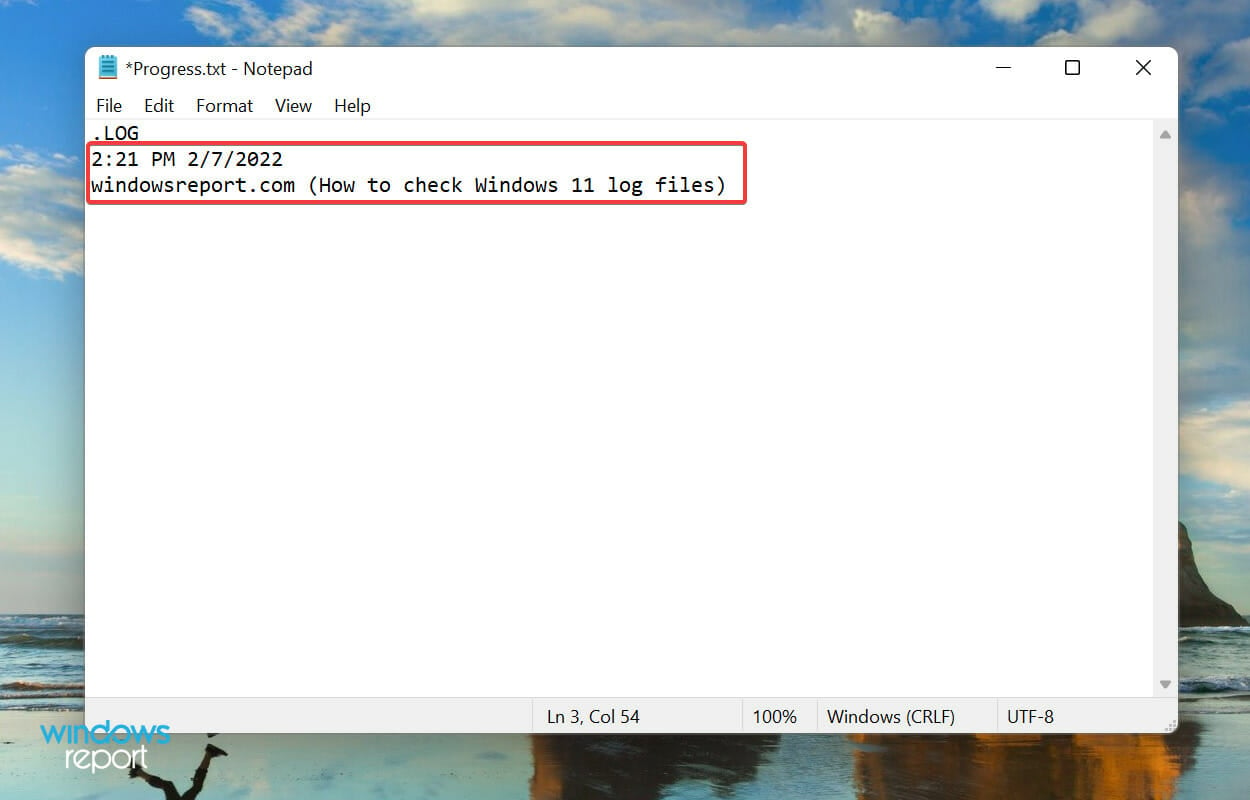
- Once the log file is created, the current date and time will be mentioned everytime you open it, and you can enter whatever you want to and hit Ctrl + S to save it.
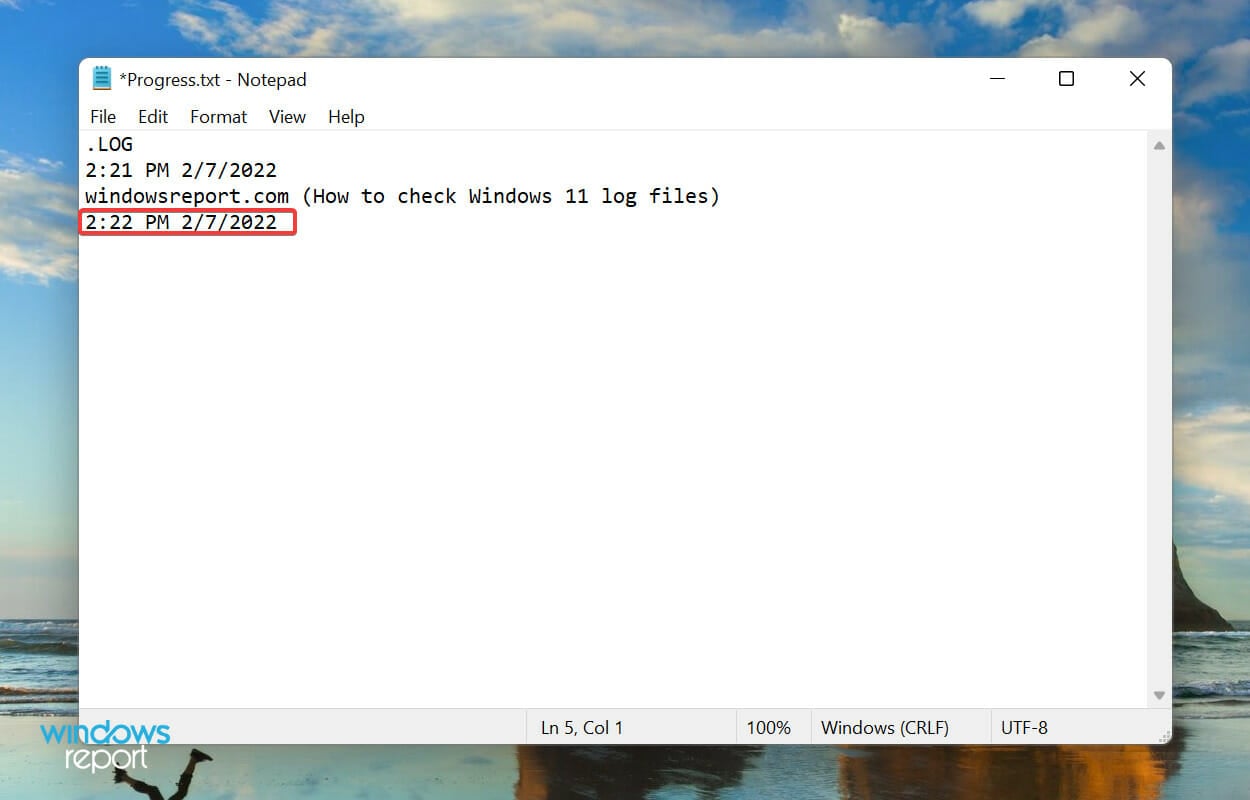
- Now, when you open the same log file the next time, the previously added entry will be listed under that date and time, and the current date and time will again be mentioned below the last entry.

A log file is used to record data. Windows uses it for errors, warnings, and information, while you can use it for other purposes.
Creating a log file is simple, and so is maintaining it. Say you want to record the progress for a book you are reading, just create a log file and enter the number of pages you read each day, or as you may please.
Why do I need to check Windows 11 error logs?
Checking error logs on Windows 11 allows you to find the underlying cause of an issue such as a BSOD (Blue Screen of Death).
That’s all you need to know about Windows 11 system logs. From now on, identifying the underlying cause of errors should no longer be a problem.
Also, if you feel that Event Viewer does not meet all your requirements, check the best apps to view errors logs in Windows 11.
Do not hesitate to comment if you have any questions or would like us to add a related topic.
Kazim Ali Alvi
Windows Hardware Expert
Kazim has always been fond of technology, be it scrolling through the settings on his iPhone, Android device, or Windows PC. He’s specialized in hardware devices, always ready to remove a screw or two to find out the real cause of a problem.
Long-time Windows user, Kazim is ready to provide a solution for your every software & hardware error on Windows 11, Windows 10 and any previous iteration. He’s also one of our experts in Networking & Security.
- Windows event logs store the information for hardware and software malfunction, including other successful operations.
- You can view the event logs with different severity across various categories in the Event Viewer (eventvwr.msc), or using the Reliability Monitor (Control Panel > System and Security > Security and Maintenance > Maintenance > View reliability history).
The Windows operating system logs and stores information about the actions performed on it, especially if any errors have occurred. This information is collected from the different Windows applications as well as the Windows components itself.
These errors are recorded in the location “C:\WINDOWS\system32\config\“. However, if you go on to this directory, you will find files that cannot be opened in any apps, and therefore, you won’t be able to view the error logs. For those purposes, the Windows OS includes two useful tools:
- The Windows Event Viewer, and
- The Reliability Monitor
These tools can be used to view and understand the different errors and warnings that occur on your computer. So if your apps keep crashing, or you keep experiencing Blue Screen of Death (BSoD) and you cannot understand why, you can resort to these tools to understand why the error has occurred and how you can mitigate it.
This guide discusses how to access the Event Viewer and the Reliability Monitor on a Windows computer, and how you can use them to understand the different error types and their causes.
Table of Contents
What are Windows Event Logs?
Event logs are files that contain structured information about the happenings of an event. These events can be errors, warnings, or simple operations. These files provide information about the different hardware and software-based operations on the system.
On a Windows computer, event logs are used to determine the cause of an error or a warning. These contain error codes and often an explanation for why something happened. For example, if the system crashes all of a sudden, Windows will generate a log explaining why it crashed.
Sometimes, the explanation is simple enough to resolve the issue. At other times, you may only be able to get a certain error code (eg. 0xC000021A) which doesn’t explain much on its own. However, you can search for this code on the internet and obtain detailed answers for the causes of the error and its possible fixes.
Event logs can contain the following information on a Windows computer:
- Log name: This is the category of the event log for which the log was generated. The different categories have been discussed below.
- Source: Name of the component or app that caused the event.
- Event ID: This is the identification number that helps administrators identify a specific logged event. This is usually the code that is used to further research the error that caused the logged event.
- Level (Type): This indicates the severity of the event log. These can be information, error, verbose, warning, or critical.
- User: Name of the user account who logged onto the computer when the event occurred.
- OpCode: When a program raises the event, it executes an activity or a certain point within an activity, and the OpCode defines a numeric value that identifies the particular activity.
- Event date/time (Logged): Indicates the date and time when the event occurred and when the log was generated.
- Task Category: This indicates what kind of recorded event log it is. To provide more details about the event, developers can include task categories in their apps if needed.
- Keywords: Event logs categorize events using keywords. These keywords help classify the type of event and provide additional context. One such common keyword is “classic”.
- Computer: Name of the computer logging the event.
Types and Categories of Windows Event Logs
If you are new to the event logs on a Windows computer, then it will be important for you to understand its types and categories. With this knowledge, you will be able to look for the right error log and understand it better.
Types/Level of event logs
Regardless of the category of an event log, there are 5 types of error logs, which are as follows:
- Information: Indicates that a service or application is running smoothly. For instance, the event will be recorded as an information event when a Windows Service is started successfully.
- Warning: These are insignificant incidents that raise the possibility of future problems. A warning event may be logged when your device is running on low disk space.
- Error: An error log, identified with a red exclamation mark, describes a serious problem that arises when a system is unable to operate as intended, such as when the operating system or an app crashes.
- Success Audit: Such type of event logs document a legitimate effort to obtain the security log through auditing. An effective login attempt, for instance, will be classified as a successful audit event.
- Failure Audit: These event logs show the security log’s audited security access failures, like not being able to access the network disc.
When reading the different event logs, we normally look for warnings or error logs, as those usually cause major issues with the system, such as the operating system crashing or resulting in BSoDs.
Categories of event logs
Other than the information about the different types of event logs, you must also understand the different categories of them. This information will let you know where to look for the event log (under which category).
- Application: Event logs regarding apps and software hosted on the computer get logged under this category. For example, an event log will be created if the Paint application or a game fails to launch.
- Security: Any events about the security of the system are stored under this category. Such events are recorded via the Windows auditing process. For example, if an unauthorized access attempt is made to the system, or a secure file deletion attempt is made, an event would be automatically registered.
- Setup: Events that occur during the Windows OS installation are recorded in the setup log. Setup events will also be registered on domain controllers relating to the Active Directory.
- System: Events about the system and its components are recorded in this category. For example, an error with the kernel will be recorded here.
- Forwarded Events: These are the event logs that have been forwarded from other devices on the network.
With this information, when an error occurs on your computer, you should be able to look under the right category and understand why it happened.
Now that you fully understand the use and benefits of event logs, let me show you how to access the event logs and make them useful.
How to view event logs on Windows
As mentioned earlier, you can access the event logs on a Windows computer using the Event Viewer, and the Reliability Monitor.
The Event Viewer can be used to access the different event categories discussed above and view all sorts of events. Whereas the Reliability Monitor provides a timeline of events that can be arranged in days and weeks. The latter focuses on system errors that may affect the reliability and performance of the system and is not as detailed as the Event Viewer.
View event logs with Event Viewer
To access the logged events in the Event Viewer, follow these steps:
-
Press the Windows key + R to launch the Run Command box.
-
Type in “eventvwr.msc” and press Enter to open the Event Viewer.
-
Expand “Windows Logs” from the left navigation pane.
-
Click on the event category that you want to access.

Open log event category -
Now, scroll through the logs in the middle pane and click on the one you need the information for.
Since there are too many logs to go through, you can apply a filter by performing these additional steps. To start, click “Filter Current Log” in the right pane.
Filter the logs -
In the Filter Current Log window, select the following elements to help you find a specific error log file:
- Logged: The duration to show the event logs for.
- Event level: The severity of the log event.
- [Optional] Event ID: If you are looking for a specific error log for which you already have the event ID.
Apply the event filters -
When done, click OK.


When the filters are applied, you can scroll through the event logs in the Event Manager, and double-click the one you want more information on.
I would also like to add that in Step 6 above, you can further narrow your search result by applying additional filters, such as a keyword, a user account name, etc.
Moreover, you can also use the “Custom View” option and filter certain types of event logs from different categories into one frame. To create a custom view, use these steps:
-
In the Event Viewer, click “Create Custom View” in the right pane.
Create a custom filter in Event Viewer -
In the “Create Custom View” window, select “By log” and then expand the drop-down menu in front of it.
-
In the drop-down menu, select the log categories that you want to view.

Select the event log categories to view -
Now select the event levels and click OK.
Create a custom view for event logs -
Now set a name for the custom view and click OK.
Assign a name to custom event view


After performing these steps, you should be able to view the shortlisted even logs directly under one category in the left pane.

In case you want to delete or edit the custom event category, simply right-click on it and select the respective option from the context menu.
View event logs with the Reliability Monitor
You can also use the Reliability Monitor to view the important error logs on your computer. Here is how to access and read the tool:
-
Press the Windows key + R to open the Run Command box.
-
Type in “control” and press Enter to launch the Control Panel.
-
Click “System and Security“.
-
Click “Security and Maintenance“.
-
Expand Maintenance.

Expand Maintenance -
Click “View Reliability History“.
Open Reliability Monitor -
Click on the day’s column for which you want to view the crash log.
Select the day to view the event logs for -
Double-click on the event in the bottom section of the Reliability Monitor to view more details.

Open the event log using the Reliability Monitor


After performing these steps, you should be able to see the complete details for the selected event log.

As you may find in the image above, the details here for the event log are somewhat different than the ones available inside the Event Viewer. However, you can use the error code to find more information about the event online.
Closing words
Understanding the crash and event logs is just as important as accessing them. There is no use in viewing the event logs if you cannot determine what they mean.
This detailed guide shows you exactly how to view and understand the system event logs and look for errors with different severity, inside different categories. You can also view them for specific days if you are not sure exactly when an error occurred.
When an application crashes, the Windows Error Reporting utility will begin to send debugging information to Microsoft. You can choose whether to send this information or not, but Windows will prompt you if you don’t want to. It will send your IP address to a Microsoft server. The privacy statement also claims that this information is only used to generate aggregate statistics. However, you might want to disable the advanced error reporting functionality for privacy reasons.
The Windows Action Center contains a list of crash reports. You can find this tool under System, Security, Maintenance, and Control Panel. The error reporting toolset is a comprehensive collection of crash logs that provide detailed information on the cause of a system crash. Most error reports are categorized by call stacks, which allows developers to quickly diagnose the cause of an issue. Regardless of the cause, these reports can be helpful for troubleshooting.
When your computer encounters an error, it may be in the form of a file called a Windows error report. This file can contain vital information about your system, such as a crash or a failed task. You can read the contents of a Windows error report file, or you can delete it, depending on your preference. If you need to see your personal information in the Windows error report file, you must follow the guidelines set forth by Microsoft.
The Windows Error Reporting toolkit provides access to crash data and helps administrators diagnose the root cause of system crashes. These files are stored in different locations in the Windows system. You can open them with the WIN+R keyboard shortcut or by tapping on the service icon in the Start menu. If you want to view your Windows error reporting files, you can click on the “Custom” option under Windows Logs and events. Once you have the custom view, you can quickly scan the crash log by selecting a specific time period.
How Do I Read Windows Errors?
Several tools exist in Windows that let you examine the activity logs on your computer. The Event Viewer is one such tool. By clicking on the “Event Viewer” icon in the Start menu, you can open the logs of various system and application events. You can also select the “Save all events” option to export all the logs. This is an excellent way to keep an eye on what is going on with your computer.
The Event Viewer is a tool that lets you view logs of all the events that occur on your computer. This tool records important events such as the logon attempts, access to resources, and much more. You can also open this log with Notepad and view the information inside. If you are unsure about the cause of your computer’s problems, you can try using the Event Viewer to diagnose and repair the issue.
Does Windows Error Reporting Do Anything?
If you’re wondering whether Windows error reporting is useful, you can easily disable it. To disable it, open the Control Panel and navigate to Security and Maintenance. In the Security and Maintenance window, find the link Problem Reporting settings. In the Related settings section, click the Disabled checkbox and click OK to close the dialog box. Now, your computer will stop reporting error messages. You’ve effectively disabled Windows error reporting.
What does Windows Error Reporting actually do? The service collects important information about crashes in Windows and delivers it to Microsoft for analysis. It also generates a “bucket signature” file that identifies the crash. Microsoft then uses this information to update its software and deliver fixes to users. However, because of the privacy concerns that this data poses, you can’t trust Windows Error Reporting.
Once the Windows Error Reporting service has started reporting errors, you can disable it altogether. You can also disable it by selecting ‘Ask me before I check for solutions’. If you’re concerned about the privacy implications of such information, you can always choose to disable it. Otherwise, you can disable the service completely by using the Windows Registry Editor. Then, restart the computer.
Is Windows Problem Reporting a Virus?
Error reporting is a service in Windows that sends information about errors that occur on the computer to Microsoft servers. This information is used to prioritize bug fixes for users. In the past, it has been used by the NSA and other government agencies to gather detailed information and exploit a system. However, there is concern over the use of this service. Users should avoid clicking the “report” button and instead disable it to prevent the system from sending reports without user consent.
To disable error reporting in Windows, open the Action Center and click the Change Action Center settings link. You can also click the flag icon in the system tray to access this menu. To disable the feature, click the option that says “Never check for solutions.” Once you disable this option, you will not receive any error reporting messages from Windows. If you have a virus or other malicious software, disable your antivirus application before trying to disable this service.
How Do You Find Out What Crashed My Computer?
There are two ways to identify the cause of a crash. The first is to open the Task Manager by pressing Ctrl, Shift, and Esc shortcut keys together. The second way is to open the process in question and use the context menu to see the processes it must end before responding. The details will help you determine whether the process is the culprit or not. If you have to perform both of these tasks, you’ll need to download special software for Windows.
The first way to determine the cause of a crash is to use a software utility called WinDbg Preview. Download this software from the Microsoft Store and install it. Once you’ve done so, you can view crash files and find out the exact reason for the crash. Unlike a black screen error, which can indicate a hardware failure, BSoD is more recoverable. In some cases, the crash is caused by a corrupt Windows update, driver error, or some other program failure.
How Does Event Viewer Diagnose a Crash?
The event ID is a unique number for each application. For example, Event ID 122 means a nonsense error. While you may have encountered this error before, you should only use Event Viewer to diagnose known problems. This way, you will not waste your time searching for the wrong error in the Event Viewer. This program can be used to troubleshoot the problem, if you know exactly what it is.
You can also create a custom view in Event Viewer. This will enable you to quickly view crash logs. You can select the date range you want to view and the logs you wish to analyze. You can also save your settings so you can easily navigate between them. This tool is great for diagnosing recurring problems. You can also use this tool to track system errors. By default, it only displays Critical events.
The next step is to access the advanced system settings on your computer. To do so, press the Windows logo key to open the Run dialog box. Type advanced into the search box in the upper right corner of the window. Next, select Advanced, then click the View advanced system settings option. You will see a section called Startup and Recovery. If you see a crash, click on it and open it up.
How Do I View the Error Log?
To view a Windows error reporting log, you need to have administrative rights on your computer. You can access it from the Run command, or you can use the Power Menu to open Windows Control Panel. Another way to access this log is by using the Windows Run command. Then, navigate to the Windows Error Logs and click on the “Event Viewer” tab. You should see a list of logs containing the error message.
You can find various types of errors in the Windows error reporting log, including system crashes, hardware and software problems, and security events. The Application Logs are found under Windows Logs. While the System logs are stored in the same place as the Application log, they contain information about the shutdown error and other problems. Once you have accessed the logs, you can export them to the Desktop for further analysis. You can then use the information found in these windows logs to fix problems on your PC.
You can also find the underlying cause of a problem by examining the Windows error log. You can filter logs and create custom views by using various techniques. In addition to filtering logs, you can even create log files with specific information. However, you should note that the Event Viewer is not always sufficient to handle all error logs in Windows. If you are not familiar with the log format, you can refer to a reference guide to help you interpret the data in the log.
Learn More Here:
1.) Windows Help Center
2.) Windows – Wikipedia
3.) Windows Blog
4.) Windows Central
Все способы:
- «Журнал ошибок» в Виндовс 10
- Включение логирования
- Запуск «Просмотра событий»
- Анализ журнала ошибок
- Вопросы и ответы: 5
Во время работы операционной системы, как и любого другого программного обеспечения, периодически возникают ошибки. Очень важно уметь анализировать и исправлять подобные проблемы, дабы в будущем они не появлялись снова. В ОС Windows 10 для этого был внедрен специальный «Журнал ошибок». Именно о нем мы и поговорим в рамках данной статьи.
«Журнал ошибок» в Виндовс 10
Упомянутый ранее журнал является лишь небольшой частью системной утилиты «Просмотр событий», которая по умолчанию присутствует в каждой версии Windows 10. Далее мы разберем три важных аспекта, которые касаются «Журнала ошибок» — включение логирования, запуск средства «Просмотр событий» и анализ системных сообщений.
Включение логирования
Для того чтобы система могла записывать все события в журнал, необходимо включить его. Для этого выполните следующие действия:
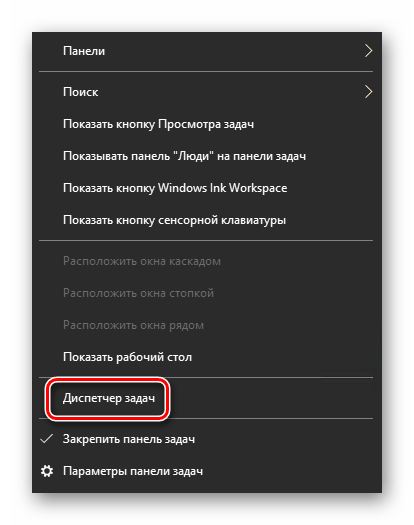
- Нажмите в любом пустом месте «Панели задач» правой кнопкой мышки. Из контекстного меню выберите пункт «Диспетчер задач».
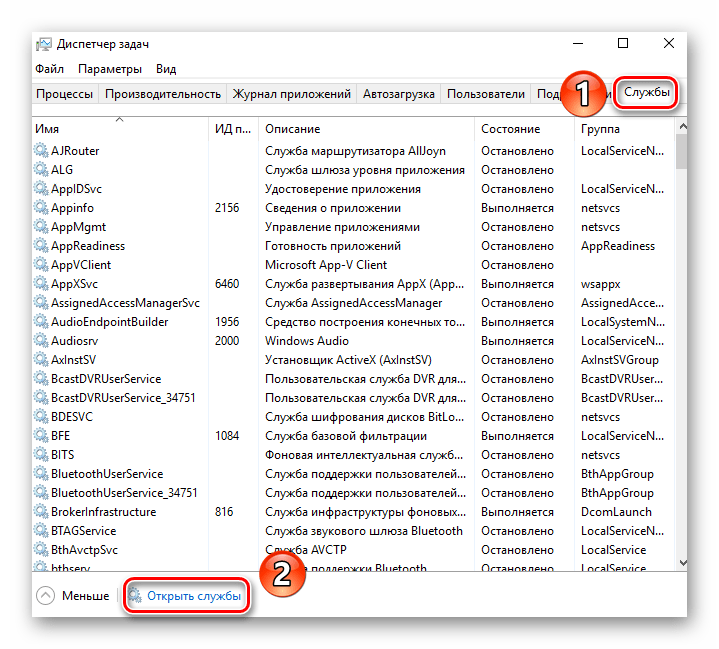
- В открывшемся окне перейдите во вкладку «Службы», а затем на самой странице в самом низу нажмите кнопку «Открыть службы».
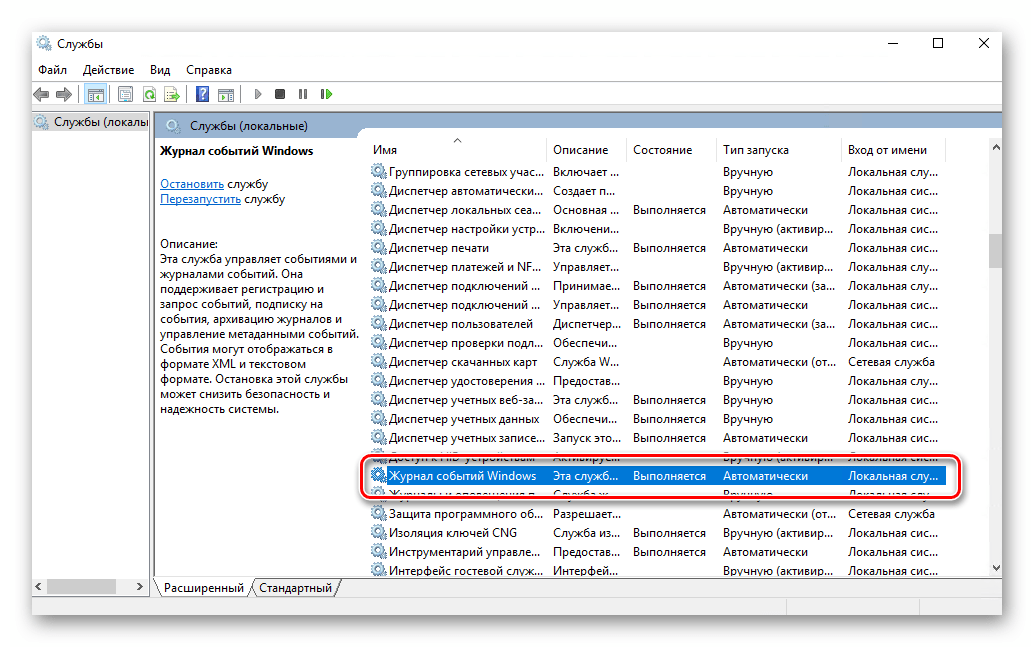
- Далее в перечне служб нужно найти «Журнал событий Windows». Убедитесь, что она запущена и работает в автоматическом режиме. Об этом должны свидетельствовать надписи в графах «Состояние» и «Тип запуска».
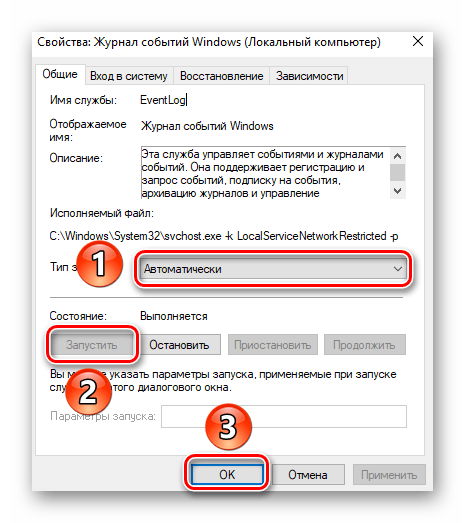
- Если значение указанных строк отличается от тех, что вы видите на скриншоте выше, откройте окно редактора службы. Для этого кликните два раза левой кнопкой мыши на ее названии. Затем переключите «Тип запуска» в режим «Автоматически», и активируйте саму службу путем нажатия кнопки «Запустить». Для подтверждения нажмите «OK».
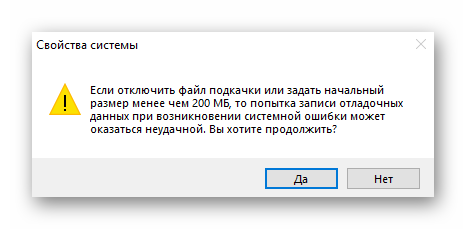
После этого остается проверить, активирован ли на компьютере файл подкачки. Дело в том, что при его выключении система попросту не сможет вести учет всех событий. Поэтому очень важно установить значение виртуальной памяти хотя бы 200 Мб. Об этом напоминает сама Windows 10 в сообщении, которое возникает при полной деактивации файла подкачки.
О том, как задействовать виртуальную память и изменить ее размер, мы уже писали ранее в отдельной статье. Ознакомьтесь с ней при необходимости.
Подробнее: Включение файла подкачки на компьютере с Windows 10
С включением логирования разобрались. Теперь двигаемся дальше.
Запуск «Просмотра событий»
Как мы уже упоминали ранее, «Журнал ошибок» входит в состав стандартной оснастки «Просмотр событий». Запустить ее очень просто. Делается это следующим образом:
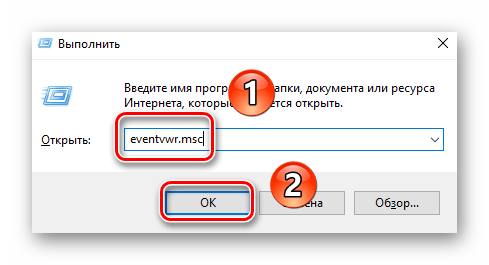
- Нажмите на клавиатуре одновременно клавишу «Windows» и «R».
- В строку открывшегося окна введите
eventvwr.mscи нажмите «Enter» либо же кнопку «OK» ниже.
В результате на экране появится главное окно упомянутой утилиты. Обратите внимание, что существуют и другие методы, которые позволяют запустить «Просмотр событий». О них мы в деталях рассказывали ранее в отдельной статье.
Подробнее: Просмотр журнала событий в ОС Windows 10
Анализ журнала ошибок
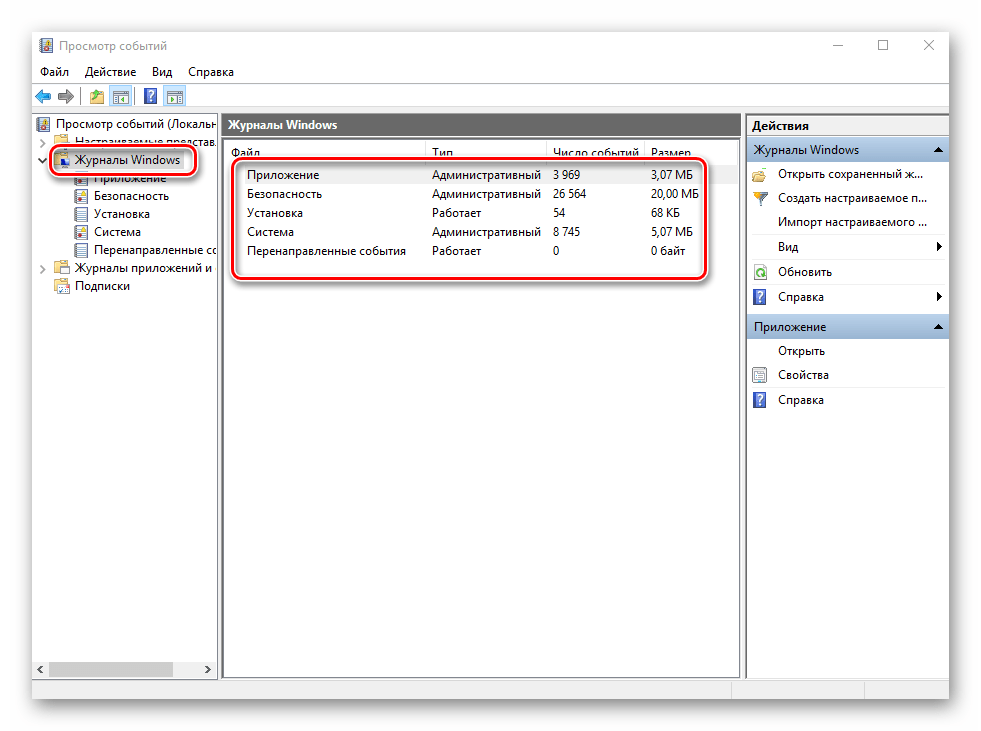
После того как «Просмотр событий» будет запущен, вы увидите на экране следующее окно.
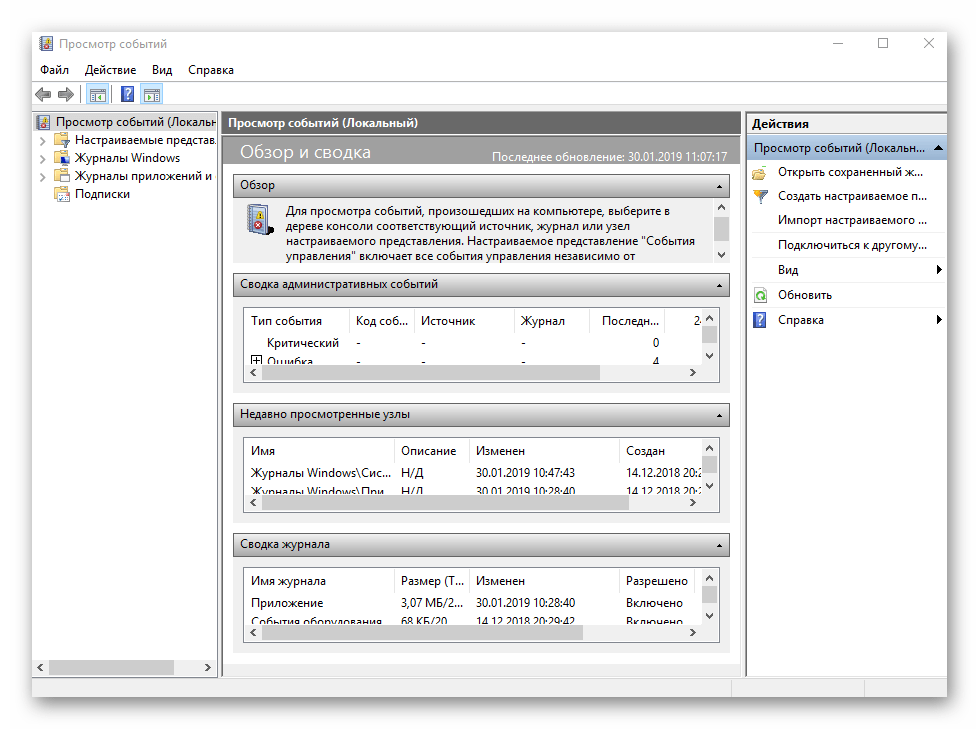
В левой его части находится древовидная система с разделами. Нас интересует вкладка «Журналы Windows». Нажмите на ее названии один раз ЛКМ. В результате вы увидите список вложенных подразделов и общую статистику в центральной части окна.
Для дальнейшего анализа необходимо зайти в подраздел «Система». В нем находится большой список событий, которые ранее происходили на компьютере. Всего можно выделить четыре типа событий: критическое, ошибка, предупреждение и сведения. Мы вкратце расскажем вам о каждом из них. Обратите внимание, что описать все возможные ошибки мы не можем просто физически. Их много и все они зависят от различных факторов. Поэтому если у вас не получится что-то решить самостоятельно, можете описать проблему в комментариях.
Критическое событие
Данное событие помечено в журнале красным кругом с крестиком внутри и соответствующей припиской. Кликнув по названию такой ошибки из списка, немного ниже вы сможете увидеть общие сведения происшествия.
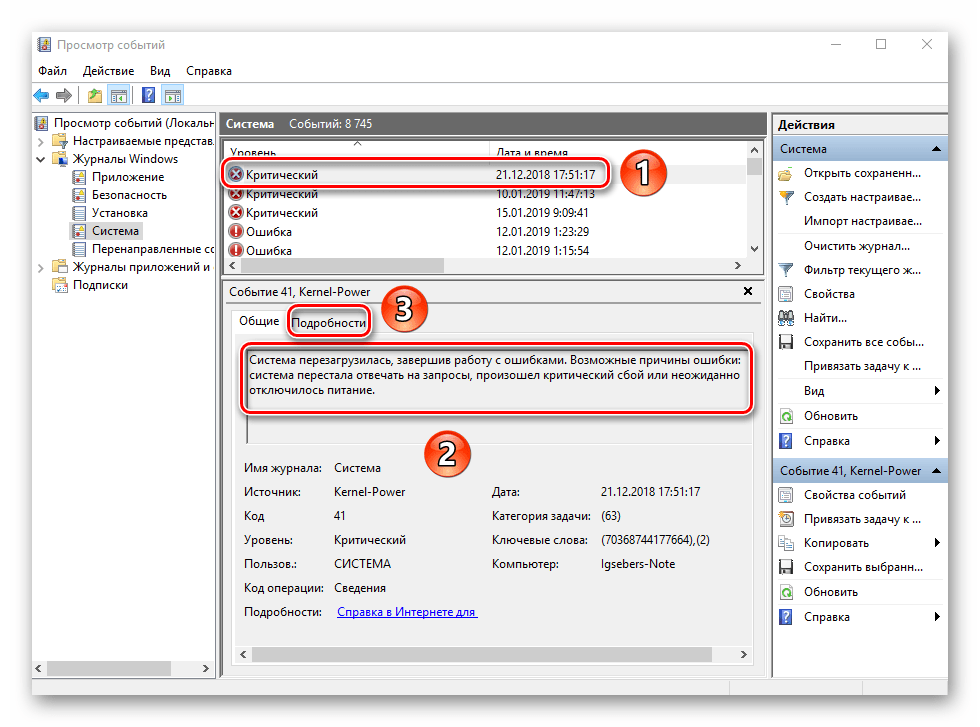
Зачастую представленной информации достаточно для того, чтобы найти решение проблемы. В данном примере система сообщает о том, что компьютер был резко выключен. Для того чтобы ошибка не появлялась вновь, достаточно просто корректно выключать ПК.
Подробнее: Выключение системы Windows 10
Для более продвинутого пользователя есть специальная вкладка «Подробности», где все событие представлены с кодами ошибок и последовательно расписаны.
Ошибка
Этот тип событий второй по важности. Каждая ошибка помечена в журнале красным кругом с восклицательным знаком. Как и в случае с критическим событием, достаточно нажать ЛКМ по названию ошибки для просмотра подробностей.
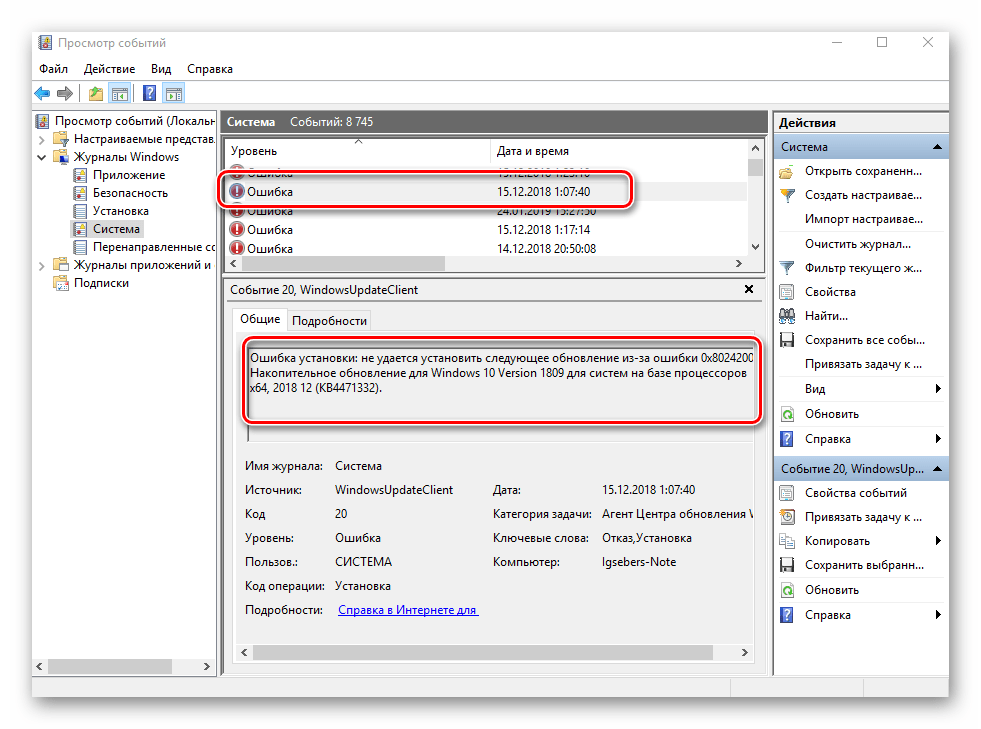
Если из сообщения в поле «Общие» вы ничего не поняли, можно попробовать найти информацию об ошибке в сети. Для этого используйте название источника и код события. Они указаны в соответствующих графах напротив названия самой ошибки. Для решения проблемы в нашем случае необходимо попросту повторно инсталлировать обновление с нужным номером.
Подробнее: Устанавливаем обновления для Windows 10 вручную
Предупреждение
Сообщения данного типа возникают в тех ситуациях, когда проблема не носит серьезный характер. В большинстве случаев их можно игнорировать, но если событие повторяется раз за разом, стоит уделить ему внимание.
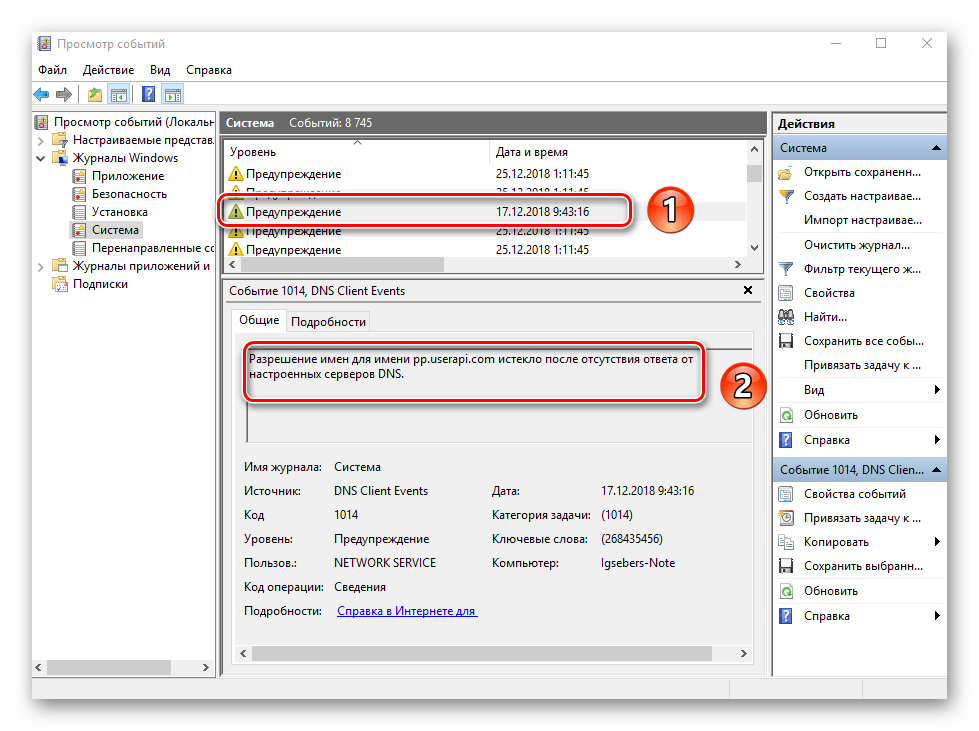
Чаще всего причиной появления предупреждения служит DNS-сервер, вернее, неудачная попытка какой-либо программы подключиться к нему. В таких ситуациях софт или утилита попросту обращается к запасному адресу.
Сведения
Этот тип событий самый безобидный и создан лишь для того, чтобы вы могли быть в курсе всего происходящего. Как понятно из его названия, в сообщение содержатся сводные данные о всех инсталлированных обновлениях и программах, созданных точках восстановления и т.д.
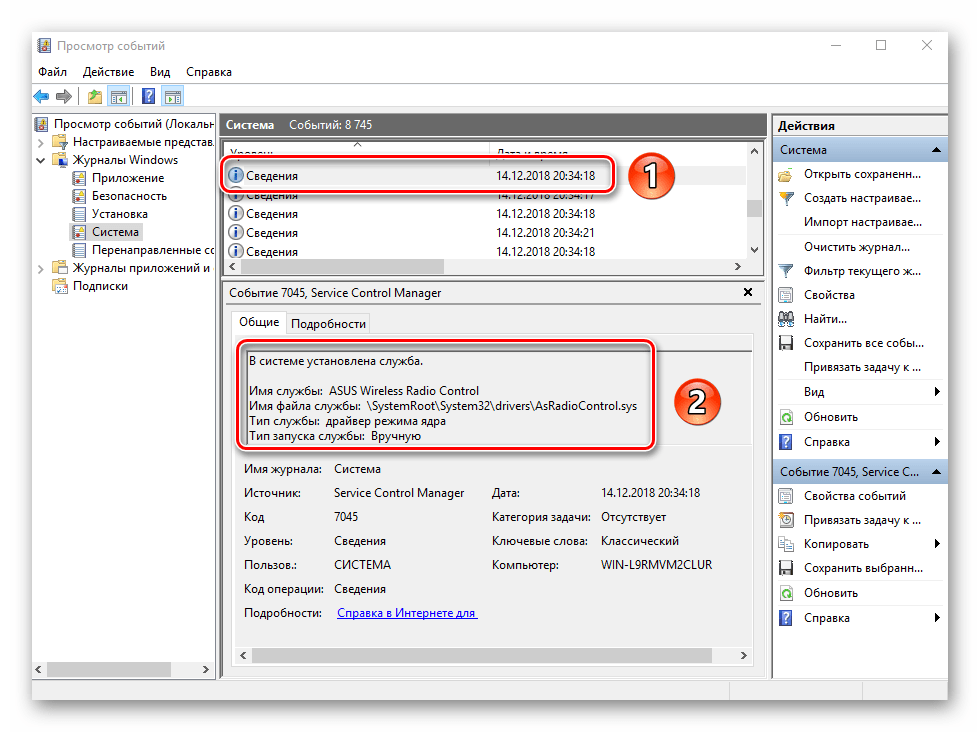
Подобная информация будет очень кстати для тех пользователей, которые не хотят устанавливать сторонний софт для просмотра последних действий Windows 10.
Как видите, процесс активации, запуска и анализа журнала ошибок очень прост и не требует от вас глубоких познаний ПК. Помните, что таким образом можно узнать информацию не только о системе, но и о других ее компонентах. Для этого достаточно в утилите «Просмотр событий» выбрать другой раздел.
Наша группа в TelegramПолезные советы и помощь