
С помощью Windows Error Reporting для «Служб УЦ» можно настроить сбор дампа при падении службы OCSP или TSP для решения проблемы сбоя.
Для активации и настройки Windows Error Reporting Service в рамках «Служб УЦ» необходимо:
1) Нажмите комбинацию клавиш Windows Key+R, в диалоговом окне в Run введите тип Regedit и нажмите Enter, чтобы открыть Редактор реестра.
2) Создать 3 каталога :
HKEY_LOCAL_MACHINE \ SOFTWARE \ Microsoft \ Windows \ Windows Error Reporting \ LocalDumps \ ocsputil.exe
HKEY_LOCAL_MACHINE \ SOFTWARE \ Microsoft \ Windows \ Windows Error Reporting \ LocalDumps \ tsputil.exe
HKEY_LOCAL_MACHINE \ SOFTWARE \ Microsoft \ Windows \ Windows Error Reporting \ LocalDumps \ w3wp.exe
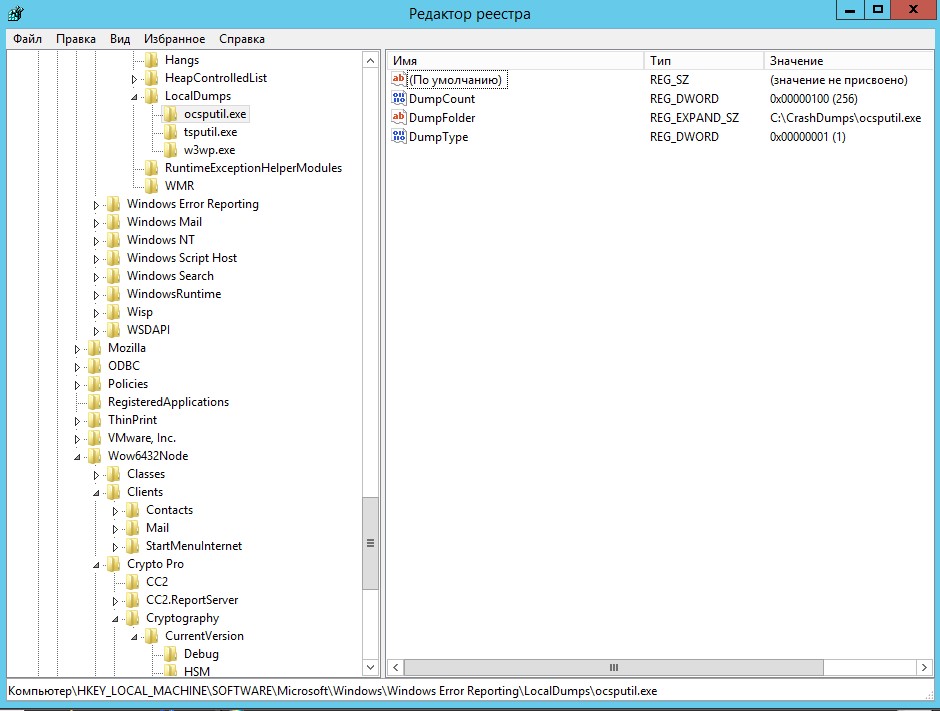
3) На правой панели, вы можете создавать различные значения данных для настройки WER. Вот различные данные, которые вы можете создавать здесь:
а) DumpFolder — (Создание: с помощью правой кнопкой мыши -> New -> Расширяемый строковый параметр)
Эта строка значения обрабатывает место для сбора данных о сбоях системы в папке. Вы можете дважды щелкнуть над созданной строкой для изменения её значения данных. Данные по умолчанию должны быть LOCALAPPDATA%% \ CrashDumps . Чтобы найти файлы, хранящие отчёт после аварии, нажмите Windows Key + R ,введите тип % LOCALAPPDATA% \ CrashDumps и получите дамп файлов.
б) DumpCount — {Создание: с помощью правой кнопкой мыши -> New -> DWORD (32 бита) }
Созданный DWORD заботится о том, сколько файлов дампа должны храниться по месту нахождения созданного ранее в шаге 1. По умолчанию это число равно 10 . Поскольку количество файлов превышает 10 , наиболее старые файлы будут удалены, а новые файлы получат своё место.
в) DumpType — {Создание: с помощью правой кнопкой мыши -> New -> DWORD (32 бита)}
Этот DWORD может быть настроен, чтобы получить файл дампа в качестве пользовательского отчёта; мини отчёта; полного дампа по вашему требованию. Используйте соответственно Value Data 0 , 1 , 2.
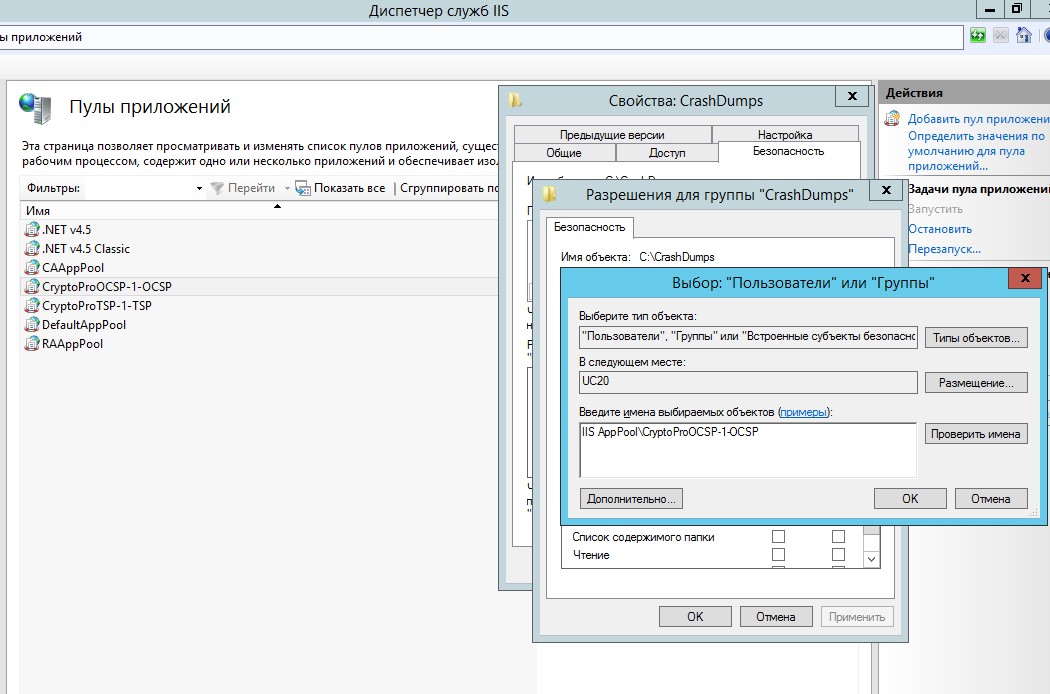
4) Для папки CrashDumps необходимо предоставить права на запись для учетной записи пула приложений службы OCSP
P.S
Пример в виде .reg — файла для OCSP и TSP + сбор дампа для процесса w3wp.exe.
Windows Registry Editor Version 5.00
[HKEY_LOCAL_MACHINE\SOFTWARE\Microsoft\Windows\Windows Error Reporting\LocalDumps]
[HKEY_LOCAL_MACHINE\SOFTWARE\Microsoft\Windows\Windows Error Reporting\LocalDumps\ocsputil.exe]
«DumpFolder»=hex(2):43,00,3a,00,5c,00,43,00,72,00,61,00,73,00,68,00,44,00,75,\
00,6d,00,70,00,73,00,5c,00,6f,00,63,00,73,00,70,00,75,00,74,00,69,00,6c,00,\
2e,00,65,00,78,00,65,00,00,00
«DumpCount»=dword:00000100
«DumpType»=dword:00000001
[HKEY_LOCAL_MACHINE\SOFTWARE\Microsoft\Windows\Windows Error Reporting\LocalDumps\tsputil.exe]
«DumpFolder»=hex(2):43,00,3a,00,5c,00,43,00,72,00,61,00,73,00,68,00,44,00,75,\
00,6d,00,70,00,73,00,5c,00,74,00,73,00,70,00,75,00,74,00,69,00,6c,00,2e,00,\
65,00,78,00,65,00,00,00
«DumpCount»=dword:00000100
«DumpType»=dword:00000001
[HKEY_LOCAL_MACHINE\SOFTWARE\Microsoft\Windows\Windows Error Reporting\LocalDumps\w3wp.exe]
«DumpFolder»=hex(2):43,00,3a,00,5c,00,43,00,72,00,61,00,73,00,68,00,44,00,75,\
00,6d,00,70,00,73,00,5c,00,77,00,33,00,77,00,70,00,2e,00,65,00,78,00,65,00,\
00,00
«DumpCount»=dword:00000100
«DumpType»=dword:00000001
Download Windows Speedup Tool to fix errors and make PC run faster
Whenever a system crashes, using dump files (.dmp), we can easily analyze what has caused the issue. Using dump analysis, errors and crashes can be resolved out. Windows Error Reporting (WER), introduced since Windows Vista, works in the way to collect user-mode dumps. But this feature is not enabled by default in Windows 11/10/8, and a registry trick can be operated to bring it into action.
In this article, I’ll show you how to enable and configure User Mode Dumps creation and collection using Windows Error Reporting service via Windows Registry so that you can easily collect dump files in a folder inside Explorer. Please note that applications that do their own custom crash reporting, including .NET applications are not supported by this feature.
As the User Mode Dumps creation feature is not enabled by default, you can employ the following registry trick to make it live:
1. Press Windows Key + R combination, type put Regedt32.exe in Run dialog box and hit Enter to open the Registry Editor.
2. Navigate here:
HKEY_LOCAL_MACHINE\SOFTWARE\Microsoft\Windows\Windows Error Reporting\LocalDumps

3. In the right pane of this location, you can create different value data to configure WER. Here are the various data you can create here:
A] DumpFolder – (Creation : using Right click -> New -> Expandable String Value)
This string value handles the location to collect crash data in a folder. You can double click the above-created string to modify its Value data. The default Value data should be %LOCALAPPDATA%\CrashDumps.
To find dump files stored after a crash, press Windows Key + R, type %LOCALAPPDATA%\CrashDumps and get the dump files.
B] DumpCount – {Creation : using Right click -> New -> DWORD (32-bit) Value}
The above-created DWORD takes care of how many dump files should be stored at the location created previously in step a. By default, this number is 10.
As the number of files exceeds 10, the oldest files will be erased, and new files will receive their place.
C] DumpType – {Creation : using Right click -> New -> DWORD (32-bit) Value}
This DWORD can be configured to get the dump file as Custom dump; Mini dump; Full dump according to your requirement. Use Value Data 0, 1, 2, respectively.
Thus in this way, you can store the dump files for system crashes. If you’re looking to store dump files for a particular application, then you need to create the subkey to LocalDumps key:
HKEY_LOCAL_MACHINE\Software\Microsoft\Windows\Windows Error Reporting\LocalDumps
For example, if you want to store dump files for ImageReady, a component application of Adobe Photoshop, you can name the subkey as ImageReady.exe. So the subkey can be located as:
HKEY_LOCAL_MACHINE\Software\Microsoft\Windows\Windows Error Reporting\LocalDumps\ImageReady.exe.
Then you can perform step 3 to configure what type of data to be stored for this subkey particularly. Please note that the settings of subkey i.e. ImageReady.exe overrides the setting of the main key i.e. LocalDumps.
Disable User Mode Dumps creation
To Disable User Mode Dumps creation, simply delete the registry key.
Remember to create a system restore point first always.
I hope you find the article useful!
An Electrical Engineer by profession, Kapil is a Microsoft MVP and a Windows Insider MVP. Please read the entire post & the comments first & create a system restore point before making any changes to your system.
Reader Interactions
Debugging Stack Traces from Crash Dumps
On windows, you can configure your system to automatically collect crash dumps of your applications and use Visual Studio or WinDBG to debug them.
Collecting Crash Dumps
Configuring Windows Error Reporting
Windows Error Reporting (WER) can be configured to collect full dumps from application crashes, and store them locally on your machine. Since this feature is not enabled by default, its activation requires administrator privileges. Follow the steps below to configure it.
- Open the Registry Editor by typing “regedit” (1) in the Start Menu and pressing Enter.
- Navigate to the Windows Error Reporting (1) key under HKEY_LOCAL_MACHINE\SOFTWARE\Microsoft\Windows\Windows Error Reporting.

- If it’s not present already, add the LocalDumps key by right-clicking (1) on the Windows Error Reporting key and selecting New (2) > Key (3).

- Name the key LocalDumps (1) and press Enter.

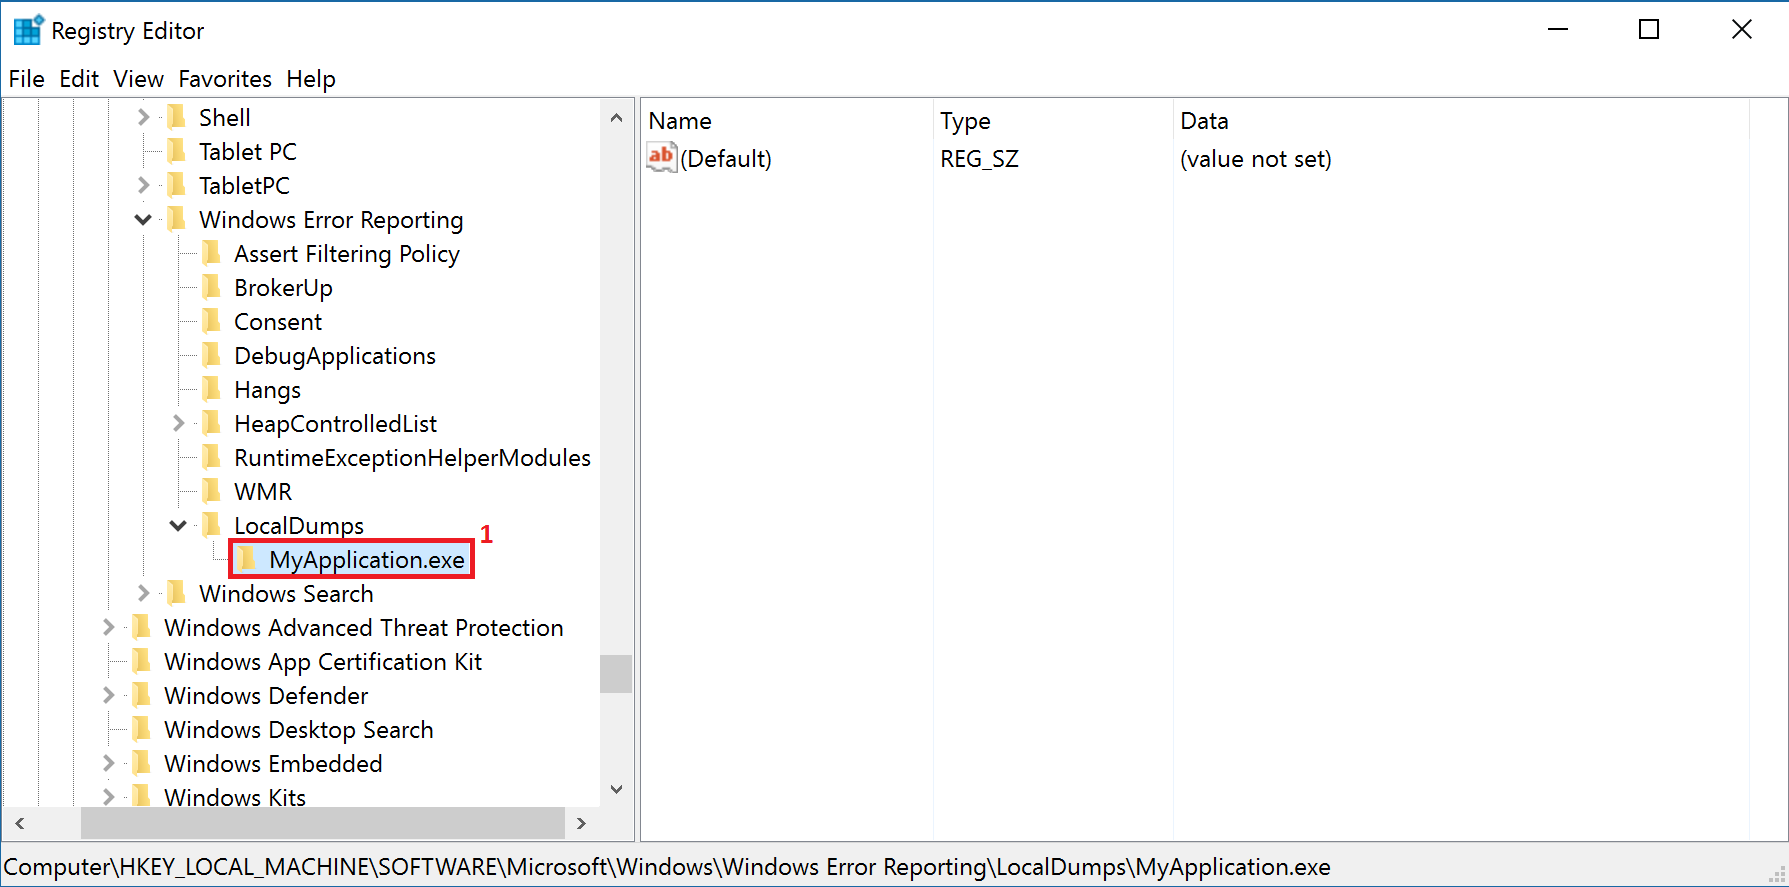
- Following the same steps, create another new key for your application under the LocalDumps key. For example, HKEY_LOCAL_MACHINE\Software\Microsoft\Windows\Windows Error Reporting\LocalDumps\MyApplication.exe (1).
- Under the MyApplication.exe key, add the values on the table below by right-clicking on the right pane of the Registry Editor and selecting New (1) followed by the corresponding value type (2).
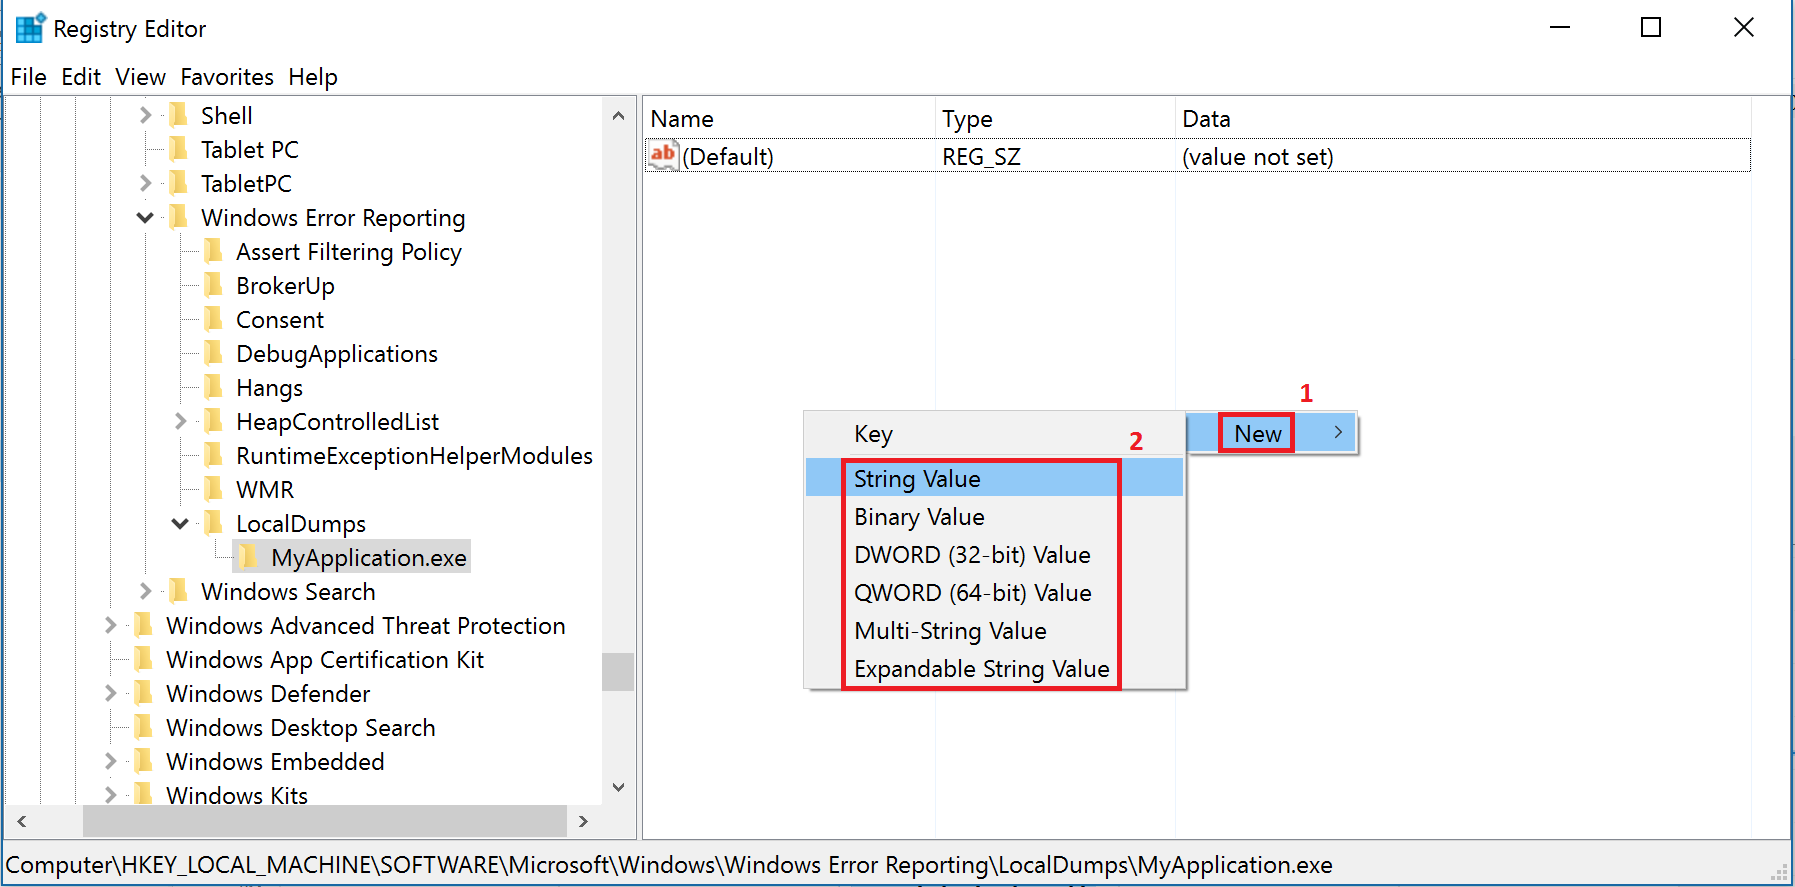
Table 1: Registry Values for Collecting Crash Dumps
| Value | Description | Type | Value Data |
|---|---|---|---|
| DumpFolder | The path where the dump files are going to be stored. | Expandable String Value (REG_EXPAND_SZ) | %LOCALAPPDATA%\CrashDumps |
| DumpCount | The maximum number of dump files in the folder. When the maximum value is exceeded, the oldest dump file in the folder will be replaced with the new dump file. | DWORD (32-bit) Value (REG_DWORD) | 10 |
| DumpType | 0: Custom dump 1: Mini dump 2: Full dump |
DWORD (32-bit) Value (REG_DWORD) | 2 |
| CustomDumpFlags | The custom dump options to be used. This value is used only when DumpType is set to 0. | DWORD (32-bit) Value (REG_DWORD) | 0 |
- Once you have created the above values, right-click (1) on them and select Modify (2) to set their value data, still according to the table of the previous step.

- Enter the corresponding value data (1) for each value, selecting its Base (2) if necessary, and click OK (3).

Once you’re done, you should have the keys and values below:

Your system should now collect crash dumps for your application whenever it crashes. For more information on the process above, check the Windows Dev Center Collecting User-Mode Dumps documentation.
Configuring your Visual Studio Solution
Removing Spaces from the Application Executable Name
To properly generate and debug the crash dump files, your application executable name must not contain any spaces. To change your executable name:
- Right-click on your project (1) in Visual Studio and select Properties (2).

- In the Properties Window, select General (1) under Configuration Properties (2) in the left menu and change the Target Name (3) field, which corresponds to your executable name.

If you changed your executable name, don’t forget to rebuild your app with the new settings.
Setting the Debug Information Option
For the crash dump files to be fully generated, your project Debug Information option must be enabled.
- Right-click on your project (1) in Visual Studio and select Properties (2).
- In the Properties Window, select General (1) under Clang (2) in the left menu and change the Debug Information field to “Yes (-g)” (3) if it’s not already enabled.

If you changed the Debug Information field, don’t forget to rebuild your app with the new settings.
Using Visual Studio to Debug Crash Dumps
You can open a crash dump in Visual Studio to debug it.
- Open Visual Studio.
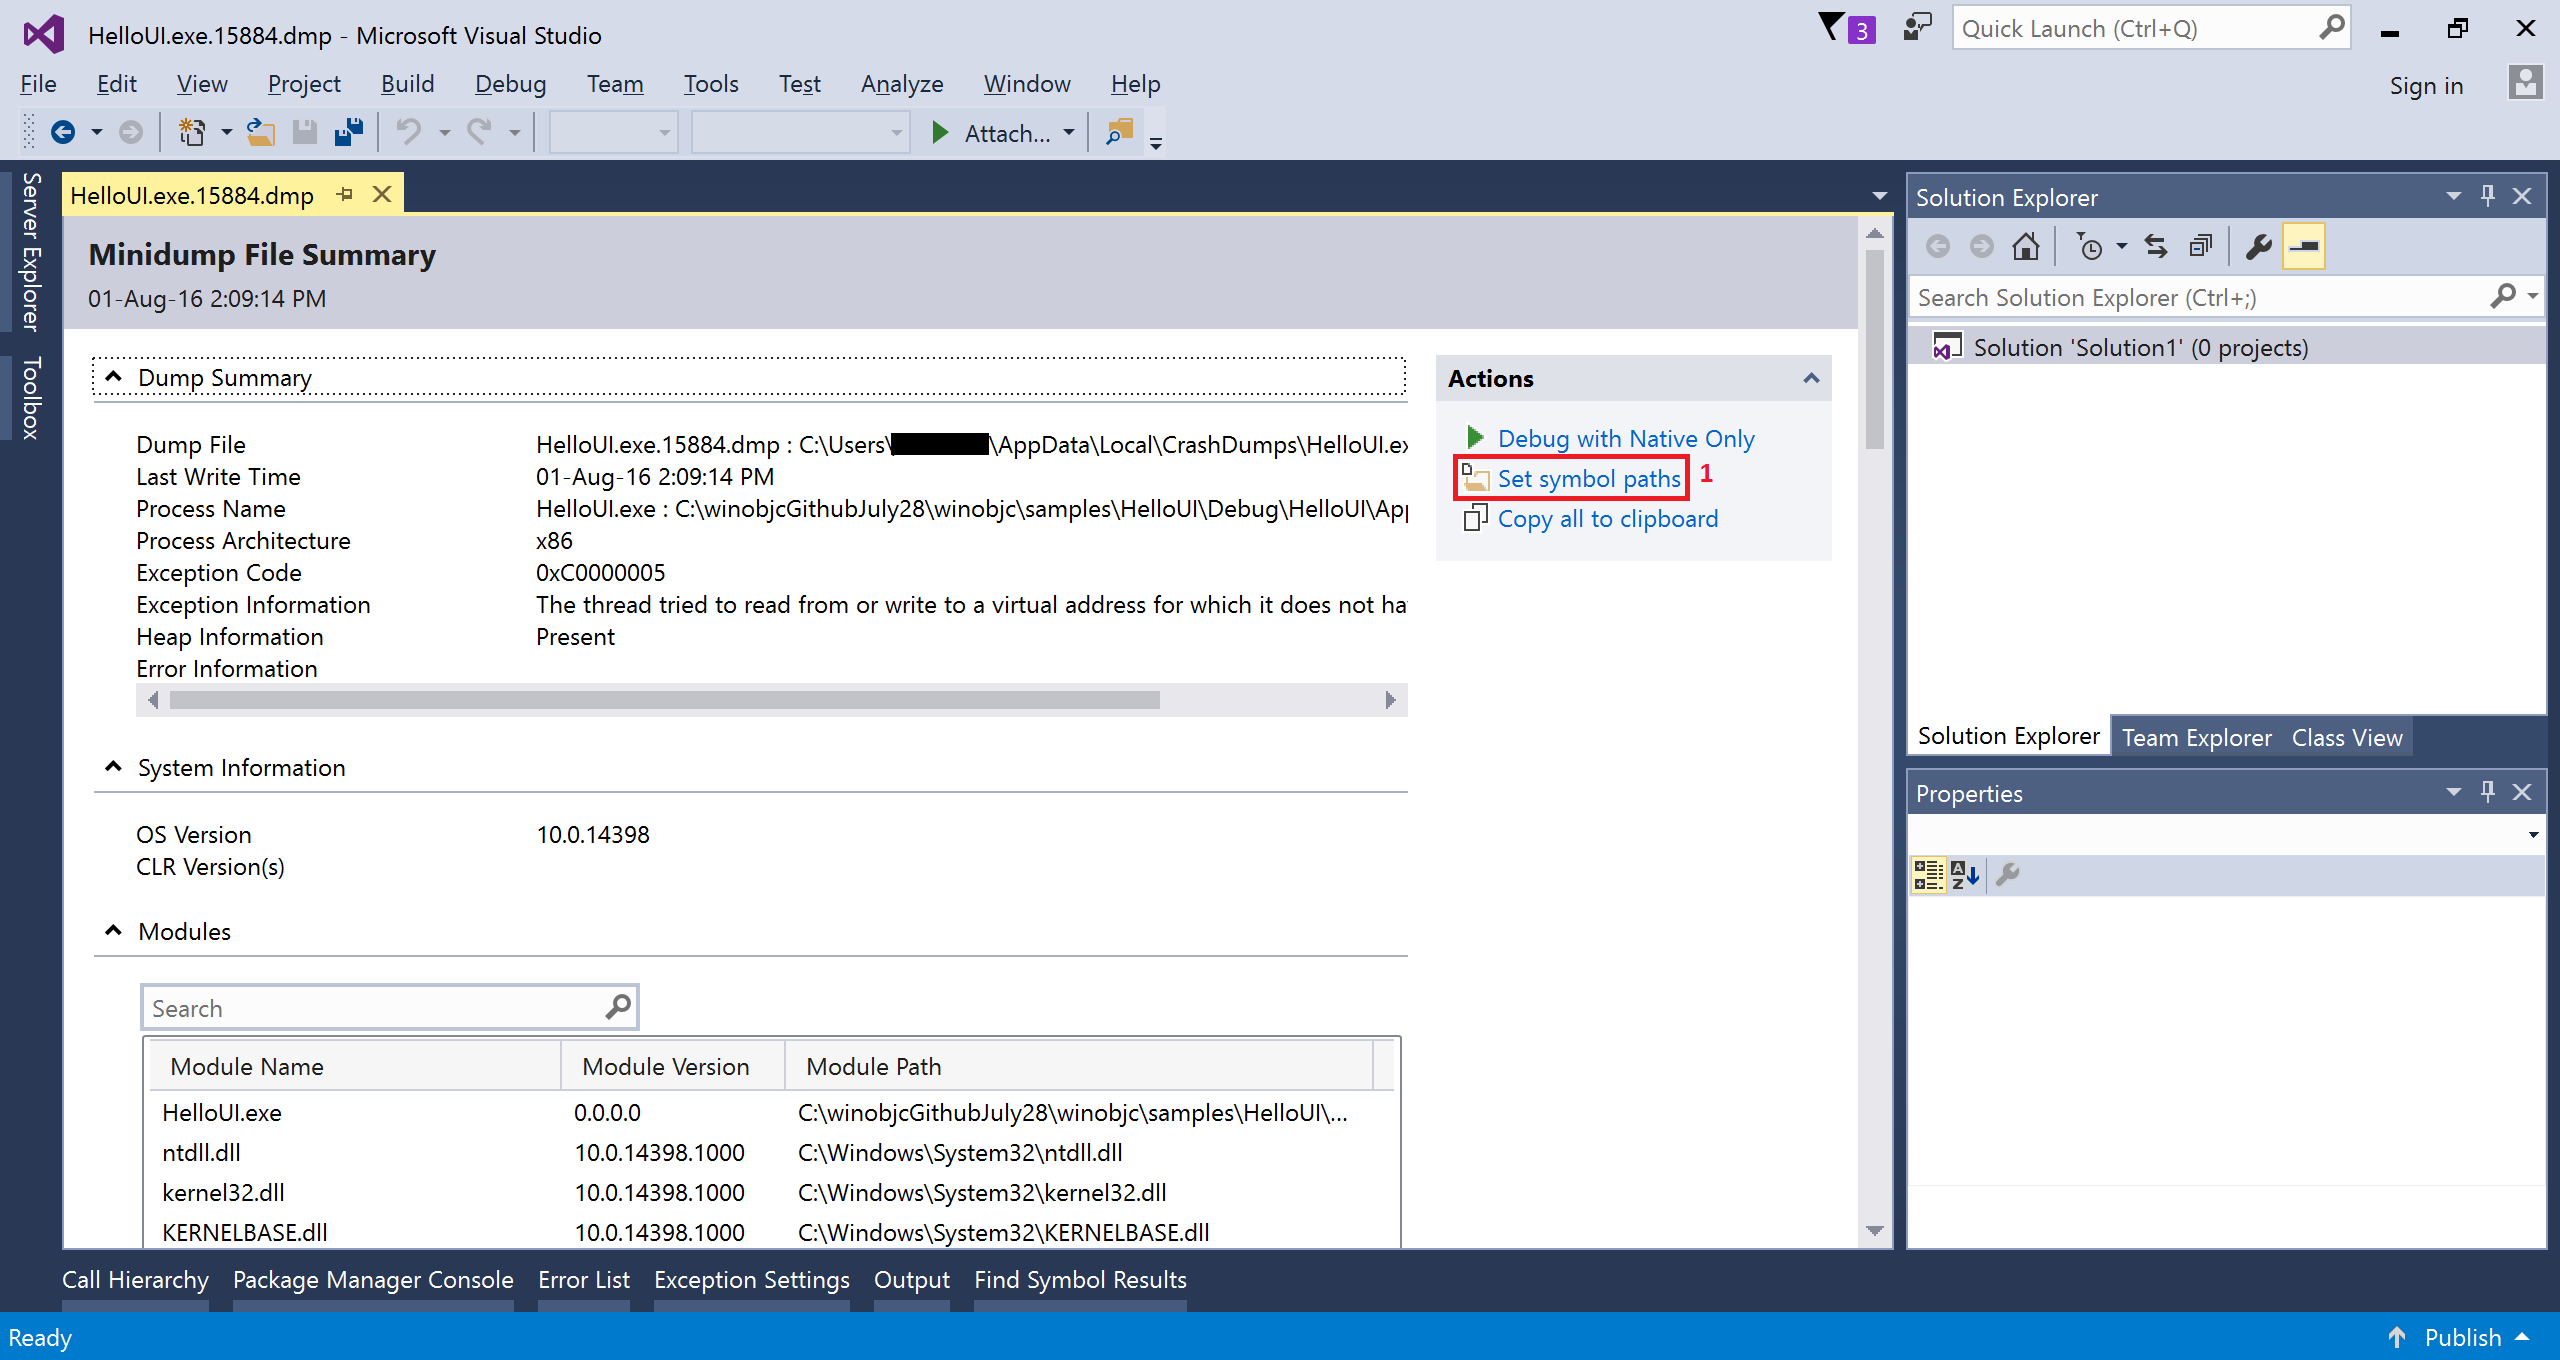
- Drag and drop your crash dump (.dmp) file into Visual Studio to open it. It should be under %LOCALAPPDATA%\CrashDumps, where %LOCALAPPDATA% usually corresponds to C:\Users\user\AppData\Local.

- Click on Set symbol paths (1).
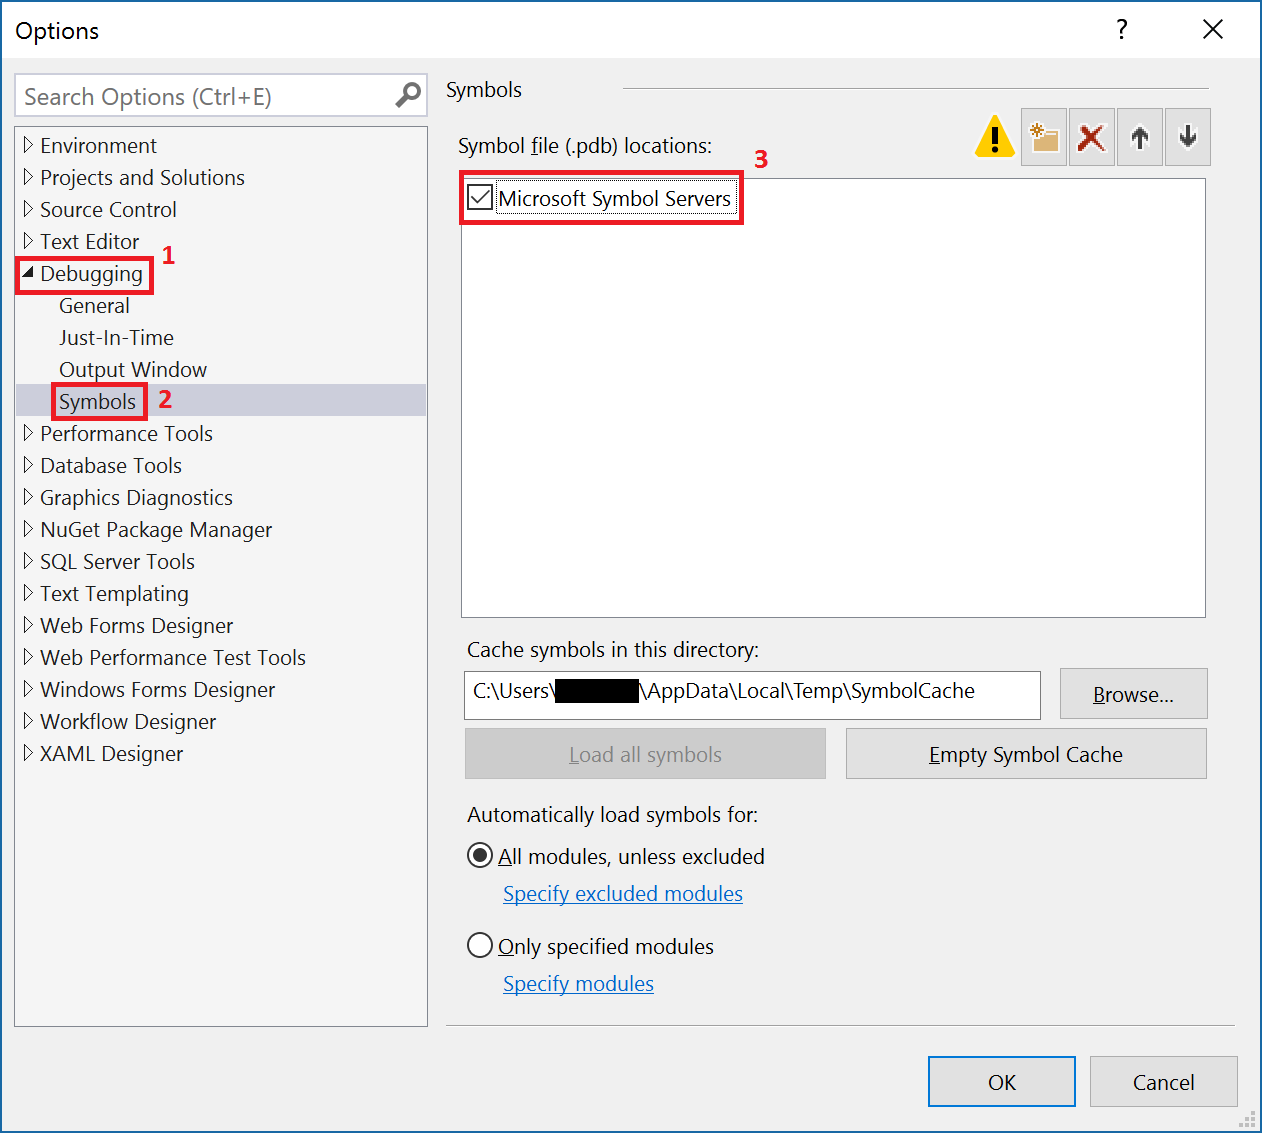
- Under Debugging (1) > Symbols (2), check the Microsoft Symbol Servers (3).
- Click on the new symbol file location button (1), and add the path to your application symbols (2). If you created your app under the samples folder of the SDK, your path would be c:\winobjc\samples\MyApplication\Debug\MyApplication. Then, click OK (3).

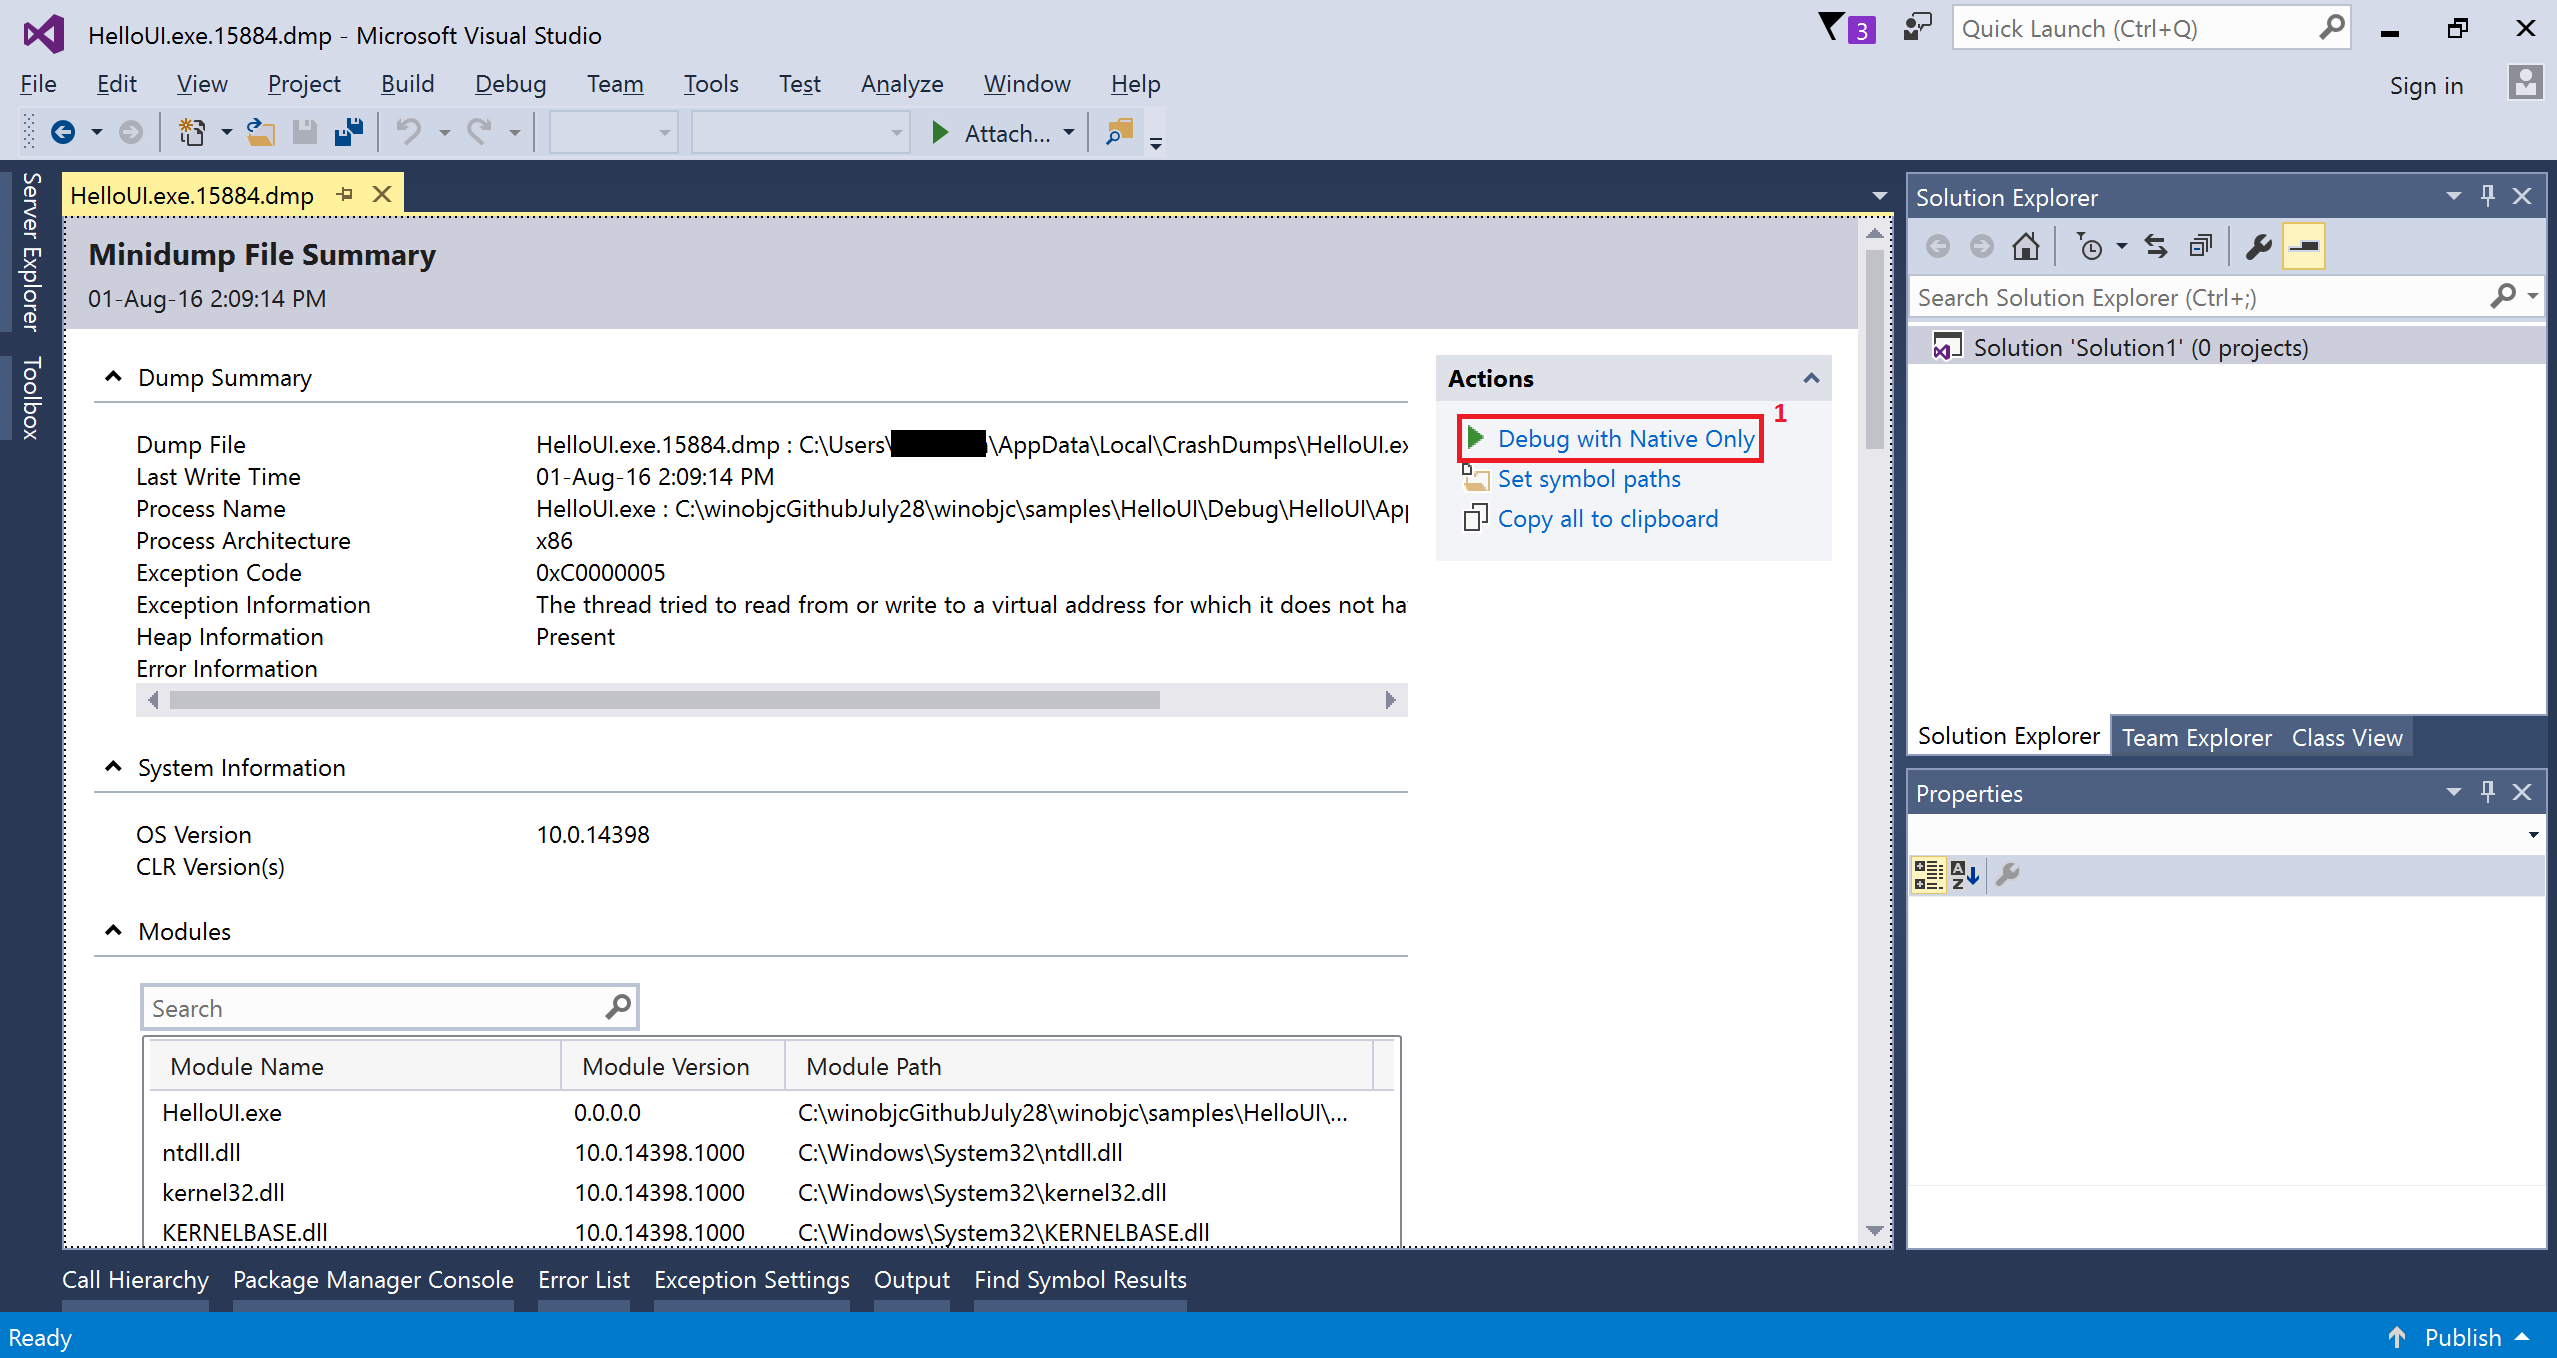
- Click on Debug with Native Only (1) to start debugging the crash dump.
- When an exception is thrown, Visual Studio will give you a warning. Click Break (1) to start debugging.

- When execution stops, you’ll be able to see variables in the Locals window (1), the assembly code in the Disassembly window (2) and the call stack in the Call Stack window (3). When possible, Visual Studio will also open the source file that originated the function calls on the stack when you double-click on them in the call stack window. You’ll see a marker (4) where execution is currently stopped.

- You can now debug your crash dump with the usual Visual Studio debugging functionalities. For more information, check out the Debugging in Visual Studio documentation on the Microsoft Developer Network.
Using WinDBG to Debug Crash Dumps
Installing WinDbg
If you prefer, you can also use WinDbg to debug a crash dump. It’s a debugger that is part of the Windows Debugging Tools, which you can download using the Get Debugging Tools for Windows (WinDbg) (from the SDK) link, under the “Get debugging tools” section of the Download the WDK, WinDbg, and associated tools page from the Hardware Dev Center.
Using WinDbg
- Open Windbg by typing “windbg” (1) in the Start menu and pressing Enter.
- Drag and drop your crash dump (.dmp) file into the WinDbg window to open it. It should be under %LOCALAPPDATA%\CrashDumps, where %LOCALAPPDATA% usually corresponds to C:\Users\user\AppData\Local.

- Set your application executable file search path by entering the .exepath+ (1) command followed by the path to your application executable. If you created your app under the samples folder of the SDK, your path would be c:\winobjc\samples\MyApplication\Debug\MyApplication.

- Add the Microsoft public symbol server to your symbol path by entering the .sympathy+ srv*https://msdl.microsoft.com/download/symbols (1) command.

- Add your application symbols to your symbol path by entering the .sympathy+ (1) command followed by the path to your application symbols. If you created your app under the samples folder of the SDK, your path would be c:\winobjc\samples\MyApplication\Debug\MyApplication.

- Set the exception context by entering the .ecxr (1) command, allowing the stack walk to work properly. Note that, when possible, WinDbg will automatically open the source file and point to the code line that originated the exception (2).

- Display the stack frame by entering the k (1) command.

- You should now be able to explore your crash dump stack frame. Try out the !analyze -v command, which displays information about the current exception or bug check, or check out the Debugger Reference on the Hardware Dev Center for more commands.
Additional Reading
Want a deeper dive into what the debugging tools for Windows can do? Check out:
- The Crash dump analysis using the Windows debuggers (WinDbg) documentation for more information on debugging crash dumps with WinDbg.
- The Debugging a UWP app using WinDbg documentation to learn how to debug a running UWP with WinDbg.
- The Debugging Tools for Windows documentation for an overview of all the tools available.
- The Debugger Operation documentation for details on how to use the different debugging tools for Windows.
- The Debugging Techniques documentation for information on standard and specialized debugging techniques for Windows.
Known Issues
- Having a space in your application executable name will prevent you from generating and debugging crash dumps properly. To rename your application executable, check Removing Spaces section of this page.
- Updating your Operating system may reset the registry keys enabling the collection of crash dumps. If so, re-create the registry keys according to the Collecting Crash Dumps section of this page.
- When using WinDbg, you might receive errors stating that some symbols files could not be found, even after setting the symbol paths for your application and the Microsoft public symbol servers. That’s because some symbols are internal to Microsoft and are not publicly available.
Служба Windows Error Reporting (WER) служит для сбора и отправки отладочной информации о падении системных и сторонних приложений в Windows на сервера Microsoft. По задумке Microsoft, эта информация должна анализироваться и при наличии решения, вариант исправления проблемы должен отправляется пользователю через Windows Error Reporting Response. Но по факту мало кто пользуется этим функционалом, хотя Microsoft настойчиво оставляет службу сбора ошибок WER включенной по умолчанию во всех последних версиях Windows. В большинстве случае о службе WER вспоминают, когда каталог C:\ProgramData\Microsoft\Windows\WER\ReportQueue\ начинает занимать много места на системном диске (вплоть до нескольких десятков Гб), даже не смотря на то что на этом каталоге по умолчанию включена NTFS компрессия.
Содержание:
- Служба Windows Error Reporting
- Очистка папки WER\ReportQueue в Windows
- Отключение Window Error Reporting в Windows Server
- Отключаем сбор и отправки отчетов об ошибках в Windows 10
- Отключение Windows Error Reporting через GPO
Служба Windows Error Reporting
Служба Windows Error Reporting при появлении ошибки показывает диалоговое окно, предлагающее отправить отчет об ошибке в корпорацию Microsoft. Когда в Windows вы видите сообщение об ошибке
YourApp has stop working
, в это время в служба Windows Error Reporting запускает утилиту WerFault.exe для сбора отладочных данных (могут включать в себя дамп памяти).
Данные пользователя сохраняются в профиль пользователя:
%USERPROFILE%\AppData\Local\Microsoft\Windows\wer
Системные данные – в системный каталог:
%ALLUSERSPROFILE%\Microsoft\Windows\WER\
Служба Windows Error Reporting представляет собой отдельный сервис Windows. Вы можете проверить состояние службы командой PowerShell:
Get-Service WerSvc
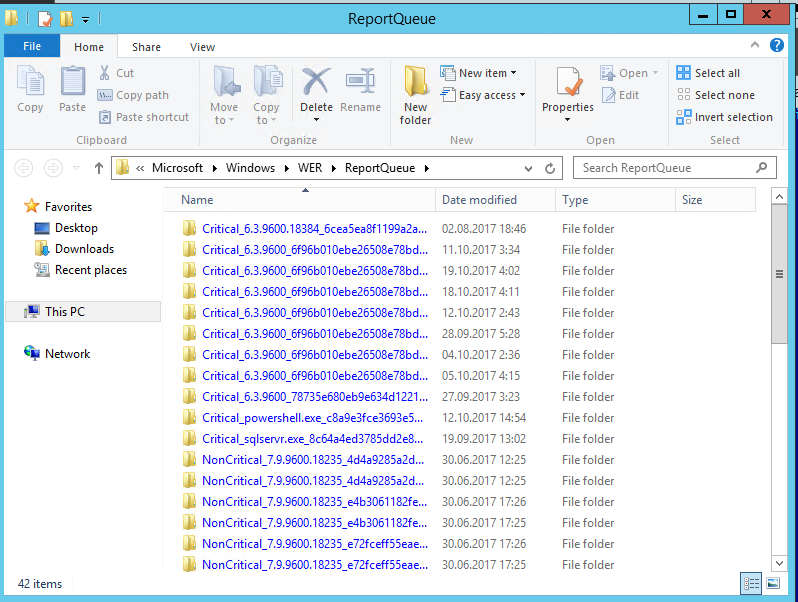
Внутри каталога WER\ReportQueue\ содержится множество каталогов, с именами в формате:
- Critical_6.3.9600.18384_{ID}_00000000_cab_3222bf78
- Critical_powershell.exe_{ID}_cab_271e13c0
- Critical_sqlservr.exe__{ID}_cab_b3a19651
- NonCritical_7.9.9600.18235__{ID}_0bfcb07a
- AppCrash_cmd.exe_{ID}_bda769bf_37d3b403
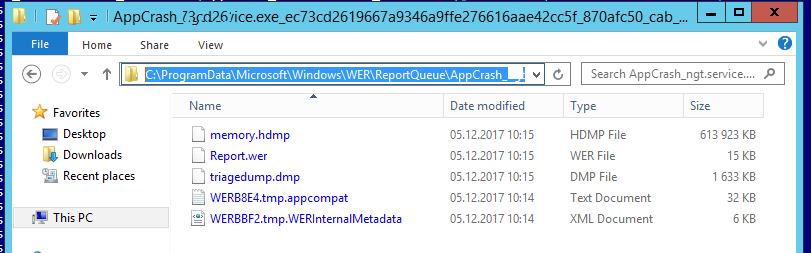
Как вы видите, имя каталога содержит степень критичности события и имя конкретного exe файла, который завершился аварийно. Во всех каталогах обязательно имеется файл Report.wer, который содержит описание ошибок и несколько файлов с дополнительной информацией.
Очистка папки WER\ReportQueue в Windows
Как правило, размер каждой папки в WER незначителен, но в некоторых случаях для проблемного процесса генерируется дамп памяти, который занимает довольно много места. На скриншоте ниже видно, что размер файла дампа memory.hdmp составляет около 610 Мб. Парочка таким дампов – и на диске исчезло несколько свободных гигибайт.
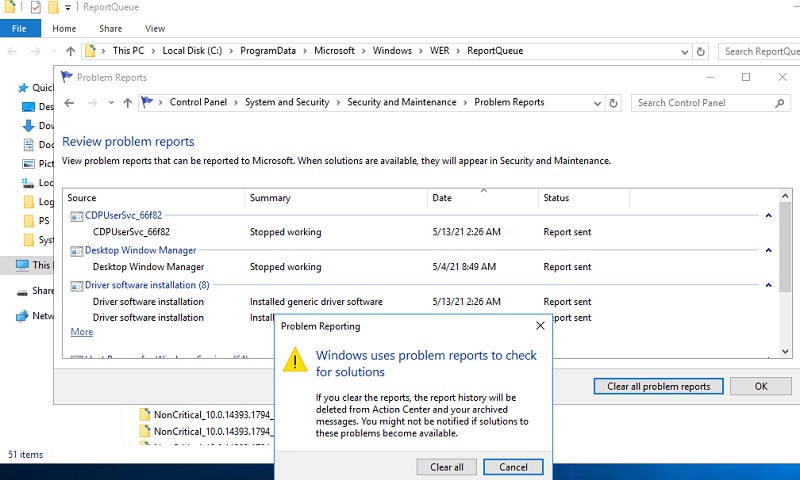
Чтобы очистить все эти ошибки и журналы штатными средствами, откройте панель управления и перейдите в раздел ControlPanel -> System and Security -> Security and Maintenance -> Maintenance -> View reliability history -> View all problem reports (Control Panel\System and Security\Security and Maintenance\Problem Reports) и нажмите на кнопку Clear all problem reports.
Для быстрого освобождения места на диске от файлов отладки, сгенерированных службой WER, содержимое следующих каталогов можно безболезненно очистить вручную.
- C:\ProgramData\Microsoft\Windows\WER\ReportArchive\
- C:\ProgramData\Microsoft\Windows\WER\ReportQueue\
Следующие команды PowerShell удалят из каталога каталогов WER все файлы, старше 15 дней:
Get-ChildItem -Path  'C:\ProgramData\Microsoft\Windows\WER\ReportArchive' -Recurse | Where-Object CreationTime -lt (Get-Date).AddDays(-15) | Remove-Item -force -Recurse
Get-ChildItem -Path  'C:\ProgramData\Microsoft\Windows\WER\ReportQueue' -Recurse | Where-Object CreationTime -lt (Get-Date).AddDays(-15) | Remove-Item -force –Recurse
Для очистки каталогов WER в пользовательских профилях используйте такой скрипт:
$users = Get-ChildItem c:\users|where{$_.name -notmatch 'Public|default'}
foreach ($user in $users){
Get-ChildItem "C:\Users\$User\AppData\Local\Microsoft\Windows\WER\ " –Recurse -ErrorAction SilentlyContinue | Remove-Item –force –Recurse
}
Отключение Window Error Reporting в Windows Server
В Windows Server 2019/2016/2012R2 вы можете управлять состоянием WER с помощью PowerShell. Вы можете отключить службу Windows Error Reporting:
Get-Service WerSvc| stop-service –passthru -force
Set-Service WerSvc –startuptype manual –passthru
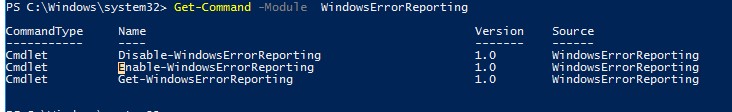
Но есть более корректные способы отключения WER в Windows. В версии PowerShell 4.0 добавлен отдельный модуль WindowsErrorReporting из трех командлетов:
Get-Command -Module WindowsErrorReporting
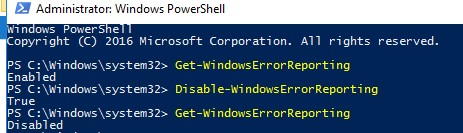
Проверить состояние службы Windows Error Reporting можно командой:
Get-WindowsErrorReporting
Для отключения WER, выполните:
Disable-WindowsErrorReporting
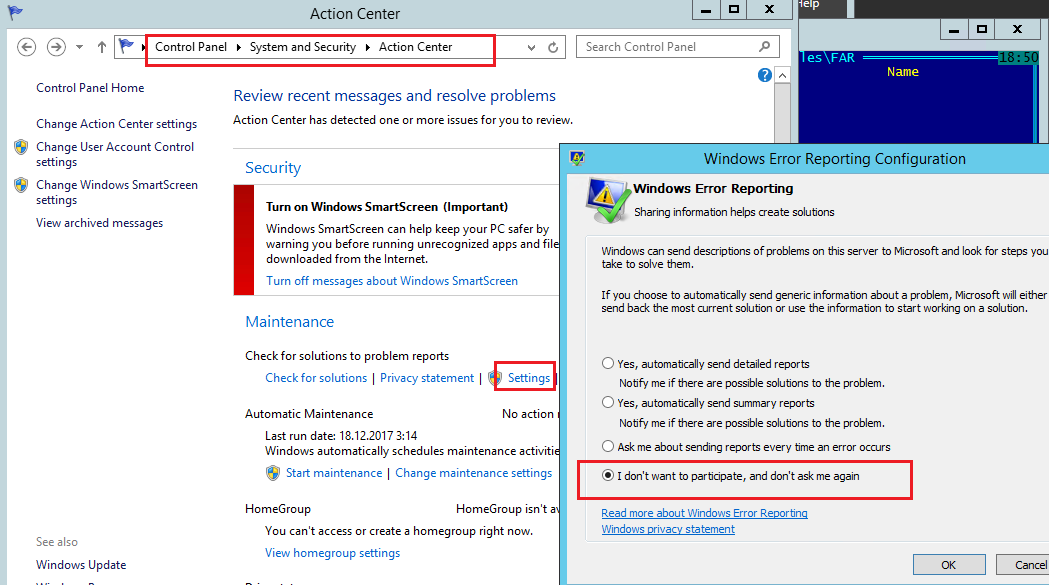
В Windows Server 2012 R2 можно отключить запись информации об ошибках Windows Error Reporting через панель управления (Control Panel -> System and Security -> Action Center -> раздел Maintenance -> Settings -> выберите опцию I don’t want to participate, and don’t ask me again
Отключаем сбор и отправки отчетов об ошибках в Windows 10
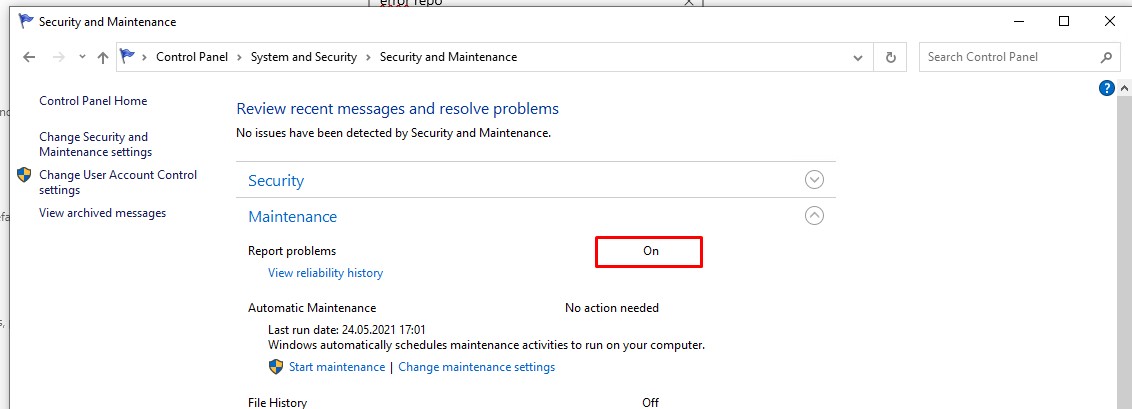
В Windows 10 нельзя отключить Error Reporting через панель управления. В графическогм интерфейсе можно только проверить ее статус (Система и безопасность ->Центр безопасности и обслуживания -> секция Обслуживание). Как вы видите, по умолчанию параметр Поиск решения для указанных в отчетах проблем включен (Control Panel -> System and Security -> Security and Maintenance -> Maintenance -> Report problems = On).
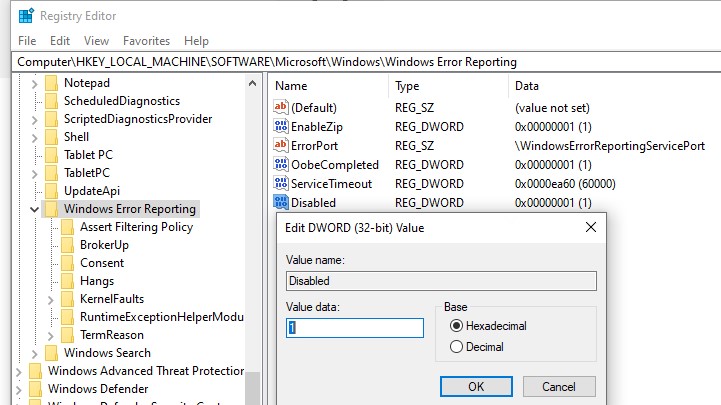
HKLM\SOFTWARE\Microsoft\Windows\Windows Error Reporting нужно создать новый параметр типа DWORD (32 бита) с именем Disabled и значением 1.
Можно отключить сбор ошибок WER для конкретных пользователей:
reg add "HKCU\Software\Microsoft\Windows\Windows Error Reporting" /v "Disabled" /t REG_DWORD /d "1" /f
Или отключить WER для всех:
reg add "HKLM\Software\Microsoft\Windows\Windows Error Reporting" /v "Disabled" /t REG_DWORD /d "1" /f
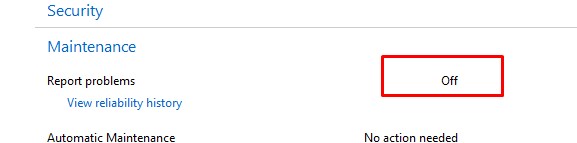
Измените параметр реестра и проверьте статус параметра Поиск решения для указанных в отчетах проблем в панели управления. Его статус должен изменится на Отключено.
Отключение Windows Error Reporting через GPO
Также вы можете управлять настройками службы Windows Error Reporting через групповые политики.
Запустите редактор локальной (
gpedit.msc
) или доменной GPO (
gpmc.msc
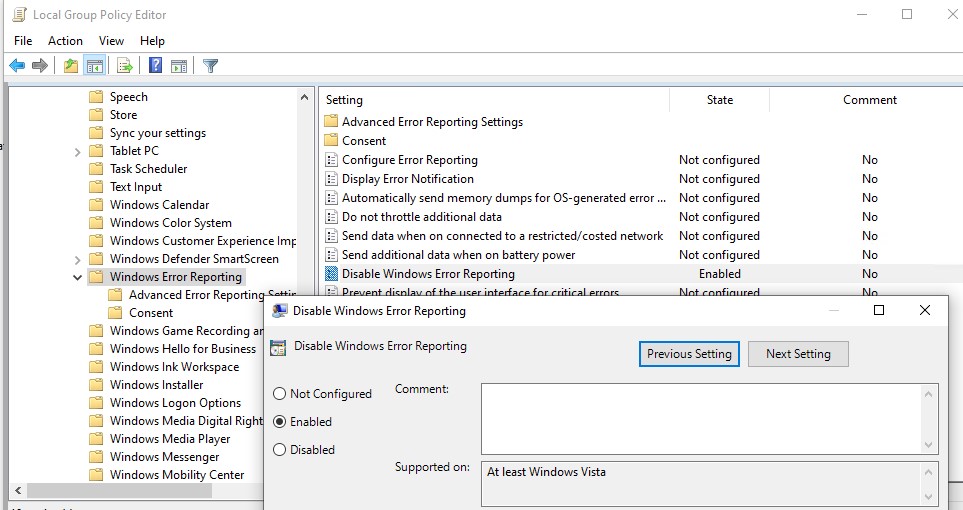
) и перейдите в ветку реестра Computer Configuration -> Administrative Templates -> Windows Components -> Windows Error Reporting (Компоненты Windows -> Отчеты об ошибках Windows). Для отключения сбора и отправки ошибок через WER включите политику Disable Windows Error Reporting (Отключить отчеты об ошибках Windows).
Аналогичная политика есть в пользовательском разделе политик (User Configuration).
Обновите GPO (перезагрузка не потребуется).
В результате в Windows перестанут формироваться сообщения об ошибках Windows и отправляться в Microsoft.
According to Microsoft, the Windows Error Reporting feature is defined as follows:
The error reporting feature enables users to notify Microsoft of application faults, kernel faults, unresponsive applications, and other application specific problems. Microsoft can use the error reporting feature to provide customers with troubleshooting information, solutions, or updates for their specific problems. Developers can use this infrastructure to receive information that can be used to improve their applications.
When a program crashes in Windows, if it did not have built-in exception handling and crash dump generation, the Windows Error Reporting tool usually creates a crash dump and then queues it for upload to Microsoft.
The Windows Error Reporting tool can be configured in such a way to collect the crashes locally instead of queuing them for upload. The following document explains how.
In short, you have to add the follow registry values:
Windows Registry Editor Version 5.00

[HKEY_LOCAL_MACHINE\SOFTWARE\Microsoft\Windows\Windows Error Reporting\LocalDumps\<program_name>.exe]
"DumpFolder"=hex(2):43,00,3a,00,5c,00,74,00,65,00,6d,00,70,00,00,00
"DumpCount"=dword:00000100
"DumpType"=dword:00000002
Tweaking the registry manually is often not the best thing to do, therefore I wrote a simple open-source graphical utility that does the registry modification on your behalf.
WerFault GUI Tool
The graphical tool is very simple, but let me explain a few things.
WerFault supports three crash dump types: custom, mini or full memory dumps. Only when the custom dump is selected you can specify additional custom dump flags to WerFault. The custom flags are for advanced users.
In most cases it is advised to select the “Full dump” option because it captures lots of information needed for debugging. And finally, the dump count option lets you specify how many crash dumps to keep around.
There are two blue buttons that allows you to add or update an entry and to delete an entry. That’s it!
In the downloaded package, there’s an executable called crash.exe that you can use for testing.
You can also browse the source code on GitHub
Do you want to master Batch Files programming? Look no further, the Batchography is the right book.
Available in print or e-book editions from Amazon.com.
You might also like:
- Resetting NTFS files permission in Windows – Graphical Utility
- Free pictures to PDF converter: Pic2Pdf v1.0
- Batchography: Programming the Hangman game using the Batch scripting language!