
В этой статье мы рассмотрим, как включить логирование всех DNS запросов пользователей, которые получает DNS сервер на Windows Server, и выполнить их анализ. У меня такая возникла, когда понадобилось декомисснуть (удалить) старый контроллер домена Active Directory в филиале и нужно было понять, какие устройства все еще используют этот DNS сервер. После включения DNS лога и его анализа я смог найти оставшиеся устройства и перенастроить их на другие DNS сервера. Также эта методика поможет вам найти в сети хосты с подозрительной активность (обращения к вредоносным URL, хостам управления ботнетами и т.д.).
Конечно, можно поставить на сервер Wireshark, network monitor или pktmon и отслеживать весь трафик на 53 порту, но использование встроенной функции логирования DNS запросов намного проще.
По умолчанию в Windows Server отключено логирование DNS всех пакетов. Чтобы его включить:
- Запустите консоль DNS Manager (
dnsmgmt.msc
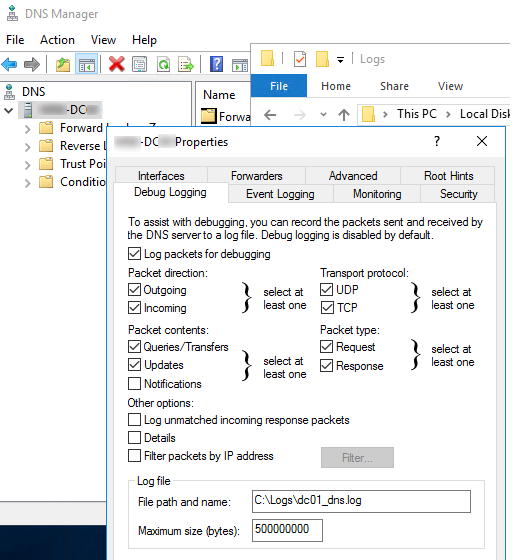
) и подключитесь к нужному DNS серверу; - Откройте его свойства и перейдите на вкладку Debug Logging;
- Включите опцию Log packets for debugging;
- Далее можно настроить параметры логирования: выбрать направление DNS пакетов, протокол (UDP и/или TCP), типы пакетов (простые dns запросы, запросы на обновление записей, уведомления);
- С помощью опцию Filter packets by IP address можно указать IP адреса, для которых нужно логировать отправленные или полученные пакеты (поможет существенно уменьшить размер лога).

- В поле Log file path and name укажите имя текстового файла, в который нужно записывать все события. По умолчанию размер DNS лога ограничен 500Мб. После достижения этого лимита старые события начнут перезатираться новыми.
Также вы можете включить логирование DNS или получить текущие настройки с помощью PowerShell:
Get-DnsServerDiagnostics
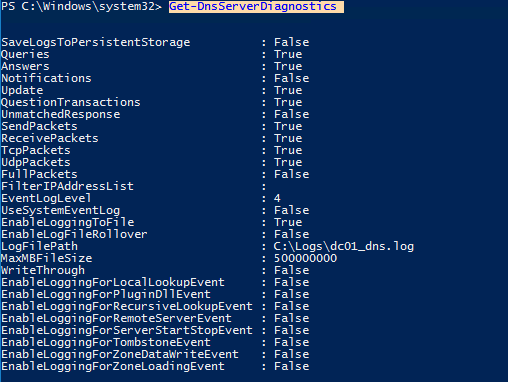
Обратите внимание, что на высоконагруженных DNS серверах Windows логирование DNS запросов может вызвать дополнительную нагрузку на CPU, память и дисковую подсистему (диски должны быть достаточно производительными).
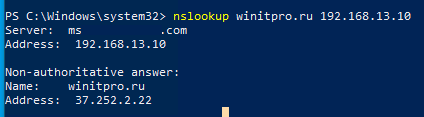
Теперь выполните с любого компьютера DNS запрос к этому серверу (IP адрес нашего DNS хоста с Windows Server 192.168.13.10), например:
nslookup winitpro.ru 192.168.13.10
Или выполните DNS запрос с помощью PowerShell:
Resolve-DnsName -Name winitpro.ru -Server 192.168.13.10
Данный запрос вернул клиенту IP адрес запрошенного сервера.
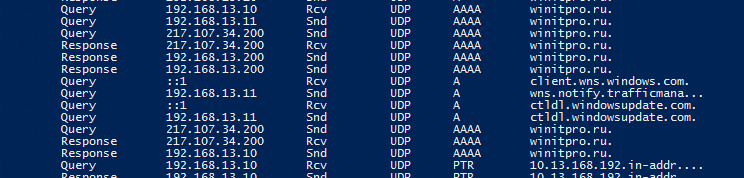
Проверим теперь, что этот запрос отобразился в логе DNS сервера.
Для этого, выполним поиск в текстовом логе по IP адресу клиента (192.168.13.200). Можно открыть лог файл в блокноте, а можно выполнить поиск по нему с помощью PowerShell:
get-content "C:\Logs\dc01_dns.log" | Out-String -Stream | Select-String "192.168.13.200"

Событие выглядит так:
4/29/2021 2:30:20 AM 0D0C PACKET 00000272D98DD0B0 UDP Rcv 192.168.13.200 0002 Q [0001 D NOERROR] A (8)winitpro(2)ru(0)
Как вы видите, в логе указано: от клиента 192.168.13.200 получен (rcv) DNS запрос по протоколу UDP на разрешение имени (8)winitpro(2)ru(0), а затем DNS сервер успешно (NOERROR) отправил ему ответ (snd).
Все поля описаны в начале файла:
Field # Information Values
------- ----------- ------
1 Date
2 Time
 3 Thread ID
4 Context
5 Internal packet identifier
6 UDP/TCP indicator
7 Send/Receive indicator
8 Remote IP
9 Xid (hex)
10 Query/Response R = Response
blank = Query
11 Opcode Q = Standard Query
N = Notify
U = Update
? = Unknown
12 [ Flags (hex)
13 Flags (char codes) A = Authoritative Answer
T = Truncated Response
D = Recursion Desired
R = Recursion Available
14 ResponseCode ]
15 Question Type
16 Question Name
Из-за специфического формата, анализировать DNS лог вручную довольно сложно, поэтому для преобразования DNS запросов в более удобный формат можно использовать готовый PowerShell скрипт Get-DNSDebugLog.ps1.
Скачайте данный файл к себе на диск. Затем разрешите запуск PowerShell скриптов в текущей консоли:
Set-ExecutionPolicy -Scope Process Unrestricted
Импортируйте функцию из файла Get-DNSDebugLog.ps1 в свою сессию:
. C:\ps\Get-DNSDebugLog.ps1
Теперь можно преобразовать DNS лог в более удобный вид:
Get-DNSDebugLog -DNSLog C:\Logs\dc01_dns.log | format-table
[Или можно экспортировать полученный результат в CSV файл для дальнейшего анализа в Excel (либо можно напрямую обращаться из PowerShell к Excel файлу и заносить в него нужные строки).
Get-DNSDebugLog -DNSLog C:\Logs\dc01_dns.log | Export-Csv C:\log\ProperlyFormatedDNSLog.csv –NoTypeInformation
Вы можете экспортировать данный файл в Excel и использовать его для анализа DNS запросов (в файле есть адреса хостов и DNS имена, за которыми они обращались к вашему DNS серверу).
Также для анализа лог файла с DNS запросами можно использовать Log Parser 2.2 (https://docs.microsoft.com/en-us/archive/blogs/secadv/parsing-dns-server-log-to-track-active-clients). Например, следующая команда выведет информацию о количестве DNS запросов с каждого IP адреса:
LogParser.exe -i:TSV -nskiplines:30 -headerRow:off -iSeparator:space -nSep:1 -fixedSep:off -rtp:-1 "SELECT field9 AS IP, REVERSEDNS(IP) AS Name, count(IP) as QueryCount FROM "C:\Logs\dc01_dns.log" WHERE field11 = 'Q' GROUP BY IP ORDER BY QueryCount DESC"

В этом примере мы использовали текстовые файлы для сбора DNS логов. В Windows Server 2012+ вы можете записывать DNS запросы прямо в журнал Event Viewer (
Microsoft-Windows-DNS-Server/Audit
). Но на мой взгляд текстовые DNS логи анализировать гораздо проще.
Конечно, если вам нужно вести логирование DNS запросов на множестве серверов, предпочтительнее слать их нормальную систему сбора логов, хранения и обработки логов, такую как Splunk, ELK, Graylog или Azure Log Analytics.
После включения DNS лога и его анализа я нашел IP адреса устройств, которые все еще используют этот DNS сервер и перенастроил их на другие DNS сервера. Теперь, если старый DC не содержит FSMO ролей, то его можно спокойно удалять (события логона пользователей при этом роли не играют).
Readers help support Windows Report. We may get a commission if you buy through our links.
Read our disclosure page to find out how can you help Windows Report sustain the editorial team. Read more
Microsoft released a new version of the Sysmon tool. The company confirmed that Windows system monitor now supports DNS query logging.
This tool is developed by the CTO of Microsoft Azure Mark Russinovich, who announced the new feature on his official Twitter account. Russinovich attached a screenshot showing how the tool logs DNS queries and information.
Sysmon with DNS query logging and original file name reporting will publish on Tuesday. pic.twitter.com/0nTKJahjSe
— Mark Russinovich (@markrussinovich) June 8, 2019
Let’s discuss how Sysmon works. It basically monitors specific events currently on the system and then maintains their record in the event log.
But from now onwards, the new Sysmon version brings DNS query logging support. Interestingly, you can also spot which query initiated the program by looking at the “Image” value.
How to enable DNS logging on Windows
- Open the run dialogue box by hitting Windows+R keys.

- Now type eventvwr.msc in the dialogue box and hit Enter. It will open the Event Viewer Window.
- At this step, navigate to Applications and Service Logs >> Microsoft >> Windows >> DNS Client Events >> Operational.

- You will see Operational option, right click on it and click Enable Log.

Finally, DNS logging is now enabled on your system.
Users are excited about this feature
Windows users are really excited about this new feature. Many users started commenting on the post about how the feature would be beneficial.
It looks like you get more data in one event with this vs the dns client log. If you are already using sysmon this is a big win. Don’t have to ask the windows team to turn on DNS client logs.
Another Windows user stated:
Yep so many times I had to fire up message analyzer to grab the process making the DNS request. Really exciting!
What do you think about DNS query logging feature in Windows system monitor? Let us know in the comments section below.
RELATED ARTICLES YOU NEED TO CHECK OUT:
DNS server not authoritative for zone error on Command Prompt [FIX]
Fix This: Your DNS Server Might be Unavailable in Windows 8, 8.1, 10
Milan Stanojevic
Windows Toubleshooting Expert
Milan has been enthusiastic about technology ever since his childhood days, and this led him to take interest in all PC-related technologies. He’s a PC enthusiast and he spends most of his time learning about computers and technology.
Before joining WindowsReport, he worked as a front-end web developer. Now, he’s one of the Troubleshooting experts in our worldwide team, specializing in Windows errors & software issues.
Preface
Windows DNS logging is NOT our recommended method to collect DNS request and reply transaction for continuous security monitoring. However, sometimes we do not have an option, especially when Windows DNS debug/analytics log is the only available data source during IR investigation. In the first part of this post, we will discuss the Windows DNS debug and analytics log. Then, we will discuss other options of DNS logging for continuous monitoring. Lastly, we will also discuss some new DNS protocol such as DoH(DNS over https).
DNS traffic is one of the most important logging for continuous network security monitoring. DNS requests will be sent whenever you are sending an email or browsing a website. Therefore, with DNS logging, we can easily identify email from known phishing domain, known phishing URL, access to known malicious C2 domain and even Typosquatting domain.
In addition, there are tons of malicious ways which leverage standard DNS query to transfer payload, establish covert channel and data ex-filtration. Some interesting tools and exploits methods includes dnscat2, PowerCloud, HITB DNS’ ex-filtration presentation, Defcon Russia DNS payload for metasploit, DNSExfiltrator, Cobalt Strike’s DNS Beacon and SIGRed (CVE-2020-1350)
Internationalized Domain Name
As you may also realize, you are able to use some Unicode domain name to access some website. However, when you use standard nslookup or dig tools, you cannot correctly resolve those DNS record. When you input the Unicode domain such as “中文域名.net” or “Bücher.example” in your browser, your machine will help you converting the domain name to something like xn--fiq06l2rdsvs.net. All IDN domain have prefix “xn--“, and the Unicode domain will be converted to ASCII using punycode. So when you review the log and search for Unicode domain name, you will not able to find anything. In this case, you may need to convert the Unicode domain to IDN format first. There is some online converter such as https://www.punycode.io/.
Windows DNS debug Logging
DNS Debug Logging is available since Windows 2000 (Logging tab for Windows 2000). The log format between Windows 2000/2003 and Windows 2008+ are different. In this post, we will only cover the information for Windows 2008+. Microsoft suggested to enable DNS analytics log instead of DNS debug log due to performance issue. We will discuss this later. However, ONLY DNS debug log provides parsed DNS DATA information, which is DNS reply from server. Those DNS answer provides additional value to your investigation, especially in the case attacker using DNS TXT record as C2 Covert Channel.
To enable Windows DNS debug logging, follow these steps.
- On your Windows DNS server, open “dnsmgmt.msc”
- right click the server and select Properties, then go to “Debug Logging” tab.
- Select “Details” to log DNS DATA (reply)
- The 2 options shown below both works, and it will not log duplicate packets. If you are in IR investigation, take a note of below 2 options to understand what is expected in the log file.


Also take a note that whenever the DNS server is restarted, the log file is cleared.
TrustedSec had an article discussed the structure of the DNS log file. In short, the log file provides many low level information, including the most important DNS reply.
TrustedSec also wrote a powershell script to parse the DNS log file. However, it do not work in our environment(Windows 2012R2 and PowerShell 5). We have also developed another powershell script(windows_dns_debug_log_parser.ps1) to parse the DNS debug log file in csv format.

DNS analytical log
DNS Analytical Log is available since Windows 2012 R2+. You will need to install KB2956577 for Windows 2012 R2 to use this feature. The performance hit of enabling DNS Analytical Log is low as suggested by Microsoft here.
There is no apparent performance impact for query rates of 50,000 QPS and lower.
Microsoft
To enable DNS Analytical Log, follow these steps:
- Open “Windows Event Viewer”, click on “View” -> “Show Analytical and Debug Logs”
- Navigate to “Application and Service Logs” -> Microsoft-> Windows -> DNS-Server -> Analytical
- right-click and select Enable Log
As a side note, you CANNOT directly access the real time log without disable it. Analytical logs are stored in event trace log (*.etl) format. If you are Splunk fans, you cannot directly monitor it as regular Windows Event Log. For Spunk monitoring, there is an app available in splunkbase. Basically, it includes a powershell script which copy the etl file to a tmp directory defined by $env:TEMP environmental variable. Then, the script will parse the temporary etl file and remove the etl file.
DNS analytical log format
Now, we are going to explore the log format. Firstly, we will perform an nslookup.

As you can seen below, the DNS analytical log provides some interesting field such as source, query and packet data, which is hex value of query or response.

We have include a comparison between Event Viewer and WireShark capture. Turns out, the PacketData is exactly the DNS payload right after the UDP header. The Event ID 260 contains exactly the same DNS payload as WireShark DNS request.


We have include another comparison between Event ID 261 and WireShark capture. The Event ID 261 contains exactly the same DNS payload as WireShark DNS reply.


Many industry expert including MENASEC suggested Event ID 256 and 257 are enough for security analysis. So, if we also consider analysis PacketData, Are these 2 Event ID provides enough information ? To answer this question, we will use python dnslib to analysis the packet data. Firstly, we will analysis the request packet.


As you can see above, the DNS request from Event ID 256 was decoded successfully and it contains all the request information needed.


As shown above, the DNS reply from Event ID 257 was also decoded successfully and it contains all the reply information needed.
We are not going to discuss too much about the DNS header. One good article is available here. There is a feature called DNS Pointer/offset/compression, which aimed to make the DNS packet as small as possible. In short, if the “word”(such as .com/.net) exists in any part of DNS reply packet, the reply packet give an offset point back to the location of the “word”. The sidestep command successfully shown that this technique successfully evade IDS alerts. After so many years, SIGRed further use this pointer technique to cause buffer overflow of Windows DNS server.
DNS analytical log parser
We have developed 2 version of DNS analytical log parser. The python version is fast and it is capable to decode most DNS Packet Data field, but the information is sometimes too verbose. The PowerShell version is slower but capable to decode and format TXT record, CNAME record and A record more friendly. We use both version during our IR engagement, and the PowerShell script sometimes make us easier to spot suspicious TXT record.
Common issue of DNS logging
We worked with many organization to help them establish continuous security monitoring. Certainly, DNS is a key data source. However, some organization may prefer to enable DNS logging on their Windows DNS server because they think they only allow DNS request from their DNS server. In many cases, it is not the story. We have experienced sysadmin simply configure google DNS as the DNS server of server inside DMZ. This greatly reduce the monitoring visibility.
Other Options of DNS logging
| Product | Implementation | Features |
| Splunk | UF installed on DNS server | Simple & SIEM integration, Pre-parsed field, High license fee, May not capture all traffic |
| Splunk | UF agent listen on network tap | Simple & SIEM integration, Pre-parsed field, High license fee, Capture ALL DNS traffic if tapping on Internet gateway |
| Packetbeat | Installed on DNS server | Simple & SIEM integration, Pre-parsed field, No license fee, May not capture all traffic |
| Packetbeat | agent listen on network tap | Simple & SIEM integration, Pre-parsed field, No license fee, Capture ALL DNS traffic if tapping on Internet gateway |
| Bro/Zeek | agent listen on network tap | Support by SIEM, Pre-parsed field text file, No license fee, Capture ALL DNS traffic if tapping on Internet gateway |
In the above table, we have summarized some more options to log DNS payload for analysis. Zeek(formerly Bro) is a de-facto standard of network security analysis for many years. It had been adopted by many commercial vendors such as FireEye and Corelight. In addition, Security Onion had integrated various open source security monitoring including Zeek and ELK. As you can see below, Zeek parsed the dns packet into some meta data and store into dns.log file. We have also adopted hybrid approach which use log from DNS server as primary threat hunting source, while Zeek dns.log as the secondary threat hunting source.

DNS over HTTPS (DoH)
DoH is now a hot topic for security monitoring. Cloudfare had a great post explaining DoH here. While it can protect user’s privacy, but it also greatly increase the challenge of security monitoring. To deal with DoH in security monitoring, there is some options:
- Block dns-over-https using Palo Alto
- Blocking Firefox DoH with Bind
- Dealing with DoH: Methods to Increase DNS Visibility as DoH Gains Traction
Добрый день.
Работа всех сетевых устройств зависит от службы DNS. Поэтому полезно уметь включить логирование DNS запросов, которые обрабатывает DNS сервис на Windows Server, и суметь после выполнить их анализ.
По умолчанию в Windows Server отключено логирование DNS всех пакетов. Чтобы его включить:
- запустите консоль DNS Manager (dnsmgmt.msc) и подключитесь к нужному DNS серверу;
- откройте его свойства и перейдите на вкладку Debug Logging;
- включите опцию Log packets for debugging.
Далее можно настроить параметры логирования: выбрать направление DNS пакетов, протокол (UDP и/или TCP), типы пакетов (простые dns запросы, запросы на обновление записей, уведомления). С помощью опцию Filter packets by IP address можно указать IP адреса, для которых нужно логировать отправленные или полученные пакеты (поможет существенно уменьшить размер лога). В поле Log file path and name укажите имя текстового файла, в который нужно записывать все события. По умолчанию размер DNS лога ограничен 500Мб. После достижения этого лимита старые события начнут перезатираться новыми.
Теперь выполните с любого компьютера DNS запрос к DNS-серверу, например:
nslookup winitpro.ru 192.168.13.10
Или выполните DNS запрос с помощью PowerShell:
Resolve-DnsName -Name winitpro.ru -Server 192.168.13.10
Данный запрос вернет клиенту IP адрес запрошенного сервера.
Проверим теперь, что этот запрос отобразился в логе DNS сервера. Для этого, выполним поиск в текстовом логе по IP адресу клиента (192.168.13.200). Можно открыть лог файл в блокноте, а можно выполнить поиск по нему с помощью PowerShell:
get-content «C:\Logs\dc01_dns.log» | Out-String -Stream | Select-String «192.168.1.200»

У автора поста по ссылке можно получить код функции Get-DNSDebugLog:
Get-DNSDebugLog -DNSLog «d:\tmp\DNS\dns_log.csv» | Where {$_.Client -like ‘*192.168.1.200’} | ft

Так можно выполнить поиск в логе по имени сервиса NTP:
Get-DNSDebugLog -DNSLog «d:\tmp\DNS\dns_log.csv» | Where {$_.Query -like ‘*ntp*’} | ft
Но можно вспомнить старый добрый LogParser и использовать его:
LogParser.exe -i:TSV -nskiplines:30 -headerRow:off -iSeparator:space -nSep:1 -fixedSep:off -rtp:-1 `
«SELECT field8 AS IP, REVERSEDNS(IP) AS Name, count(IP) as QueryCount FROM ‘d:\tmp\DNS\dns_log.csv’ WHERE field10 = ‘Q’ GROUP BY IP ORDER BY QueryCount DESC»
Например тот же запрос что в Powershell теперь выглядит так:
LogParser.exe -i:TSV -nskiplines:30 -headerRow:off -iSeparator:space -nSep:1 -fixedSep:off -rtp:-1 `
«SELECT * FROM ‘d:\tmp\DNS\dns_log.csv’ WHERE field8 like ‘%192.168.1.200%'»

Успехов.
@CyberSift we’re big fans of monitoring DNS. While there are malware campaigns out there which communicate directly with hard coded IP addresses, monitoring DNS is a good strategy for keeping tabs on what’s going on in your environment.
When it comes to monitoring windows hosts, Sysmon is an absolute must. There’s tons of information out there on how to use it, so we won’t go into it here. However, there’s a downside to using Sysmon when it comes to DNS. While Sysmon is perfectly capable of logging connections made, it relies on reverse DNS lookups to translate a given destination IP to it’s equivalent hostname:
So, bad news about network alerting in Sysmon based on host names: Due to transparent CNAMEs to CDNs, it doesn’t know the original domain.
— SwiftOnSecurity (@SwiftOnSecurity) February 18, 2017
Unless Sysmon monitors the DNS query chain itself, there’s no way for it to know at the kernel level what was originally sought out.
— SwiftOnSecurity (@SwiftOnSecurity) February 18, 2017
… which is a problem for a lot of reasons, not the least of which is:
Related: As I’ve discovered, when everything on the net points at Akamai or AWS or Azure or CloudFlare, reverse DNS is a crappy data source.
— SwiftOnSecurity (@SwiftOnSecurity) February 18, 2017
So how do we go about monitoring the actual DNS requests that have been made? The answer lies in another windows operational log:
Microsoft-Windows-DNS-Client/Operational
Enabling the log via powershell is easy using the .Net EventLogConfiguration class:
$log = New-Object System.Diagnostics.Eventing.Reader.EventLogConfiguration 'Microsoft-Windows-DNS-Client/Operational'
$log.IsEnabled=$true
$log.SaveChanges()
Now if you open the Event Viewer you should see the
Microsoft-Windows-DNS-Client/Operational getting filled with entries. The next step is to extract and process the events we want. In this example we’ll be outputting to a csv format. The full command in all it’s glory is:
get-winevent -LogName Microsoft-Windows-DNS-Client/Operational -FilterXPath 'Event[System[EventRecordID > 0 and EventID = 3008]] and Event[EventData [Data[@Name="QueryStatus"] = 0]]' | %{([xml]$_.ToXml())} | %{ ("{0},{1}" -f $_.Event.System.Execution.ProcessID, ($_.Event.EventData.Data | Where-Object {$_.Name -eq 'QueryName' -or $_.Name -eq 'QueryResults'} | Select-Object '#text' | ConvertTo-Csv -NoTypeInformation | Select -Skip 1 | Out-String | %{$_.replace('"', '')} ).replace("`r`n",',') )}Running the above command will give output similar to the following:

The first column is the process ID, which if you’re already using Sysmon, makes it easy to correlate which process actually fired of the DNS request. The subsequent column in the DNS request followed by the answer.
The query works for IPv4, IPv6 and cached DNS queries. Now, let’s break down the command. The powershell command can be broken down into a sequence, each sequence pipes it’s output to the next sequence in the chain. Starting from the first sequence:
get-winevent -LogName Microsoft-Windows-DNS-Client/Operational -FilterXPath 'Event[System[EventRecordID > 0 and EventID = 3008]] and Event[EventData [Data[@Name="QueryStatus"] = 0]]'This is where we query the log and apply a filter to get only those events we’re interested in. The XPath filter specifies the following conditions:
- EventRecordID should be greater than 0 (we use this so that in subsequent runs of the command we only get newer events by replacing 0 with the record ID of the last event we got
- EventID should be 3008 (DNS Query has finished processing)
- The Query Status returned should be 0 (no errors). N.B. : thinking about this, you may want to monitor even queries that return an error – this is a common scenario in fast-flux domain malware
The next sequence in the command is:
%{([xml]$_.ToXml())}If you go into the “Details” tab of an entry in the event viewer, you’ll be able to see the event in XML format, which contains all the information we’d like to extract. So we convert each event log entry into it’s XML equivalent using the above command. Some notes to help you understand the above:
- %{} is used by PowerShell as shorthand instead of a “For Each” loop
- $_ is used by PowerShell as shorthand for the current object in a loop (sort of like a loop “this”)
- [xml] makes sure we cast to a PowerShell XML object
At this stage we have the individual XML objects making up our event stream. Now we need to extract just the info we want. In fact, the rest of the command is just wrestling the unwieldy XML to extract the data we want. The next sequence in the command is in fact itself a series of subsequences, the first of which is:
"{0},{1}" -f $_.Event.System.Execution.ProcessID, (...)We’re printing a string and substituting the placeholders with the process ID and the rest of the command which we’ll explain shortly. The process ID is easy to extract since within the XML it has it’s own element. Unfortunately this is not the case with the Query, which is encapsulated within the “Data” element, just having different “name” attribute:

So within those brackets we try to extract just the QueryName and the QueryResults:
$_.Event.EventData.Data | Where-Object {$_.Name -eq 'QueryName' -or $_.Name -eq 'QueryResults'}Note we query the the XML for all “Data” nodes, where the “name” attribute is either QueryName or QueryResults. We’re also only interested in the actual text within the node, not the metadata, so we filter the output using:
Select-Object '#text'Now we can convert the PowerShell Object to a string using:
ConvertTo-Csv -NoTypeInformation | Select -Skip 1 | Out-String(Aside: there probably is a better way of doing this that doesn’t require outputting to CSV, and hence makes the below redundant…) The above command converts the object to CSV, stripping out the metadata and the first row which contains header information. Unfortunately, while this works, the output is now on two seperate lines since QueryResults and QueryStatus are actually two objects. This means the output is not comma separated as required by CSV… so we need to make a quick search and replace to change the extra newlines with a comma, and while we’re at it remove some double quotes:
%{$_.replace('"', '')} ).replace("`r`n",',')And that’s about it!