
How to Find Crash Reports in Windows 11
If you’re a Windows 11 user, you may have encountered system crashes or application failures that prevent your workflow from continuing smoothly. While these issues can be frustrating, Windows provides several tools that can help you diagnose and understand what went wrong. One of the key components to understanding these issues lies in locating and interpreting crash reports. This comprehensive guide will walk you through the process of finding crash reports in Windows 11, identifying possible causes, troubleshooting steps, and best practices for maintaining a stable system.
Understanding Crash Reports
Before delving into how to find crash reports, it’s essential to understand what they are and how they function within the operating system. A crash report is a log file generated by the Windows operating system or individual applications when a crash or error occurs. These reports typically include detailed information about the state of the system and the application at the time of the crash, which can be invaluable for troubleshooting.
Crash reports can contain various information, such as:
- Error Codes: Numeric codes that provide information about the type of error that occurred.
- Faulting Application: The name and version of the application that crashed.
- Event Time: The precise date and time when the crash occurred.
- System State: Information about the operating system, hardware, and drivers at the time of the crash.
- Stack Trace: A list of function calls that the program was executing when it crashed, which can pinpoint the exact cause of the error.
Locating Crash Reports in Windows 11
Windows 11 provides several ways to access crash reports. Below are the primary methods for finding these reports:
1. Using the Event Viewer
The Event Viewer is a powerful tool built into Windows that logs all significant events, including application and system errors. Follow these steps to access crash reports through the Event Viewer:
-
Open the Event Viewer:
- Right-click on the Start Menu button or press
Windows + Xon your keyboard. - Select Event Viewer from the list.
- Right-click on the Start Menu button or press
-
Navigate to Windows Logs:
- In the Event Viewer, expand the Windows Logs section in the left-hand pane.
-
Select Application Logs:
- Click on Application, where you’ll find logs related to application errors, including those that may have caused crashes.
-
Filter for Errors:
- On the right-hand side, click on Filter Current Log.
- In the filter window, choose to show only errors by setting the Event Level to Error.
-
Analyze the Error Events:
- Look through the list of error events. You can identify crash reports by their Event ID and Source.
- Double-click an event to view its details, including the error message and stack trace.
2. Using the Reliability Monitor
Reliability Monitor is another diagnosing tool integrated into Windows 11 that can help you track system stability and analyze crash reports:
-
Open the Reliability Monitor:
- Press
Windows + Rto open the Run dialog. - Type
perfmon /reland hit Enter.
- Press
-
View Reliability Data:
- The Reliability Monitor will present a graphical representation of your system’s stability over time.
- Click on Critical Events to see the events that resulted in crashes.
-
Review Crash Reports:
- Any critical events listed here can be expanded for more details, allowing you to identify applications and causes of crashes.
3. Accessing Windows Error Reporting (WER)
Windows Error Reporting is a feature that collects and sends error details to Microsoft. You can also review these reports locally if they have been generated:
-
Open File Explorer:
- Click on the File Explorer icon on the taskbar or press
Windows + E.
- Click on the File Explorer icon on the taskbar or press
-
Navigate to the WER Directory:
- Go to
C:ProgramDataMicrosoftWindowsWERReportArchive. - Here, you’ll find folders containing crash reports that may provide insight into application failures.
- Go to
-
Analyze .wer Files:
- Inside the folders, look for files with a “.wer” extension. Open these files using a text editor like Notepad.
- The contents will detail specific crashes, including application names, error codes, and relevant data.
4. Checking the Minidump Files
When a system crash occurs, Windows may create a minidump file that contains the information about the crash:
-
Navigate to the Minidump Folder:
- Open File Explorer and go to
C:WindowsMinidump. If you cannot find the Minidump folder, ensure to enable viewing of hidden files.
- Open File Explorer and go to
-
Locate the Dump Files:
- Inside, you’ll find files labeled with dates and times of crashes. These files typically have a “.dmp” extension.
-
Analyze Minidump Files:
- Analyzing minidump files can be complex, as they often require specialized tools such as WinDbg (Windows Debugger) or BlueScreenView to interpret.
- These tools can provide a clearer picture of what caused the crash based on memory data.
5. Utilizing Third-Party Tools
In addition to the built-in tools, various third-party applications can help you analyze crash reports more efficiently. Tools like BlueScreenView, WhoCrashed, and others can simplify the process of reading and interpreting crash logs.
-
Download and Install a Third-Party Tool:
- Search online for reliable software and download it from their official site.
-
Open and Analyze Crash Reports:
- Follow the application’s instructions to open and analyze dump files or crash logs.
6. Understanding Crash Report Formats
Each of the tools and methods you use can present crash reports in different formats. It’s essential to get familiar with the common terminologies and structures:
- Event ID: Specific number that identifies the type of error.
- Source: Indicates the application or system component that experienced the issue.
- Description: A textual explanation regarding the nature of the error or crash.
- Parameters: Additional numeric codes that give deeper insights into the fault.
Diagnosing Crash Causes
After finding crash reports, diagnosing the problem is the next step. Here are common causes of crashes and how to address them:
1. Software Compatibility Issues
Incompatibility between drivers, applications, and the operating system can lead to crashes. Ensure you are running the latest versions of both the operating system and applications:
- Update Applications: Regularly check vendors’ websites or utilize dedicated update tools to keep your programs current.
- Check Driver Versions: Use Device Manager to check for outdated drivers and address any compatibility issues.
2. System Overheating
Overheating can cause abrupt shutdowns or crashes to protect hardware components. Monitor system temperatures using hardware monitoring tools and ensure proper ventilation.
3. Faulty Hardware
Crashes can also stem from failing RAM, hard drives, or other hardware components. Use Windows built-in Memory Diagnostic tool:
- Run Memory Diagnostic:
- Open the Start Menu and type
Windows Memory Diagnostic. - Select Restart now and check for problems.
- Open the Start Menu and type
4. Overclocking Settings
If your system is overclocked, disabling overclocking via the BIOS settings and returning to stock settings might alleviate instability.
5. Malware or Virus Infections
Malware can corrupt system files and lead to instability resulting in crashes. Regularly scan your system with a reliable antivirus program:
- Run a Full System Scan: Use Windows Defender or third-party antivirus software for comprehensive scans.
Preventive Measures
Taking proactive measures can help minimize future crashes and improve overall system performance:
1. Regular System Updates
Keep your Windows 11 system updated to benefit from the latest features and security patches:
- Enable Automatic Updates: Go to Settings > Windows Update and check for updates routinely.
2. Routine Backups
Regularly back up your files and data using File History or a dedicated backup tool. This ensures you can recover files in case of critical failures.
3. Disk Cleanup
Periodically clean up unnecessary files using the Disk Cleanup tool:
- Access Disk Cleanup:
- Search for Disk Cleanup in the Start Menu.
- Choose the drive you want to clean and follow the prompts.
4. Monitor System Performance
Keep an eye on system performance using built-in tools like Task Manager and Resource Monitor. This can help you identify issues before they cause a crash.
Conclusion
Identifying and understanding crash reports in Windows 11 is vital for maintaining system health and stability. By utilizing tools like Event Viewer, Reliability Monitor, and understanding crash causes, users can make informed decisions about troubleshooting and prevention. With proper measures in place, you can minimize crashes and ensure a smoother Windows 11 experience. Always remember to keep your software updated, run regular system checks, and stay vigilant against potential hardware and software issues. With this knowledge, you’re equipped to tackle most crashes effectively and enhance your overall productivity on Windows 11.
-
Home
-
Partition Magic
- How to View Windows 10 Crash Logs and Error Logs
By Irene |
Last Updated
When you computer crashes, a crash log will be generated, which can help you analyze the causes of the crash. But, do you know how to view Windows 10 crash logs and error logs? If you don’t know, don’t worry. This article from MiniTool will show you how to view Windows 10 crash log with two methods.
Method 1. View Windows 10 Crash Logs with Event Viewer
To view Windows 10 crash logs, you can make use of the built-in tool Event Viewer, which keeps a log of application and system messages, errors, warnings, etc. You can follow the steps below to check Windows crash logs Windows 10 with Event Viewer.
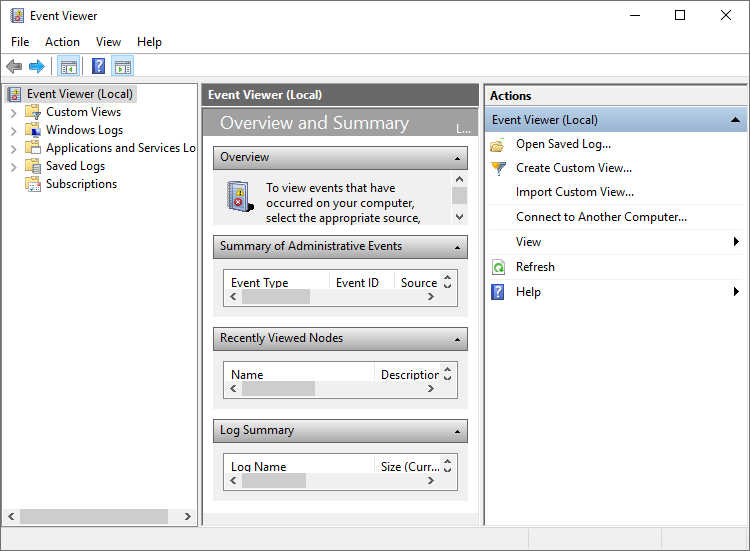
Step 1. Type Event Viewer in the Windows 10 Cortana search box. Then right click the best match Event Viewer and choose Run as Administrator.
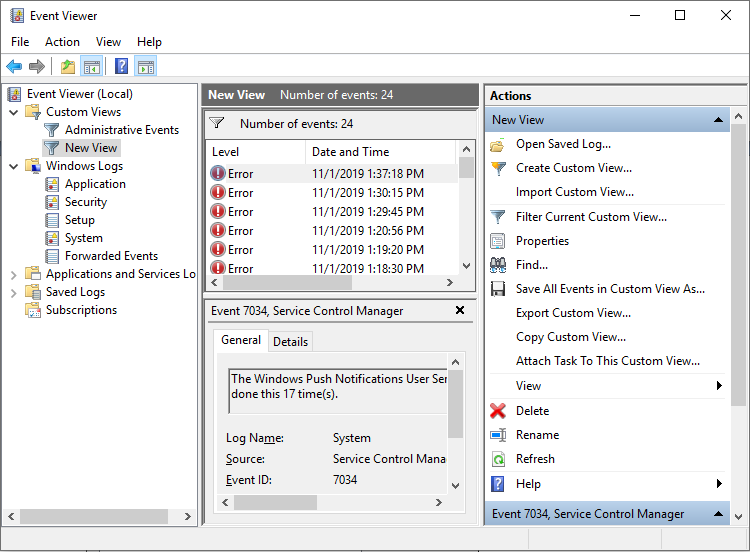
Step 2. Here is the main interface of Event Viewer. On the left side of the window, you can view all the Logs according to the category. To view Windows 10 crash logs such as the logs of blue screen error, just click on Windows Logs.
Step 3. Then choose System under Windows Logs.
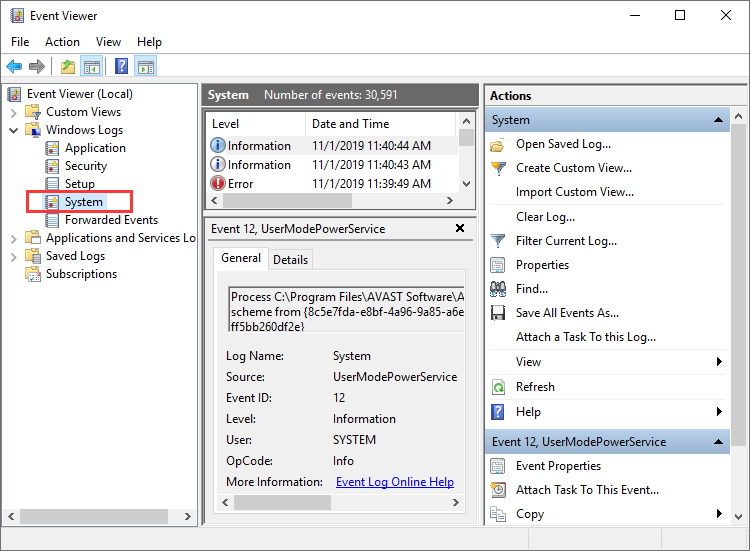
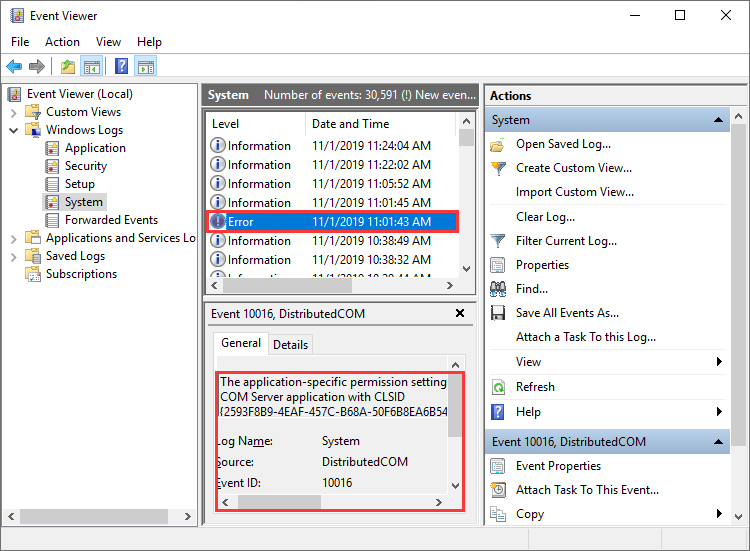
Step 4. Find and click Error on the event list. Then you can view the detailed crash log information shown up in the bottom of the window.
You can also create a custom view so you can view the crash logs more quickly. Here are steps on how to create a custom view.
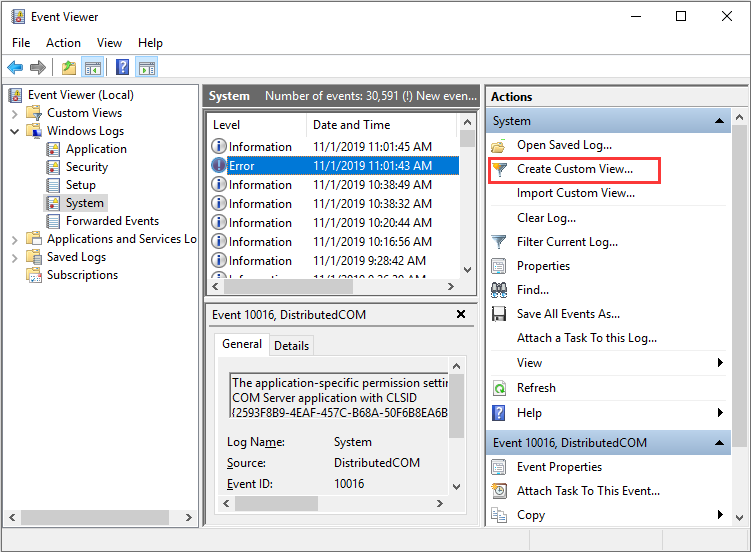
Step 1. Click on Create a Custom View on the right window. As you click on Create Custom View, a new window will pop up.
Step 2. Choose a time period you want to view. Then check the boxes next Critical, Warning and Error in the Event levels section.

Step 3. Select the By log option. Then click the drop-down menu next to Event logs, and then select Application, Security and System.
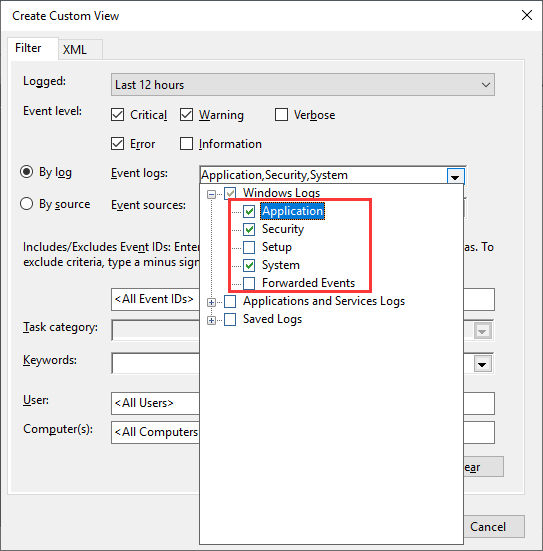
Step 4. Then click OK to save the settings.
Step 5. Name this custom view and then click OK to start to view the Windows 10 crash log.
Step 6. Then you can view all the Windows 10 crash logs during the tome period you select.
Windows Reliability Monitor also enables you to view recent system and application crashes. Here’s how to check Windows 10 crash logs with Reliability Monitor.
Method 2. View Windows 10 Crash Log with Reliability Monitor
Step 1. Type reliability in the Windows 10 Cortana search box. Then click the best match View reliability history.
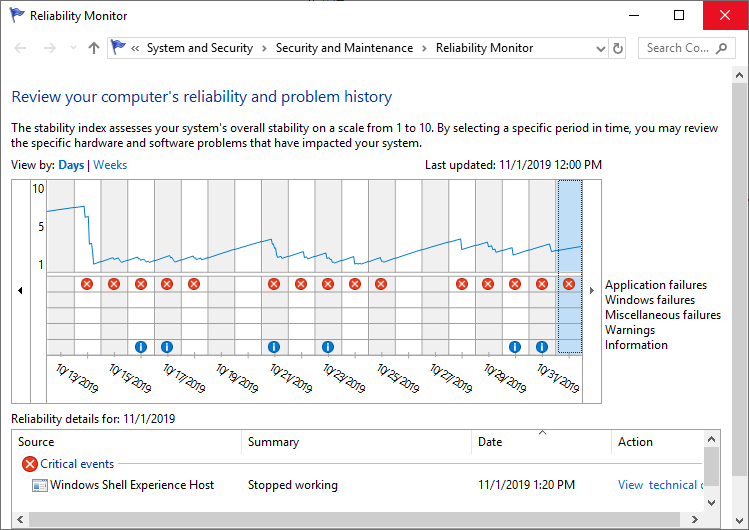
Step 2. From the main interface, you can see that the Reliability Monitor window is arranged by dates. If Windows crashes or freezes, you will see a red circle with an “X” representing the failure, as shown below.
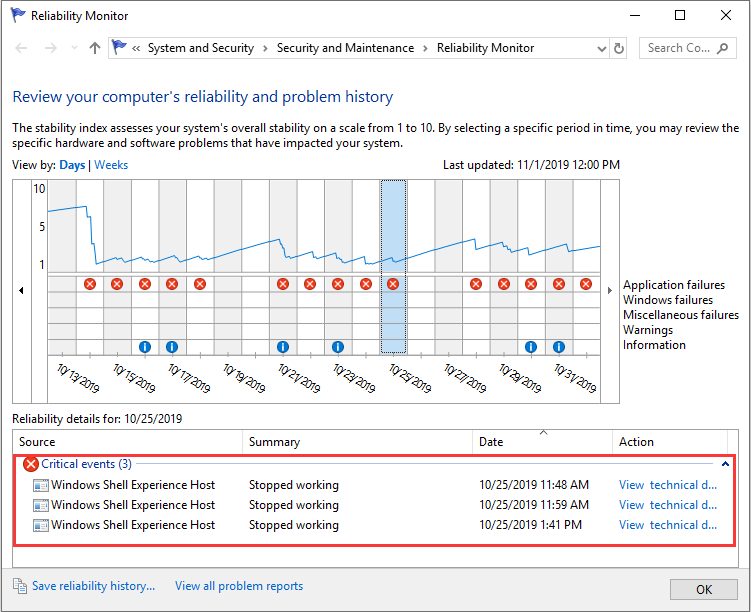
Step 3. If you want to view a certain day’s crash log, just click that day’s column and more detailed information will be displayed at the bottom. You can also double click one of the listed events to open a new window with more information.
Tips:
Discover and eliminate deceptive antivirus with MiniTool System Booster, your safeguard against digital threats.
MiniTool System Booster TrialClick to Download100%Clean & Safe
Conclusion
Event viewer and Reliability Monitor are all good for you to check Windows 10 crash logs. Choose a tool you like and you can get all the Windows crash log information.
About The Author
Position: Columnist
Irene joined MiniTool in 2018 and has since become a professional in the areas of disk management and Windows tricks. Irene’s expertise allows her to assist clients with managing their hard drives, optimizing their Windows operating system, and troubleshooting any technical issues that arise.
When a Blue Screen of Death error occurs, Windows displays its details and code for a short time and restart the PC. Even sometimes Windows restart so quickly that the users cannot note down the error code. In such situations, BSOD log files can help. In this post, we will show you how to find and view BSOD log files in Windows 11/10.
Windows saves the details of every BSOD error at a specific location. This data is called the BSOD log and is available in the BSOD log files. Windows 11/10 has a built-in log file viewer tool, Event Viewer. Event Viewer lists all BSOD error logs and provides the users with a troubleshooting guide to solve the error.
Windows BSOD log file location
Follow the steps below to view the BSOD logs in Event Viewer.
1] Type “Event Viewer” in the Windows search box and click on the app to launch it.
2] To view the BSOD error logs, you have to create a filter. For this, go to “Action > Create Custom View.”
3] In the Create Custom View window, make sure that you are under the “Filter” tab. Select the time when you have observed the Blue Screen of Death error on your system in the “Logged” drop-down menu. If you know the exact date and time of the BSOD error, you can select the Custom range option.
In my case, I did not know the date and time of the error. That’s why, I left the setting to default, “Any time.”
4] Now, select the checkbox “Error” in the Event level section and select the “By log” radio button. After that, click on the Event logs drop-down menu and expand the “Windows Logs” section. Here, you have to select the following checkboxes:
- Application
- Security
- System
When you are done, click OK.

5] After that, a new window will open. In it, you must enter the name of the filter you created and click OK to save it.
I saved it with the name System Error Logs. You can view it in the “Custom Views” section on the left panel.
6] After selecting the filter you have just created, you can view all the system error logs in the middle panel of the Event Viewer. To view the BSOD log, you have to find the error with the source “BugCheck.”
Now, click on the “Source” to arrange all the entries under it alphabetically. This will make it easier for you to locate the BugCheck entry.

Under the “General” tab, you can view the error code. Click the “Details” tab to know more about the error.
The message, “The computer has rebooted from a BugCheck” in the General tab indicates that this is a BSOD error.
Now you can easily find BSOD errors and troubleshoot them.
Read: Log files created when you upgrade Windows
TIP: You can also use BlueScreenView. It is a user-oriented utility that automatically scans all the minidump files that were created after the BSOD crash into a single table. For every crash occurrence, BlueScreenView gives details about the driver that was loaded during the crash, and other crash information to troubleshoot the problems and locate the suspected problematic drivers easily.
Read next: How to find ChkDsk results in Event Viewer logs.
Where are Windows crash logs stored?
Windows crash logs are stored as minidump files in the C:\Windows\Minidump directory. These files capture memory details at the moment of a crash. You can use Microsoft’s WinDbg tool to examine these log files.
How do I find the source of BSOD?
To find the source of a BSOD, open the Event Viewer and check the system logs for error messages that might indicate the problematic device or driver. Reviewing these logs can help identify the issue.
Has your computer with Windows 10 operating system just crashed suddenly and you are right now searching for a way to view crash logs in Windows 10 then you have come to the right place. This is where we can guide you on how you can check crash logs in Windows 10.

Table of Contents
Windows crash may be because of a lot of reasons like overheating of the system or some fault in the driver installed. This is where the crash logs option comes in use for you can see what has caused the crash and other info like the name of the log and the EventID.
What Causes Windows 10 to Crash?
The users that face this kind of crash the first time may think that the reason behind this might be confusing and it will not be worth it to know. But the point to focus on here is the fault might not be with the components of Windows 10 and there must be an external reason that you can check in Windows crash report.
- Issue in RAM: There is a high possibility that your computer RAM is not working at the optimum level and that is what causes your PC trouble in retrieving data from memory whensoever you are trying to do so.
- Overheated System: With low RAM size or any other compatibility issue in the motherboard you may face an overheating of the system that is causing your PC to crash or freeze.
- Incompatible Driver: It is a common habit to install new drivers for our system when our pre-installed drivers get outdated and start to make any function of the PC lag. But these drivers may in all possibility contain some viruses or bugs that can potentially harm and cause our system to crash.
- Issue with Hard Drive: Hard drives contain most of the data in your PC and any fault can create a situation that most probably will lead to a crash where a Windows 10 blue screen log is.
Microsoft’s investigation identifies the following as the primary reasons why Windows crashes:
- 70% of accidents are the result of rogue driver code.
- 10% of the total is accounted for by hardware issues.
- 15% of the cases include unknown causes.
- 5% of the issues are the result of Microsoft code.
You can check our guide to Fix Windows 10 Crashing Randomly.
Here, we have listed the ways to check crash logs in Windows 10.
Method 1: Through Event Viewer
Event viewer is an inbuilt app to view crash logs in Windows 10. You may view the event logs on your computer using the Event Viewer component of the Windows operating system. Application and system messages, such as informative messages, errors, warnings, etc., are logged by Event Viewer. You may identify the specific reasons why your computer crashes using Event Viewer and it is one of the easiest ways to get Windows crash reports.
1. Go to the Windows Cortana Search box and type Event Viewer. Click on Open.

2. Click on Windows log. This is where you will get all logs including Windows 10 blue screen log.

3. Then, choose System from the drop-down menu.

4. On the event list, click Error. Then you can view all the information about Windows crash reports.

Also Read: How to Clear All Event Logs in Event Viewer in Windows 10
Method 2: Through Reliability Monitor
There is another tool to get reliable information and view crash logs in Windows 10. It is called a Reliability Monitor and as the name suggests, it is a great choice to depend on in case your Windows 10 PC crashes. Below are the steps that will help you guide on how to use this to check crash logs in Windows 10.
1. Again, go to Windows 10 Cortana search box and type Reliability Monitor, and click on Open.

2. You will see on the interface Reliability Monitor is generating the report Please wait.

3. You will see Stability Index.

It assesses your overall system stability on a scale from 1 to 10. You can select any week or any day to review specific hardware or software problems that troubled your system. The horizontal line in blue will show you the score.
Note: stability index does not take into account warning and informational events when it calculates the stability score from 1 to 10.
The report records 3 failures which are application failure, Windows failure, and miscellaneous failure. Moreover, it records informational events and warnings. The table below shows how these failures, informational events, and warnings.
| Icon | Information it shows |
| Blue info icon | Informational events |
| Red cross icon | 3 failures |
| Yellow exclamation icon | Warning |
4. Then out of all these crash dates if you want any information about a particular date what you got to do is just, click on that date’s column. This will open a new window displaying all the information.

5. Click on View all problem reports.

Now, you will see all crash log details.

Also Read: Fix The Procedure Entry Point Error on Windows
Method 3: Through Windows PowerShell
Third and the final method to check cash logs in Windows 10 is using the Power Shell tool. Power Shell is a great application that is used in automating the management system with the use of a scripting language. Read below to understand how you can use this application to view crash logs in Windows 10.
1. Go to the Windows 10 Cortana search box and type PowerShell. Click on Open after finding the top search result.

2. Type the following command into the command box. The crash logs will be retrieved together with their Index, Time, EntryType, Source, InstanceID, and Description using this command.
Get-EventLog -Log system | where {$_.entryType -match "Error"}

3. Get the most recent crash logs up to the specified number by using the Newest argument. Run the following command to collect the 20 most recent crash logs:
Get-EventLog -LogName System -Newest 20 -EntryType Error

Frequently Asked Questions (FAQs)
Q1. Where do I find information about my computer crashing?
Ans. You can use Event viewer which is an in-built app in Windows 10, you can also use reliability monitor which is a user-friendly application and you can also use PowerShell application which is an open-source CLI tool.
Q2. What are the most frequent crashes in Windows 10?
Ans. The three most frequent crashes in Windows OS are fault at the application level, the software hangs unexpected restart and shutdown. There are other reasons also but these are common reasons as per Microsoft investigation.
Q3. Where can I find crash log in Windows 11?
Ans. You can use Event Viewer to see the crash logs in Windows 11. In the event viewer app, move to the Windows log. Then search error and tap on the error. Detailed information will be shown for the error.
Q4. Why does my PC keep crashing and freezing?
Ans. There are a number of reasons for crashes and freezing. Some common reasons are overheating, issues with memory, faulty hardware and software, malicious files, corrupted system registry files, and too little available memory.
Recommended:
- Fix Windows Does Not Have Enough Information to Verify This Certificate Solutions
- Why is my Computer Making Funny Noises?
- Fix Hard Disk Problems in Windows 10
- Fix Event 1000 Application Error in Windows 10
The Windows PCs are designed in a way that they can store all the crash log information in your crash log so you can at any time view crash log information in Windows 10. We hope that these methods might have helped you to view crash logs in Windows 10.
Windows 11 (including earlier version), when, encounter a Blue Screen of Death (or BSOD), accumulates all the memory information into a file. Holding Dump file as name it further helps users to identify and debug the cause of the crashes. The files also allow writing the debugging details in different file formats in order to simplify the readability of the data.
Dump file may be of various types depending on the nature of crash and bug check values. These are “Small memory dump (Minidump)”, “Kernel memory dump”, “Complete memory dump”, “Automatic memory dump”, and “Active memory dump”. However, among all these, Windows 10/11 generates Automatic memory dump all by itself as its name suggests. The following section will deal with everything related to Dump File Location Windows 11 or 10.
Dump File Location Windows 10 or 11
Here is the Dump File Location Windows 11 or 10 –
Dump File Location
Instead, you can say Dump file locations so see the following paths to find out the data –
%SystemRoot%memory.dmp which means
C:\Windows\memory.dmp
This is the default location and here, C: refers to the system drive where Windows is installed.
Windows 11/10 can also capture memory dumps that consume a small amount of space. These are created at –
%SystemRoot%Minidump.dmp i.e.,
C:\Window\Minidump.dump
Change Dump File Location Windows 11 or 10
- Go to desktop and right-click on This PC icon. From the available options, choose Properties.
- Click Advanced system settings link that shows up on the top left of the subsequent window.
- Click Settings beneath Startup and Recovery section.
- Locate the Dump File text field and insert the location of the file.
Configure the Type of Memory Dump File
As aforementioned, Windows generates Automatic memory dump files but users can choose to configure the settings as per need. Thankfully, there are certain ways using which a user can change the type of memory dump file that Windows creates.
1]Through Startup and Recovery
- Press “Win logo+R” hotkey to open Run dialog box. System properties wizard will become visible, switch to Advanced tab.
- Here, click Settings just below Startup and Recovery section.
- Click the drop-down under Write debugging information. From the list of dump file types, choose the type that you wish Windows to generate when Windows crashes.
- To apply the changes, click OK.
Note – In case the system crashes a lot, it’s better to deselect the checkbox against the option Overwrite any existing file. Doing this will eventually create incremental dump files that will have a memory dump file for each crash that occurs.
2] Use Elevated Command Prompt
- Fire up taskbar search using Win+S combination of keys. Type in cmd.exe, right-click ok Command Prompt and choose Run as administrator.
- Click Yes on the prompt of UAC to access elevated Command Prompt.
- Once into the black window, insert the applicable command from the list below to change the type of dump file and hit Enter.
| Memory Type | Command Line |
| No memory | wmic RECOVEROS set DebugInfoType = 0 |
| Small memory dump | wmic RECOVEROS set DebugInfoType = 3 |
| Kernel memory dump | wmic RECOVEROS set DebugInfoType = 2 |
| Complete memory dump | wmic RECOVEROS set DebugInfoType = 1 |
| Automatic memory dump | wmic RECOVEROS set DebugInfoType = 7 |
| Active memory dump | wmic RECOVEROS set DebugInfoType = 1 |
- Finally, close the prompt window and Restart Windows 10 PC to make the changes effective.
Note – The Command Prompt also lets you view the current memory dump file. Just open Command Prompt as Administrator and run the following command-line –
wmic RECOVEROS get DebugInfoType
Types of Memory Dump Files
It is important to know the types after finding Dump File Location Windows 11 or 10 –
Small memory dump – It is the type that contains a minimal amount of details. Basically, the file includes the stop code, list of device drivers, parameters. Furthermore, it also contains the current process and informs which kernel thread or process crashed.
Kernel memory dump – This is the most useful and comprehensive one with respect to the kernel. Moreover, this type contains information in connection with programs and drivers in kernel mode. However, the dimension of this dump file completely depends on the amount of kernel-mode memory specified by Windows and drivers. Now, in case a second crash occurs and a kernel memory dump file is generated, the earlier content gets overwritten.
Complete memory dump – A remarkably large file type which is equal to the RAM of the system. It incorporates physical memory allocation that is basically left out in other kernel dumps.
Automatic memory dump – When compared to the kernel memory option, this is quite similar to it in terms of information. The only difference between them is the size of the paging file that Windows sets for them.
Active memory dump – It is comparatively smaller than complete memory dump. This type refines the items that are not influential in spotting the cause of a crash.
That’s all!!!