
When Windows OS crashes (Blue Screen of Death or BSOD) it dumps all the memory information into a file on disk. This dump file can help the developers to debug the cause for the crash. The default location of the dump file is %SystemRoot%memory.dmp i.e C:\Windows\memory.dmp if C: is the system drive. Windows can also capture small memory dumps which occupy less space. These dumps are created at %SystemRoot%Minidump.dmp (C:\Window\Minidump.dump if C: is the system drive). Below you can find details on crash dump settings. This article is applicable for XP, Vista, Windows 7 and Windows 10.
How to enable or disable kernel memory dump? If dump is enabled, how to choose mini dump or full kernel dump?
We can configure the dump settings through system properties. Detailed steps are given below.
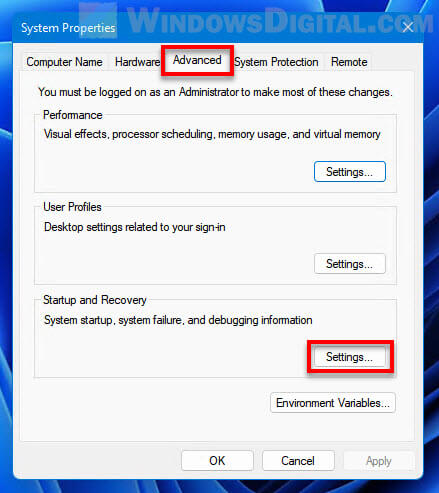
- Open System properties(Execute sysdm.cpl from Run window)
- Click on Advanced tab
- Click on the Settings button under Startup and Recovery
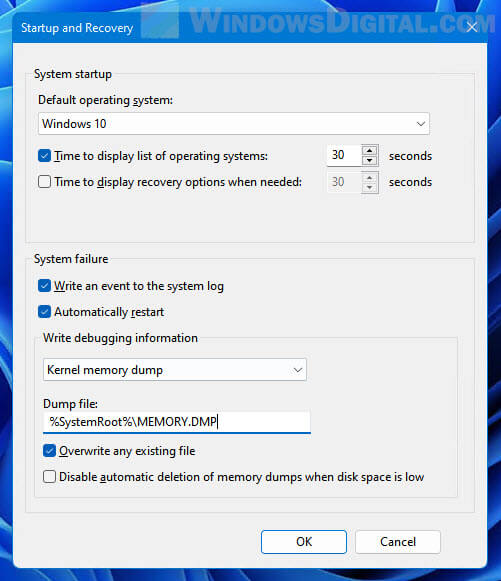
- In this window, click on the drop down list under ‘Write Debugging information’
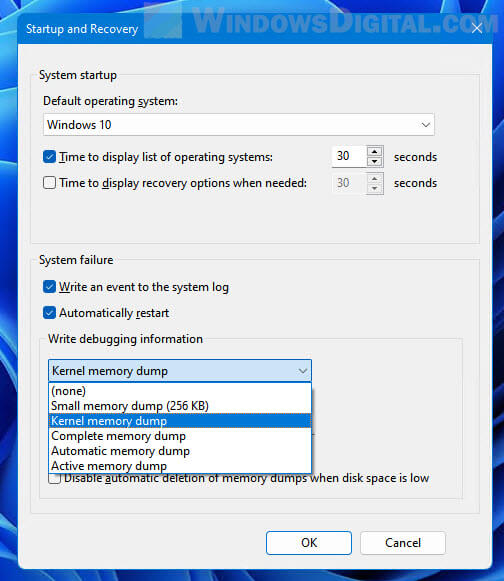
- This list would show 6 options – None, Small memory dump(64 KB), Kernel memory dump, Complete memory dump, Automatic memory dump and Active memory dump. If you want to disable memory dump then select none from these options. Otherwise select your required option from the other three. After this click on OK and close the windows.
How to change crash dump file location?
You can set the dump file location in the same Startup and recovery window mentioned above. In the ‘Dump File’ text field you can enter the location of the file.
You can also change mini dump file location – Select ‘small memory dump‘ from the drop down box and then give the location of the file in the bottom text box.
How to enable or disable crash dump file overwrite?
In the Startup and recovery window(which can be opened from System properties window) unselect the check button ‘Overwrite any existing file‘ to disable crash dump overwrite.
Modifying Windows dump settings using registry keys
Registry values related to Windows crash dump settings are stored under the registry key HKEY_LOCAL_MACHINE\SYSTEM\CurrentControlSet\Control\CrashControl.
We can configure crash dump by modifying these registry values also(listed below).
-
- AutoReboot
- CrashDumpEnabled
- DumpFile
- LogEvent
- MinidumpDir
- Overwrite
- SendAlert
How to disable crash dump?
Open registry editor and navigate to the path
HKEY_LOCAL_MACHINE\SYSTEM\CurrentControlSet\Control\CrashControl. Set the registry valueCrashDumpEnabledto 0. Or you can simply run the below command which does the same.Reg add "HKEY_LOCAL_MACHINE\SYSTEM\CurrentControlSet\Control\CrashControl" /v CrashDumpEnabled /t REG_DWORD /d 0 /f
Disable crash dump overwrite
Set the value of the registry key ‘Overwrite’ to 0. This key can be found in the registry path mentioned above. If you want to overwrite existing crash dump file, then set its value to 1. Below command would disable crash dump overwrite.
Reg add "HKEY_LOCAL_MACHINE\SYSTEM\CurrentControlSet\Control\CrashControl" /v Overwrite /t REG_DWORD /d 0 /f
Windows 11 dump file is a file that stores a copy of your computer’s memory at the time of a system crash or a BSoD (Blue Screen of Death). It accumulates all the memory information during the crash into a file. These dump files are crucial to help diagnose and debug the problem that caused the crash.
If you are looking for the memory dump file location for diagnosing purposes or if you simply want to clear the dump files, this guide will show you where you can find the dump files in Windows 11, as well as how to clear the dump files or change the dump file location.
Also see: How to Startup Repair Windows 10/11 using Command Prompt
Where is the memory dump file in Windows 11
Dump File Location in Windows 11
The memory dump file in Windows 11 is a single file called MEMORY.DMP which can be found in the system root folder – “C:\Windows”.
The full path to the memory dump file would be “C:\Windows\memory.dmp“, whereas “C:” is the drive of your Windows installation. Replace “C:” if your Windows was installed on a different drive.
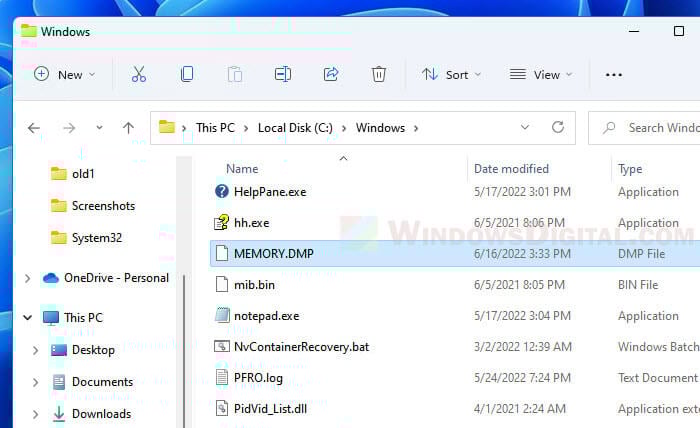
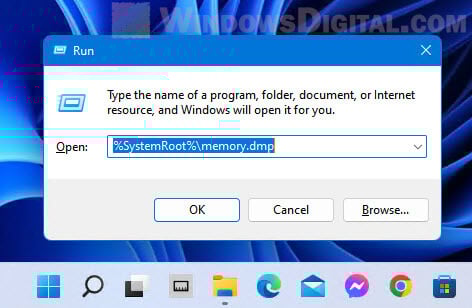
Alternatively, you can access the folder by first pressing Win + R keys to open the Run dialog box. Then, enter %SystemRoot% to the Open field and click OK to open the system root folder. From there, look for a file called “MEMORY.DMP” and that will be the dump file you are looking for. To open the dump file directly, enter %SystemRoot%\memory.dmp instead.
If you can’t find the memory.dmp dump file in the system root, it just means that there was no crash recorded, or you have recently cleared the dump file through disk cleanup recently after the system crash.
Related: How to Fix Blue Screen With Sad Face on Windows 11/10
Minidump files location
In Windows 11, dump files can also be stored as smaller memory dump files called Minidump. You can find these minidump.dmp dump files in C:\Windows\Minidump.dmp. Some minidump files will have their own names, usually numbers such as the date and time of the crash incident.
These are the default path to the memory dump files in Windows 11. To learn how to change the default dump file location in Windows 11, see the next section of this guide.
How to clear dump files in Windows 11
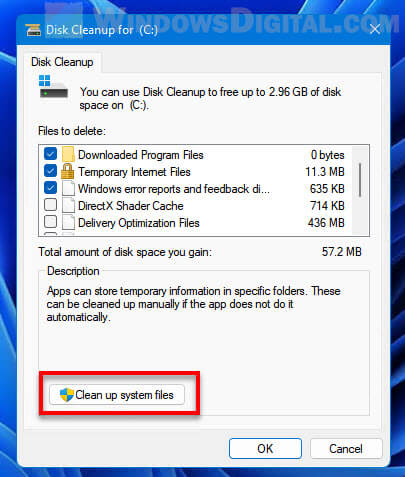
To clear the dump files in Windows 11, the better way to do it other than deleting the MEMORY.DMP in the system root folder is to clear it via the Disk Cleanup tool. To learn how to do so, follow the steps below.
Suggested Guide: How to Clean C: Drive in Windows 11
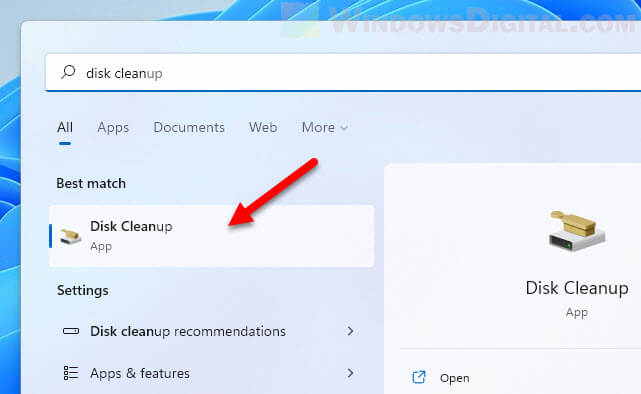
- In Windows 11, search for and open “Disk Cleanup” via Start.

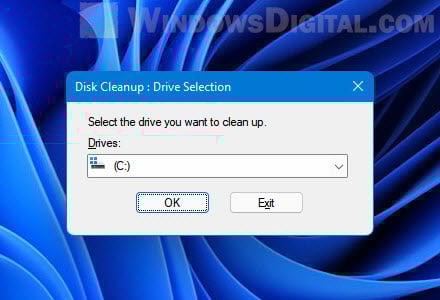
- When prompted to select drive, choose the system drive where your Windows installation is located, usually the C: drive.

- After the initial load, in the Disk Cleanup window, click “Clean up system files” under Description.

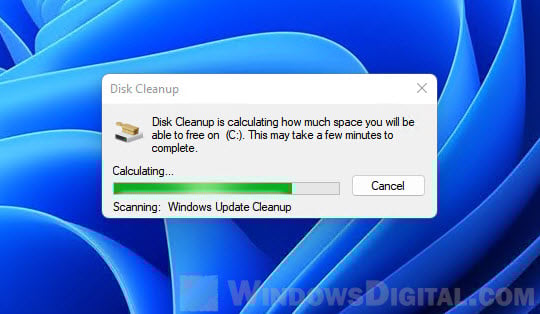
- Disk cleanup will then calculate what system files can be cleared and how much space you will be able to free on the drive. This may take a while to complete.

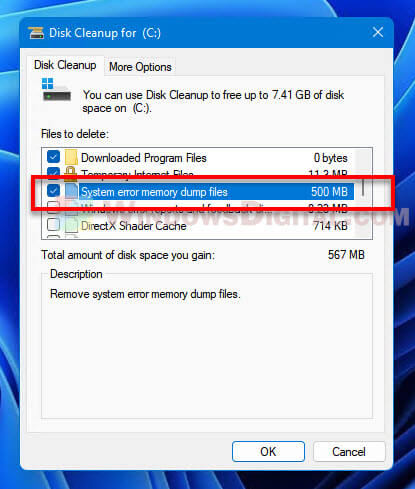
- On the next window, select “System error memory dump files” along with any other files you want to clear, and then click OK to begin clearing the unwanted files.
How to change default dump file location in Windows 11
The dump file location is defaulted to the system root folder – “C:\Windows”. You can change where Windows should save the dump file to a different location instead of the system root folder.
The most common reason users would want to change the default dump file location is when the dump file is taking up too much disk space on the system drive. This is especially the case when they choose the “Complete memory dump” option (a type of dump file) which will require significantly larger disk space as it writes the complete memory equals to the amount of RAM.
To change the default dump file location in Windows 11, follow the steps below.
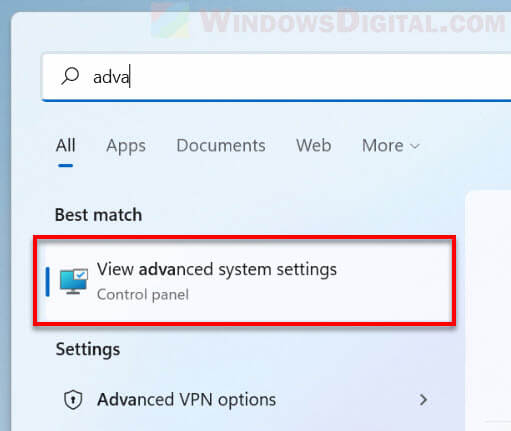
- Search for and open “View advanced system settings” via Start.

- In the System Properties window, select Advanced tab, and then click the Settings button under “Startup and Recovery“.

- In the “Dump file” text field, enter the new location you would like Windows to save the dump file to.
How to change the type of memory dump file
Windows can generate different types of memory dump file. The debugging information and details are written in different format in each type of memory dump file. The size of the dump file also depends on the type of the dump file. Some types of dump file will store more information, while some store lesser.
You can change the type of memory dump file in Windows 11 by first follow the exact same steps in the instructions above to open the “Startup and Recover” window. In the window, click the drop-down menu under “Write debugging information”, and then select the type of memory dump file you want Windows to generate in the event of system crash.
If you choose (none), Windows 11 will not generate any memory dump file in any system crash or blue screen event.
How to read dump file in Windows 11
Dump files are not designed to be understandable by the average users. Memory dump files are designed for technicians and developers who can make use of the data to fix the issues and improve the system so that these crashes don’t happen again.
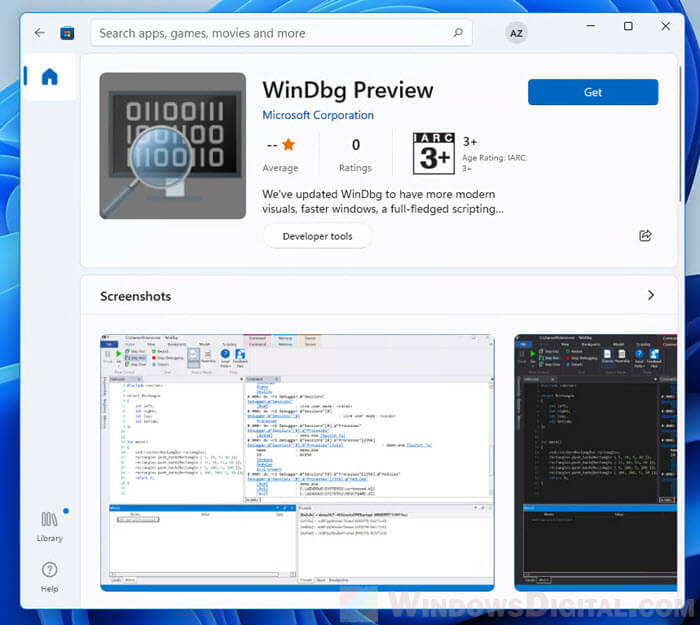
If you want to read the dump file in Windows 11, you will need a debugging tool specializes in reading dump files. You can use an app called WinDbg Preview by Microsoft which can be installed via Microsoft Store.
Windows 11 (including earlier version), when, encounter a Blue Screen of Death (or BSOD), accumulates all the memory information into a file. Holding Dump file as name it further helps users to identify and debug the cause of the crashes. The files also allow writing the debugging details in different file formats in order to simplify the readability of the data.
Dump file may be of various types depending on the nature of crash and bug check values. These are “Small memory dump (Minidump)”, “Kernel memory dump”, “Complete memory dump”, “Automatic memory dump”, and “Active memory dump”. However, among all these, Windows 10/11 generates Automatic memory dump all by itself as its name suggests. The following section will deal with everything related to Dump File Location Windows 11 or 10.
Dump File Location Windows 10 or 11
Here is the Dump File Location Windows 11 or 10 –
Dump File Location
Instead, you can say Dump file locations so see the following paths to find out the data –
%SystemRoot%memory.dmp which means
C:\Windows\memory.dmp
This is the default location and here, C: refers to the system drive where Windows is installed.
Windows 11/10 can also capture memory dumps that consume a small amount of space. These are created at –
%SystemRoot%Minidump.dmp i.e.,
C:\Window\Minidump.dump
Change Dump File Location Windows 11 or 10
- Go to desktop and right-click on This PC icon. From the available options, choose Properties.
- Click Advanced system settings link that shows up on the top left of the subsequent window.
- Click Settings beneath Startup and Recovery section.
- Locate the Dump File text field and insert the location of the file.
Configure the Type of Memory Dump File
As aforementioned, Windows generates Automatic memory dump files but users can choose to configure the settings as per need. Thankfully, there are certain ways using which a user can change the type of memory dump file that Windows creates.
1]Through Startup and Recovery
- Press “Win logo+R” hotkey to open Run dialog box. System properties wizard will become visible, switch to Advanced tab.
- Here, click Settings just below Startup and Recovery section.
- Click the drop-down under Write debugging information. From the list of dump file types, choose the type that you wish Windows to generate when Windows crashes.
- To apply the changes, click OK.
Note – In case the system crashes a lot, it’s better to deselect the checkbox against the option Overwrite any existing file. Doing this will eventually create incremental dump files that will have a memory dump file for each crash that occurs.
2] Use Elevated Command Prompt
- Fire up taskbar search using Win+S combination of keys. Type in cmd.exe, right-click ok Command Prompt and choose Run as administrator.
- Click Yes on the prompt of UAC to access elevated Command Prompt.
- Once into the black window, insert the applicable command from the list below to change the type of dump file and hit Enter.
| Memory Type | Command Line |
| No memory | wmic RECOVEROS set DebugInfoType = 0 |
| Small memory dump | wmic RECOVEROS set DebugInfoType = 3 |
| Kernel memory dump | wmic RECOVEROS set DebugInfoType = 2 |
| Complete memory dump | wmic RECOVEROS set DebugInfoType = 1 |
| Automatic memory dump | wmic RECOVEROS set DebugInfoType = 7 |
| Active memory dump | wmic RECOVEROS set DebugInfoType = 1 |
- Finally, close the prompt window and Restart Windows 10 PC to make the changes effective.
Note – The Command Prompt also lets you view the current memory dump file. Just open Command Prompt as Administrator and run the following command-line –
wmic RECOVEROS get DebugInfoType
Types of Memory Dump Files
It is important to know the types after finding Dump File Location Windows 11 or 10 –
Small memory dump – It is the type that contains a minimal amount of details. Basically, the file includes the stop code, list of device drivers, parameters. Furthermore, it also contains the current process and informs which kernel thread or process crashed.
Kernel memory dump – This is the most useful and comprehensive one with respect to the kernel. Moreover, this type contains information in connection with programs and drivers in kernel mode. However, the dimension of this dump file completely depends on the amount of kernel-mode memory specified by Windows and drivers. Now, in case a second crash occurs and a kernel memory dump file is generated, the earlier content gets overwritten.
Complete memory dump – A remarkably large file type which is equal to the RAM of the system. It incorporates physical memory allocation that is basically left out in other kernel dumps.
Automatic memory dump – When compared to the kernel memory option, this is quite similar to it in terms of information. The only difference between them is the size of the paging file that Windows sets for them.
Active memory dump – It is comparatively smaller than complete memory dump. This type refines the items that are not influential in spotting the cause of a crash.
That’s all!!!

Welcome Dear Visitors All;
If you are a windows user, then you may encounter a blue screen of death error message that indicates that “Your Device Ran into a Problem and Needs to Restart”. This blue screen indicates that your windows detected a system or hardware corruption, so the computer restarted as an attempt to protect your hardware or system files from further corruption. In such case, the computer will write a log report into a file called Memory.dmp or minidump file to inform you what is the problem that caused the system to crash or to restart. But the Crash debugging mode should be enabled before this event.
This topic I will show you how to enable Windows crash Memory dump, and how to view or share the file in windows 10 and windows 11 operating systems to get an online support from Microsoft or from ValiumMedia Techs channel on YouTube.
You can configure your system to write a debugging information either into a large file called Memory.dmp stored in windows folder on this path “C:\Windows\Memory.dmp“, or as a small numerically named file with .dmp extension stored inside Minidump folder on this path “C:\Windows\Minidump\“.
How to Check Crash Debugging Status?
You can check whether the crash debugging status is enabled or disabled by using either Command Prompt or using Advanced System Properties, a System Settings panel. Both methods are applicable to Windows 7,Windows 8, Windows 10, Windows 11 or any windows edition.
How to Check Debugging Status from Advanced System Settings?
- Press Windows + R keys from keyboard to open Run tool
- Type SystemPropertiesAdvanced and press Enter to open System Properties settings panel.
- Click on Settings icon under Startup and Recovery field
- If None is the selected option under Write Debugging Information field, then the debugging status is disabled in your computer.
- So select Automatic Memory Dump or Small memory dump or another option to enable the Memory Dump debugging.
- In Advanced Recovery Environment, you can use CMD to open System Properties Advanced after changing the CMD path into System32 folder.
How to Check Debugging Status Using CMD in Windows 11?
- To check debugging status from Command Prompt, do the followings:
- Type CMD into search box and then run the Command Prompt as administrator
- Type the following command and press Enter
- WMIC RECOVEROS Get DebugInfoType
- The seven value indicates that the Debugging is enabled in Automatic Memory Dump mode.
- Note: In Advanced Recovery Environment, you have to change the CMD path into C:\Windows\System32 folder first, in order to check or to enable Crash debugging mode using this command:
- CD /D C:\Windows\System32
- Replace the C with the letter of windows drive in your PC.
- CD /D C:\Windows\System32
You can enable the Crash debugging mode in windows using one of the following methods:
- From System Properties settings
- From Command Prompt
- From Registry Editor
How to Enable Crash Debugging Using System Properties settings:
- Press Windows + R keys from keyboard to open Run tool
- Type SystemPropertiesAdvanced and press Enter from keyboard to open System Properties settings
- Click on Settings icon under Startup and Recovery field
- From Write Debugging Information field, choose Complete Memory Dump, Kernel Memory Dump, Automatic Memory Dump, or Small Memory Dump according to what you want
- After that, click Ok to save changes.
How to Enable Crash debugging Memory File Using CMD?
- To enable Memory dmp or minidump creation using CMD, do the followings:
- Type CMD into Search box and then Run the Command Prompt as administrator
- Execute the following command to enable Complete Memory Dump:
- WMIC RECOVEROS set DebugInfoType = 1
- Execute the following command to enable Kernel Memory Dump:
- WMIC RECOVEROS set DebugInfoType = 2
- Execute the following command to enable Small memory dump (128 KB):
- Execute the following command to enable Automatic memory Dump:
- WMIC RECOVEROS set DebugInfoType = 7
- To disable Crash debugging, execute this command:
- WMIC RECOVEROS set DebugInfoType = 0
- You can also use the same commands to enable the debugging memory files from Windows Recovery Environment, but you have to change the CMD path to System32 folder first using this command:
- CD /D C:\Windows\System32
- Replace the C with the letter of windows drive in your PC.
- CD /D C:\Windows\System32
How to Enable Debugging Memory File Using Registry Editor?
- To enable crash debugging file from registry editor, do the followings
- Press Windows logo + R keys to open Run Tool
- Type Regedit and press Enter to open Registry Editor tool
- Navigate to this key path:
- Computer\HKEY_LOCAL_MACHINE\SYSTEM\CurrentControlSet\Control\CrashControl
- Right click on CrashDumpEnabled key and then select Modify option
- Change the value data into one of the followings:
- Type 1 to enable Complete Memory Dump
- Type 2 to enable Kernel memory Dump
- Type 3 to enable Small Memory Dump
- Type 7 to enable Automatic Memory Dump
- You can enable debugging from advanced recovery menu using Registry editor as followings:
- Type REGEDIT into command prompt and press Enter to open Registry editor
- Select HKEY LOCAL MACINE
- From File tab, select Load Hive option
- Select your windows and then navigate to Windows\System32\Config folder
- Select System file and then click on Open option
- Type Sys and then click ok to load the system Registry file
- Expand Sys key and then navigate to this path:
- ControlSet\Control\CrashControl
- Right click on CrashDumpEnabled key and select Modify option
- Type three to enable Small Memory Dump, or type Seven to enable Automatic Memory Dump
- Collapse the keys list and then select Sys key
- Click on file tab and then select Unload Hive option
How to Read Memory Dump File?
- To View the memory.dmp or the Minidump file, do the followings:
- Install the WinDbg tool from Microsoft Store or from the official Microsoft website for free
- After installing the debugger tool, locate the tool launcher and start it
- From File tab, select Open Crash Dump option
- Navigate to the windows or Minidump folder and then double click the dump file to load it.
- Click on !analyze -v to start analyzing the crash file
- Note: You have to be connected to the internet in order to download the debugging codes and symbols required to analyze the file.
- You have to have enough experience in coding and in Microsoft symbolsmeanings in order to understand the analyzing result of the Memory.dmp file.
- You can also use free windows memory.dmp viewer from third party source, such as NirSoft BlueScreenView tool. This free tool can also be used while booting into Windows Recovery Environment.
How to Share the Memory Dump File?
- To get an online support, you can upload the memory dump or minidump file as followings:
- Open C:\Windows\ and/or C:\Windows\Minidump\ folder according to debug settings in your computer
- Copy the memory.dmp file or the Minidump file into Documents or another folder so you can compress and share the file without access denied or permission errors, because windows security settings is not allow copy or modification the files in their default paths.
- Right click the Memory.dmp file and then select “Compress to zip File” option to reduce the file size so you can share it faster.
- You can copy both memory.dmp and minidump files if your computer created both files.
- If you have failed to copy the files, you can run the CMD as administrator and then execute one of the following commands to copy the files into Dump folder in the main directory of C partition:
- XCOPY /R /H /i “C:\Windows\Memory.dmp” C:\DUMP
- To copy Memory.dmp file
- XCOPY /R /H /i “C:\Windows\Minidump” C:\DUMP
- To copy Minidump folder or its contents
- XCOPY /R /H /i “C:\Windows\Memory.dmp” C:\DUMP
- To compress the Dump folder using CMD, execute this command;
- Powershell Compress-Archive c:\dump c:\dump.zip
- In Advanced Recovery Menu, you can send the Memory.dmp file into a USB drive, after that, connect the USB drive to your mobile or another computer to upload the file into google drive or into another file hosting website or online cloud.
- After that, copy the link and add it in a comment or into email to get the online help.
How do I upload files to a shared Google Drive?
- To upload the file into your Google Drive, do the followings:
- Click on +New icon in the upper left corner and then select File upload option
- Navigate to the file path and double click it to start uploading
- You can also drag and drop the zip file into the main website page to upload it.
- To all others viewing or downloading the file, hover on the file name and then click on the Share icon, and then change the General Access of the file from “Restricted” to “Anyone with the link” option and click Done to save changes. After that, copy the link and share it to anyone you want to share with.
VIDEO:
For more details about how to enable crash debugging mode, and how to view or share the memory.dmp file to get online support, watch the following video to see everything step by step:
Please follow and like us:
Readers help support Windows Report. We may get a commission if you buy through our links.
Read our disclosure page to find out how can you help Windows Report sustain the editorial team. Read more
The BSoD or Blue Screen of Death error is not a fun error to come across on Windows 11. It is accompanied by an endless loading circle, loud noises, and nothing else. If you are experiencing a BSoD error, you can check out our guide and get rid of it pretty quickly.
Troubleshooting such errors requires you to know the root cause of such issues, and thankfully in Windows 11, you can configure your PC to create Windows 11 BSoD dump file for easy diagnosis.
What is a BSoD dump file in Windows 11?
In simple terms, the BSoD dump file is a log file of your PC’s memory at the time it experienced the BSoD error.
This crash file contains information about what exactly was in your computer’s memory before it crashed and could help you locate the possible reason that caused the error in the first place.
There are basically three types of memory dump files:
- Complete memory dump – It contains all the information of your PC’s physical memory at the time it crashed. A complete memory dump is the most ideal dump file for troubleshooting errors.
- Automatic memory dump – By default, your Windows 11 PC is set to Automatic memory dump, which contains basic information such as loaded drivers, kernel info, and processes.
- Small memory dump: Small memory dumps or minidump contains the kernel stack information for the thread that caused the particular crash.
How can I find the Windows 11 BSoD dump file?
- In your homescreen, right-click on This PC and select Properties.
- Under Related links, select Advanced system settings.

- Click on Settings under the Startup and Recovery section.

- If under Write debugging information is selected as Automatic memory dump, then you need to select Complete memory dump for the dump file that contains all information for troubleshooting.

- The memory dump file is typically located in %SystemRoot%\MEMORY.DMP with system root is typically C:\Windows.
- You can locate the Small memory dump or Minidump file in %SystemRoot%\Minidump location.


How can I read the Memory.DMP file in Windows 11?
- Visit the official Microsoft WinDbg download page.
- Hit the Get in Store app button.

- Click on the Open Microsoft Store button in the dialogue box that appears.

- Click the Get button.

- Once the installation is complete, click on Open.
- Click on File.

- Select Start debugging and then click on Open Dump file.
- Locate the dump file in the folder %SystemRoot%\MEMORY.DMP which is usually found in the C Drive.
- Click Open.
- Do note that opening the dump file may take some time. So, you need to wait.
- In the run command, type the below and press Enter:
!analyze -v
- The process will start and you can keep an eye on the progress bar to know when the process will be complete.
- After completion, the WinDbg will show you the results, and based on that you can take further troubleshooting steps.


You can review the dump file, and as you go through it, you will also find more information. Notably, the FAILURE_BUCKET_ID and MODULE_NAME are the ones where you need to keep an eye out, which could indicate what is causing the problem.
While this report can be overwhelming for regular users, as it is not meant for them, you can always take cues from the report or search the hints mentioned in the report and search it over the internet to get help online.
- How to Fix the ERROR_OPLOCK_HANDLE_CLOSED?
- ERROR_CORRUPT_LOG_CORRUPTED: How to Fix BSoD Error
How to delete system error dump files in Windows 11?
Use Windows Settings
- Press the Win + I buttons to open Settings.
- Click on System then select Storage.

- Click on Temporary files.

- Check the box for the System error memory dump files option.
- Hit the Remove files button.


Use Disk Cleanup
- Press the Windows button to open the Start menu.
- Search for Disk Cleanup and open it.

- Select the drive where the system dump file is located and press OK.
- Click the Clean up system files option.

- Check the box for System error memory dump files.
- Hit the OK button.


Use Command Prompt
- Press Windows button to open the Start menu.
- Search for Command Prompt and click on Run as administrator option.

- Type the below command and press Enter:
del /f /s /q %systemroot%\memory.dmp


If you are coming across BSoD error, and want to fix it without going through the fuss of manually doing it, then you can check out our guide that lists some of the best BSoD fixers for Windows 11.
Moreover, before going ahead and fixing the problem, it is very important to know the root cause of it. If you want some behind-the-scenes knowledge on what causes BSoD error, then you can check out this article including the main BSoD causes.
That is it from us in this guide. Let us know in the comments below if you were able to locate the system crash memory dump file on your Windows 11 PC.
Sagar Naresh
Sagar is a web developer and technology journalist. Currently associated with WindowsReport and SamMobile. When not writing, he is either at the gym sweating it out or playing country music on his guitar.
He is an avid traveler and has been to 15 countries, going to more places soon. TRAVEL and WORK is his mantra for a peaceful life.