
Reading time6 min
Views15K
If the hard disk is unstable or you have doubts as to its operability, it’s worth using Windows 10 tools to check on its SMART data and find out if it’s dying soon.
Introduction
In addition to checking the operating system regularly and fixing logical errors and other problems, Windows 10 users are recommended to run diagnostics for hard disk drives (HDD) or solid-state drives (SSD) from time to time for monitoring purposes, so that they can always know if the storage devices are healthy and can avoid unexpected hardware failures that may result in a sudden loss of data.
The only limitation to the process is that Windows 10 doesn’t have a feature that would monitor the status of hardware without the user’s participation. However, we can still use such preinstalled tools as Command Prompt, Windows PowerShell and Performance Monitor to access the information based on the self-monitoring, analysis and reporting technology (SMART) that is available in most storage devices, and always know if the hard disk is healthy or not, ready for work or suffering from hardware problems.
If the SMART data says the disk is about to fail soon, you will have a chance to look for a replacement and copy your data to the new disk before it’s too late.
Today’s tutorial will show you how to use built-in Windows 10 diagnostics and prediction features to advantage, and you will also learn a few quick methods to check the SMART readings and find out if your hard disk is healthy or nearing its doomsday.
An important note. Though most hard disks support the SMART technology, some models can’t fully benefit from that if you use the instructions we give here (SMART is a part of the ATA protocol, while USB flash drives are based on the SCSI protocol and don’t have this function).
How to detect a potential hard disk issue with the Command Prompt
With the command prompt console, you have at least two ways to check the SMART data and see if there are any hardware issues with your hard disks.
Get to know the disk status
To check the SMART status of a hard disk quickly with the Command Prompt using Windows Management Instrumentation (WMIC for short), follow these steps.
Open the Command Prompt with administrator rights in any way you know. For example, click on the Start button in the lower left corner of your desktop, on the Taskbar and open the main Windows menu. Use the scroll bar or the mouse wheel to navigate the list of all applications installed on this computer, find and open the section Windows System. Under this title, find and right-click on the line Command Prompt. In the context menu that appears, click on More; a new context menu appears, and the option Run as administrator is what you need.
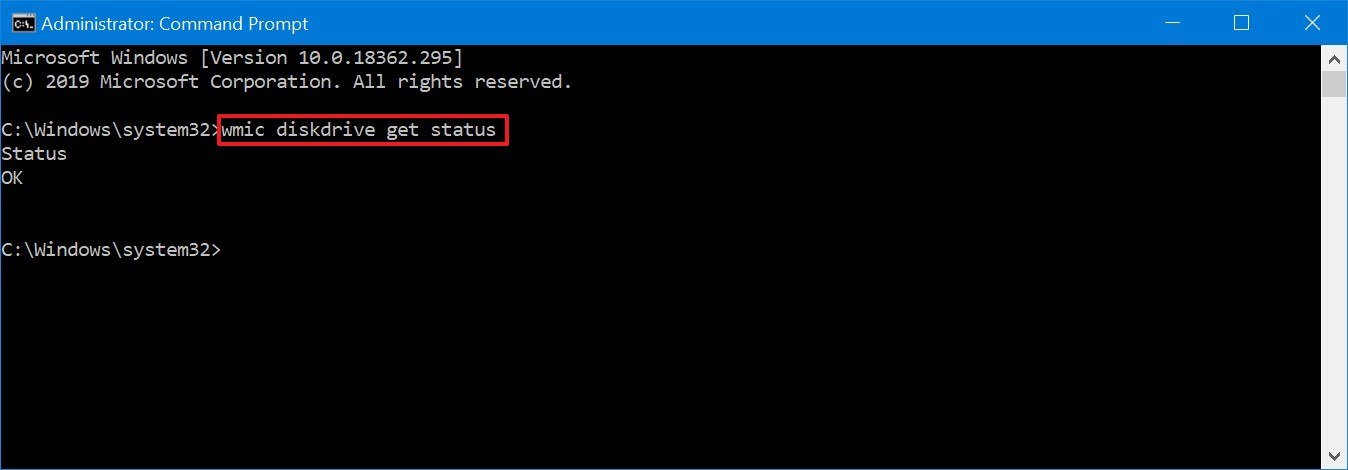
In the Command Prompt window, type the following command for the operating system to check if the hard disk is having any issues, and press Enter on the keyboard to run the command (remember there must be no quotation marks):
wmic diskdrive get status
Windows 10 will analyze the disk data and display the result in the Status column; in my case, all the storage devices are healthy.
A bit of explanation. When every drive status is displayed as ОК, you can be sure that all storage devices are healthy and work properly. On the contrary, if there is any other status displayed (for example, bad, unknown or caution) it means there’s a potential problem or disk error, or the command has difficulty receiving information from the disk, which also suggests some sort of trouble.
Predict future disk errors
Here are the steps to take if you want to know the chances for possible failure of your storage device or to learn how healthy the disk is from the viewpoint of the operating system.
Just as before, you need to open the Command Prompt with administrator rights. Click the Search button fashioned like a magnifying glass on the Taskbar (you can find it in the lower left corner of the screen) to open the search panel. Type Command Prompt in the corresponding field. The system will run the search and the Best match section will show you the result you were looking for. Right-click on it and select Run as administrator from the context menu. Otherwise, click on the corresponding button in the right-side menu of the search panel, and the application will be launched.
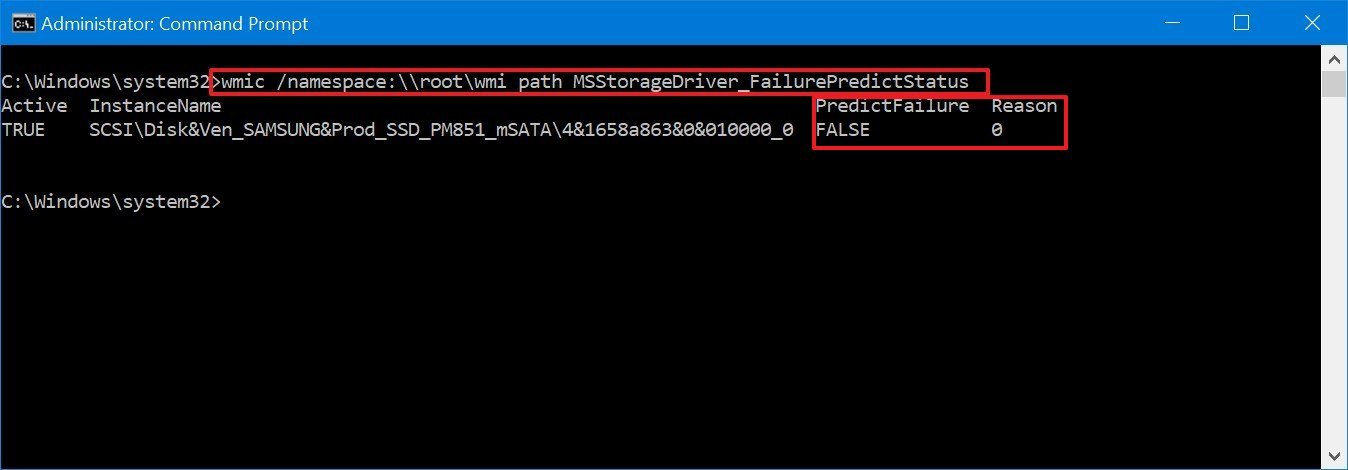
Type the following command to read the SMART status data for the hard disks, and press the Enter key to run it (make sure there are no quotation marks):
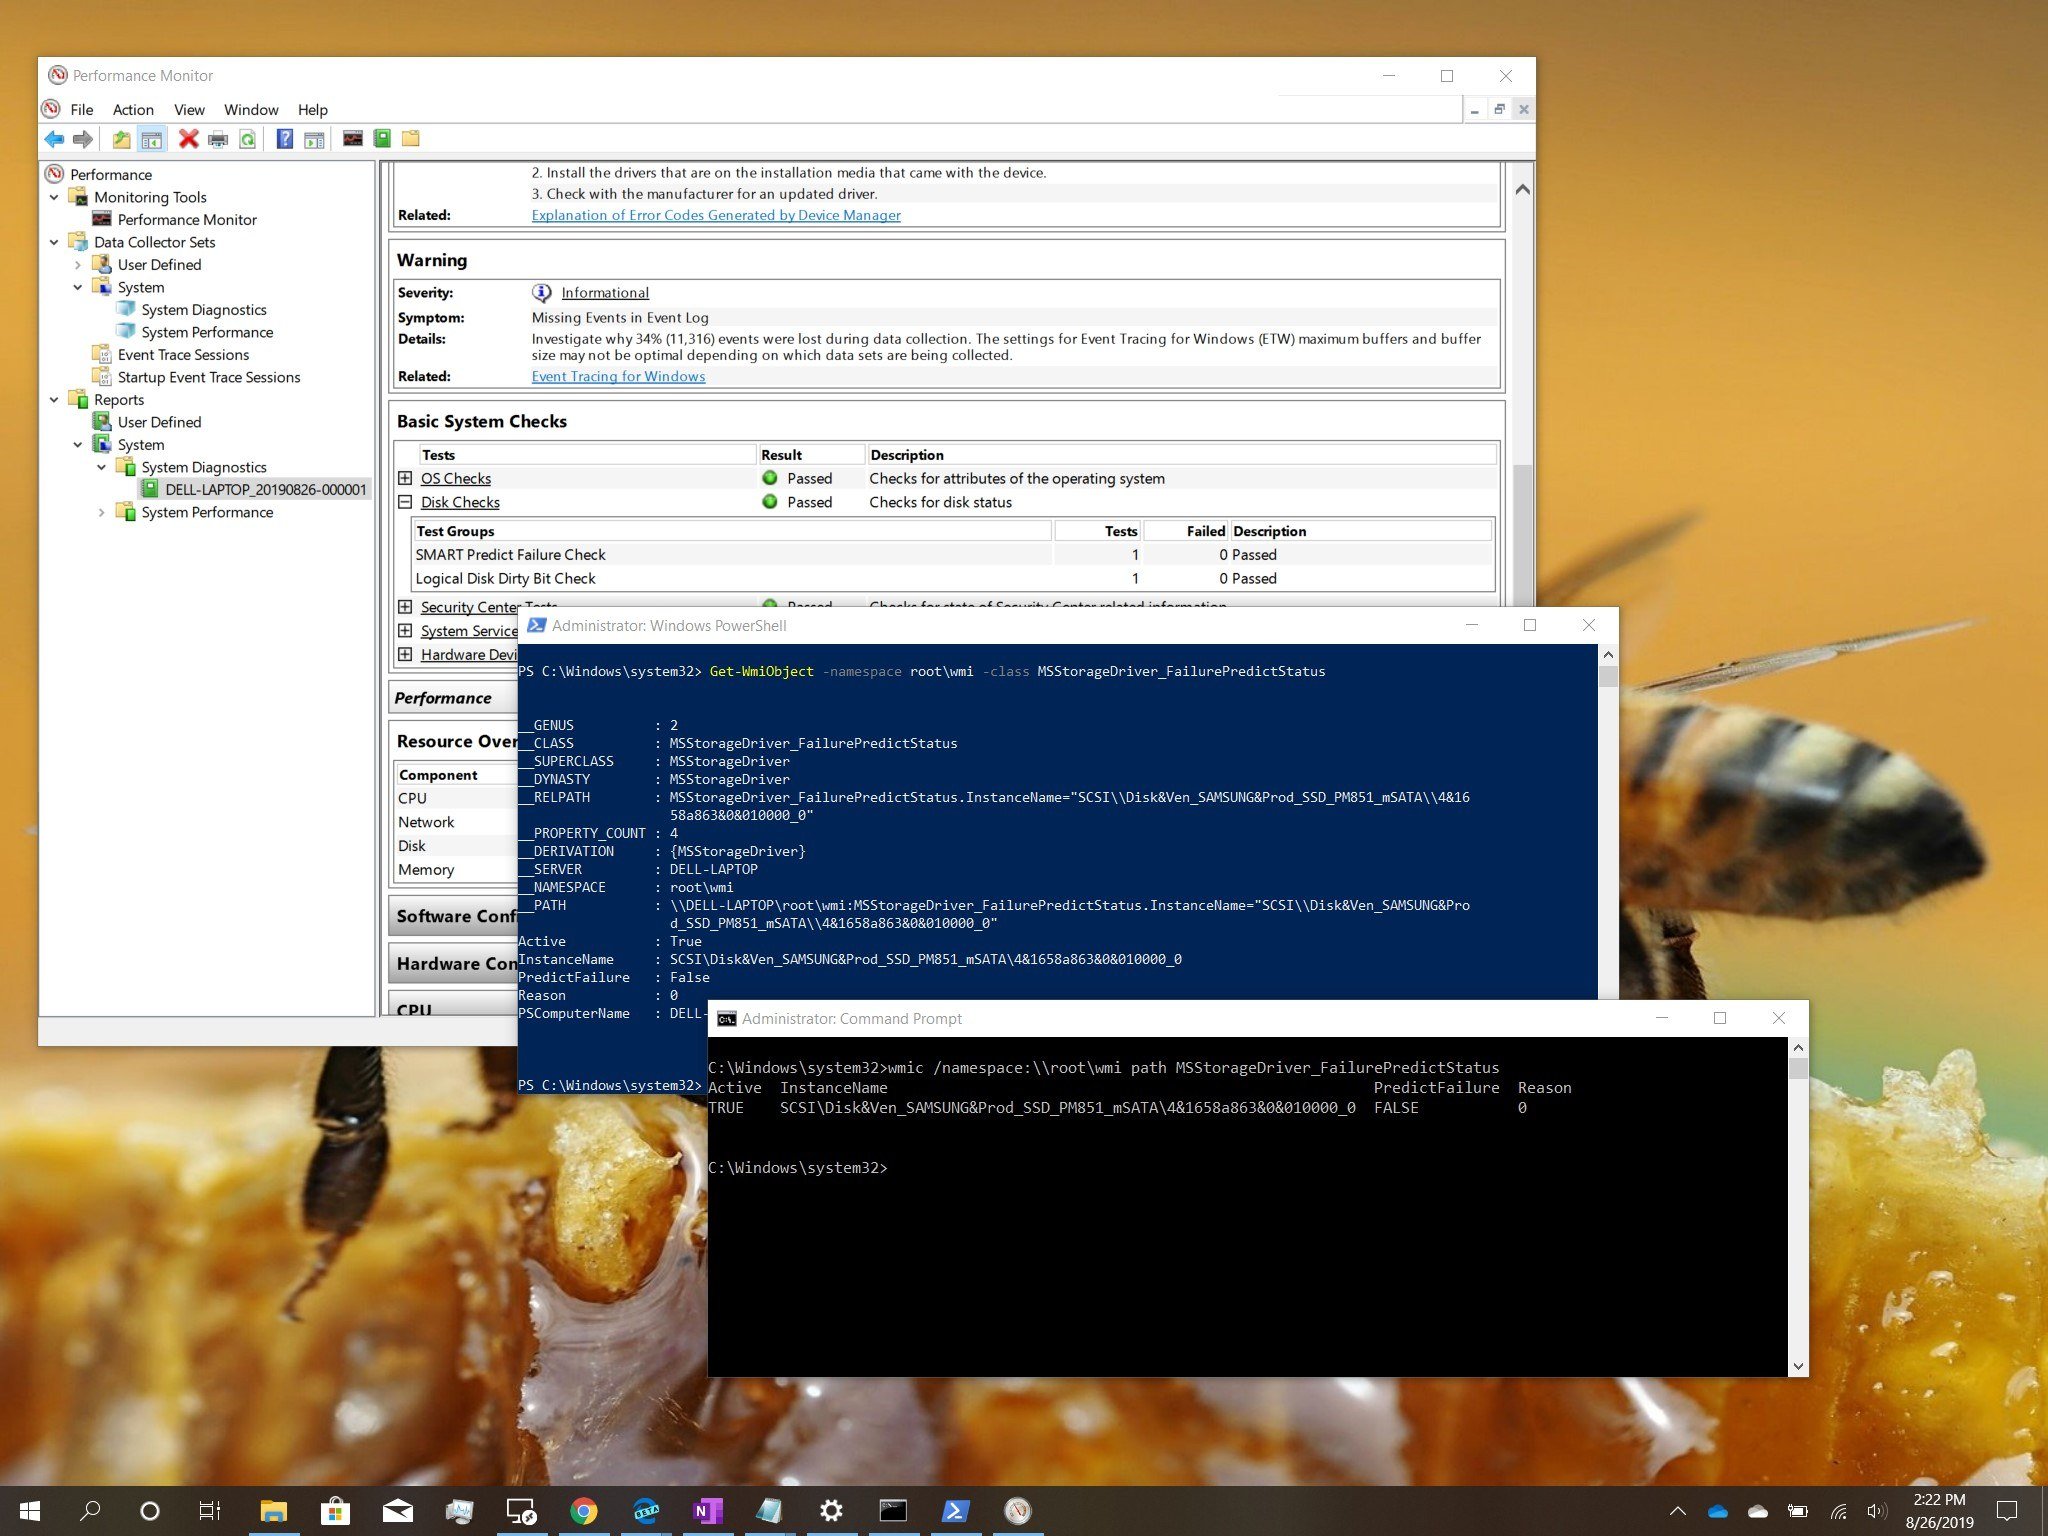
wmic /namespace:\\root\wmi path MSStorageDriver_FailurePredictStatus
When the command is processed, you can see the result in the PredictFailure column. If the status is FALSE, then your hard disk is healthy and works correctly.
If the status is TRUE, it’s time to have a closer look at such hard disk because it means the SMART readings predict a failure soon. The Reason column may show a digit other than zero. If that’s the case, you should contact the hard disk manufacturer to explain the meaning of the code, as the actual meaning of this value differs depending on the manufacturer.
How to determine a possible hard disk failure with Windows PowerShell
Similarly to the Command Prompt, you can use another tool by Microsoft – Windows PowerShell – for the same purpose, to check your computer’s hardware and SMART reports. Step by step, here is what you should do to test your hard disk for possible issues.
There are several ways to open the Windows PowerShell app. The quickest one is to open the Power user menu. For example, right-click on the Start button that you can find on the Taskbar, in the left lower corner of the desktop, or press the keyboard shortcut Windows + X instead to open the context menu, and select the line Windows PowerShell (admin).
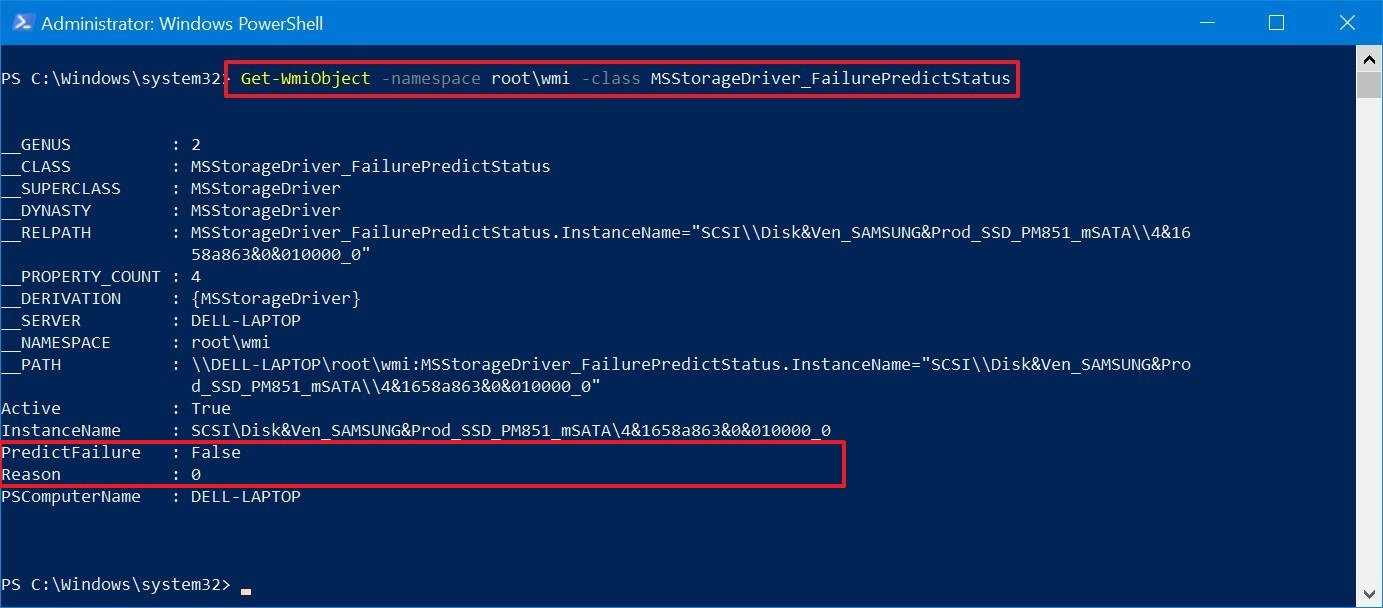
In the new window that opens, type (or paste) the following command to see if the hard disk is prone to failure, and press the Enter key (remember there should be no quotation marks):
Get-WmiObject -namespace root\wmi –class
SStorageDriver_FailurePredictStatus
View the report, and pay special attention to the line PredictFailure. If it says FALSE, your hard disk is fine and there is no reason to worry about possible failures yet.
n the contrary, if you see TRUE in the line PredictFailure, it means that the SMART data is bad enough to expect a failure anytime. Similarly to the case with the Command Prompt, if the field Reason contains a value other than zero, you should ask the manufacturer for explanation, as the meaning of this code may differ depending on the actual manufacturer of the hard disk you are using.
If you see that the hard disk has a problem or a failure should be expected anytime, the best solution would be to start looking for a new storage device to replace the faulty one. Whatever happens, today online stores offer a wide range of hard disks to choose from according to your preferences, so you can always find a model with the required performance rate, capacity and read/write speed at an affordable price.
How to analyze disk performance and health with Performance Monitor
Besides the two methods based on using the Command Prompt and Windows PowerShell apps that we have just described, there is one more tool to help you check the SMART data and detect hardware disk errors – Performance Monitor.
Here is what you do to see if your hard disk is about to fail with Performance Monitor.
First of all, the application can be started in one of the several ways. For example, click on the Start button in the lower left corner of your desktop, on the Taskbar, and open the search panel. Type Performance Monitor in the search field, and you will see the result under Best match. Click on it or on the Open button in the right panel, and the Performance Monitor app will be launched.
In the left-side panel, click on the right arrow sign in the line Data collector sets to display the nested elements.
As the new list unfolds, click on the right arrow again to open the nested options in the line System.
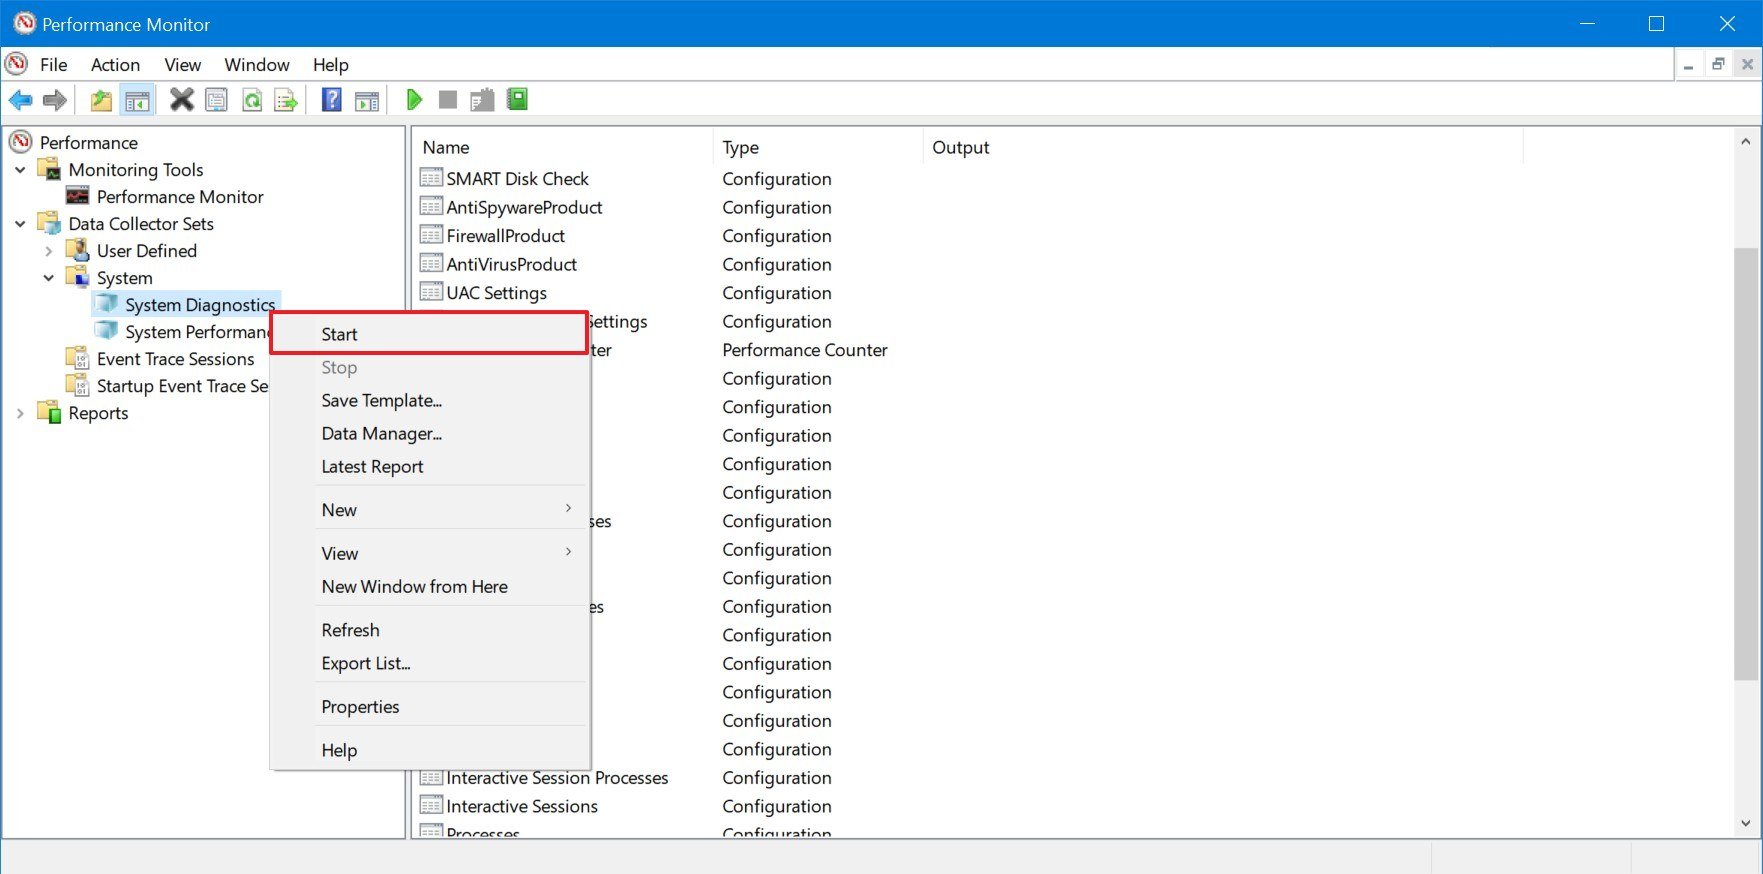
Now jump to System Diagnostics and right-click on it to bring out the context menu, then select Start.
Go down and click on the right arrow in the line Reports.
When another list unfolds, find the line System and open its contents by clicking on the right arrow.
One more time, click on the right arrow in the line System Diagnostics to see what’s inside.
Finally, click on the report the title of which contains your computer’s name. (You may have to wait a little while the operating system runs the diagnostics).
In the right panel of the Performance Monitor window you will see a detailed report. Find and open the section Warnings, then go to Basic System Checks and in the Tests column, click on the Plus (+) button next to Disk Checks, to see the hidden table containing test results.
In the table, find the line SMART Predict Failure Check. If the Failed column for this line contains zero, and the column Description next to it says Passed, then the hard disk has no issues for you to worry about.
By following the steps we have described, you can quickly find out if the hard disk in question is healthy, or should you expect it to fail at any moment.
If the SMART readings say failure is possible, and you can still access the faulty disk, the best solution would be to back up the important information from that disk so that you can prevent data loss. You can always copy important files to another disk which is healthy, or use the backup feature integrated into Windows 10.
Conclusion
To protect your data against unexpected loss you should check your hard disks regularly, especially if there are symptoms suggesting they are no longer as healthy as they used to be. Windows 10 operating system features several preinstalled tools that can determine how healthy your storage devices are and predict if it is going to fail in the nearest future. The methods we have described in this article are simple enough even for a novice user to take advantage of, and they will certainly help you save your files from a faulty hard disk and avoid loss of important data.
See the full article with all additional video tutorials.
Updated on Apr 28, 2025
This article will show you how quickly and easily check the SMART status of Windows 10 to see if your hard drive is still reliable or on the verge of hardware failure.
What does SMART status mean? Automatic hard drive failure detection is made possible by the Self-Monitoring, Analysis, and Reporting Technology (SMART). The system is designed to alert you to any issues it finds. Checking SMART status regularly has a lot of benefits, such as:
- Discover and report on various reliability indicators to anticipate impending hardware failures.
- Alerts users of potential impending drive failure so that steps can be taken to avoid data loss and replace failed drives to preserve data integrity.
Therefore, it is crucial to check your SMART status regularly. However, how to check the SMART status of your hard drive? Continue to read the next part.
How to Check SMART Status on Windows 10 — 2 Ways
There are two techniques to check the SMART status in Windows 10, as given below:
Way 1. Check SMART Status on Windows 10 via EaseUS Partition Master — Easy
Way 2. Check SMART Status on Windows 10 via CMD — Difficult
When comparing options to CHKDSK commands, EaseUS Partition Master stands out as a reliable substitute. Let’s go through each of the ways in detail.
Way 1. Check SMART Status on Windows 10 via EaseUS Partition Master
The total number of host writes and reads and the number of powered-on hours can be displayed, along with other disk-related metrics. EaseUS Partition Master works with Windows 10, 8.1, 8, 7, XP, and Vista, among others. You may now download this tool and determine if your SSD/hard drive is in good working order in just two easy clicks.
Step 1. Launch EaseUS Partition Master and click the blue arrow to activate the «Disk Health» feature under the «Discovery» section.
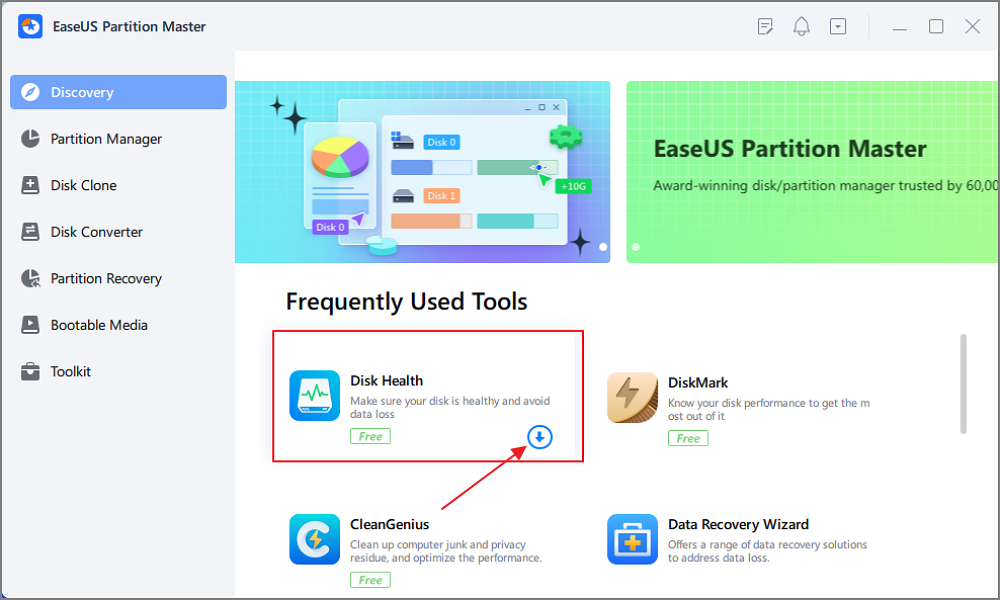
Step 2. Select the target disk and click the «Refresh» button. Then, you can see the health condition of your disk.
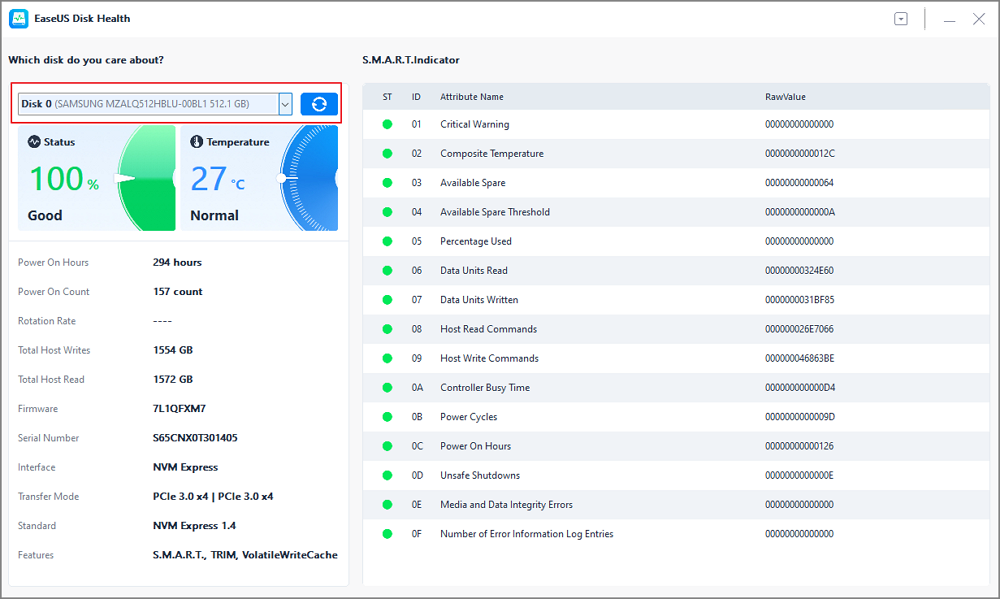
A clear indication of whether or not your SSD/HDD is in good shape is a powerful tool in the fight against SSD failure. Many more capabilities are available in EaseUS Partition Master, and we will explore those today.
EaseUS Partition Master key features:
- Check if disk is healthy
- Run SD card speed test
- Check SSD health Windows 10
- Speed up hard drive and computer
- Check hard drive health on Windows 7
- Resize/create/delete/move partitions
- Check SSD temperature on Windows 10
EaseUS Partition Master has many valuable features for SSD management. Download it and give it a shot.
Way 2. Check SMART Status on Windows 10 via CMD
Follow these procedures to quickly determine SMART status using the Windows Management Instrumentation Command Prompt (WMIC) tool:
Step 1. Open Start.
Step 2. Type cmd in the search box, right-click the Command Prompt, and select «Run as administrator.»
Step 3. To verify whether your hard drive is failing, type the following commands and press Enter:
- wmic
- diskdrive get status
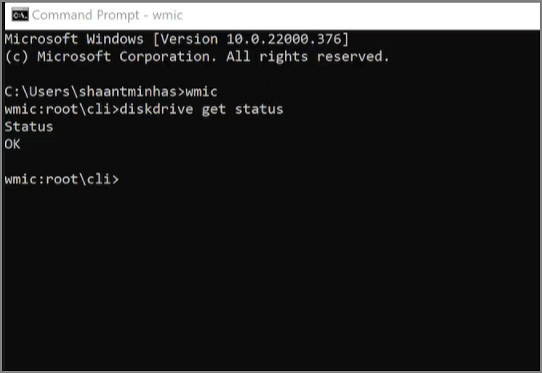
Step 4. Under the «Status» column, confirm that the result is OK.
- Notice:
- If the result of your efforts is an «OK» message, then you’re good to go. The hard disc is about to fail physically, or the command is having trouble asking the status from the drive’s firmware if the status returns «bad,» «unknown,» or «caution.»
View the video to learn more information and solutions to check your hard drive health:

By the way, you may also like:
Conclusion
In this article, we have discussed how easily you can check the smart status on Windows 10 in two simple ways. In Windows 10, it is crucial to check the SMART status regularly to ensure your data integrity, privacy, and games. While EaseUS Partition Master’s competition, Command Prompt, can do a simple health check, EaseUS Partition Master is still the superior choice due to its intuitive UI and robust extra capabilities.
Check SMART Status on Windows 10 FAQs
To keep our device secure, we must perform regular disc checks. Here are some more concerns about using CMD to examine the state of an SSD in Windows 10.
1. How do I check my SMART hard drive status in Windows 10?
- Open Start
- To launch Command Prompt as an administrator, enter its name into the search bar and then right-click the first result.
- To check if the hard drive fails, type wmic diskdrive, get status, and hit Enter.
2. What is a SMART status check?
SMART means Self-Monitoring, Analysis, and Reporting Technology. It was developed to monitor and detect indicators of a failing hard disc autonomously.
3. What is SMART status in BIOS?
The SMART protocol acts as a bridge between the platform BIOS and the hard drive. When the SMART feature is enabled in the BIOS (the norm), the system can analyze data sent by the storage device and decide whether to issue a warning about impending failure.
On Windows 10, in addition to frequently checking and repairing logical errors and other problems on a drive with our DISM command tool guide, it’s also wise to periodically check whether that rotating platter hard-disk drive (HDD) or Solid-State Drive (SSD) is still physically reliable to prevent sudden hardware failure, which can ultimately cause data loss.
The only caveat is that Windows 10 doesn’t include a mechanism to determine the status of the hardware on its own. However, you can use tools like Command Prompt, PowerShell, and Performance Monitor to access information from the Self-Monitoring, Analysis and Reporting Technology (SMART) built into most drives to determine if the device is still physically healthy or failing due to hardware issues.
In the event that SMART reports an imminent failure, you can quickly order a replacement and migrate the data before the hard drive fails completely.
In this Windows 10 guide, we walk you through multiple methods to quickly check SMART to determine whether the hard drive is still reliable or on the brink of hardware failure without having to use third-party tools.
- How to find out if a drive is failing using Command Prompt
- How to find out if a drive is failing using PowerShell
- How to find out if a drive is failing using Performance Monitor
Important: Although most drives include support for SMART, depending on the make and model, the health status may not be available using the instructions mentioned below.
How to find out if a drive is failing using Command Prompt
Using Command Prompt, there are a least two ways to check the SMART status to determine if any hard drives are having hardware problems.
Determining drive status
To quickly check the SMART status with the Windows Management Instrumentation Command-line (WMIC) utility, use these steps:
All the latest news, reviews, and guides for Windows and Xbox diehards.
- Open Start.
- Search for Command Prompt, right-click the top result, and select the Run as administrator option.
- Type the following command to determine if the hard drive is failing and press Enter:
wmic diskdrive get status
- Under the «Status» column, confirm that the result is OK.Quick note: You’ll see an OK status for each internal drive installed on your device.
Once you complete the steps, if the status reads OK, everything is working as expected. If the status reads «bad,» «unknown,» or «caution,» it’s likely that the hard drive has an imminent hardware failure, or the command is having problems querying the status from the firmware of the drive.
Determining drive predictive failure
To check the prediction failure status to determine if the hard drive is starting to fail, use these steps:
- Open Start.
- Search for Command Prompt, right-click the top result, and select the Run as administrator option.
- Type the following command to determine if the hard drive is failing and press Enter:
wmic /namespace:\\root\wmi path MSStorageDriver_FailurePredictStatus
- Confirm the PredictFailure value. If the status appears as FALSE, then the hard drive is working without issues.
After completing these steps, if you received a True value for «PredictFailure,» it means that SMART is predicting hard drive failure. The Reason column may also return a value greater than 0. If this is the case, you may need to contact your manufacturer to understand the code as the value may have a different meaning depending on the vendor.
How to find out if a drive is failing using PowerShell
Similar to Command Prompt, you can use PowerShell to check the SMART hardware reports with these steps:
- Open Start.
- Search for PowerShell, right-click the top result, and select the Run as administrator option.
- Type the following command to determine if the hard drive is failing and press Enter:
Get-WmiObject -namespace root\wmi –class MSStorageDriver_FailurePredictStatus
- Confirm the PredictFailure values. If the value appears as FALSE, the hard drive is working without issues.
Once you complete these steps, if you received a True value for «PredictFailure,» it means SMART is predicting hard drive failure. Also, similar to Command Prompt, if the Reason field returns a value greater than 0, you may need to contact your manufacturer to understand the code as the value may have a different meaning depending on the vendor.
If you have a failing drive, you should consider buying a replacement immediately. If you’re looking for a fast and reliable hard drive, we recommend the Samsung 860 EVO, which offers excellent performance for an affordable price. (You can check other alternatives in this guide.)

Reliable replacement
Samsung 860 EVO
The Samsung 860 EVO is one of the most popular solid-state drive (SSD) because of reliability and value. Also, it offers great performance with up to 550MB/s read and 520MB/s write speeds, and every drive is backed with a five-year warranty.
How to find out if a drive is failing using Performance Monitor
Alternatively, you can also use the Performance Monitor app to check the SMART information to determine hardware problems with the hard drives.
To check hard drive failure status using a graphical interface, use these steps:
- Open Start.
- Search for Performance Monitor and click the top result to open the app.
- Expand the Data Collector Sets branch.
- Expand the System sub-branch.
- Right-click the System Diagnostics item, and select the Start option.
- Expand the Reports branch.
- Expand the System sub-branch.
- Expand the System Diagnostics sub-branch.
- Select the diagnostic report. (Allow some time for the system to perform the diagnostic.)
- Under the «Warnings» section, click the plus (+) button next to Disk Checks.
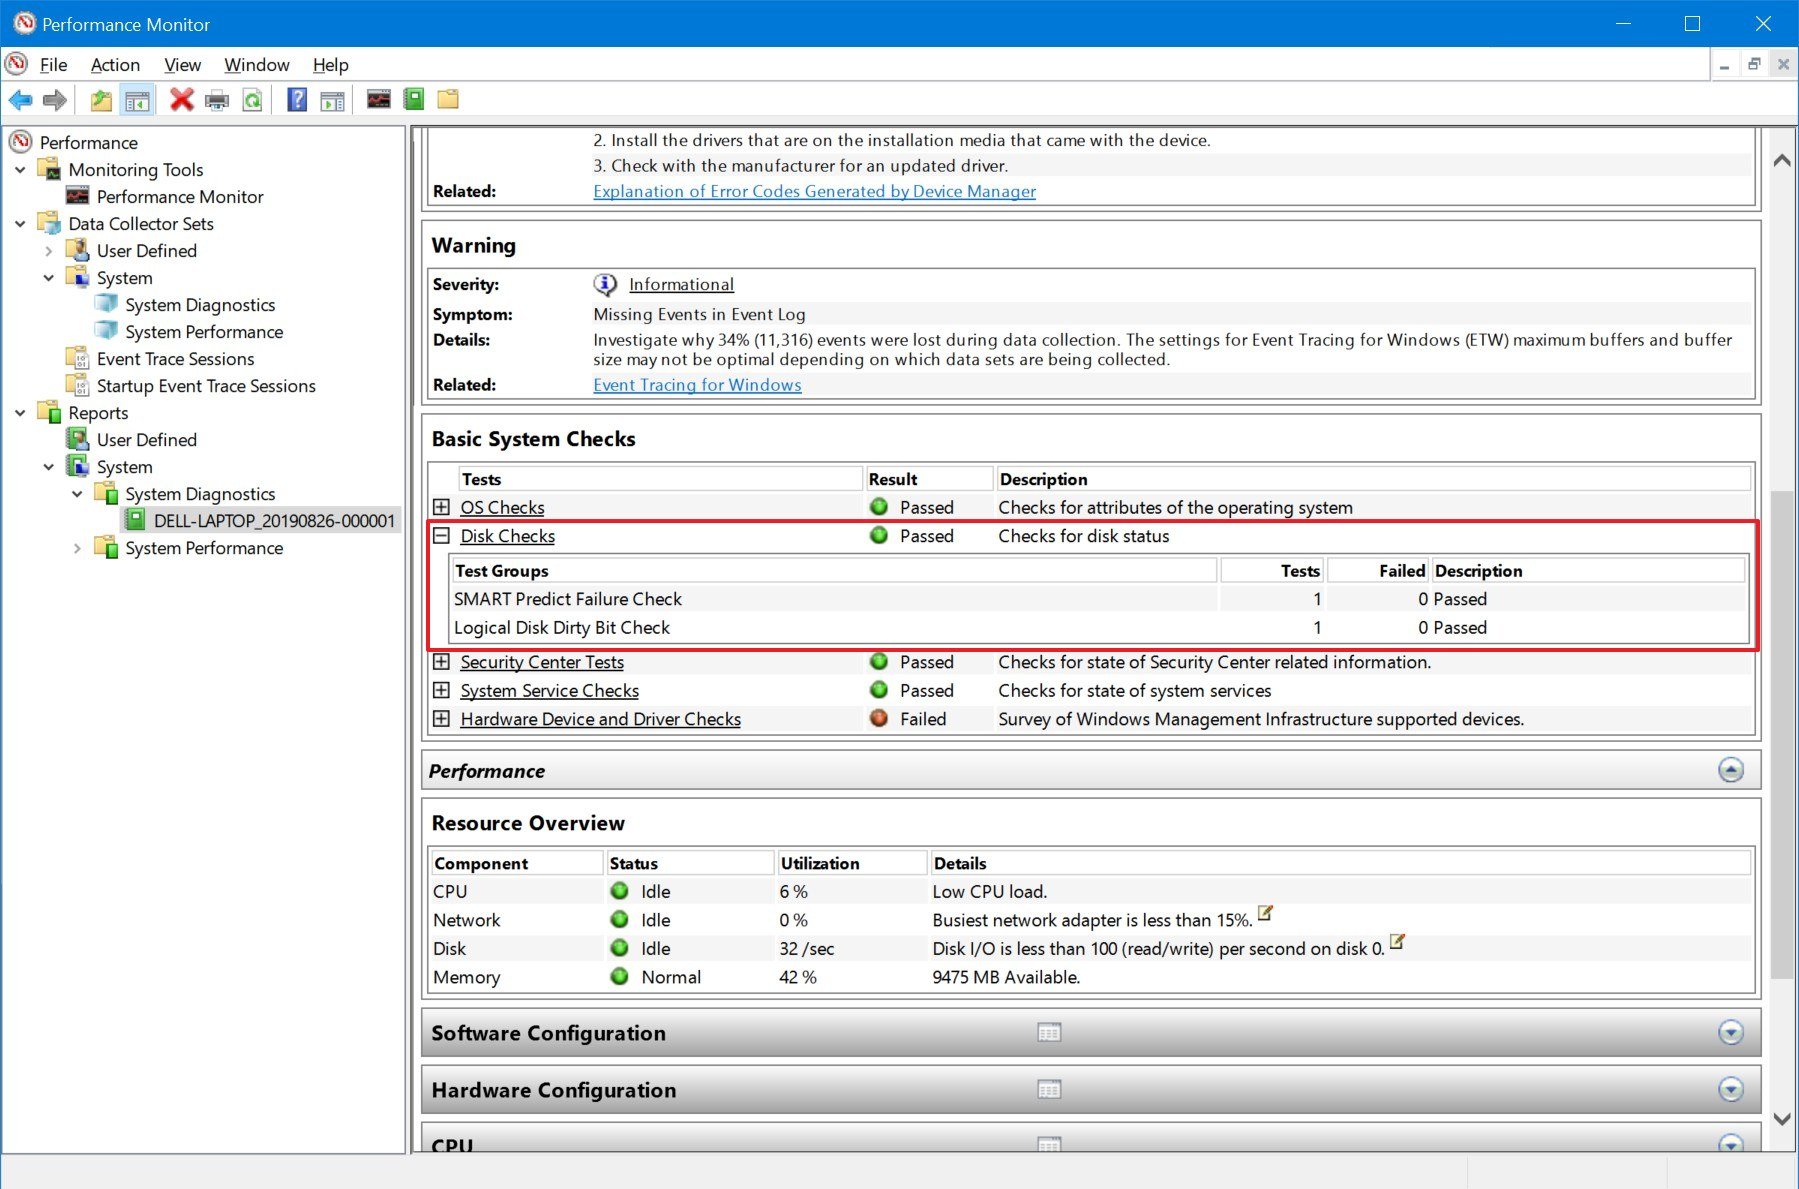
- Confirm the «SMART Predict Failure Check» values. If «Failed» has a value of 0 and «Description» is set to Passed, then the hard drive is working without issues.
After you complete these steps, you’ll be able to find out if the hard drive on your computer is healthy or likely to fail at any time.
If SMART reports a failure, and you’re still able to access the drive, it’s best to back up the drive immediately to minimize any data loss. You can always copy the files to another drive or use the built-in backup tool available in Windows 10.
Mauro Huculak has been a Windows How-To Expert contributor for WindowsCentral.com for nearly a decade and has over 15 years of experience writing comprehensive guides. He also has an IT background and has achieved different professional certifications from Microsoft, Cisco, VMware, and CompTIA. He has been recognized as a Microsoft MVP for many years.
Its primary function is to detect and report various indicators of drive reliability to anticipate imminent hardware failures. In this post, we will show you how to check the SMART Failure Predict Status of drives in Command Prompt, PowerShell, and Performance Monitor.
You must be signed in as an administrator to use this option.
If a hard drive (HDD) is turned off after being idle, it will not appear in this report. Only drives currently turned on and running will appear in this report.
1] To check SMART Failure Predict Status of Drives in Command Prompt, do the following:
2] To check SMART Failure Predict Status of Drives in PowerShell, do the following:
3] To check SMART Failure Predict Status of Drives in Performance Monitor, do the following:
This report will now start collecting data for 60 seconds. The report may take up to an additional 60 seconds to generate.
If SMART Predict Failure Check shows FALSE with a value of 0 and Description shows as Passed, then no issues were found with the drive.
If SMART Predict Failure Check shows FALSE with a value other than 0, then look up the number for the ID in the table below for what it means.
Known ATA S.M.A.R.T. attributes (ID codes):
Drives do not support all attribute codes (ID). Some codes are specific to drive types (magnetic platter, flash, SSD). Drives may use different codes for the same parameter.
If a drive is reported to have a critical status, it is recommended to back up and replace it immediately.
| ID | Attribute name | Description |
|---|---|---|
| 0 | No issues found. | |
| 01 0x01 |
Read Error Rate | (Vendor specific raw value.) Stores data related to the rate of hardware read errors that occurred when reading data from a disk surface. The raw value has different structure for different vendors and is often not meaningful as a decimal number. |
| 02 0x02 |
Throughput Performance | Overall (general) throughput performance of a hard disk drive. If the value of this attribute is decreasing there is a high probability that there is a problem with the disk. |
| 03 0x03 |
Spin-Up Time | Average time of spindle spin up (from zero RPM to fully operational [milliseconds]). |
| 04 0x04 |
Start/Stop Count | A tally of spindle start/stop cycles. The spindle turns on, and hence the count is increased, both when the hard disk is turned on after having before been turned entirely off (disconnected from power source) and when the hard disk returns from having previously been put to sleep mode. |
| 05 0x05 |
Reallocated Sectors Count | Count of reallocated sectors. The raw value represents a count of the bad sectors that have been found and remapped. Thus, the higher the attribute value, the more sectors the drive has had to reallocate. This value is primarily used as a metric of the life expectancy of the drive; a drive which has had any reallocations at all is significantly more likely to fail in the immediate months. |
| 06 0x06 |
Read Channel Margin | Margin of a channel while reading data. The function of this attribute is not specified. |
| 07 0x07 |
Seek Error Rate | (Vendor specific raw value.) Rate of seek errors of the magnetic heads. If there is a partial failure in the mechanical positioning system, then seek errors will arise. Such a failure may be due to numerous factors, such as damage to a servo, or thermal widening of the hard disk. The raw value has different structure for different vendors and is often not meaningful as a decimal number. |
| 08 0x08 |
Seek Time Performance | Average performance of seek operations of the magnetic heads. If this attribute is decreasing, it is a sign of problems in the mechanical subsystem. |
| 09 0x09 |
Power-On Hours | Count of hours in power-on state. The raw value of this attribute shows total count of hours (or minutes, or seconds, depending on manufacturer) in power-on state. “By default, the total expected lifetime of a hard disk in perfect condition is defined as 5 years (running every day and night on all days). This is equal to 1825 days in 24/7 mode or 43800 hours.” On some pre-2005 drives, this raw value may advance erratically and/or “wrap around” (reset to zero periodically). |
| 10 0x0A |
Spin Retry Count | Count of retry of spin start attempts. This attribute stores a total count of the spin start attempts to reach the fully operational speed (under the condition that the first attempt was unsuccessful). An increase of this attribute value is a sign of problems in the hard disk mechanical subsystem. |
| 11 0x0B |
Recalibration Retries or Calibration Retry Count | This attribute indicates the count that recalibration was requested (under the condition that the first attempt was unsuccessful). An increase of this attribute value is a sign of problems in the hard disk mechanical subsystem. |
| 12 0x0C |
Power Cycle Count | This attribute indicates the count of full hard disk power on/off cycles. |
| 13 0x0D |
Soft Read Error Rate | Uncorrected read errors reported to the operating system. |
| 22 0x16 |
Current Helium Level | Specific to He8 drives from HGST. This value measures the helium inside of the drive specific to this manufacturer. It is a pre-fail attribute that trips once the drive detects that the internal environment is out of specification. |
| 170 0xAA |
Available Reserved Space | See attribute E8. |
| 171 0xAB |
SSD Program Fail Count | (Kingston) The total number of flash program operation failures since the drive was deployed. Identical to attribute 181. |
| 172 0xAC |
SSD Erase Fail Count | (Kingston) Counts the number of flash erase failures. This attribute returns the total number of Flash erase operation failures since the drive was deployed. This attribute is identical to attribute 182. |
| 173 0xAD |
SSD Wear Leveling Count | Counts the maximum worst erase count on any block. |
| 174 0xAE |
Unexpected Power Loss Count | Also known as “Power-off Retract Count” per conventional HDD terminology. Raw value reports the number of unclean shutdowns, cumulative over the life of an SSD, where an “unclean shutdown” is the removal of power without STANDBY IMMEDIATE as the last command (regardless of PLI activity using capacitor power). Normalized value is always 100. |
| 175 0xAF |
Power Loss Protection Failure | Last test result as microseconds to discharge cap, saturated at its maximum value. Also logs minutes since last test and lifetime number of tests. Raw value contains the following data:
Normalized value is set to one on test failure or 11 if the capacitor has been tested in an excessive temperature condition, otherwise 100. |
| 176 0xB0 |
Erase Fail Count | S.M.A.R.T. parameter indicates a number of flash erase command failures. |
| 177 0xB1 |
Wear Range Delta | Delta between most-worn and least-worn Flash blocks. It describes how good/bad the wearleveling of the SSD works on a more technical way. |
| 179 0xB3 |
Used Reserved Block Count Total | “Pre-Fail” attribute used at least in Samsung devices. |
| 180 0xB4 |
Unused Reserved Block Count Total | “Pre-Fail” attribute used at least in HP devices. |
| 181 0xB5 |
Program Fail Count Total or Non-4K Aligned Access Count | Total number of Flash program operation failures since the drive was deployed. Number of user data accesses (both reads and writes) where LBAs are not 4 KiB aligned (LBA % 8 != 0) or where size is not modulus 4 KiB (block count != 8), assuming logical block size (LBS) = 512 B. |
| 182 0xB6 |
Erase Fail Count | “Pre-Fail” Attribute used at least in Samsung devices. |
| 183 0xB7 |
SATA Downshift Error Count or Runtime Bad Block | Western Digital, Samsung or Seagate attribute: Either the number of downshifts of link speed (e.g. from 6Gbit/s to 3Gbit/s) or the total number of data blocks with detected, uncorrectable errors encountered during normal operation. Although degradation of this parameter can be an indicator of drive aging and/or potential electromechanical problems, it does not directly indicate imminent drive failure. |
| 184 0xB8 |
End-to-End error / IOEDC | This attribute is a part of Hewlett-Packard’s SMART IV technology, as well as part of other vendors’ IO Error Detection and Correction schemas, and it contains a count of parity errors which occur in the data path to the media via the drive’s cache RAM. |
| 185 0xB9 |
Head Stability | Western Digital attribute. |
| 186 0xBA |
Induced Op-Vibration Detection | Western Digital attribute. |
| 187 0xBB |
Reported Uncorrectable Errors | The count of errors that could not be recovered using hardware ECC (see attribute 195). |
| 188 0xBC |
Command Timeout | The count of aborted operations due to HDD timeout. Normally this attribute value should be equal to zero. |
| 189 0xBD |
High Fly Writes | HDD manufacturers implement a flying height sensor that attempts to provide additional protections for write operations by detecting when a recording head is flying outside its normal operating range. If an unsafe fly height condition is encountered, the write process is stopped, and the information is rewritten or reallocated to a safe region of the hard drive. This attribute indicates the count of these errors detected over the lifetime of the drive.This feature is implemented in most modern Seagate drives and some of Western Digital’s drives, beginning with the WD Enterprise WDE18300 and WDE9180 Ultra2 SCSI hard drives, and will be included on all future WD Enterprise products. |
| 190 0xBE |
Temperature Difference or Airflow Temperature | Value is equal to (100-temp. °C), allowing manufacturer to set a minimum threshold which corresponds to a maximum temperature. This also follows the convention of 100 being a best-case value and lower values being undesirable. However, some older drives may instead report raw Temperature (identical to 0xC2) or Temperature minus 50 here. |
| 191 0xBF |
G-sense Error Rate | The count of errors resulting from externally induced shock and vibration. |
| 192 0xC0 |
Power-off Retract Count, Emergency Retract Cycle Count (Fujitsu), or Unsafe Shutdown Count | Number of power-off or emergency retract cycles. |
| 193 0xC1 |
Load Cycle Count or Load/Unload Cycle Count (Fujitsu) | Count of load/unload cycles into head landing zone position. Some drives use 225 (0xE1) for Load Cycle Count instead.Western Digital rates their VelociRaptor drives for 600,000 load/unload cycles, and WD Green drives for 300,000 cycles; the latter ones are designed to unload heads often to conserve power. On the other hand, the WD3000GLFS (a desktop drive) is specified for only 50,000 load/unload cycles. Some laptop drives and “green power” desktop drives are programmed to unload the heads whenever there has not been any activity for a short period, to save power. Operating systems often access the file system a few times a minute in the background, causing 100 or more load cycles per hour if the heads unload: the load cycle rating may be exceeded in less than a year. There are programs for most operating systems that disable the Advanced Power Management (APM) and Automatic acoustic management (AAM) features causing frequent load cycles. |
| 194 0xC2 |
Temperature or Temperature Celsius | Indicates the device temperature, if the appropriate sensor is fitted. Lowest byte of the raw value contains the exact temperature value (Celsius degrees). |
| 195 0xC3 |
Hardware ECC Recovered | (Vendor-specific raw value.) The raw value has different structure for different vendors and is often not meaningful as a decimal number. |
| 196 0xC4 |
Reallocation Event Count | Count of remap operations. The raw value of this attribute shows the total count of attempts to transfer data from reallocated sectors to a spare area. Both successful and unsuccessful attempts are counted. |
| 197 0xC5 |
Current Pending Sector Count | Count of “unstable” sectors (waiting to be remapped, because of unrecoverable read errors). If an unstable sector is subsequently read successfully, the sector is remapped and this value is decreased. Read errors on a sector will not remap the sector immediately (since the correct value cannot be read and so the value to remap is not known, and also it might become readable later); instead, the drive firmware remembers that the sector needs to be remapped, and will remap it the next time it’s written. However, some drives will not immediately remap such sectors when written; instead the drive will first attempt to write to the problem sector and if the write operation is successful then the sector will be marked good (in this case, the “Reallocation Event Count” (0xC4) will not be increased). This is a serious shortcoming, for if such a drive contains marginal sectors that consistently fail only after some time has passed following a successful write operation, then the drive will never remap these problem sectors. |
| 198 0xC6 |
(Offline) Uncorrectable Sector Count | The total count of uncorrectable errors when reading/writing a sector. A rise in the value of this attribute indicates defects of the disk surface and/or problems in the mechanical subsystem. |
| 199 0xC7 |
UltraDMA CRC Error Count | The count of errors in data transfer via the interface cable as determined by ICRC (Interface Cyclic Redundancy Check). |
| 200 0xC8 |
Multi-Zone Error Rate | The count of errors found when writing a sector. The higher the value, the worse the disk’s mechanical condition is. |
| 200 0xC8 |
Write Error Rate (Fujitsu) | The total count of errors when writing a sector. |
| 201 0xC9 |
Soft Read Error Rate or TA Counter Detected |
Count indicates the number of uncorrectable software read errors. |
| 202 0xCA |
Data Address Mark errors or TA Counter Increased |
Count of Data Address Mark errors (or vendor-specific). |
| 203 0xCB |
Run Out Cancel | The number of errors caused by incorrect checksum during the error correction. |
| 204 0xCC |
Soft ECC Correction | Count of errors corrected by the internal error correction software. |
| 205 0xCD |
Thermal Asperity Rate | Count of errors due to high temperature. |
| 206 0xCE |
Flying Height | Height of heads above the disk surface. If too low, head crash is more likely; if too high, read/write errors are more likely. |
| 207 0xCF |
Spin High Current | Amount of surge current used to spin up the drive. |
| 208 0xD0 |
Spin Buzz | Count of buzz routines needed to spin up the drive due to insufficient power. |
| 209 0xD1 |
Offline Seek Performance | Drive’s seek performance during its internal tests. |
| 210 0xD2 |
Vibration During Write | Found in Maxtor 6B200M0 200GB and Maxtor 2R015H1 15GB disks. |
| 211 0xD3 |
Vibration During Write | A recording of a vibration encountered during write operations. |
| 212 0xD4 |
Shock During Write | A recording of shock encountered during write operations. |
| 220 0xDC |
Disk Shift | Distance the disk has shifted relative to the spindle (usually due to shock or temperature). Unit of measure is unknown. |
| 221 0xDD |
G-Sense Error Rate | The count of errors resulting from externally induced shock and vibration. |
| 222 0xDE |
Loaded Hours | Time spent operating under data load (movement of magnetic head armature). |
| 223 0xDF |
Load/Unload Retry Count | Count of times head changes position. |
| 224 0xE0 |
Load Friction | Resistance caused by friction in mechanical parts while operating. |
| 225 0xE1 |
Load/Unload Cycle Count | Total count of load cycles Some drives use 193 (0xC1) for Load Cycle Count instead. See Description for 193 for significance of this number. |
| 226 0xE2 |
Load ‘In’-time | Total time of loading on the magnetic heads actuator (time not spent in parking area). |
| 227 0xE3 |
Torque Amplification Count | Count of attempts to compensate for platter speed variations. |
| 228 0xE4 |
Power-Off Retract Cycle | The number of power-off cycles which are counted whenever there is a “retract event” and the heads are loaded off of the media such as when the machine is powered down, put to sleep, or is idle. |
| 230 0xE6 |
GMR Head Amplitude (magnetic HDDs), Drive Life Protection Status (SSDs) | Amplitude of “thrashing” (repetitive head moving motions between operations). In solid-state drives, indicates whether usage trajectory is outpacing the expected life curve |
| 231 0xE7 |
Life Left (SSDs) or Temperature | Indicates the approximate SSD life left, in terms of program/erase cycles or available reserved blocks. A normalized value of 100 represents a new drive, with a threshold value at 10 indicating a need for replacement. A value of 0 may mean that the drive is operating in read-only mode to allow data recovery. Previously (pre-2010) occasionally used for Drive Temperature (more typically reported at 0xC2). |
| 232 0xE8 |
Endurance Remaining or Available Reserved Space | Number of physical erase cycles completed on the SSD as a percentage of the maximum physical erase cycles the drive is designed to endure.Intel SSDs report the available reserved space as a percentage of the initial reserved space. |
| 233 0xE9 |
Media Wearout Indicator (SSDs) or Power-On Hours | Intel SSDs report a normalized value from 100, a new drive, to a minimum of 1. It decreases while the NAND erase cycles increase from 0 to the maximum-rated cycles.Previously (pre-2010) occasionally used for Power-On Hours (more typically reported in 0x09). |
| 234 0xEA |
Average erase count AND Maximum Erase Count | Decoded as: byte 0-1-2 = average erase count (big endian) and byte 3-4-5 = max erase count (big endian). |
| 235 0xEB |
Good Block Count AND System(Free) Block Count | Decoded as: byte 0-1-2 = good block count (big endian) and byte 3-4 = system (free) block count. |
| 240 0xF0 |
Head Flying Hours or ‘Transfer Error Rate’ (Fujitsu) | Time spent during the positioning of the drive heads. Some Fujitsu drives report the count of link resets during a data transfer. |
| 241 0xF1 |
Total LBAs Written | Total count of LBAs written. |
| 242 0xF2 |
Total LBAs Read | Total count of LBAs read. Some S.M.A.R.T. utilities will report a negative number for the raw value since in reality it has 48 bits rather than 32. |
| 243 0xF3 |
Total LBAs Written Expanded | The upper 5 bytes of the 12-byte total number of LBAs written to the device. The lower 7 byte value is located at attribute 0xF1. |
| 244 0xF4 |
Total LBAs Read Expanded | The upper 5 bytes of the 12-byte total number of LBAs read from the device. The lower 7 byte value is located at attribute 0xF2. |
| 249 0xF9 |
NAND Writes (1GiB) | Total NAND Writes. Raw value reports the number of writes to NAND in 1 GB increments. |
| 250 0xFA |
Read Error Retry Rate | Count of errors while reading from a disk. |
| 251 0xFB |
Minimum Spares Remaining | The Minimum Spares Remaining attribute indicates the number of remaining spare blocks as a percentage of the total number of spare blocks available. |
| 252 0xFC |
Newly Added Bad Flash Block | The Newly Added Bad Flash Block attribute indicates the total number of bad flash blocks the drive detected since it was first initialized in manufacturing. |
| 254 0xFE |
Free Fall Protection | Count of “Free Fall Events” detected. |
The above table has been sourced from Microsoft.
FIX: SMART status Bad, Backup and Replace error
That’s it on the three ways to check SMART Failure Predict Status of drives in Windows.
How do you predict hard drive failure?
Hard drive failure can be predicted using SMART (Self-Monitoring, Analysis, and Reporting Technology) attributes. These attributes, collected during normal operations, help identify issues by analyzing threshold values. Tracking indicators like reallocated sectors, spin-up time, and temperature can provide early warnings of potential disk failure.
Read: Please back up your data and replace your hard disk drive
How to run a SMART drive test?
To run a SMART drive test, you can use built-in tools like Windows’ Command Prompt with wmic diskdrive get status or third-party software like CrystalDiskInfo. These methods help monitor the health and performance of your hard drive, ensuring it functions optimally.
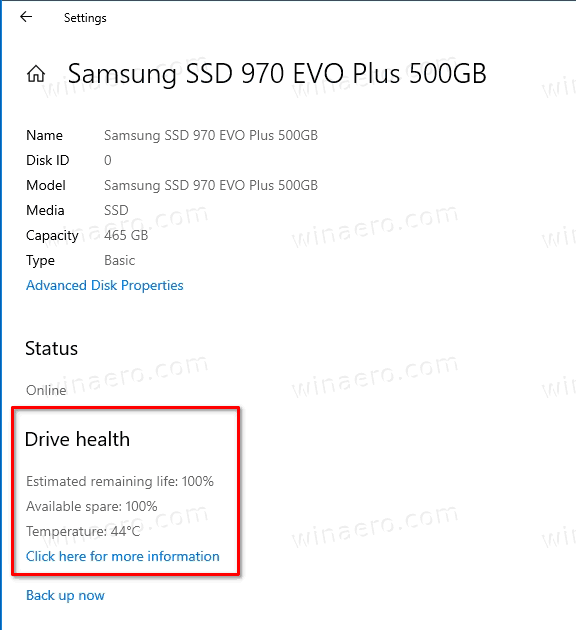
How to Check Drive Health and SMART Status in Windows 10
With recent updates, Windows 10 is able to retrieve and show the SMART information for storage devices installed in your computer. This allows the user to quickly check the drive health status. The option is available starting in Windows 10 build 20226, which has introduced the Manage disks and volumes page in the Settings app. The new feature supports modern NVMe SSD drives.

When introduced in build 20226, Microsoft had announced the feature as follows.
Attempting to recover data after drive failure is both frustrating and expensive. This feature is designed to detect hardware abnormalities for NVMe SSDs and notify users with enough time to act. It is strongly recommended that users immediately back up their data after receiving a notification.
So the new option is not just a page in Settings, it is a full featured storage monitor option.
S.M.A.R.T., also written as SMART (Self-Monitoring, Analysis and Reporting Technology) is a monitoring system implemented in computer disk drives, including HDDs, SSDs, and eMMC devices. Its primary function is to detect and report drive reliability indicators to prevent data loss and predict catastrophic hardware failures.
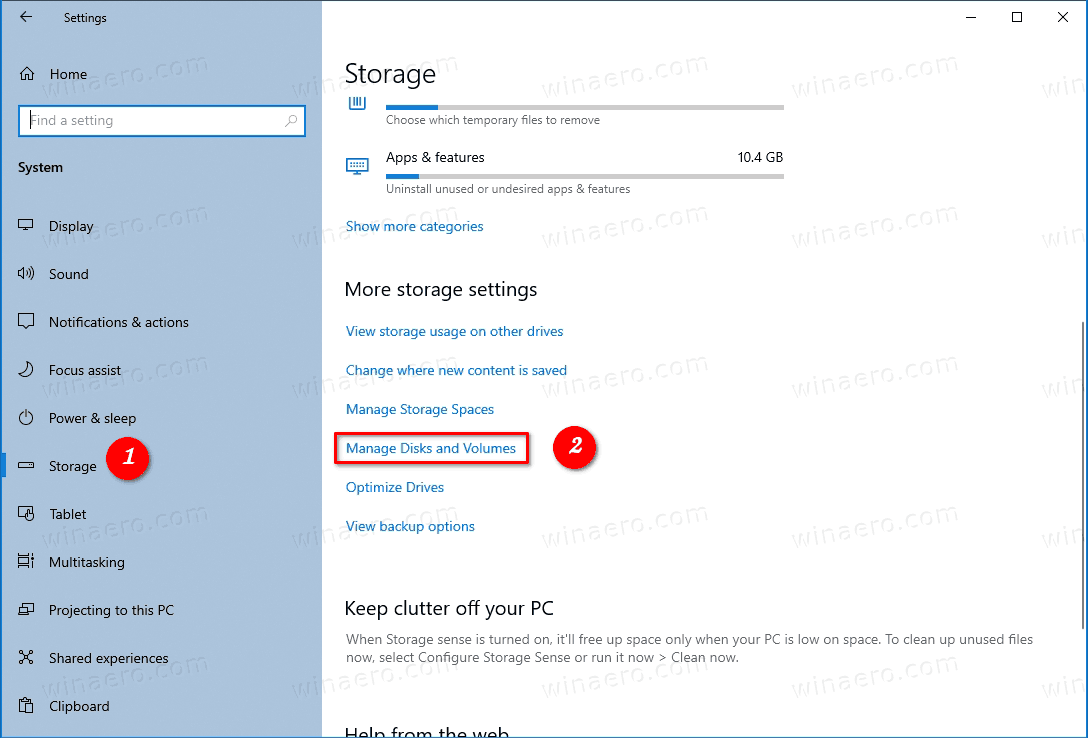
- Open the Settings app.
- Go to System > Storage.
- On the right, click on the Manage Disks and Volumes link.

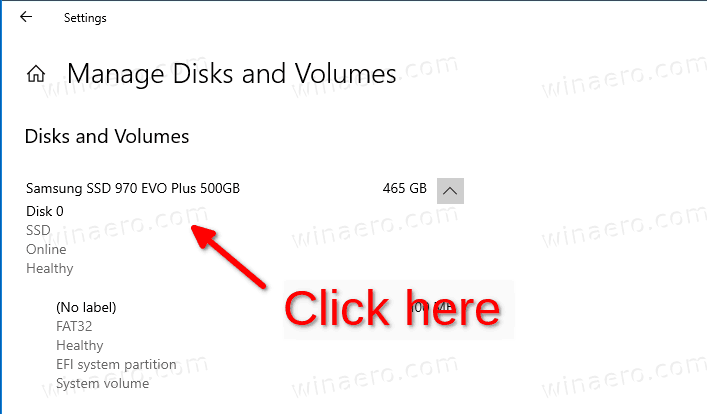
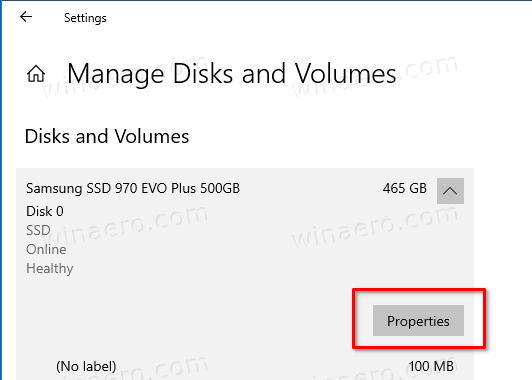
- On the next page, click the on the drive you want to check the SMART status for.

- Click on the
Propertiesbutton below the drive’s name line.
- On the next page, you’ll find the drive health report value under the Drive health section.

You are done.
If you don’t see the temperature details, ensure that you have the proper Windows 10 build installed. Also, this may mean that your drive is not recognized properly by Windows 10, so the OS can’t retrieve its temperature. As of the time of this writing, it only supports NVMe SSD drives.
In this case, you can use a few other built-in Windows tools to retrieve the drive status indicator values. If you are running a Windows 10 version without the above feature, you can do the following.
Check Drive Health and SMART Status in PowerShell
- Open PowerShell as Administrator.
- Type or copy-paste the following command:
Get-WmiObject -namespace root\wmi -class MSStorageDriver_FailurePredictStatus. - See the line
PredictFailure. For a healthy drive, it should sayFalse. - If the above value is True, then the drive is in the faulty state. The next line,
Reason, contains the status code that describes the exact reason of the issue. See the reference table below for the error codes.
Check Drive Health and SMART Status in Command Prompt
- Open Command Prompt as Administrator.
- Type or copy-paste the following command:
wmic /namespace:\\root\wmi path MSStorageDriver_FailurePredictStatus. - See the
PredictFailurecolumn. For a healthy drive, it should sayFalse. - If the above value is
True, then the drive is in the faulty state. The next column,Reason, contains the status code that describes the exact reason of the issue. See the reference table below for the error codes.
Known SMART attributes and status codes
| ID | Attribute name | Description |
|---|---|---|
| 01 0x01 |
Read Error Rate | (Vendor specific raw value.) Stores data related to the rate of hardware read errors that occurred when reading data from a disk surface. The raw value has different structure for different vendors and is often not meaningful as a decimal number. |
| 02 0x02 |
Throughput Performance | Overall (general) throughput performance of a hard disk drive. If the value of this attribute is decreasing there is a high probability that there is a problem with the disk. |
| 03 0x03 |
Spin-Up Time | Average time of spindle spin up (from zero RPM to fully operational [milliseconds]). |
| 04 0x04 |
Start/Stop Count | A tally of spindle start/stop cycles. The spindle turns on, and hence the count is increased, both when the hard disk is turned on after having before been turned entirely off (disconnected from power source) and when the hard disk returns from having previously been put to sleep mode. |
| 05 0x05 |
Reallocated Sectors Count | Count of reallocated sectors. The raw value represents a count of the bad sectors that have been found and remapped. Thus, the higher the attribute value, the more sectors the drive has had to reallocate. This value is primarily used as a metric of the life expectancy of the drive; a drive which has had any reallocations at all is significantly more likely to fail in the immediate months. |
| 06 0x06 |
Read Channel Margin | Margin of a channel while reading data. The function of this attribute is not specified. |
| 07 0x07 |
Seek Error Rate | (Vendor specific raw value.) Rate of seek errors of the magnetic heads. If there is a partial failure in the mechanical positioning system, then seek errors will arise. Such a failure may be due to numerous factors, such as damage to a servo, or thermal widening of the hard disk. The raw value has different structure for different vendors and is often not meaningful as a decimal number. |
| 08 0x08 |
Seek Time Performance | Average performance of seek operations of the magnetic heads. If this attribute is decreasing, it is a sign of problems in the mechanical subsystem. |
| 09 0x09 |
Power-On Hours | Count of hours in power-on state. The raw value of this attribute shows total count of hours (or minutes, or seconds, depending on manufacturer) in power-on state.
«By default, the total expected lifetime of a hard disk in perfect condition is defined as 5 years (running every day and night on all days). This is equal to 1825 days in 24/7 mode or 43800 hours.» On some pre-2005 drives, this raw value may advance erratically and/or «wrap around» (reset to zero periodically). |
| 10 0x0A |
Spin Retry Count | Count of retry of spin start attempts. This attribute stores a total count of the spin start attempts to reach the fully operational speed (under the condition that the first attempt was unsuccessful). An increase of this attribute value is a sign of problems in the hard disk mechanical subsystem. |
| 11 0x0B |
Recalibration Retries or Calibration Retry Count | This attribute indicates the count that recalibration was requested (under the condition that the first attempt was unsuccessful). An increase of this attribute value is a sign of problems in the hard disk mechanical subsystem. |
| 12 0x0C |
Power Cycle Count | This attribute indicates the count of full hard disk power on/off cycles. |
| 13 0x0D |
Soft Read Error Rate | Uncorrected read errors reported to the operating system. |
| 22 0x16 |
Current Helium Level | Specific to He8 drives from HGST. This value measures the helium inside of the drive specific to this manufacturer. It is a pre-fail attribute that trips once the drive detects that the internal environment is out of specification. |
| 170 0xAA |
Available Reserved Space | See attribute E8. |
| 171 0xAB |
SSD Program Fail Count | (Kingston) The total number of flash program operation failures since the drive was deployed. Identical to attribute 181. |
| 172 0xAC |
SSD Erase Fail Count | (Kingston) Counts the number of flash erase failures. This attribute returns the total number of Flash erase operation failures since the drive was deployed. This attribute is identical to attribute 182. |
| 173 0xAD |
SSD Wear Leveling Count | Counts the maximum worst erase count on any block. |
| 174 0xAE |
Unexpected Power Loss Count | Also known as «Power-off Retract Count» per conventional HDD terminology. Raw value reports the number of unclean shutdowns, cumulative over the life of an SSD, where an «unclean shutdown» is the removal of power without STANDBY IMMEDIATE as the last command (regardless of PLI activity using capacitor power). Normalized value is always 100. |
| 175 0xAF |
Power Loss Protection Failure | Last test result as microseconds to discharge cap, saturated at its maximum value. Also logs minutes since last test and lifetime number of tests. Raw value contains the following data:
Normalized value is set to one on test failure or 11 if the capacitor has been tested in an excessive temperature condition, otherwise 100. |
| 176 0xB0 |
Erase Fail Count | S.M.A.R.T. parameter indicates a number of flash erase command failures. |
| 177 0xB1 |
Wear Range Delta | Delta between most-worn and least-worn Flash blocks. It describes how good/bad the wearleveling of the SSD works on a more technical way. |
| 179 0xB3 |
Used Reserved Block Count Total | «Pre-Fail» attribute used at least in Samsung devices. |
| 180 0xB4 |
Unused Reserved Block Count Total | «Pre-Fail» attribute used at least in HP devices. |
| 181 0xB5 |
Program Fail Count Total or Non-4K Aligned Access Count | Total number of Flash program operation failures since the drive was deployed. Number of user data accesses (both reads and writes) where LBAs are not 4 KiB aligned (LBA % 8 != 0) or where size is not modulus 4 KiB (block count != 8), assuming logical block size (LBS) = 512 B. |
| 182 0xB6 |
Erase Fail Count | «Pre-Fail» Attribute used at least in Samsung devices. |
| 183 0xB7 |
SATA Downshift Error Count or Runtime Bad Block | Western Digital, Samsung or Seagate attribute: Either the number of downshifts of link speed (e.g. from 6Gbit/s to 3Gbit/s) or the total number of data blocks with detected, uncorrectable errors encountered during normal operation. Although degradation of this parameter can be an indicator of drive aging and/or potential electromechanical problems, it does not directly indicate imminent drive failure. |
| 184 0xB8 |
End-to-End error / IOEDC | This attribute is a part of Hewlett-Packard’s SMART IV technology, as well as part of other vendors’ IO Error Detection and Correction schemas, and it contains a count of parity errors which occur in the data path to the media via the drive’s cache RAM. |
| 185 0xB9 |
Head Stability | Western Digital attribute. |
| 186 0xBA |
Induced Op-Vibration Detection | Western Digital attribute. |
| 187 0xBB |
Reported Uncorrectable Errors | The count of errors that could not be recovered using hardware ECC (see attribute 195). |
| 188 0xBC |
Command Timeout | The count of aborted operations due to HDD timeout. Normally this attribute value should be equal to zero. |
| 189 0xBD |
High Fly Writes | HDD manufacturers implement a flying height sensor that attempts to provide additional protections for write operations by detecting when a recording head is flying outside its normal operating range. If an unsafe fly height condition is encountered, the write process is stopped, and the information is rewritten or reallocated to a safe region of the hard drive. This attribute indicates the count of these errors detected over the lifetime of the drive.
This feature is implemented in most modern Seagate drives and some of Western Digital’s drives, beginning with the WD Enterprise WDE18300 and WDE9180 Ultra2 SCSI hard drives, and will be included on all future WD Enterprise products. |
| 190 0xBE |
Temperature Difference or Airflow Temperature | Value is equal to (100-temp. °C), allowing manufacturer to set a minimum threshold which corresponds to a maximum temperature. This also follows the convention of 100 being a best-case value and lower values being undesirable. However, some older drives may instead report raw Temperature (identical to 0xC2) or Temperature minus 50 here. |
| 191 0xBF |
G-sense Error Rate | The count of errors resulting from externally induced shock and vibration. |
| 192 0xC0 |
Power-off Retract Count, Emergency Retract Cycle Count (Fujitsu), or Unsafe Shutdown Count | Number of power-off or emergency retract cycles. |
| 193 0xC1 |
Load Cycle Count or Load/Unload Cycle Count (Fujitsu) | Count of load/unload cycles into head landing zone position. Some drives use 225 (0xE1) for Load Cycle Count instead.
Western Digital rates their VelociRaptor drives for 600,000 load/unload cycles, and WD Green drives for 300,000 cycles; the latter ones are designed to unload heads often to conserve power. On the other hand, the WD3000GLFS (a desktop drive) is specified for only 50,000 load/unload cycles. Some laptop drives and «green power» desktop drives are programmed to unload the heads whenever there has not been any activity for a short period, to save power. Operating systems often access the file system a few times a minute in the background, causing 100 or more load cycles per hour if the heads unload: the load cycle rating may be exceeded in less than a year. There are programs for most operating systems that disable the Advanced Power Management (APM) and Automatic acoustic management (AAM) features causing frequent load cycles. |
| 194 0xC2 |
Temperature or Temperature Celsius | Indicates the device temperature, if the appropriate sensor is fitted. Lowest byte of the raw value contains the exact temperature value (Celsius degrees). |
| 195 0xC3 |
Hardware ECC Recovered | (Vendor-specific raw value.) The raw value has different structure for different vendors and is often not meaningful as a decimal number. |
| 196 0xC4 |
Reallocation Event Count | Count of remap operations. The raw value of this attribute shows the total count of attempts to transfer data from reallocated sectors to a spare area. Both successful and unsuccessful attempts are counted. |
| 197 0xC5 |
Current Pending Sector Count | Count of «unstable» sectors (waiting to be remapped, because of unrecoverable read errors). If an unstable sector is subsequently read successfully, the sector is remapped and this value is decreased. Read errors on a sector will not remap the sector immediately (since the correct value cannot be read and so the value to remap is not known, and also it might become readable later); instead, the drive firmware remembers that the sector needs to be remapped, and will remap it the next time it’s written.
However, some drives will not immediately remap such sectors when written; instead the drive will first attempt to write to the problem sector and if the write operation is successful then the sector will be marked good (in this case, the «Reallocation Event Count» (0xC4) will not be increased). This is a serious shortcoming, for if such a drive contains marginal sectors that consistently fail only after some time has passed following a successful write operation, then the drive will never remap these problem sectors. |
| 198 0xC6 |
(Offline) Uncorrectable Sector Count | The total count of uncorrectable errors when reading/writing a sector. A rise in the value of this attribute indicates defects of the disk surface and/or problems in the mechanical subsystem. |
| 199 0xC7 |
UltraDMA CRC Error Count | The count of errors in data transfer via the interface cable as determined by ICRC (Interface Cyclic Redundancy Check). |
| 200 0xC8 |
Multi-Zone Error Rate | The count of errors found when writing a sector. The higher the value, the worse the disk’s mechanical condition is. |
| 200 0xC8 |
Write Error Rate (Fujitsu) | The total count of errors when writing a sector. |
| 201 0xC9 |
Soft Read Error Rate or TA Counter Detected |
Count indicates the number of uncorrectable software read errors. |
| 202 0xCA |
Data Address Mark errors or TA Counter Increased |
Count of Data Address Mark errors (or vendor-specific). |
| 203 0xCB |
Run Out Cancel | The number of errors caused by incorrect checksum during the error correction. |
| 204 0xCC |
Soft ECC Correction | Count of errors corrected by the internal error correction software. |
| 205 0xCD |
Thermal Asperity Rate | Count of errors due to high temperature. |
| 206 0xCE |
Flying Height | Height of heads above the disk surface. If too low, head crash is more likely; if too high, read/write errors are more likely. |
| 207 0xCF |
Spin High Current | Amount of surge current used to spin up the drive. |
| 208 0xD0 |
Spin Buzz | Count of buzz routines needed to spin up the drive due to insufficient power. |
| 209 0xD1 |
Offline Seek Performance | Drive’s seek performance during its internal tests. |
| 210 0xD2 |
Vibration During Write | Found in Maxtor 6B200M0 200GB and Maxtor 2R015H1 15GB disks. |
| 211 0xD3 |
Vibration During Write | A recording of a vibration encountered during write operations. |
| 212 0xD4 |
Shock During Write | A recording of shock encountered during write operations. |
| 220 0xDC |
Disk Shift | Distance the disk has shifted relative to the spindle (usually due to shock or temperature). Unit of measure is unknown. |
| 221 0xDD |
G-Sense Error Rate | The count of errors resulting from externally induced shock and vibration. |
| 222 0xDE |
Loaded Hours | Time spent operating under data load (movement of magnetic head armature). |
| 223 0xDF |
Load/Unload Retry Count | Count of times head changes position. |
| 224 0xE0 |
Load Friction | Resistance caused by friction in mechanical parts while operating. |
| 225 0xE1 |
Load/Unload Cycle Count | Total count of load cycles Some drives use 193 (0xC1) for Load Cycle Count instead. See Description for 193 for significance of this number. |
| 226 0xE2 |
Load ‘In’-time | Total time of loading on the magnetic heads actuator (time not spent in parking area). |
| 227 0xE3 |
Torque Amplification Count | Count of attempts to compensate for platter speed variations. |
| 228 0xE4 |
Power-Off Retract Cycle | The number of power-off cycles which are counted whenever there is a «retract event» and the heads are loaded off of the media such as when the machine is powered down, put to sleep, or is idle. |
| 230 0xE6 |
GMR Head Amplitude (magnetic HDDs), Drive Life Protection Status (SSDs) | Amplitude of «thrashing» (repetitive head moving motions between operations).
In solid-state drives, indicates whether usage trajectory is outpacing the expected life curve |
| 231 0xE7 |
Life Left (SSDs) or Temperature | Indicates the approximate SSD life left, in terms of program/erase cycles or available reserved blocks. A normalized value of 100 represents a new drive, with a threshold value at 10 indicating a need for replacement. A value of 0 may mean that the drive is operating in read-only mode to allow data recovery.
Previously (pre-2010) occasionally used for Drive Temperature (more typically reported at 0xC2). |
| 232 0xE8 |
Endurance Remaining or Available Reserved Space | Number of physical erase cycles completed on the SSD as a percentage of the maximum physical erase cycles the drive is designed to endure.
Intel SSDs report the available reserved space as a percentage of the initial reserved space. |
| 233 0xE9 |
Media Wearout Indicator (SSDs) or Power-On Hours | Intel SSDs report a normalized value from 100, a new drive, to a minimum of 1. It decreases while the NAND erase cycles increase from 0 to the maximum-rated cycles.
Previously (pre-2010) occasionally used for Power-On Hours (more typically reported in 0x09). |
| 234 0xEA |
Average erase count AND Maximum Erase Count | Decoded as: byte 0-1-2 = average erase count (big endian) and byte 3-4-5 = max erase count (big endian). |
| 235 0xEB |
Good Block Count AND System(Free) Block Count | Decoded as: byte 0-1-2 = good block count (big endian) and byte 3-4 = system (free) block count. |
| 240 0xF0 |
Head Flying Hours or ‘Transfer Error Rate’ (Fujitsu) | Time spent during the positioning of the drive heads. Some Fujitsu drives report the count of link resets during a data transfer. |
| 241 0xF1 |
Total LBAs Written | Total count of LBAs written. |
| 242 0xF2 |
Total LBAs Read | Total count of LBAs read. Some S.M.A.R.T. utilities will report a negative number for the raw value since in reality it has 48 bits rather than 32. |
| 243 0xF3 |
Total LBAs Written Expanded | The upper 5 bytes of the 12-byte total number of LBAs written to the device. The lower 7 byte value is located at attribute 0xF1. |
| 244 0xF4 |
Total LBAs Read Expanded | The upper 5 bytes of the 12-byte total number of LBAs read from the device. The lower 7 byte value is located at attribute 0xF2. |
| 249 0xF9 |
NAND Writes (1GiB) | Total NAND Writes. Raw value reports the number of writes to NAND in 1 GB increments. |
| 250 0xFA |
Read Error Retry Rate | Count of errors while reading from a disk. |
| 251 0xFB |
Minimum Spares Remaining | The Minimum Spares Remaining attribute indicates the number of remaining spare blocks as a percentage of the total number of spare blocks available. |
| 252 0xFC |
Newly Added Bad Flash Block | The Newly Added Bad Flash Block attribute indicates the total number of bad flash blocks the drive detected since it was first initialized in manufacturing. |
| 254 0xFE |
Free Fall Protection | Count of «Free Fall Events» detected. |
The above table is taken from Wikipedia.
Support us
Winaero greatly relies on your support. You can help the site keep bringing you interesting and useful content and software by using these options:
If you like this article, please share it using the buttons below. It won’t take a lot from you, but it will help us grow. Thanks for your support!