
Журналы Windows играют ключевую роль в обеспечении безопасности, производительности и стабильности операционной системы. Они позволяют администраторам отслеживать события, выявлять проблемы и проводить анализ работы системы. В этой статье мы подробно рассмотрим, что такое журналы Windows, как они работают, какие виды журналов существуют, а также как их использовать для диагностики и мониторинга.
Ознакомиться с тарифами Windows хостинга можно тут
Что такое журналы Windows?
Журналы Windows — это записи, содержащие информацию о событиях, происходящих в операционной системе. Каждое событие записывается в виде записи журнала, которая включает в себя временную метку, источник события, уровень важности и описание события.
Зачем нужны журналы Windows?
Журналы служат нескольким целям:
- Мониторинг безопасности: Журналы помогают отслеживать попытки несанкционированного доступа и другие подозрительные действия.
- Диагностика проблем: При возникновении ошибок и сбоев журналы предоставляют информацию, необходимую для их устранения.
- Анализ производительности: Журналы могут помочь в выявлении узких мест в производительности системы.
- Отчетность: Журналы могут использоваться для создания отчетов о состоянии системы и безопасности.
Виды журналов Windows
Windows предлагает несколько типов журналов, каждый из которых предназначен для записи определенных событий:
1. Журнал приложений
Журнал приложений содержит записи о событиях, связанных с установленными приложениями. Это может включать ошибки, предупреждения и другую информацию, которую приложения отправляют в систему.
2. Журнал системных событий
Системный журнал фиксирует события, происходящие на уровне операционной системы. Это могут быть ошибки драйверов, проблемы с оборудованием и другие системные события.
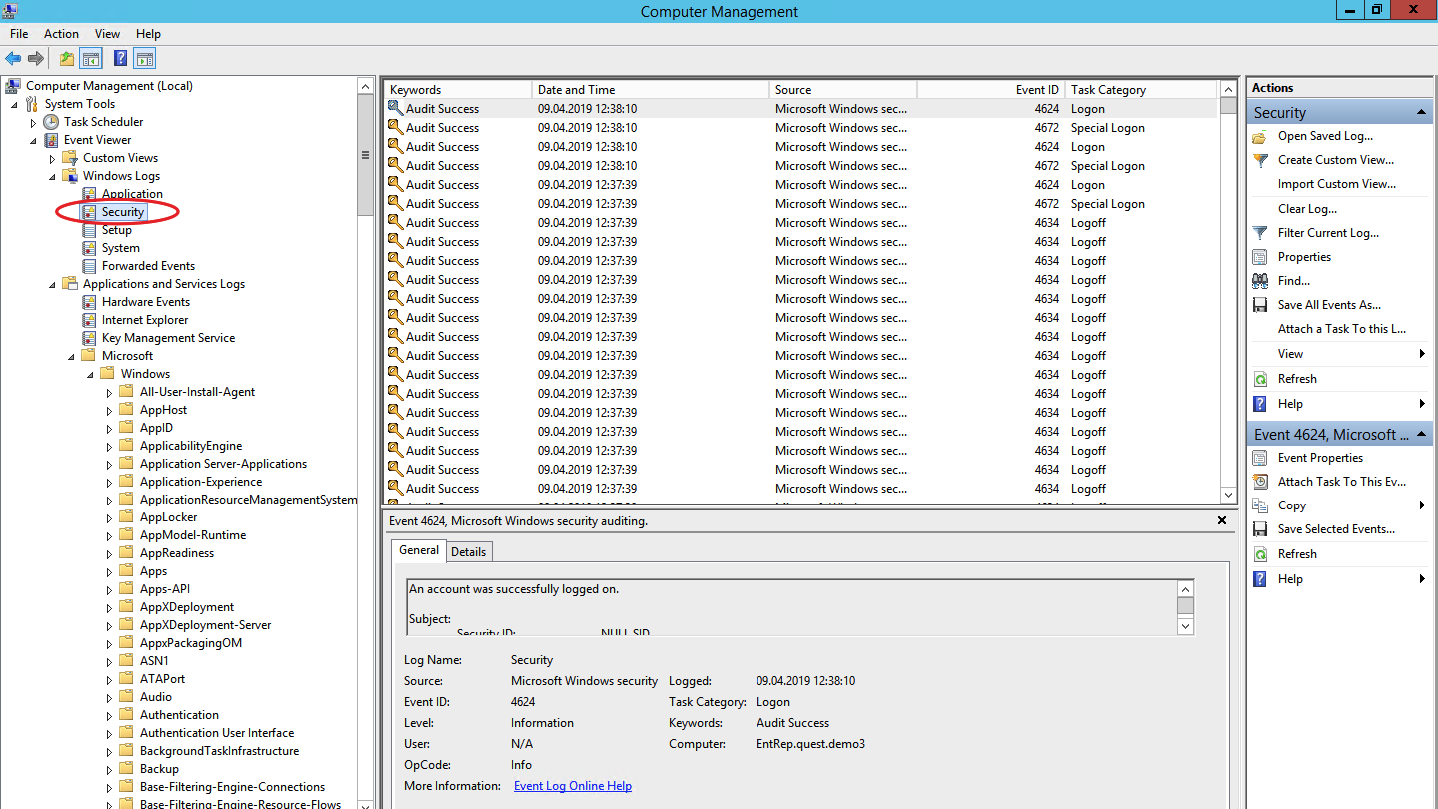
3. Журнал безопасности
Журнал безопасности отслеживает события, связанные с безопасностью, такие как входы в систему, изменения прав доступа и попытки несанкционированного доступа.
4. Журнал установки
Журнал установки фиксирует события, связанные с установкой и обновлением программного обеспечения и драйверов.
5. Журнал Windows PowerShell
Этот журнал хранит записи о выполнении команд и скриптов в PowerShell, что полезно для администраторов и разработчиков.
Как получить доступ к журналам Windows
Для доступа к журналам Windows используется встроенная утилита «Просмотр событий».
Шаги для открытия «Просмотр событий»:
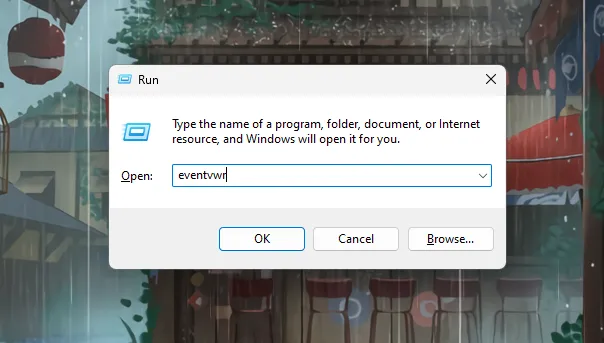
- Нажмите комбинацию клавиш Win + R, чтобы открыть окно «Выполнить».
- Введите команду
eventvwrи нажмите Enter. - В левой панели вы увидите различные категории журналов, такие как «Журналы Windows» и «Журналы приложений и служб».
Основные операции с журналами
Просмотр и фильтрация событий
- Просмотр событий: В правой части окна вы можете видеть список событий. Дважды щелкните на любое событие, чтобы просмотреть его детали.
- Фильтрация событий: Чтобы упростить поиск нужных событий, вы можете использовать фильтры. Нажмите на «Фильтр текущего журнала» в правой части окна и задайте параметры фильтрации (например, по уровню важности или источнику).
Экспорт и импорт журналов
Вы можете экспортировать журналы в файл для дальнейшего анализа или архивирования.
- Для экспорта: щелкните правой кнопкой на нужном журнале и выберите «Сохранить все события как…».
- Выберите формат файла (например, XML или EVTX) и укажите место для сохранения.
- Для импорта: используйте опцию «Открыть сохраненный журнал» в меню.
Очистка журналов
С течением времени журналы могут заполняться, и их очистка может быть необходима для управления дисковым пространством.
- Щелкните правой кнопкой мыши на журнале и выберите «Очистить журнал».
- Подтвердите действие.
Анализ событий в журналах Windows
Анализ журналов Windows может помочь в выявлении проблем и обеспечении безопасности. Рассмотрим несколько важных аспектов анализа:
1. Поиск ошибок
Ошибки и предупреждения в журналах обычно выделяются цветом. Просматривая журнал, обратите внимание на записи с уровнем «Ошибка» или «Предупреждение».
2. Аудит безопасности
Для обеспечения безопасности системы важно отслеживать записи в журнале безопасности. Проверьте, были ли попытки входа в систему с неправильным паролем или изменения прав доступа.
3. Мониторинг производительности
Системный журнал может помочь выявить проблемы с производительностью. Обратите внимание на события, связанные с высоким использованием ресурсов или сбоями оборудования.
4. Использование фильтров
Фильтры позволяют сосредоточиться на конкретных событиях. Вы можете фильтровать события по времени, уровню важности или источнику.
Устранение распространенных проблем
1. Проблемы с приложениями
Если приложение не работает должным образом, проверьте журнал приложений на наличие ошибок, связанных с данным приложением.
2. Проблемы с оборудованием
Журнал системных событий может содержать информацию о проблемах с оборудованием, таких как сбои драйверов или проблемы с жестким диском.
3. Проблемы с безопасностью
Если вы подозреваете, что система была скомпрометирована, проверьте журнал безопасности на наличие подозрительных действий.
4. Перегрузка журналов
Если журнал переполнен, это может привести к проблемам с записью новых событий. Регулярно очищайте и архивируйте журналы, чтобы избежать этой проблемы.
Настройка ведения журналов
1. Изменение параметров журнала
Вы можете настроить параметры ведения журналов, чтобы контролировать, как и когда они записываются. Например, вы можете установить максимальный размер журнала или выбрать, как система будет реагировать на переполнение.
2. Настройка аудита
Вы можете настроить аудит безопасности, чтобы отслеживать определенные действия, такие как вход в систему или изменения в политике безопасности.
Заключение
Журналы Windows являются мощным инструментом для мониторинга и анализа системы. Правильное использование журналов позволяет обеспечить безопасность, производительность и стабильность операционной системы. Надеемся, что эта статья поможет вам эффективно управлять и анализировать журналы Windows, а также быстро устранять проблемы.
Время на прочтение5 мин
Количество просмотров79K
Пользовательская рабочая станция — самое уязвимое место инфраструктуры по части информационной безопасности. Пользователям может прийти на рабочую почту письмо вроде бы из безопасного источника, но со ссылкой на заражённый сайт. Возможно, кто-то скачает полезную для работы утилиту из неизвестно какого места. Да можно придумать не один десяток кейсов, как через пользователей вредоносное ПО может внедриться на внутрикорпоративные ресурсы. Поэтому рабочие станции требуют повышенного внимания, и в статье мы расскажем, откуда и какие события брать для отслеживания атак.
Для выявления атаки на самой ранней стадии в ОС Windows есть три полезных событийных источника: журнал событий безопасности, журнал системного мониторинга и журналы Power Shell.
Журнал событий безопасности (Security Log)
Это главное место хранения системных логов безопасности. Сюда складываются события входа/выхода пользователей, доступа к объектам, изменения политик и других активностей, связанных с безопасностью. Разумеется, если настроена соответствующая политика.
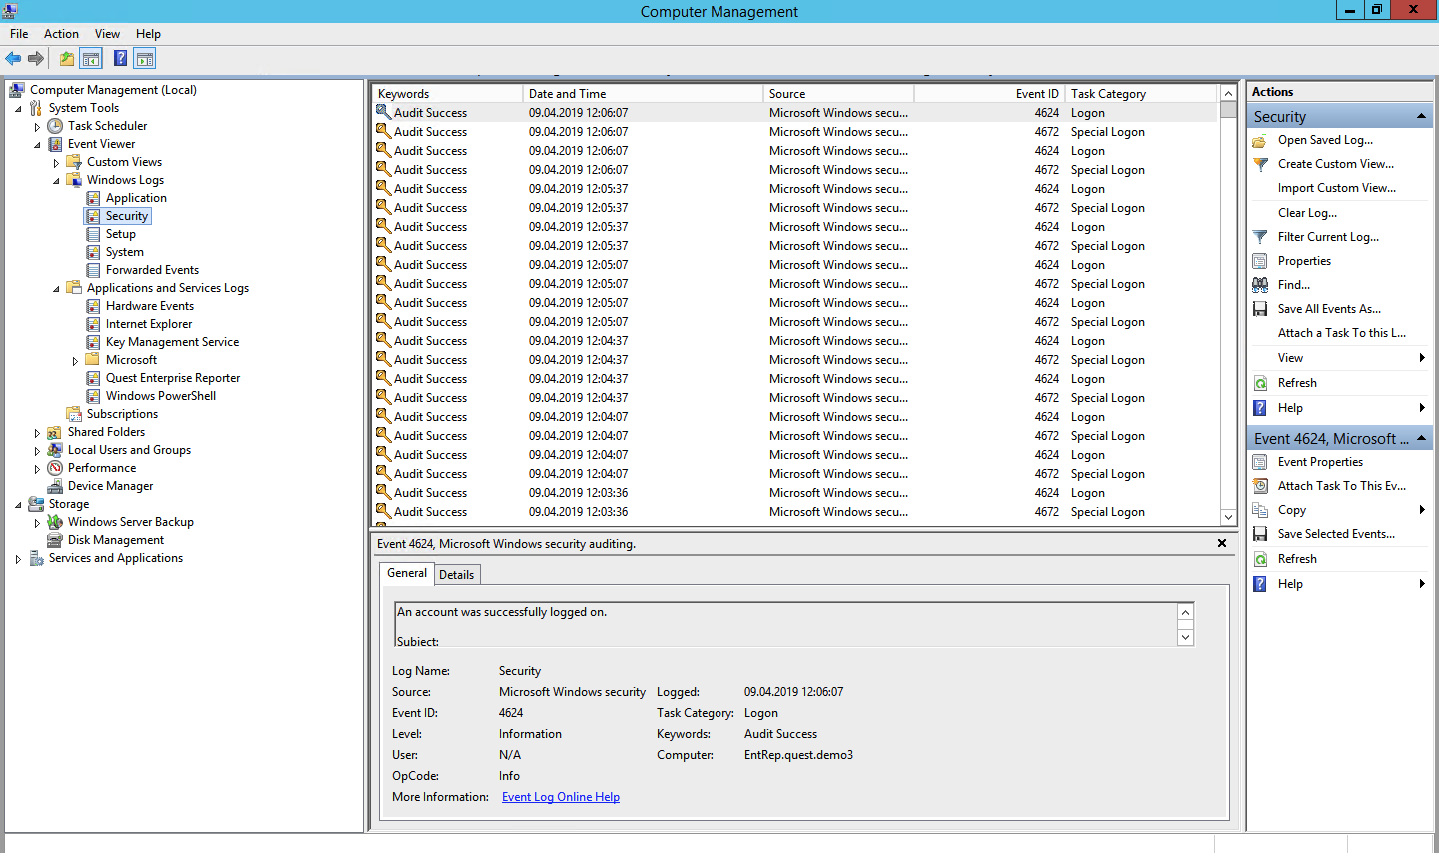
Перебор пользователей и групп (события 4798 и 4799). Вредоносное ПО в самом начале атаки часто перебирает локальные учетные записи пользователей и локальные группы на рабочей станции, чтобы найти учетные данные для своих тёмных делишек. Эти события помогут обнаружить вредоносный код раньше, чем он двинется дальше и, используя собранные данные, распространится на другие системы.
Создание локальной учётной записи и изменения в локальных группах (события 4720, 4722–4726, 4738, 4740, 4767, 4780, 4781, 4794, 5376 и 5377). Атака может также начинаться, например, с добавления нового пользователя в группу локальных администраторов.
Попытки входа с локальной учётной записью (событие 4624). Добропорядочные пользователи заходят с доменной учётной записью и выявление входа под локальной учётной записью может означать начало атаки. Событие 4624 включает также входы под доменной учетной записью, поэтому при обработке событий нужно зафильтровать события, в которых домен отличается от имени рабочей станции.
Попытка входа с заданной учётной записью (событие 4648). Такое бывает, когда процесс выполняется в режиме “Запуск от имени” (run as). В нормальном режиме работы систем такого не должно быть, поэтому такие события должны находиться под контролем.
Блокировка/разблокировка рабочей станции (события 4800-4803). К категории подозрительных событий можно отнести любые действия, которые происходили на заблокированной рабочей станции.
Изменения конфигурации файрволла (события 4944-4958). Очевидно, что при установке нового ПО настройки конфигурации файрволла могут меняться, что вызовет ложные срабатывания. Контролировать такие изменения в большинстве случаев нет необходимости, но знать о них точно лишним не будет.
Подключение устройств Plug’n’play (событие 6416 и только для WIndows 10). За этим важно следить, если пользователи обычно не подключают новые устройства к рабочей станции, а тут вдруг раз — и подключили.
Windows включает в себя 9 категорий аудита и 50 субкатегорий для тонкой настройки. Минимальный набор субкатегорий, который стоит включить в настройках:
Logon/Logoff
- Logon;
- Logoff;
- Account Lockout;
- Other Logon/Logoff Events.
Account Management
- User Account Management;
- Security Group Management.
Policy Change
- Audit Policy Change;
- Authentication Policy Change;
- Authorization Policy Change.
Системный монитор (Sysmon)
Sysmon — встроенная в Windows утилита, которая умеет записывать события в системный журнал. Обычно требуется его устанавливать отдельно.

Эти же события можно в принципе найти в журнале безопасности (включив нужную политику аудита), но Sysmon даёт больше подробностей. Какие события можно забирать из Sysmon?
Создание процесса (ID события 1). Системный журнал событий безопасности тоже может сказать, когда запустился какой-нибудь *.exe и даже покажет его имя и путь запуска. Но в отличие от Sysmon не сможет показать хэш приложения. Злонамеренное ПО может называться даже безобидным notepad.exe, но именно хэш выведет его на чистую воду.
Сетевые подключения (ID события 3). Очевидно, что сетевых подключений много, и за всеми не уследить. Но важно учитывать, что Sysmon в отличие от того же Security Log умеет привязать сетевое подключение к полям ProcessID и ProcessGUID, показывает порт и IP-адреса источника и приёмника.
Изменения в системном реестре (ID события 12-14). Самый простой способ добавить себя в автозапуск — прописаться в реестре. Security Log это умеет, но Sysmon показывает, кто внёс изменения, когда, откуда, process ID и предыдущее значение ключа.
Создание файла (ID события 11). Sysmon, в отличие от Security Log, покажет не только расположение файла, но и его имя. Понятно, что за всем не уследишь, но можно же проводить аудит определённых директорий.
А теперь то, чего в политиках Security Log нет, но есть в Sysmon:
Изменение времени создания файла (ID события 2). Некоторое вредоносное ПО может подменять дату создания файла для его скрытия из отчётов с недавно созданными файлами.
Загрузка драйверов и динамических библиотек (ID событий 6-7). Отслеживание загрузки в память DLL и драйверов устройств, проверка цифровой подписи и её валидности.
Создание потока в выполняющемся процессе (ID события 8). Один из видов атаки, за которым тоже нужно следить.
События RawAccessRead (ID события 9). Операции чтения с диска при помощи “\\.\”. В абсолютном большинстве случаев такая активность должна считаться ненормальной.
Создание именованного файлового потока (ID события 15). Событие регистрируется, когда создается именованный файловый поток, который генерирует события с хэшем содержимого файла.
Создание named pipe и подключения (ID события 17-18). Отслеживание вредоносного кода, который коммуницирует с другими компонентами через named pipe.
Активность по WMI (ID события 19). Регистрация событий, которые генерируются при обращении к системе по протоколу WMI.
Для защиты самого Sysmon нужно отслеживать события с ID 4 (остановка и запуск Sysmon) и ID 16 (изменение конфигурации Sysmon).
Журналы Power Shell
Power Shell — мощный инструмент управления Windows-инфраструктурой, поэтому велики шансы, что атакующий выберет именно его. Для получения данных о событиях Power Shell можно использовать два источника: Windows PowerShell log и Microsoft-WindowsPowerShell / Operational log.
Windows PowerShell log

Загружен поставщик данных (ID события 600). Поставщики PowerShell — это программы, которые служат источником данных для PowerShell для просмотра и управления ими. Например, встроенными поставщиками могут быть переменные среды Windows или системный реестр. За появлением новых поставщиков нужно следить, чтобы вовремя выявить злонамеренную активность. Например, если видите, что среди поставщиков появился WSMan, значит был начат удаленный сеанс PowerShell.
Microsoft-WindowsPowerShell / Operational log (или MicrosoftWindows-PowerShellCore / Operational в PowerShell 6)

Журналирование модулей (ID события 4103). В событиях хранится информация о каждой выполненной команде и параметрах, с которыми она вызывалась.
Журналирование блокировки скриптов (ID события 4104). Журналирование блокировки скриптов показывает каждый выполненный блок кода PowerShell. Даже если злоумышленник попытается скрыть команду, этот тип события покажет фактически выполненную команду PowerShell. Ещё в этом типе события могут фиксироваться некоторые выполняемые низкоуровневые вызовы API, эти события обычно записывается как Verbose, но если подозрительная команда или сценарий используются в блоке кода, он будет зарегистрирован как c критичностью Warning.
Обратите внимание, что после настройки инструмента сбора и анализа этих событий потребуется дополнительное время на отладку для снижения количества ложных срабатываний.
Расскажите в комментариях, какие собираете логи для аудита информационной безопасности и какие инструменты для этого используете. Одно из наших направлений — решения для аудита событий информационной безопасности. Для решения задачи сбора и анализа логов можем предложить присмотреться к Quest InTrust, который умеет сжимать хранящиеся данные с коэффициентом 20:1, а один его установленный экземпляр способен обрабатывать до 60000 событий в секунду из 10000 источников.
If you’re using a Windows server and want to know what happened to your machine, Windows logs are an essential resource. Windows logs record various system activities, errors, and other significant events, providing valuable information for troubleshooting, auditing, and ensuring system integrity. Understanding how to access, interpret, and utilise these logs enables efficient, problem solving, enables security measures and ensures the smooth operation of your system.
In this guide, you will learn about Windows event logs, its different categories, how to filter and create Custom Views.
What is a Windows Event Log?
A Windows event log is a file that keeps track of system events and errors, application issues, and security events. Windows Event log can also provide insights into an application’s behavior by tracking its interactions with other processes and services. With the right knowledge of the information stored in these logs, you can easily diagnose and easily resolve issues within your system and applications.
You can access the windows events logs as follows:
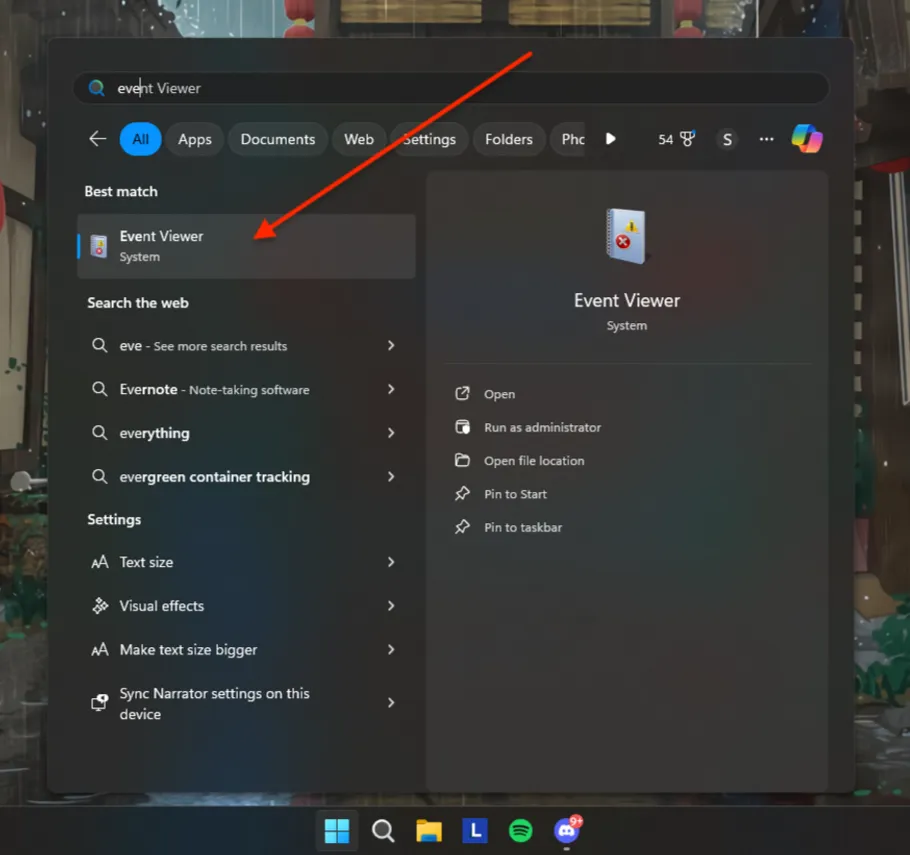
Using the Start Menu:
- Click on the Start button or press the Windows key.
- Type
Event Viewerin the search box and select it from the search results.
Using the Run Dialog:
- Press
Windows + Rto open the Run dialog. - Type
eventvwrand press Enter.
Using the Control Panel:
- Open the Command Prompt and run as administrator.
- Type
eventvwrand press Enter.
You can see the detailed steps below. Now let’s discuss and understand windows events logs in detail.
Understanding Windows Event Logs categories & Types
There are different Windows logs, each serving a specific purpose in tracking and recording events related to your system, applications, and security. They include:
- System Events: System events log information is about the core operations of your Windows operating system. System events are essential for maintaining your system’s health and functionality because it records events related to the system’s hardware and software components. Some system events are as follows:
- Hardware Failures: Logs any issues related to hardware components, such as disc failures or memory errors.
- Driver Issues: Records events related to the loading, unloading, or malfunctioning of device drivers. This helps in identifying driver-related problems that could affect system stability.
- System Startups and Shutdowns: Tracks the times when the system starts up or shuts down. This can be useful for understanding system uptime and diagnosing issues related to improper shutdowns or startup failures.
- Application Events: Data related to software applications running on the system includes application errors, warnings, and informational messages. If you are using a Windows server to run your production-level application, you can use the application errors, warnings, and messages provided here to solve the issue. There are different types of Application events some are as follows:
- Application Errors: Application errors are events generated by software applications when they encounter issues that prevent them from functioning correctly.
- Warnings: Logs warnings from applications about potential issues that might not be critical but could lead to problems if not addressed.
- Informational Messages: Provides general information about application activities, such as successful operations or status updates, helping to understand the normal functioning of applications.
- Security Events: Security events are logs that capture all security-related activities on your Windows system. They are essential for monitoring, maintaining, and auditing the security of your system. These events help detect unauthorised access attempts, monitor access to sensitive resources, and track changes to system policies. Some security events are as follows:
- Successful and Failed Login Attempts: Successful and failed login attempts are critical events that are logged by a system to monitor access and ensure security. These logs provide valuable insights into user activity, helping to detect unauthorised access attempts and identify potential security threats.
- Resource Access: These events log attempts to access protected resources such as files, folders, or system settings. Monitoring these logs ensures that sensitive data is accessed appropriately and helps identify unauthorised access attempts.
- System Policy Changes: These logs record any changes to system policies, including modifications to user permissions or security settings. This is important for auditing purposes and ensuring compliance with security policies, helping to maintain the integrity and security of the system.
- Setup Events: Setup events are logs that contain detailed information about the installation and setup processes on your Windows system. These logs are valuable for diagnosing and resolving issues that occur during the installation or configuration of software and system components. Some Setup events are as follows:
- Installation Processes: Installation processes refer to the series of steps and operations carried out to install software, updates, or system components on a Windows system. It contains log details about software installation, updates, or system components. This helps in diagnosing issues related to incomplete or failed installations.
- Setup Configurations: Records information about system configurations during the setup process. This can be useful for understanding your system’s initial setup and configuration.
- Forwarded Events: Forwarded events are logs sent from other computers to a centralised logging server. This is particularly useful in larger environments where centralised log management is needed. They include:
- Logs from Remote Systems: Collects event logs from multiple systems, allowing for centralised monitoring and management.
- Centralised Logging Scenarios: Useful for organisations that need to aggregate logs from various systems to a single location for easier analysis and monitoring.
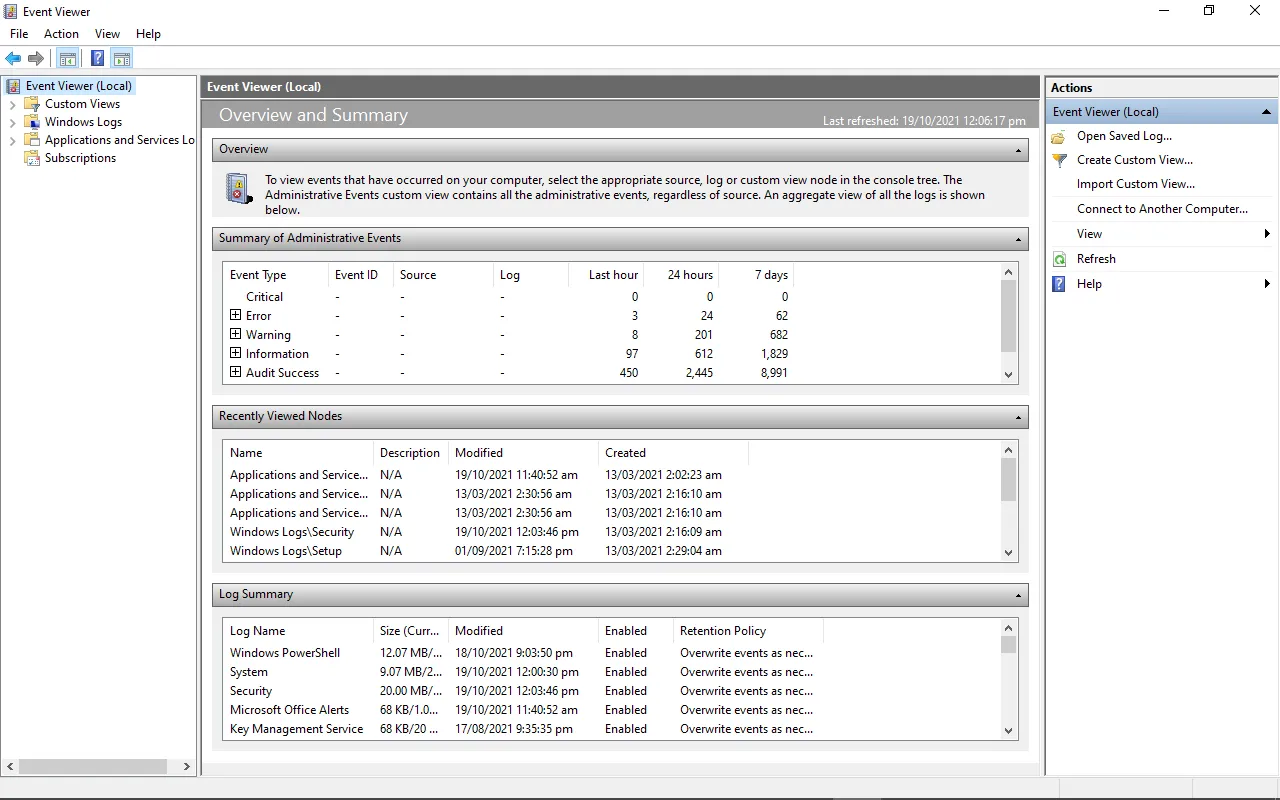
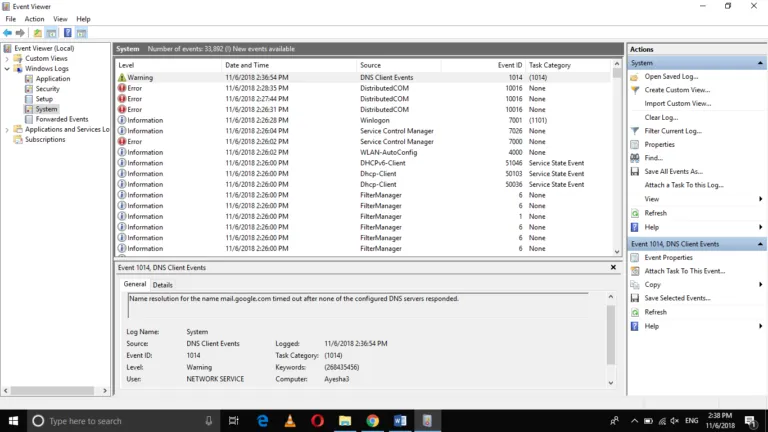
Accessing the Windows Event Viewer
Windows Event Viewer is a Windows application that lets you see your computer’s logs, warnings, and other events. Each application you open generates entries that are recorded in an activity log, which can be viewed from the Event Viewer.
There are several ways to access the Windows Event Viewer. Here are some of them:
-
Using the Start Menu:
- Click on the Start button or press the Windows key.
- Type
Event Viewerin the search box.

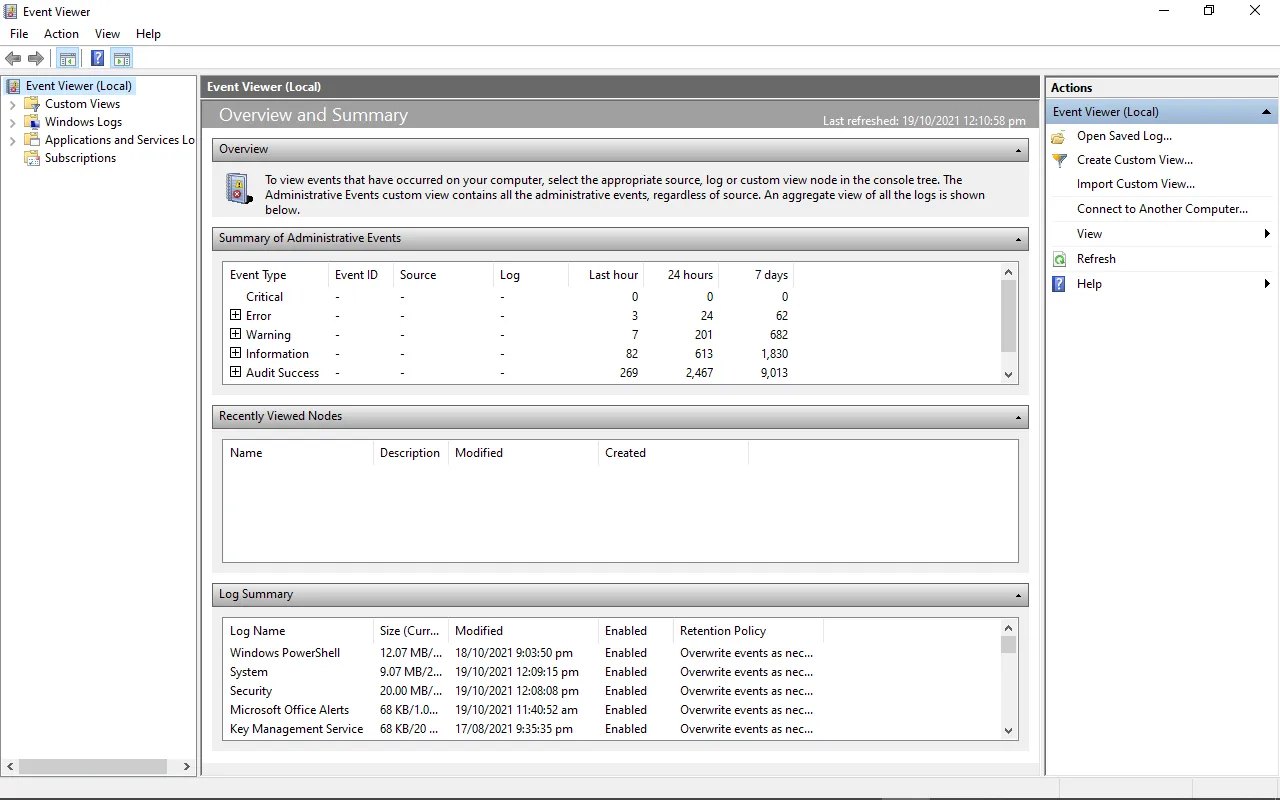
Using start menu to open Event viewer — Select Event Viewer from the search results which will popup something like this.
Event Viewer main page 2. Using the Run Dialog: — Press
Windows + Rto open the Run dialog. — Typeeventvwrand press Enter.
Windows Run App to open Event Viewer
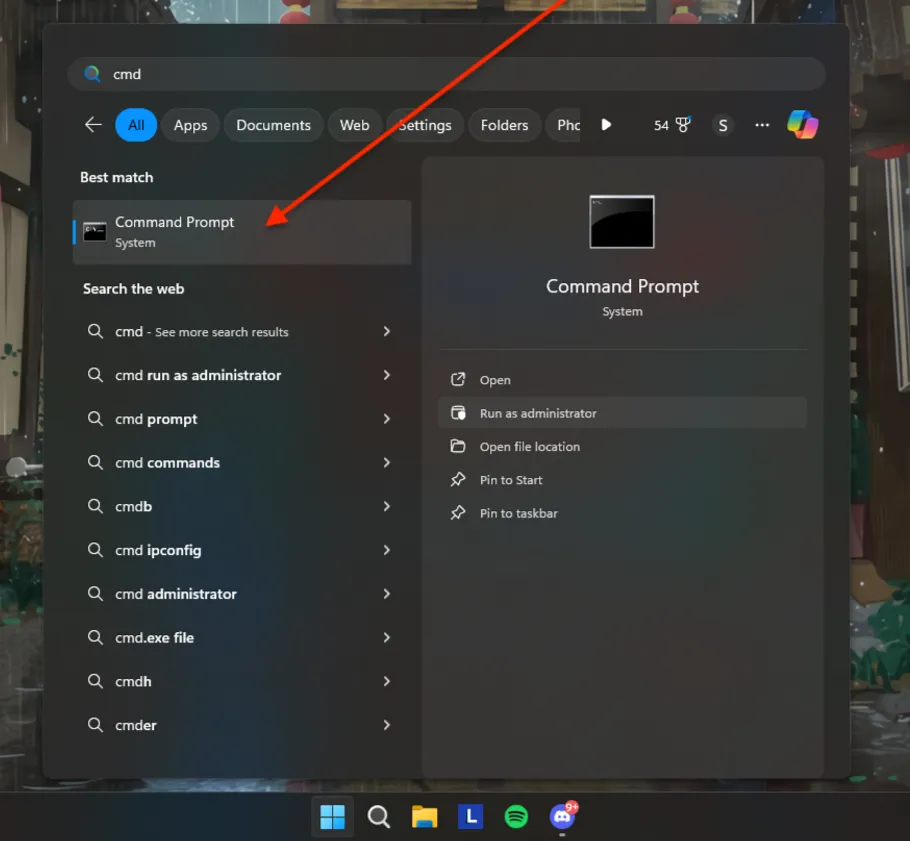
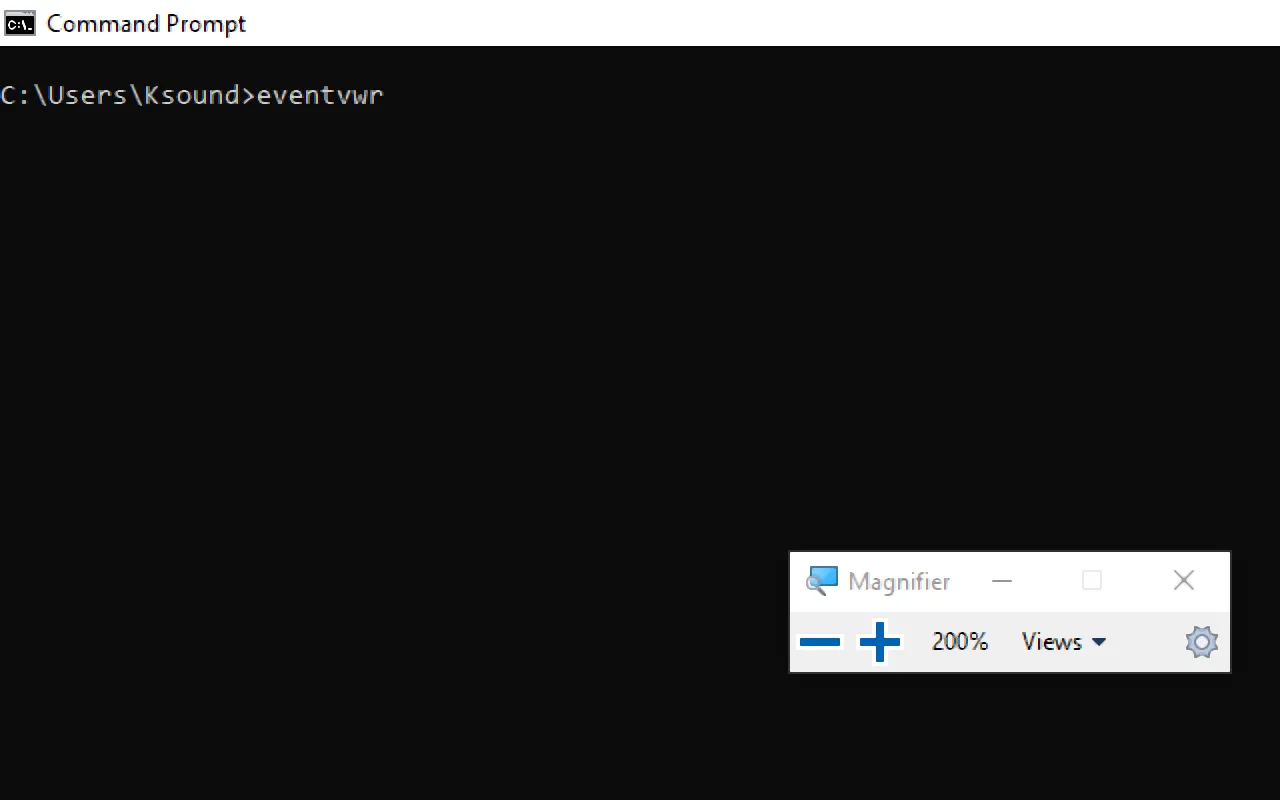
Windows Event viewer landing page 3. Using Control Panel: — Open the Command Prompt and run as administrator
Open CMD as Administrator from start menu — Once open, type
eventvwrand press enter, and you will be redirected to Event Viewer page.
CMD terminal
Windows Log Location
Windows event logs are stored in files located in the C:\\Windows\\System32\\winevt\\Logs directory. Each log file corresponds to a specific log category, such as System, Application, or Security. It may differ depending on which version of Windows you are using.
The main event log files are:
- Application.evtx: Logs events from applications and programs.
- Security.evtx: Logs security events like successful or failed logins.
- System.evtx: Logs events related to Windows system components and drivers
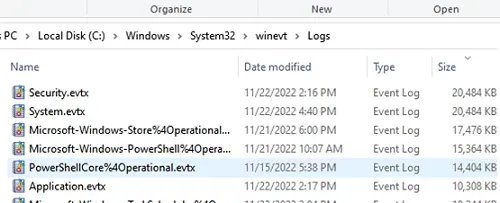
You can find many other log files which could be related to system operations & other processes that are happening inside the Windows System. Windows 11uses the .evtx format rather than using the classic EVT format.
Understanding Event Viewer Entries
Event Viewer entries provide detailed information about each logged event. It is like a log book for your Windows system. They record important happenings within the system, including applications, systems, security, failed events, etc. Understanding these entries is key to effective log management.
The key components of an Event Viewer entry are:
- Date and Time: When the event occurred.
- Source: The application or system component that generated the event.
- Event ID: A unique identifier for the event type.
- Level: The severity of the event (Information, Warning, Error, Critical).
- User: The user account under which the event occurred.
- Computer: The name of the computer where the event was logged.
- Description: Detailed information about the event.
Each event in the Event Viewer has a severity level, indicating the importance and type of the event:
- Information (Green Light): These events resemble a green traffic light, signifying smooth sailing. They indicate successful operations or occurrences within your system.
- Warning (Yellow Light): Treat these entries with caution, like a yellow traffic light. They signal potential issues that warrant attention but might not cause immediate problems.
- Error (Orange Light): Think of error entries as an orange traffic light; proceed with care. They denote significant problems that could affect system functionality. Imagine an error message indicating a driver failure.
- Critical (Red Light): Critical entries are akin to a red traffic light; stop and address the situation immediately. They represent severe errors that have caused a major failure. A critical event might report a complete system shutdown or a critical service crashing.
Filtering and Custom Views
Event Viewer allows you to filter events using a variety of parameters, including date, event level, source, and more. Consider the following scenario: your system exhibits weird behaviour, but the Event Viewer is overflowing with hundreds, if not thousands, of entries. Filtering steps and generating custom views can significantly reduce the workload. You may also construct custom views to focus on specific kinds of events:
- In the Event Viewer, you’ll see Administrative Events, to create special logs right-click on «Custom Views» and select «Create Custom View.»
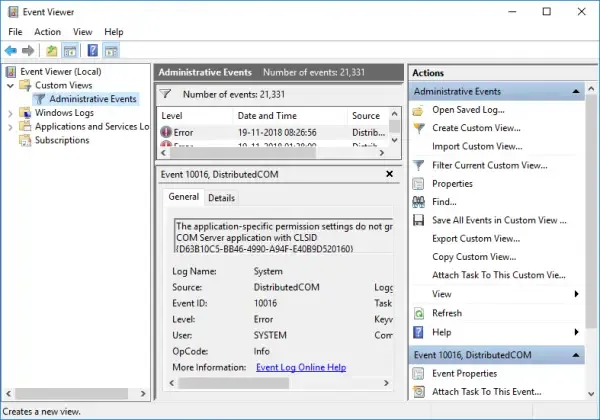
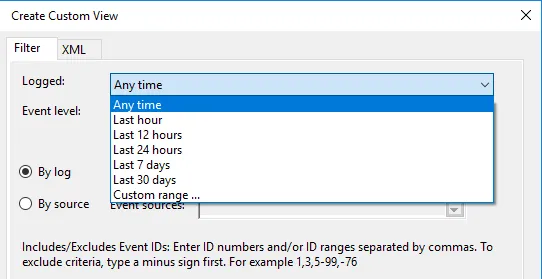
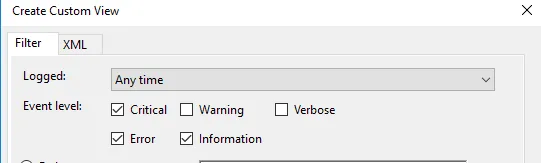
1. In the Custom View page, you can see logged drop down, choose a preferred time or it gives you an option to create a custom time to set. 2. On the Event Level choose an appropriate level for your custom view, You can choose among the 5 levels.
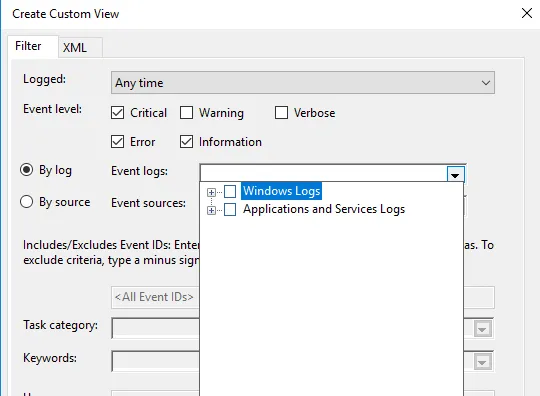
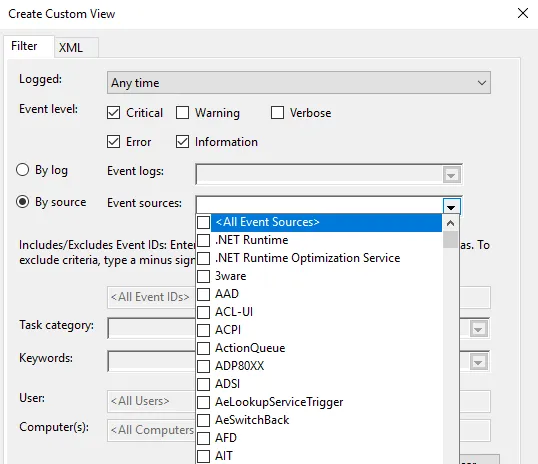
1. Once done, choose how you want the events to be filtered, By log or By source.
Once everything is set up according to your needs, save all events in Custom View as
from the drop-down menu and choose an appropriate location to save the logs. Click on the Save button. (A log file with the extension .evtx will be saved on your device).
Conclusion
This blog provides an understanding how you can use the Windows Event Viewer which is provided by the Windows in default and using it to monitor Windows logs.
- Main event log files are stored in
C:\\Windows\\System32\\winevt\\Logs. - Windows logs are crucial for understanding the activities, errors, and significant events on your machine. They provide valuable information for troubleshooting, auditing, and ensuring system integrity.
- They record a variety of system activities, errors, and other significant events, providing valuable information for troubleshooting, auditing, and ensuring system integrity.
- We learnt how to setup Filtering and Custom Views to optimise what we see and solve the problems and where it happened.
By grasping the significance of different event types such as System, Application, Security, Setup, and Forwarded Events, and knowing how to filter and export logs, you can effectively manage your Windows system.
FAQ’s
How to view Windows logs?
To view Windows logs, use the built-in Event Viewer:
- Press
Win + R, typeeventvwr, and press Enter. - Navigate through the console tree to find the log you want to view (e.g., Windows Logs > Application).
Where are Microsoft logs?
Microsoft logs, including Windows logs, can be found in the Event Viewer under sections like Application, Security, and System. Log files are also located in the C:\Windows\System32\winevt\Logs directory.
How do I audit Windows logs?
To audit Windows logs:
- Open Event Viewer.
- Navigate to Security logs under Windows Logs.
- Configure auditing policies via the Local Security Policy or Group Policy Management Console.
How do I check my Windows activity log
Check your Windows activity log by viewing the Security logs in Event Viewer. These logs record user logins, logoffs, and other security-related activities.
Which is Windows log key?
The Windows log key, often referred to as the Windows key, is the key on your keyboard with the Windows logo. It is used in various shortcuts to open system tools, including Event Viewer (Win + X > Event Viewer).
Where is the logs folder?
The logs folder is located at C:\Windows\System32\winevt\Logs. This folder contains all the event log files in .evtx format.
Why are Windows logs important?
Windows logs are important because they provide detailed information about system operations, security events, and application behavior, which is crucial for troubleshooting, auditing, and ensuring system integrity.
How to view log files?
View log files using Event Viewer:
- Open Event Viewer (
Win + R, typeeventvwr, press Enter). - Expand the Windows Logs section and select the log you want to view.
Where are login logs?
Login logs are located in the Security logs section of Event Viewer. They record all login attempts, both successful and failed.
What are system logs?
System logs contain information about the core operations of the Windows operating system, including hardware events, driver issues, and system startups and shutdowns. They are found under the System section in Event Viewer.
How do I find Windows log files?
Find Windows log files in the Event Viewer or directly in the C:\Windows\System32\winevt\Logs directory.
How do I view user logs in Windows 10?
View user logs in Windows 10 through the Event Viewer:
- Open Event Viewer.
- Go to Windows Logs > Security to see logs related to user activities, including logins and logoffs.
How do I view Windows setup logs?
To view Windows setup logs:
- Open Event Viewer.
- Navigate to Applications and Services Logs > Microsoft > Windows > Setup.
How do I view Windows app logs?
To view Windows application logs:
- Open Event Viewer.
- Navigate to Windows Logs > Application to see logs related to software applications running on your system.
Was this page helpful?
.webp?w=1068&resize=1068,0&ssl=1 "Windows Event Log Analysis – Complete Incident Response Guide")
Windows event logging provides detailed information like source, username, computer, type of event, and level, and shows a log of application and system messages, including errors, information messages, and warnings.
Microsoft has to keep increasing the efficiency and effectiveness of its auditing facilities over the years. Modern Windows systems can log vast amounts of information with minimal system impact.
Configuring adequate logging on Windows systems, and ideally aggregating those logs into a SIEM or other log aggregator, is a critical step toward ensuring that your environment is able to support effective incident response using Incident response tools.
.png)
Also Read: SIEM Better Visibility for SOC Analyst
Event Log Format
Modern Windows systems store logs in the %SystemRoot%\System32\winevt\logs directory by default in the binary XML Windows Event Logging format, designated by the .evtx extension. Logs can also be stored remotely using log subscriptions.
Events can be logged in the Security, System and Application event logs or, on modern Windows systems, they may also appear in several other log files. The Setup event log records activities that occurred during the installation of Windows.
The Forwarded Logs event log is the default location to record events received from other systems. But there are also many additional logs, listed under Applications and Services Logs in Event Viewer, that record details related to specific types of activities.
- Log Name: The name of the Event Log where the event is stored. Useful when processing numerous logs pulled from the same system.
- Source: The service, Microsoft component or application that generated the event.
- Event ID: A code assigned to each type of audited activity.
- Level: The severity assigned to the event in question.
- User: The user account involved in triggering the activity or the user context that the source was running as when it logged the event. Note that this field often indicates “System” or a user that is not the cause of the event being recorded.
- OpCode: Assigned by the source generating the log. It’s meaning is left to the source.
- Logged: The local system date and time when the event was logged.
- Task Category: Assigned by the source generating the log. It’s meaning is left to the source.
- Keywords: Assigned by the source and used to group or sort events.
- Computer: The computer on which the event was logged. This is useful when examining logs collected from multiple systems, but should not be considered to be the device that caused an event (such as when a remote logon is initiated, the Computer field will still show the name of the system logging the event, not the source of the connection).
- Description: A text block where additional information specific to the event being logged is recorded. This is often the most significant field for the analyst.
- Account Management Events
- Account Logon and Logon Events
- Common Event ID 4768 result codes
- Logon event type code descriptions
- Common logon failure status codes
- Access to Shared Objects
- Scheduled Task Logging
- Object Access Auditing
- Audit Policy Changes
- Auditing Windows Services
- Wireless LAN Auditing
- Process Tracking
- Additional Program Execution Logging
- Auditing PowerShell Use
Account Management Events
The following events will be recorded on the system where the account was created or modified, which will be the local system for a local account or a domain controller for a domain account.
| Event ID | Description |
| 4720 | A user account was created. |
| 4722 | A user account was enabled. |
| 4723 | A user attempted to change an account’s password. |
| 4724 | An attempt was made to reset an account’s password. |
| 4725 | A user account was disabled. |
| 4726 | A user account was deleted. |
| 4727 | A security-enabled global group was created. |
| 4728 | A member was added to a security-enabled global group. |
| 4729 | A member was removed from a security-enabled global group. |
| 4730 | A security-enabled global group was deleted. |
| 4731 | A security-enabled local group was created. |
| 4732 | A member was added to a security-enabled local group. |
| 4733 | A member was removed from a security-enabled local group. |
| 4734 | A security-enabled local group was deleted. |
| 4735 | A security-enabled local group was changed. |
| 4737 | A security-enabled global group was changed. |
| 4738 | A user account was changed. |
| 4741 | A computer account was created. |
| 4742 | A computer account was changed. |
| 4743 | A computer account was deleted. |
| 4754 | A security-enabled universal group was created. |
| 4755 | A security-enabled universal group was changed. |
| 4756 | A member was added to a security-enabled universal group. |
| 4757 | A member was removed from a security-enabled universal group. |
| 4758 | A security-enabled universal group was deleted. |
| 4798 | A user’s local group membership was enumerated. Large numbers of these events may be indicative of adversary account enumeration. |
| 4799 | A security-enabled local group membership was enumerated. Large numbers of these events may be indicative of adversary group enumeration. |
Account Logon and Logon Events
Account Logon is the Microsoft term for authentication. Logon is the term used to refer to an account gaining access to a resource. Both Account Logon and Logon events will be recorded in the Security event log. Authentication (account logon) of domain accounts is performed by a domain controller within a Windows network. Local accounts (those that exist within a local SAM file rather than as a part of Active Directory) are authenticated by the local system where they exist. Account logon events will be logged by the system that performs the authentication. Auditing of Account Logon and Logon events is easily set by Group Policy. While Microsoft continues to enable more logging by default as new versions of Windows are released, administrators should review their audit policies on a regular basis to ensure that all systems are generating adequate logs. The ability to store event logs on remote systems (either using the native Microsoft remote logging features or third-party SIEM tools or other tools) helps safeguard logs from alteration or destruction.
Event IDs of particular interest on domain controllers, which authenticate domain users, include:
| Event ID | Description |
| 4768 | The successful issuance of a TGT shows that a user account was authenticated by the domain controller. The Network Information section of the event description contains additional information about the remote host in the event of a remote logon attempt. The Keywords field indicates whether the authentication attempt was successful or failed. In the event of a failed authentication attempt, the result code in the event description provides additional information about the reason for the failure, as specified in RFC 4120. Some of the more commonly encountered codes are: |
Common Event ID 4768 Result Codes
| Decimal | Hex | Meaning |
| 6 | 0x6 | Username not valid. |
| 12 | 0xC | Policy restriction prohibiting this logon (such as a workstation restriction or time-of-day restriction). |
| 18 | 0x12 | The account is locked out, disabled, or expired. |
| 23 | 0x17 | The account’s password is expired. |
| 24 | 0x18 | The password is incorrect. |
| 32 | 0x20 | The ticket has expired (common on computer accounts). |
| 37 | 0x25 | The clock skew is too great. |
Source: Microsoft
| Event ID | Description |
| 4769 | A service ticket was requested by a user account for a specified resource. This event description shows the source IP of the system that made the request, the user account used, and the service to be accessed. These events provide a useful source of evidence as they track authenticated user access across the network. |
| 4770 | A service ticket was renewed. The account name, service name, client IP address, and encryption type are recorded. |
| 4771 | Depending on the reason for a failed Kerberos logon, either Event ID 4768 or Event ID 4771 is created. In either case, the result code in the event description provides additional information about the reason for the failure. |
| 4776 | This event ID is recorded for NTLM authentication attempts. The Network Information section of the event description contains additional information about the remote host in the event of a remote logon attempt. The Keywords field indicates whether the authentication attempt succeeded or failed. |
Common Event ID 4776 Error Code Descriptions
| Error Code | Meaning |
| 0xC0000064 | The username is incorrect. |
| 0xC000006A | The password is incorrect. |
| 0xC000006D | Generic logon failure. Possibly bad username or password or mismatch in the LAN Manager Authentication Level between the source and target computers. |
| 0xC000006F | Account logon outside authorized hours. |
| 0xC0000070 | Account logon from unauthorized workstation. |
| 0xC0000071 | Account logon with expired password. |
| 0xC0000072 | Account logon to account disabled by administrator. |
| 0xC0000193 | Account logon with expired account. |
| 0xC0000224 | Account logon with Change Password At Next Logon flagged. |
| 0xC0000234 | Account logon with account locked. |
| 0xc0000371 | The local account store does not contain secret material for the specified account. |
Source: Microsoft
On systems being accessed, Event IDs of note include:
| Event ID | Description |
| 4624 | A logon to a system has occurred. Type 2 indicates an interactive (usually local) logon, whereas a Type 3 indicates a remote or network logon. The event description will contain information about the host and account name involved. For remote logons, focus on the Network Information section of the event description for remote host information. |
Logon events contain a Type code in the event description:
Logon events contain a Type code in the event description:
Logon Event Type Code Descriptions
| Logon Type | Description |
| 2 | Interactive, such as logon at keyboard and screen of the system, or remotely using third-party remote access tools like VNC, or psexec with the -u switch. Logons of this type will cache the user’s credentials in RAM for the duration of the session and may cache the user’s credentials on disk. |
| 3 | Network, such as access to a shared folder on this computer from elsewhere on the network. This represents a noninteractive logon, which does not cache the user’s credentials in RAM or on disk. |
| 4 | Batch (indicating a scheduled task). Batch logon type is used by batch servers, where processes may be executing on behalf of a user without their direct intervention. |
| 5 | Service indicates that a service was started by the Service Control Manager. |
| 7 | Unlock indicates that an unattended workstation with a password protected screen is unlocked |
| 8 | NetworkCleartext indicates that a user logged on to this computer from the network and the user’s password was passed to the authentication package in its unhashed form. The built-in authentication packages all hash credentials before sending them across the network. The credentials do not traverse the network in plaintext (also called cleartext). Most often indicates a logon to Internet Information Services (IIS) with basic authentication. |
| 9 | NewCredentials indicates that a user logged on with alternate credentials to perform actions such as with RunAs or mapping a network drive. If you want to track users attempting to log on with alternate credentials, also look for Event ID 4648. |
| 10 | RemoteInteractive indicates that Terminal Services, Remote Desktop, or Remote Assistance for an interactive logon. See the note on RDP at the end of this section for more details. |
| 11 | CachedInteractive (logon with cached domain credentials such as when logging on to a laptop when away from the network). The domain controller was not contacted to verify the credential, so no account logon entry is generated. |
| Event ID | Description |
| 4625 | A failed logon attempt. Large numbers of these throughout a network may be indicative of password guessing or password spraying attacks. Again, the Network Information section of the event description can provide valuable information about a remote host attempting to log on to the system. Note that failed logons over RDP may log as Type 3 rather than Type 10, depending on the systems involved. You can determine more about the reason for the failure by consulting the Failure Information section of the event description. |
The status code found in Event ID 4625 provides additional details about the event:
Common Logon Failure Status Codes
| Status code | Description |
| 0XC000005E | Currently no logon servers are available to service the logon request. |
| 0xC0000064 | User logon with misspelled or bad user account. |
| 0xC000006A | User logon with misspelled or bad password. |
| 0XC000006D | This is either due to a bad username or incorrect authentication information. |
| 0XC000006E | Unknown username or bad password. |
| 0xC000006F | User logon outside authorized hours. |
| 0xC0000070 | User logon from unauthorized workstation. |
| 0xC0000071 | User logon with expired password. |
| 0xC0000072 | User logon to account disabled by administrator. |
| 0XC00000DC | Indicates the Server was in the wrong state to perform the desired operation. |
| 0XC0000133 | Clocks between domain controller and other computer too far out of sync. |
| 0XC000015B | The user has not been granted the requested logon type (also known as logon right) at this machine. |
| 0XC000018C | The logon request failed because the trust relationship between the primary domain and the trusted domain failed. |
| 0XC0000192 | An attempt was made to log on, but the Netlogon service was not started. |
| 0xC0000193 | User logon with expired account. |
| 0XC0000224 | User is required to change password at next logon. |
| 0XC0000225 | Evidently a bug in Windows and not a risk. |
| 0xC0000234 | User logon with account locked. |
| 0XC00002EE | Failure Reason: An error occurred during logon. |
| 0XC0000413 | Logon Failure: The machine you are logging on to is protected by an authentication firewall. The specified account is not allowed to authenticate to the machine. |
| Event ID | Description |
| 4634/4647 | User logoff is recorded by Event ID 4634 or Event ID 4647. The lack of an event showing a logoff should not be considered overly suspicious, as Windows is inconsistent in logging Event ID 4634 in many cases. The Logon ID field can be used to tie the Event ID 4624 logon event with the associated logoff event (the Logon ID is unique between reboots on the same computer). |
| 4648 | A logon was attempted using explicit credentials. When a user attempts to use credentials other than the ones used for the current logon session (including bypassing User Account Control [UAC] to open a process with administrator permissions), this event is logged. |
| 4672 | This event ID is recorded when certain privileges associated with elevated or administrator access are granted to a logon. As with all logon events, the event log will be generated by the system being accessed. |
| 4778 | This event is logged when a session is reconnected to a Windows station. This can occur locally when the user context is switched via fast user switching. |
| 4779 | This event is logged when a session is disconnected. This can occur locally when the user context is switched via fast user switching. It can also occur when a session is reconnected over RDP. A full logoff from an RDP session is logged with Event ID 4637 or 4647 as mentioned earlier. |
Attackers frequently leverage valid credentials to remotely access data through user created or administrative shares. Doing so will generate Account Logon and Logon events as mentioned above, but additional logging can also be enabled in the Group Policy Management Console by navigating to Computer Configuration -> Policies -> Windows Settings -> Security Settings -> Advanced Audit Policy Configuration -> Audit Policies -> Object Access -> Audit File Share. Once enabled, the following Event IDs will be logged in the Security Log:
| Event ID | Description |
| 5140 | A network share object was accessed. The event entry provides the account name and source address of the account that accessed the object. Note that this entry will show that the share was accessed but not what files in the share were accessed. A large number of these events from a single account may be an indicator of an account being used to harvest or map data on the network. |
| 5142 | A network share object was added. |
| 5143 | A network share object was modified. |
| 5144 | A network share object was deleted. |
| 5145 | A network share object was checked to see whether client can be granted desired access. Failure is only logged if the permission is denied at the file share level. If permission is denied at the NTFS level then no entry is recorded. |
If detailed file share auditing is enabled in the Group Policy Management Console by navigating to Computer Configuration -> Policies -> Windows Settings -> Security Settings -> Advanced Audit Policy Configuration -> Audit Policies -> Object Access -> Audit Detailed File Share, then each file within each share that is accessed will generate an Event ID 5145 log entry. As you can imagine, this level of logging may generate a large volume of results.
The system initiating the access may also show evidence of the connections in the registry key NTUSER\Software\Microsoft\Windows\CurrentVersion\Explorer\MountPoints2.
Scheduled Task Logging
If history is enabled in the Task Scheduler application, through Event Viewer, or with the wevtutil command (see here for more details), then the %SystemRoot%\System32\winevt\Logs\Microsoft-Windows- TaskScheduler%4Operational log will record activity relating to scheduled tasks on the local system as follows:
Scheduled Task Activity Event IDs
| Event ID | Description |
| 106 | Scheduled Task Created. The entry shows the user account that scheduled the task and the name the user assigned to the task. The Logged date and time show when the task was scheduled. Look for the associated Event ID 200 and 201 for additional information. |
| 140 | Scheduled Task Updated. The entry shows the user account that updated the task and the name of the task. The Logged date and time show when the task was updated. Look for the associated Event ID 200 and 201 for additional information. |
| 141 | Scheduled Task Deleted. The entry shows the user account that deleted the task and the name of the task. |
| 200 | Scheduled Task Executed. Shows the task name and the full path to the executable on disk that was run (listed as the Action). Correlate this with the associated Event ID 106 to determine the user account that scheduled the task. |
| 201 | Scheduled Task Completed. Shows the task name and the full path to the executable on disk that was run (listed as the Action). Correlate this with the associated Event ID 106 to determine the user account that scheduled the task. |
Also, see the Object Access Auditing section for additional Event IDs that may be recorded in relation to scheduled tasks.
Object Access Auditing
Object access auditing is not enabled by default but should be enabled on sensitive systems. To do so, simply set use the Local Security Policy to set Security Settings -> Local Policies -> Audit Policy -> Audit object access to Enabled for Success and Failure.
Object access audit events are stored in the Security log. If object access auditing is enabled, scheduled tasks get additional logging. The Event IDs related to scheduled tasks are:
Scheduled Task Event IDs
| Event ID | Description |
| 4698 | A scheduled task was created. The event description contains the user account that created the task in the Subject section. XML details of the scheduled task are also recorded in the event description under the Task Description section and includes the Task Name. |
| 4699 | A scheduled task was deleted. The Subject section of the event description contains the Account Name that deleted the task as well as the Task Name. |
| 4700 | A scheduled task was enabled. See Event ID 4698 for additional details. |
| 4701 | A scheduled task was disabled. See Event ID 4698 for additional details. |
| 4702 | A scheduled task was updated. The user who initiated the update appears in the Subject section of the event description. The details of the task after its modification are listed in the XML in the event description. Compare with previous Event ID 4702 or 4698 entries for this task to determine what changes were made. See Event ID 4698 for additional details. |
Aside from scheduled tasks, individual file objects are frequently audited for object access. In addition to enabling the option for Success and/or Failure for Audit Object Access as mentioned earlier, to audit access to individual files or folders you also need to explicitly set the auditing rules in the file or folder’s Properties
dialog box by selecting the Security tab, clicking Advanced, selecting the Auditing tab, and setting the type of audit and the user account(s) for which auditing should be set. Detailed instructions can be found here:
For a process to use a system object, such as a file, it must obtain a handle to that object. Once auditing is enabled, the event IDs described below can be used to view access to important files and folders by tracking the issuance and use of handles to those objects.
Object Handle Event IDs
| Event ID | Description |
| 4656 | A handle to an object was requested. When a process attempts to gain a handle to an audited object, this event is created. The details of the object to which the handle was requested and the handle ID assigned to the handle are listed in the Object section of the event description. |
| 4657 | A registry value was modified. The user account and process responsible for opening the handle are listed in the event description. . |
| 4658 | The handle to an object was closed. The user account and process responsible for opening the handle are listed in the event description. To determine the object itself, refer to the preceding Event ID 4656 with the same Handle ID. |
| 4660 | An object was deleted. The user account and process responsible for opening the handle are listed in the event description. To determine the object itself, refer to the preceding Event ID 4656 with the same Handle ID. |
| 4663 | An attempt was made to access an object. This event is logged when a process attempts to interact with an object, rather than just obtain a handle to the object. This can be used to help determine what types of actions may have been taken on an object (for example, read only or modify data). See Event ID 4656 for additional details. |
Since Windows 8/Server 2012, additional logging can also be enabled in the Group Policy Management Console by navigating to Computer Configuration -> Policies -> Windows Settings -> Security Settings -> Advanced Audit Policy Configuration -> Audit Policies -> Object Access -> Audit Removeable Storage. Once enabled, Windows will create additional Event ID 4663 entries (see above) whenever an account access a file system object that is on removable storage. This can help identify when users are copying data to or from external media.
Audit Policy Changes
When audit policy changes, it impacts the evidence available to investigators and incident handlers, whether the change was done maliciously by an attacker or legitimately by an administrator. Fortunately, modern Windows systems do a good job of logging these changes when they occur. The Event ID used for this auditing is 4719:
- 4719 – System audit policy was changed. The Audit Policy Change section will list the specific changes that were made to the audit policy. The Subject section of the event description may show the account that made the change, but often (such as when the change is made through Group Policy) this section simply reports the name of the local system.
- 1102 – Regardless of the settings in the audit policy, if the Security event log is cleared, Event ID 1102 will be recorded as the first entry in the new, blank log. You can tell the name of the user account that cleared the log in the details of the entry. A similar event, with ID 104, is generated in the System log if it is cleared.
Auditing Windows Services
Many attacks rely on Windows services either for executing commands remotely or for maintaining persistence on systems. While most of the events we have mentioned so far have been found in the Security Event Log, Windows records events related to starting and stopping of services in the System Event Log. The following events are often noteworthy:
- 6005 – The event log service was started. This will occur at system boot time, and whenever the system is manually started. Since the event log service is critical for security, it gets is own Event ID.
- 6006 – The event log service was stopped. While this obviously occurs at system shutdown or restart, its occurrence at other times may be indicative of malicious attempts to avoid logging of the activity or to modify the logs.
- 7034 – A service terminated unexpectedly. The event description will display the name of the services and may display the number of times that this service has crashed.
- 7036 – A service was stopped or started. While the event log service has its own Event ID, other services are logged under the same Event ID.
- 7040- The start type for a service was changed. The event description will display the name of the service that was changed and describe the change that was made.
- 7045 – A service was installed by the system. The name of the service is found in the Service Name field of the event description, and the full path to the associated executable is found in the Service File Name field. This can be a particularly important event as many tools, such as psexec, create a service on the remote system to execute commands.
If you have enabled Advanced Audit Policy Configuration > System Audit Policies > System > Audit Security System Extension in your GPOs, Windows 10 and Server 2016/2019 systems will also record Event ID 4697 in the Security event log.
Wireless LAN Auditing
Windows maintains an event log dedicated to wireless local area network (WLAN) activity, and with rogue access points being a common attack vector for man-in-the-middle and malware attacks, it may be worth looking at unusual connections on devices with Wi-Fi capability, particularly those allowed to leave your environment. The log is located at %SystemRoot%\System32\winevt\Logs\Microsoft-Windows-WLAN- AutoConfig%4Operational.evtx. Event IDs of interest are:
Wi-Fi Connection Event IDs
| Event ID | Description |
| 8001 | WLAN service has successfully connected to a wireless network. The event description provides the Connection Mode indicating if this was an automatic connection based on a configured profile (and the associated Profile Name) or a manual connection. The SSID of the access point, its authentication mechanism, and its encryption mechanism are also recorded. |
| 8002 | WLAN service failed to connect to a wireless network. Once again, the event description will contain the Connection Mode, associated Profile Name, and the SSID along with a Failure Reason field. |
Process Tracking
Unlike many Linux shells (such as bash) the Windows cmd.exe shell does not maintain a history of commands run by users. This has created a noticeable gap in the ability of incident handlers to understand the actions that an attacker takes on a compromised host. The rise of “Living of the Land” attacks that do not rely on malware but instead use built-in Windows commands has only made this blind spot more damaging. While in the early days of Windows, auditing process creation was considered far too system
While not always required on every system, enabling this feature on key systems is increasingly becoming standard practice in security-conscious environments. This requires setting two separate Group Policy settings. The first is of course Computer Configuration -> Windows Settings -> Security Settings -> Local Policies -> Audit Policy -> Audit process tracking. Once enabled, Event ID 4688 in the Security log provides a wealth of information regarding processes that have been run on the system:
| Event ID | Description |
| 4688 | A new process has been created. The event description provides the Process ID and Process Name, Creator Process ID, Creator Process Name, and Process Command Line (if enabled separately, as outlined earlier in this section). |
In addition the Event ID 4688, activation of process tracking may also result in additional Security log entries from the Windows Filtering Platform related to network connections and listening ports as follows:
Windows Filtering Platform (WFP) Event IDs
| Event ID | Description |
| 5031 | The Windows Firewall Service blocked an application from accepting incoming connections on the network. |
| 5152 | The WFP blocked a packet. |
| 5154 | The WFP has permitted an application or service to listen on a port for incoming connections. |
| 5156 | The WFP has allowed a connection. |
| 5157 | The WFP has blocked a connection. |
| 5158 | The WFP has permitted a bind to a local port. |
| 5159 | The WFP has blocked a bind to a local port. |
The event descriptions of the Windows Filtering Platform events are self explanatory and detailed, including information about the local and remote IPs and port numbers as well as the Process ID and Process Name involved.
As can be seen, the information logged by enabling process tracking auditing can be of immense value, but can also generate a large amount of data. Experiment with your test environment to come up with a balance that can appropriately increase security auditing in your production environment.
Additional Program Execution Logging
If AppLocker is configured in your environment (a step that can help frustrate an adversary and should be considered), dedicated AppLocker event logs will be generated as well. Presented in Event Viewer under Application and Services Logs\Microsoft\Windows\AppLocker, these event logs are stored with the other event logs in C:\Windows\System32\winevt\Logs and have names such as Microsoft-Windows- AppLocker%4EXE and DLL.evtx. There are separate logs covering executables and dynamic-link libraries (DLLs), Microsoft installers (MSI) and scripts, packaged app deployment, and packaged app execution. The event logs generated will vary depending on whether AppLocker is set to audit-only mode or blocking mode. Details of the specific event IDs that may apply to your situation can be found at here.
Windows Defender Suspicious Event IDs
| Event ID | Description |
| 1006 | The antimalware engine found malware or other potentially unwanted software. |
| 1007 | The antimalware platform performed an action to protect your system from malware or other potentially unwanted software. |
| 1008 | The antimalware platform attempted to perform an action to protect your system from malware or other potentially unwanted software, but the action failed. |
| 1013 | The antimalware platform deleted history of malware and other potentially unwanted software. |
| 1015 | The antimalware platform detected suspicious behavior. |
| 1116 | The antimalware platform detected malware or other potentially unwanted software. |
| 1117 | The antimalware platform performed an action to protect your system from malware or other potentially unwanted software. |
| 1118 | The antimalware platform attempted to perform an action to protect your system from malware or other potentially unwanted software, but the action failed. |
| 1119 | The antimalware platform encountered a critical error when trying to take action on malware or other potentially unwanted software. |
| 5001 | Real-time protection is disabled. |
| 5004 | The real-time protection configuration changed. |
| 5007 | The antimalware platform configuration changed. |
| 5010 | Scanning for malware and other potentially unwanted software is disabled. |
| 5012 | Scanning for viruses is disabled. |
Additional details on Windows Defender event log records can be found here.
Windows exploit protection is a feature of Windows 10 that can provide excellent defense against a range of adversary exploitation techniques. This feature can protect both the operating system and individual applications from common attack vectors, blocking the exploitation when it otherwise would have resulted in system compromise. Although some features of exploit protection are enabled by default, many are disabled due to their potential to interfere with legitimate software. When enabled, this feature logs its activities in the C:\Windows\System32\winevt\Logs\Microsoft-Windows-Security- Mitigations%4KernelMode.evtx and Microsoft-Windows-Security-Mitigations%4UserMode.evtx log files.
More details can be found here.
Another option to enhance visibility into processes that run on systems in your environment is to implement Sysmon, a free utility by Sysinternals, which is now a part of Microsoft. Sysmon can be freely downloaded here.
When deployed on a system, Sysmon installs as a system service and device driver to generate event logs related to processes, network connections, and modifications to file creation times. It creates a new category of logs that are presented in Event Viewer under Applications and Services Logs\Microsoft\Windows\Sysmon\Operational and is stored in C:\Windows\System32\winevt\Logs\Microsoft-Windows-Sysmon%4Operational.evtx. An example of useful event IDs generated by Sysmon include:
Event IDs Generated by Sysmon
| Event ID | Description |
| 1 | Process creation (includes many details such as process ID, path to executable, hash of executable, command line used to launch, user account used to launch, parent process ID, path and command line for parent executable, and more). |
| 2 | A process changed a file creation time. |
| 3 | Network connection. |
| 4 | Sysmon service state changed. |
| 5 | Process terminated. |
| 6 | Driver loaded. |
| 7 | Image loaded (records when a module is loaded in a specific process). |
| 8 | CreateRemoteThread (creating a thread in another process). |
| 9 | RawAccessRead (raw access to drive data using \\.\ notation). |
| 10 | ProcessAccess (opening access to another process’s memory space). |
| 11 | FileCreate (creating or overwriting a file). |
| 12 | Registry key or value created or deleted. |
| 13 | Registry value modification. |
| 14 | Registry key or value renamed. |
| 15 | FileCreateStreamHash (creation of an alternate data stream). |
| 16 | Sysmon configuration change. |
| 17 | Named pipe created. |
| 18 | Named pipe connected. |
| 19 | WMIEventFilter activity detected. |
| 20 | WMIEventConsumer activity detected. |
| 21 | WMIEventConsumerToFilter activity detected. |
| 22 | DNS query event (Windows 8 and later) |
| 255 | Sysmon error |
Auditing PowerShell Use
Microsoft continues to increase the amount of logs available surrounding PowerShell to help combat its nefarious use. Once again, these logging facilities must be enabled via Group Policy, specifically at Computer Configuration -> Policies -> Administrative Templates -> Windows Components -> Windows PowerShell. There are three basic categories of logging that may be available, depending on the version of Windows in question.
- Module Logging
- Logs pipeline execution events;
- Logs to event logs.
- Script Block Logging
- Captures de-obfuscated commands sent to PowerShell;
- Captures the commands only, not the resulting output;
- Logs to event logs.
- Transcription
- Captures PowerShell input and output;
- Will not capture output of outside programs that are run, only PowerShell;
- Logs to text files in user specified location.
Once enabled, these logs can provide a wealth of information concerning the use of PowerShell on your systems. If you routinely run lots of PowerShell scripts, this can produce a large volume of data, so be sure to test and tune the audit facilities to strike a balance between visibility and load before deploying such changes in production.
PowerShell event log entries appear in different event logs. Inside of %SystemRoot%\System32\winevt\ Logs\Microsoft-Windows-PowerShell%4Operational.evtx you will find two events of particular note:
| Event ID | Description |
| 4103 | Shows pipeline execution from the module logging facility. Includes the user context used to run the commands. Hostname field will contain Console if executed locally or will show if run from a remote system. |
| 4104 | Shows script block logging entries. Captures the commands sent to PowerShell, but not the output. Logs full details of each block only on first use to conserve space. Will show as a Warning level event if Microsoft deems the activity Suspicious. |
Additional entries can be found in the %SystemRoot%\System32\winevt\Logs\Windows PowerShell.evtx log:
| Event ID | Description |
| 400 | Indicates the start of command execution or session. Hostname field shows if (local) Console or the remote session that caused the execution. |
| 800 | Shows pipeline execution details. UserID shows account used. Hostname field shows if (local) Console or the remote session that caused the execution. Since many malicious scripts encode options with Base64, check the HostApplication field for options encoded with the -enc or -EncodedCommand parameter. |
Remember that PowerShell Remoting requires authenticated access, so look for the associated Account Logon and Logon events as well.
Author Credits: Forward Defence
Also Read
- Top 10 Best Open Source Intelligence Tools (OSINT Tools)
- Top 10 Cyber Attack Maps to See Digital Threats
- Top 10 SMTP Test Tools
- 10 Best Advanced Endpoint Security Tools
- Top 10 Best SysAdmin Tools
This is my write-up on THM’s Windows Event Logs Room.
Task 1: What are event logs?
Event logs essentially contain the records of events or activities that have transpired in a machine or host, that would help system administrators, IT technicians, etc, audit and trouble shoot issues in the system.
But for blue teams, windows event logs serve a different purpose. These logs are analyzed for malicious activities or indicators of compromise. Windows Event Logs can also be forwarded to SIEMs where analyst can aggregate, analyze, and correlate log data from various sources to provide security insights of a network.
For a Linux system, the logging system is knows as Syslog.
Task 2: Event Viewer
The Windows Event Logs are stored with an .evt or .evtx extension and are located in C:\\Windows\\System32\\winevt\\Logs.
Before moving on to Event Viewer, we first need to understand the different elements of a Windows Event Logs system. This would help us understand where to look at if we are trying to solve an issue or analyzing a specific kind of event.
- System Logs: Records events associated with the Operating System segments. They may include information about hardware changes, device drivers, system changes, and other activities related to the device.
- Security Logs: Records events connected to logon and logoff activities on a device. The system’s audit policy specifies the events.
- Application Logs: Records events related to applications installed on a system. The main pieces of information include application errors, events, and warnings.
- Directory Service Events: Active Directory changes and activities are recorded in these logs, mainly on domain controllers.
- File Replication Service Events: Records events associated with Windows Servers during the sharing of Group Policies and logon scripts to domain controllers, from where they may be accessed by the users through the client servers.
- DNS Event Logs: DNS servers use these logs to record domain events and to map out
- Custom Logs: Events are logged by applications that require custom data storage. This allows applications to control the log size or attach other parameters, such as ACLs, for security purposes.
The following table describes the five event types used in event logging.
| Event type | Description |
|---|---|
| Error | An event that indicates a significant problem such as loss of data or loss of functionality. For example, if a service fails to load during startup, an Error event is logged. |
| Warning | An event that is not necessarily significant, but may indicate a possible future problem. For example, when disk space is low, a Warning event is logged. If an application can recover from an event without loss of functionality or data, it can generally classify the event as a Warning event. |
| Information | An event that describes the successful operation of an application, driver, or service. For example, when a network driver loads successfully, it may be appropriate to log an Information event. Note that it is generally inappropriate for a desktop application to log an event each time it starts. |
| Success Audit | An event that records an audited security access attempt that is successful. For example, a user’s successful attempt to log on to the system is logged as a Success Audit event. |
| Failure Audit | An event that records an audited security access attempt that fails. For example, if a user tries to access a network drive and fails, the attempt is logged as a Failure Audit event. |
Event Viewer
The Windows Event Logs can be accessed with three methods; Event Viewer, Wevtutil.exe (command-line), and Get-WinEvent (PowerShell). The latter two methods will be discussed in the succeeding tasks.
Event Viewer allows interaction with and analyzing the logs in a GUI application.
Event Viewer can be started by right-clicking the Windows icon and selecting Event Viewer.
Or by typing “eventvwr.msc” in the command line.
Answer the questions below
For the questions below, use Event Viewer to analyze Microsoft-Windows-PowerShell/Operational log.
What is the Event ID for the first recorded event?
Answer: 40961
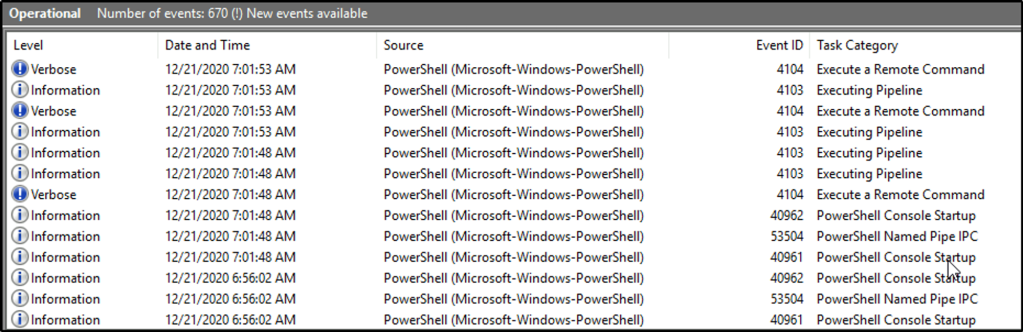
Open Event Viewer and go to Applications and Services Logs then to Microsoft > Powershell > Operational log.
The first event is found at the bottom of the window pane. We can also click on “Date and Time” column to sort the events based on the date and time of the occurrence of events.
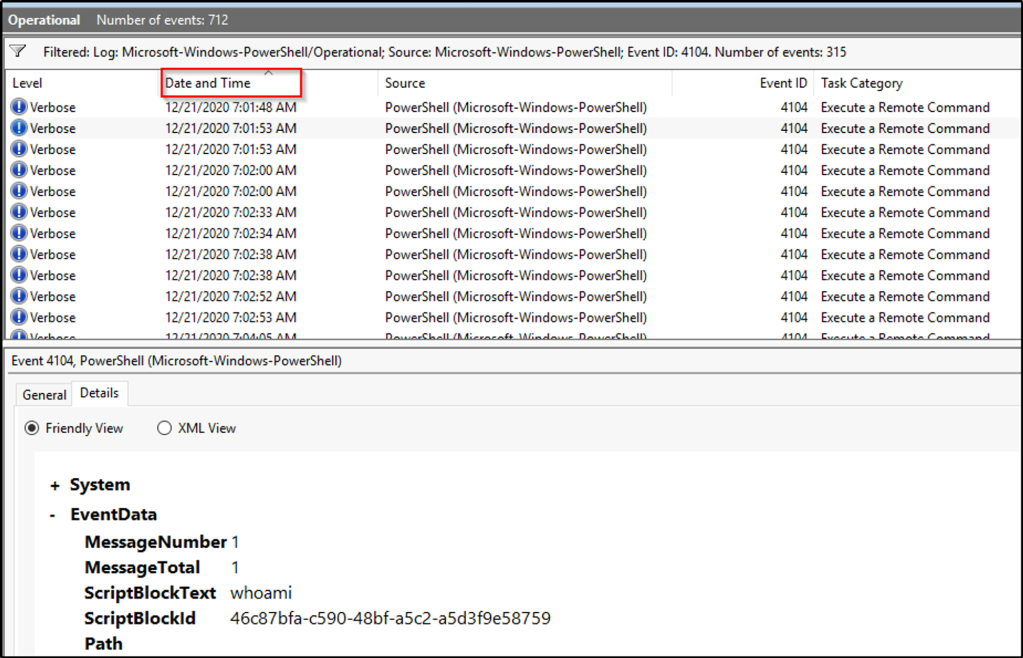
Filter on Event ID 4104. What was the 2nd command executed in the PowerShell session?
Answer: whoami
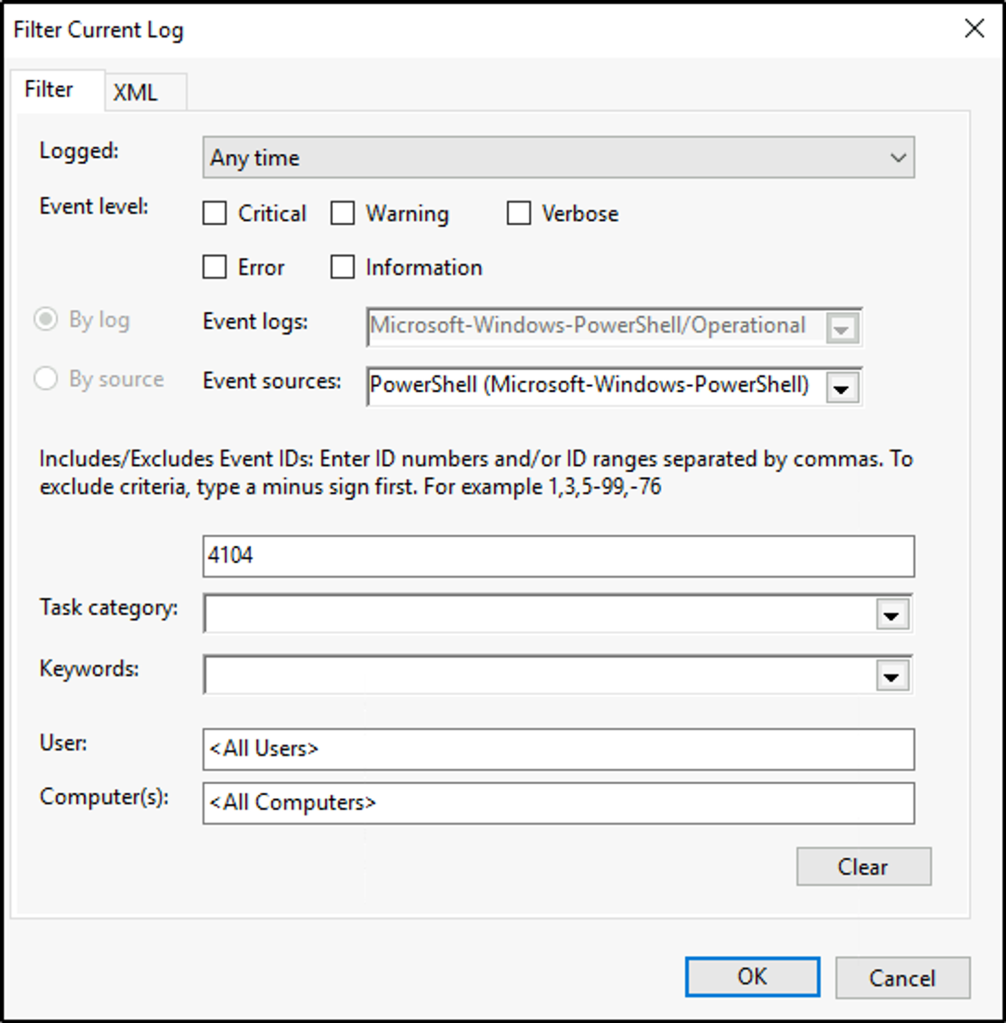
To create a filter, go to the right pane. Under “Operational” click on “Filter current Log”
We will filter the events with the Event ID 4104.
Once the results are in, sort the events based on date and time. Select the second event. Select the “Details” tab and the PowerShell command is displayed with the tag “ScriptBlockText”.
What is the Task Category for Event ID 4104?
Answer: Execute a Remote Command
We can find the answer by looking at the middle pane, similar to the image above. The “Task Category” column shows the category for Event ID 4104.
Analyze the Windows PowerShell log. What is the Task Category for Event ID 800?
Answer: Pipeline Execution Details
Clear the filter first. We would be returned to the same PowerShell event logs.
The middle pane, under the “Task Category” column would show the task category for Event ID 800.

Task 3: wevtutil.exe
Wevtutil.exe (Windows Event Utility) is a command line tool that would help us query event logs. By writing scripts with this tool, we would be more efficient in sifting through thousands of event logs.
To access its help files, we will run wevtutil.exe /?.
The tool would follow this syntax.
- wevtutil COMMAND [ARGUMENT [ARGUMENT] …] [/OPTION:VALUE [/OPTION:VALUE] …]
The commands are the following:
el  | enum-logs        List log names.
gl  | get-log          Get log configuration information.
sl  | set-log          Modify configuration of a log.
ep  | enum-publishers  List event publishers.
gp  | get-publisher    Get publisher configuration information.
im  | install-manifest Install event publishers and logs from manifest.
um  | uninstall-manifest Uninstall event publishers and logs from manifest.
qe  | query-events     Query events from a log or log file.
gli | get-log-info     Get log status information.
epl | export-log       Export a log.
al  | archive-log      Archive an exported log.
cl  | clear-log        Clear a log.
Note: We can use the short or long versions of the command, example el or enum-logs
Common options are;
Common Options:

/{r | remote}:VALUE
If specified, run the command on a remote computer. VALUE is the remote computer name. Options /im and /um do not support remote operations.

/{u |username}:VALUE
Specify a different user to log on to the remote computer. VALUE is a user name in the form of domain\\user or user. Only applicable when option /r is specified.

/{p | password}:VALUE
Password for the specified user. If not specified, or if VALUE is "*", the user will be prompted to enter a password. Only applicable when the /u option is specified.

/{a | authentication}:[Default|Negotiate|Kerberos|NTLM]
Authentication type for connecting to remote computer. The default is Negotiate.

/uni | unicode}:[true|false]
Display output in Unicode. If true, then output is in Unicode.

To learn more about a specific command, type the following:

wevtutil COMMAND /?
If we want to know how to use a specific command, as provided in the help files, we will use wevtutil COMMAND /?. For example, if we want to get more information on the command qe (query-events), we would use wevtutil qe /?.
More info can be found on docs.microsoft.com.
Answer the questions below
How many log names are in the machine?
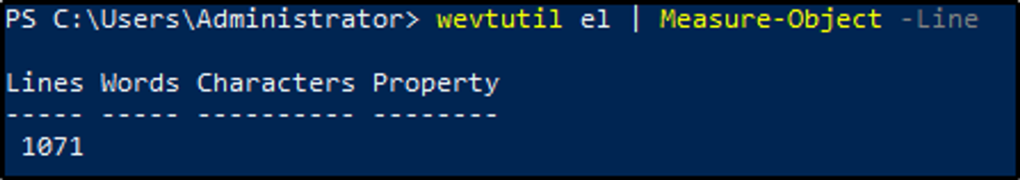
Answer: 1071
The command el would list the log names and the results would then be piped to the next command to count the list of log names by line.
wevtutil el | Measure-Object -Line
What event files would be read when using the query-events command?
Answer: event log, log file, structured query
For us to find more info about the command, we would use wevtutil qe /?.

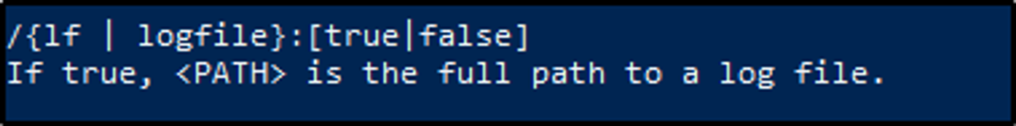
What option would you use to provide a path to a log file?
Answer: /lf:true
After running the command, we see the options we can use with qe. The option we would use to include a log file path is /lf:true.
What is the VALUE for /q?
Answer: query XPATH
Scrolling through the options, we can see the value for /q? is XPATH query.

The questions below are based on this command: wevtutil qe Application /c:3 /rd:true /f:text
What is the log name?
Answer: Application
From the command given to us, wevtutil is querying events from Application logs.
What is the /rd option for?
Answer: event read redirection
When we run wevtutil qe /?, we would see the options for this command. /rd would refer to event read redirection.

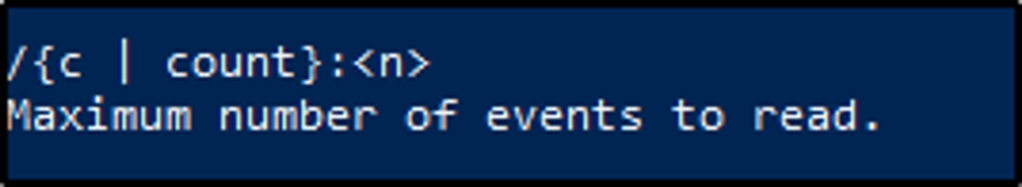
What is the /c option for?
Answer: Maximum number of events to read
/c option refers to the number of events that we wold want to query from the logs.
Task 4: Get-WinEvent
Get-WinEventis a Powershell cmdlet. Per Microsoft, the Get-WinEvent cmdlet “gets events from event logs and event tracing log files on local and remote computers.” The tool can provide information on event logs and event log providers. We can also combine events from different sources by using a single command and filtering these events with XPath queries, structured XML queries, and hash table queries.
Note: The Get-WinEvent cmdlet replaced the Get-EventLog cmdlet.
Refer to the Get-Help information online at docs.microsoft.com.
Examples of how to use Get-WinEvent
Example 1: Get all logs from a computer
The first list will be classic logs, then by new Windows Event logs. RecordCount can have zero or null logs.
Example 2: Get event log providers and log names
This will get us the event log providers and their associated logs. The Name is the provider, and LogLinks is the log that is written to.
Get-WinEvent -ListProvider *
Example 3: Log filtering
Log filtering allows us to select events from an event log. We can then filter event logs from a specific Provider using the Where-Object cmdlet:
Get-WinEvent -LogName Application | Where-Object { $_.ProviderName -Match 'WLMS' }
Where-Object is inefficient to use when working with large event logs. Therefore, the suggested Get-WinEvent cmdlet’s FilterHashtable parameter is recommended to filter event logs.
Get-WinEvent -FilterHashtable @{
LogName='Application'
ProviderName='WLMS'
}
Get-WinEvent -FilterHashtable @{ LogName='Application'; ProviderName= 'WLMS'}
The syntax of a hash table is as follows:
@{ <name> = <value>; [<name> = <value> ] ...}
Guidelines for defining a hash table are:
- Begin the hash table with an @ sign.
- Enclose the hash table in braces {}
- Enter one or more key-value pairs for the content of the hash table.
- Use an equal sign (=) to separate each key from its value.
Note: Using semicolon is not needed if each key/value are separated with a new line, as in the first set of commands above for the -FilterHashtable for ProviderName='WLMS'.
Below is a table that displays the accepted key/value pairs for the Get-WinEvent FilterHashtable parameter.
| Key name | Value data type | Accepts wildcard characters? |
|---|---|---|
| LogName | <String[]> |
Yes |
| ProviderName | <String[]> |
Yes |
| Path | <String[]> |
No |
| Keywords | <Long[]> |
No |
| ID | <Int32[]> |
No |
| Level | <Int32[]> |
No |
| StartTime | <DateTime> |
No |
| EndTime | <DateTime> |
No |
| UserID | <SID> |
No |
| Data | <String[]> |
No |
<named-data> |
<String[]> |
No |
Check the official Microsoft documentation docs.micro-soft.com for more info on querying using Filterhashtable.
Here is a command by @mubix on using Get-WinEvent -FilterHashtable
Get-WinEvent -FilterHashtable @{LogName='Microsoft-Windows-PowerShell/Operational'; ID=4104} | Select-Object -Property Message | Select-String -Pattern 'SecureString'
Answer the questions below
Answer the following questions using the online help documentation for Get-WinEvent
Execute the command from Example 1 (as is). What are the names of the logs related to OpenSSH?
Answer: OpenSSH/Admin,OpenSSH/Operational
We will use the command from example 1, then pipe the result to find the strings that matches ssh. We see two logs being displayed.
Get-WinEvent -ListLog * | findstr /i ssh
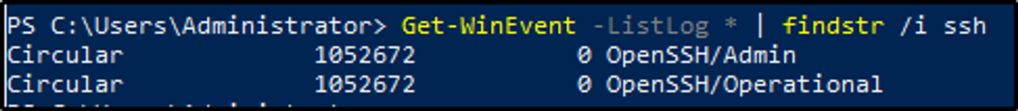
Execute the command from Example 8. Instead of the string Policy search for PowerShell. What is the name of the 3rd log provider?
Answer: Microsoft-Windows-PowerShell-DesiredStateConfiguration-FileDownloadManager
We will simply copy the command and change the string policy to Powershell. This will display all events relatd to the filter.
Get-WinEvent -ListProvider *Powershell*
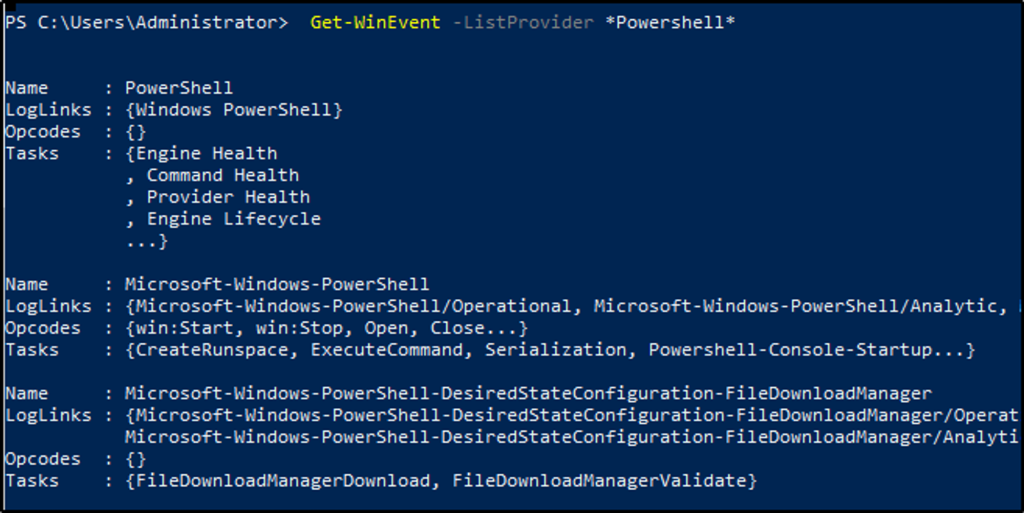
Alternatively, we can modify the command to display only the third log provider.
Get-WinEvent -ListProvider *Powershell* | Select-Object -Property Name -Skip 2 -First 1
Execute the command from Example 9. Use Microsoft-Windows-PowerShell as the log provider. How many event ids are displayed for this event provider?
Answer: 192
We will be using the provided command and changing the log provider to Microsoft-Windows-PowerShell. We will also be modifying it by adding Measure-Object -Line to count the results by line.

(Get-WinEvent -ListProvider Microsoft-Windows-PowerShell).Events | Format-Table Id, Description | Measure-Object -Line
How do you specify the number of events to display?
Answer: -MaxEvents
Example 13 provided us the options we can use to display only a certain number of events.
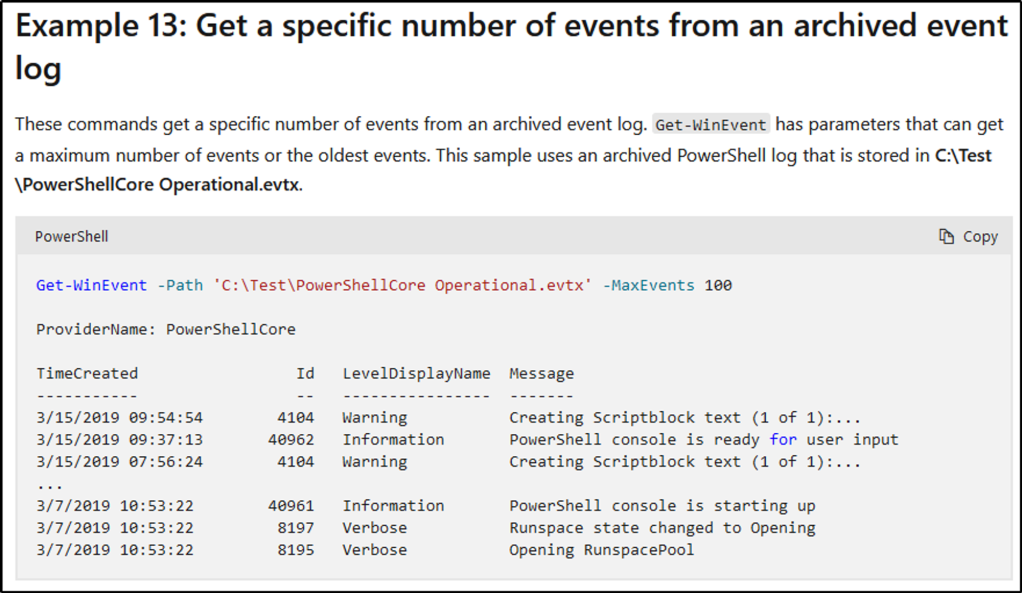
If we want to know more about -MaxEvents, we could use the Get-Help cmdlet.
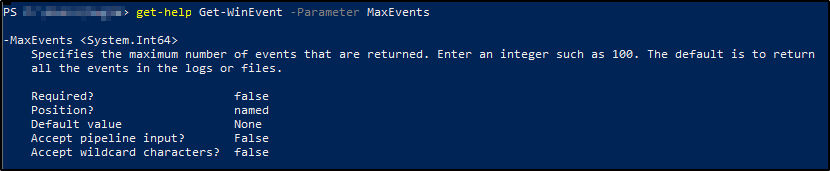
When using the FilterHashtable parameter and filtering by level, what is the value for Informational?
Answer: 4
This resource for FilterHashtable contains the numerical value of each Level.
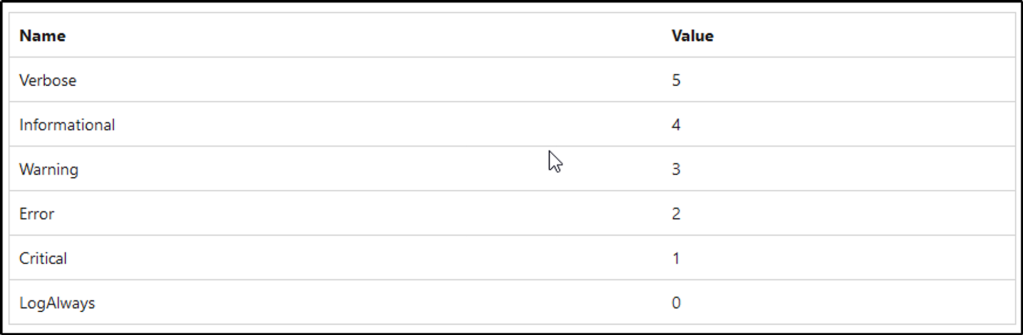
Task 5: XPath Queries
The third method of filtering events is by using XPath or XML Path Language, which was created by W3C. The Windows Event Log supports a subset of XPath 1.0.
Here is an example of an XPath query along with its explanation:
// The following query selects all events from the channel or log file where the severity level is less than or equal to 3 and the event occurred in the last 24 hour period.
XPath Query: *[System[(Level <= 3) and TimeCreated[timediff(@SystemTime) <= 86400000]]]
See docs.microsoft.com for more examples of XPath queries.
Note: An XPath event query starts with ‘*’ or ‘Event‘. wevtutil and Get-WinEvent support XPath queries.
To create an XPath query, Event Viewer would be the reference point.
We look at the bottom of the middle pane, click on the “Details” tab and select the “XML View”. The sructure presented would help use construct a valid XPath query.
The first tag is the starting point. This can either be an ‘*' or Event.
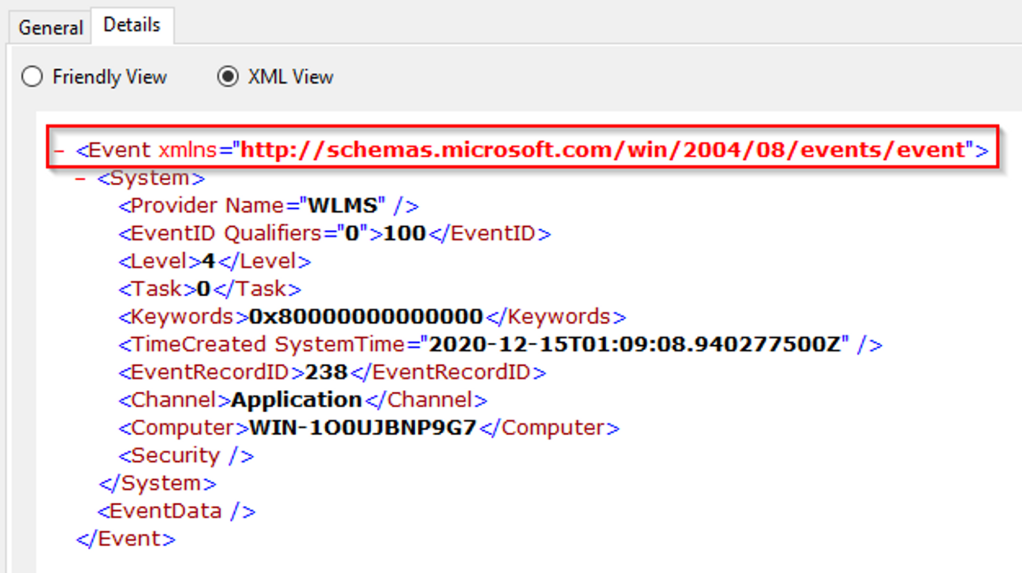
The command would look like this:
Get-WinEvent -LogName Application -FilterXPath '*'Working our way down, the next tag is System.

Let’s add that to our command:
Get-WinEvetnt -LogName Application -FilterXPath '*/System/'Next is the EventID tag. We would use the tag name and include the Event ID we want to filter. In this example, the Event ID is 100.
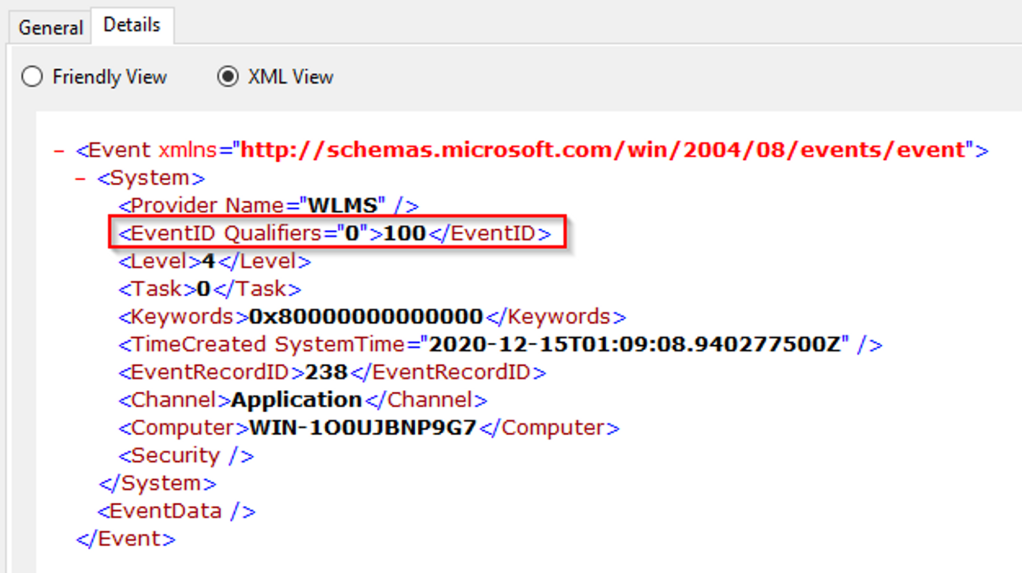
The command would look like something like this:
Get-WinEvetnt -LogName Application -FilterXPath '*/System/EventID=100'The following would be the result if using wevtutil.exe and XPath to query for the same event log and ID.:
wevtutil.exe qe Application /q:*/System[EventID=100] /f:text /c:1
Two additional options were added to filter only one event with no XML tags.
If we want to query a different element, such as the Provider Name, we need to use the Name attribute of Provider.
Therefore, to query for the Provider name with XPath:
Get-WinEvent -LogName Application -FilterXPath '*/System/Provider[@Name="WLMS"]'
We can also combine two queries in one command.
For example, if we want to query Event IDs of 100 with the Provider Name “WLMS”, we would arrive at this command:
Get-WinEvent -LogName Application -FilterXPath '*/System/Provider[@Name="WLMS"]'
Creating XPath queries with EventData
Querying for elements within EventData with XPath will be a little bit different
Note: The EventData element doesn’t always contain information.
We will use the below XML view of an event to build the XPath query
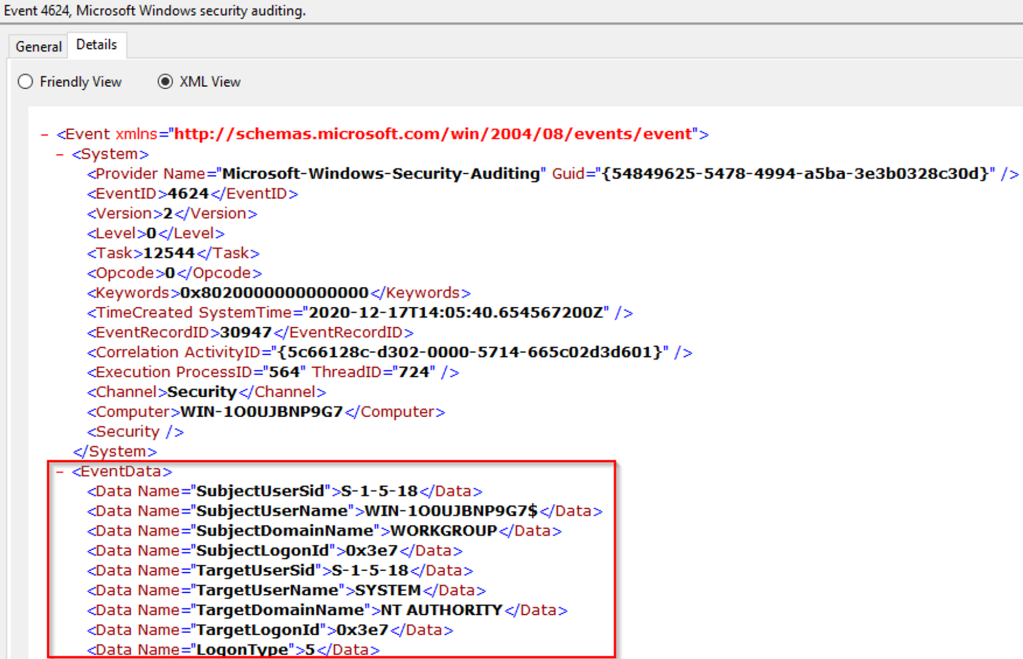
For this example, we will be creating a query for the TargetUserName of System. The XPath query would be:
Get-WinEvent -LogName Security -FilterXPath '*/EventData/Data[@Name="TargetUserName"]="System"' -MaxEvents 1
The parameter -MaxEvents will return just 1 event.
Read the official Microsoft XPath Reference for more information.
Answer the questions below
Using the knowledge gained on Get-WinEvent and XPath, what is the query to find WLMS events with a System Time of 2020-12-15T01:09:08.940277500Z?
Answer: Get-WinEvent -LogName Application -FilterXPath ‘*/System/Provider[@Name=”WLMS”] and */System/TimeCreated[@SystemTime=”2020-12-15T01:09:08.940277500Z”]’
The steps provided above in building an XPath query would help us create the command.
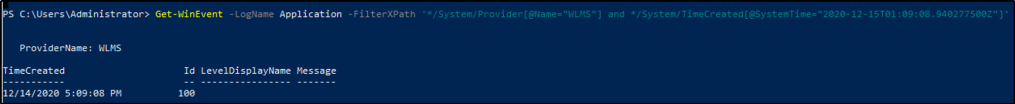
Using Get-WinEvent and XPath, what is the query to find a user named Sam with an Logon Event ID of 4720?
Answer: Get-WinEvent -LogName Security -FilterXPath ‘*/EventData/Data[@Name=”TargetUserName”]=”Sam” and */System/EventID=4720’
We will be be creating two queries in one command. The first query is to query within the EventData the tag TargetUsername, and specifying the username to be “Sam”. The second query is within Event, looking through System, and specifying the EventID of 4720.
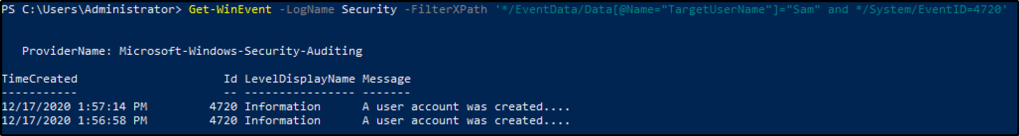
Based on the previous query, how many results are returned?
Answer: 2
We got two results.
Based on the output from the question #2, what is Message?
Answer: A user account was created
The query filters user account creation.
Still working with Sam as the user, what time was Event ID 4724 recorded? (MM/DD/YYYY H:MM:SS [AM/PM])
Answer: 12/17/2020 1:57:14 PM
Working with the same command from above, we just need to change the EventID to 4724.
Get-WinEvent -LogName Security -FilterXPath '*/EventData/Data[@Name="TargetUserName"]="Sam" and */System/EventID=4724'
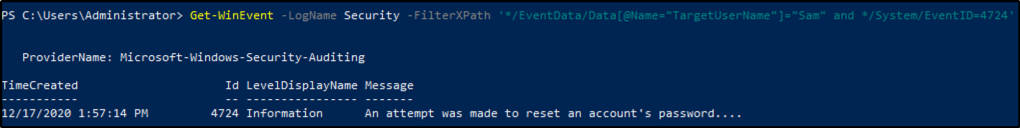
What is the Provider Name?
Answer: Microsoft-Windows-Security-Auditing
We found the answer when we run the command from above.
Task 6: Event IDs
With the large number of Event IDs in use, we will definitely need resources to help us monitor and hunt events. This section will be covering us in that aspect.
First on the list is The Windows Logging Cheat Sheet (Windows 7 – Windows 2012). The last version update is October 2016, but it’s still a good resource. The document covers a few things that need to be enabled and configured and what event IDs to look for based on different categories, such as Accounts, Processes, Log Clear, etc.
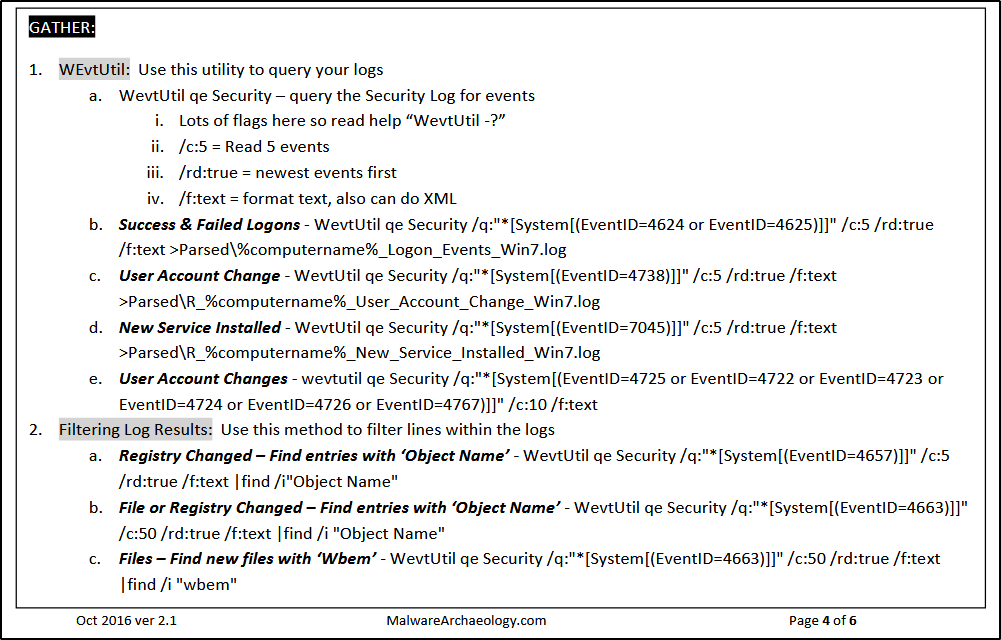
From the resource, if we want to detect if a new service was installed, look for Event ID 7045 within the System Log. The command would be as follows
wevtutil qe System /q:"*/System[EventID=7045]" /c:5 /rd:true /f:text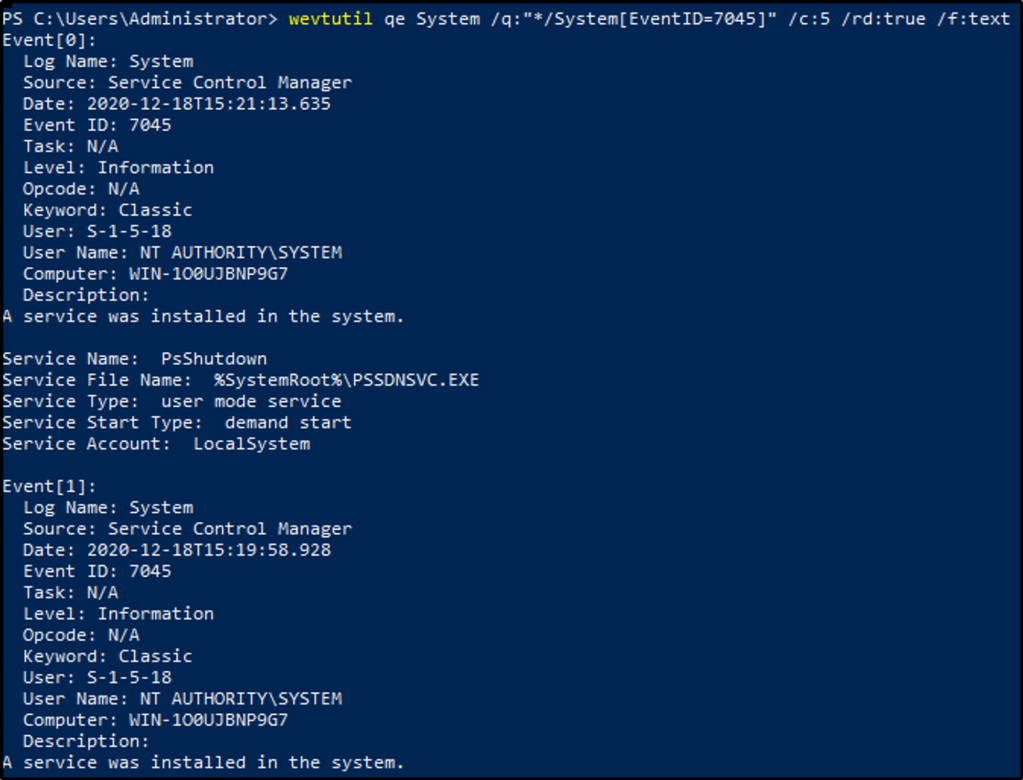
Spotting the Adversary with Windows Event Log Monitoring is another resource.
I was unable though to connect and download the resource.
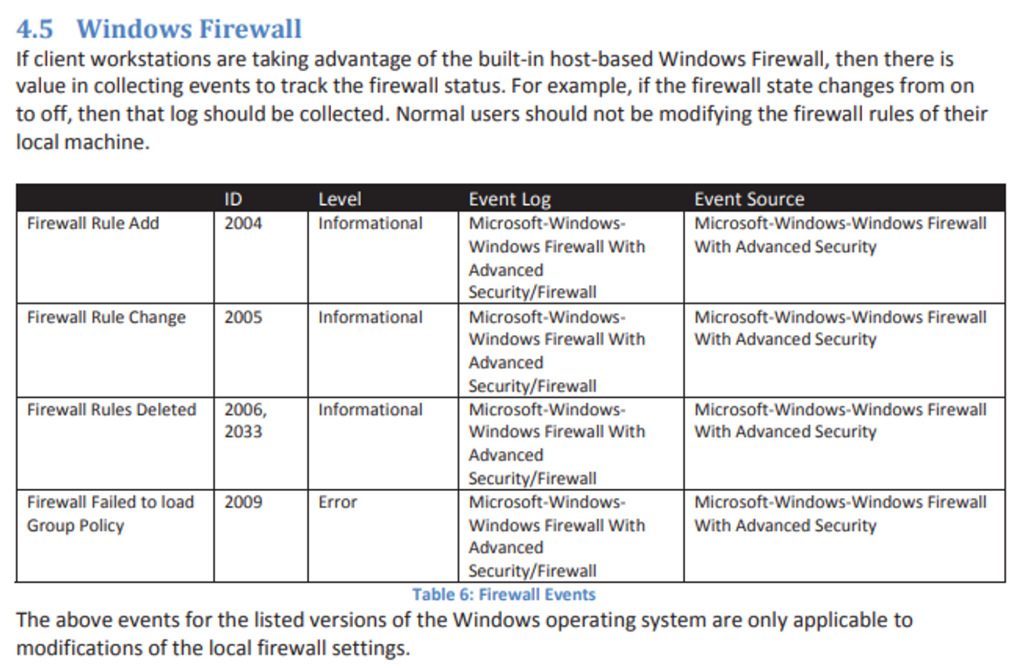
But from the room, a snippet is provided from the document where we see Event IDs related to Firewall Rules.
MITRE ATT&CK is also on the list for monitoring or hunting Event IDs.
We can look at a Technique and identify the related Event IDs that we should monitor and hunt. For example, if we look at ATT&CK ID T1098 (Account Manipulation), the “Detection” section contains the Event IDs that are triggered.
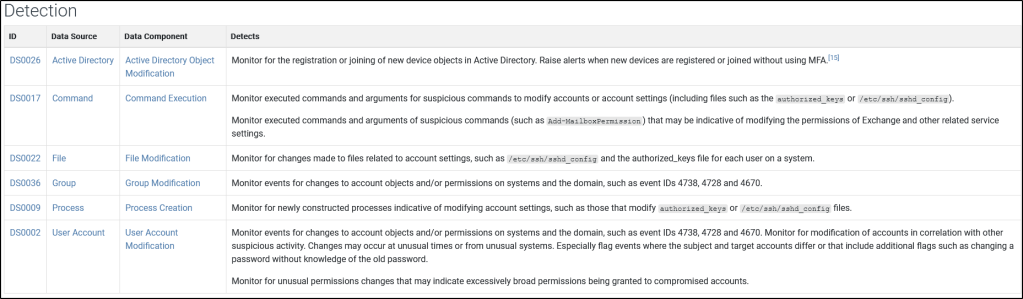
The MITRE ATT&CK framework also contains information on how to mitigate each techniques.
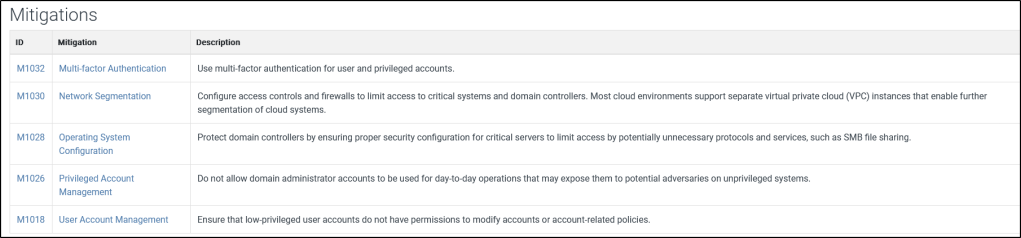
The last two resources are from Microsoft:
- Events to Monitor (Best Practices for Securing Active Directory)
- The Windows 10 and Windows Server 2016 Security Auditing and Monitoring Reference (a comprehensive list [over 700 pages])
- Here is a snippet of the 700-page Windows 10 and Windows Server 2016 Security Auditing and Monitoring Reference
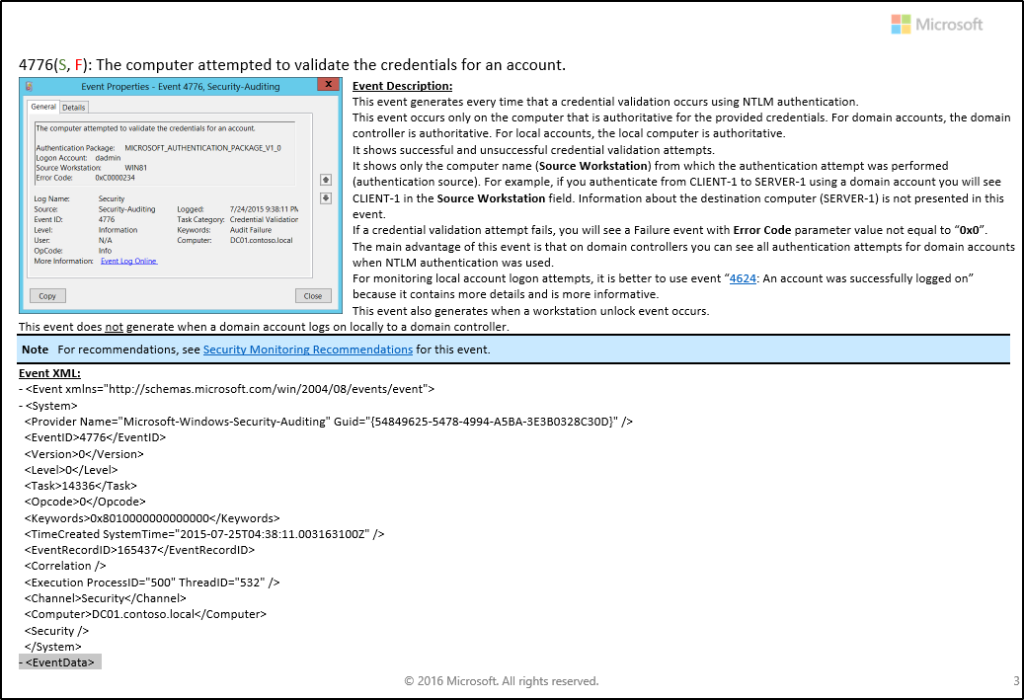
Note: There are certain events that are not generated by default, one of them is PowerShell logging. This feature can be enabled via Group Policy or the Registry.
Local Computer Policy > Computer Configuration > Administrative Templates > Windows Components > Windows PowerShell
Press the Windows icon on the keyboard + R to open the Run dialog and type gedit.msc to open the Group Policy Management Console.
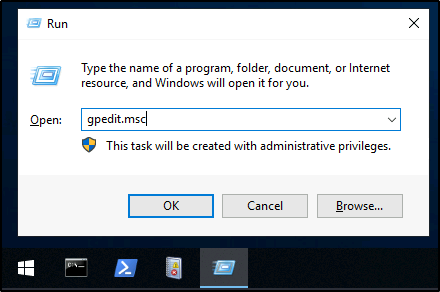
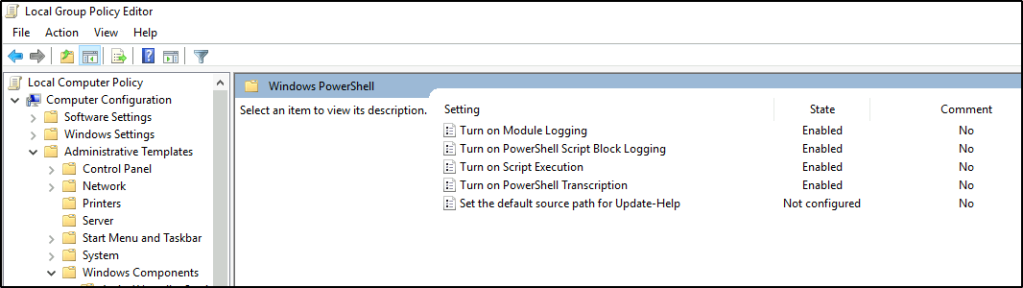
Some resources to provide more information about enabling this feature, along with its associated event IDs:
- About Logging Windows
- Greater Visibility Through PowerShell Logging
- Configure PowerShell logging to see PowerShell anomalies in Splunk UBA
Another feature to enable/configure is Audit Process Creation, which will generate event ID 4688 and will allow command-line process auditing.
Local Computer Policy > Computer Configuration > Administrative Templates > System > Audit Process Creation

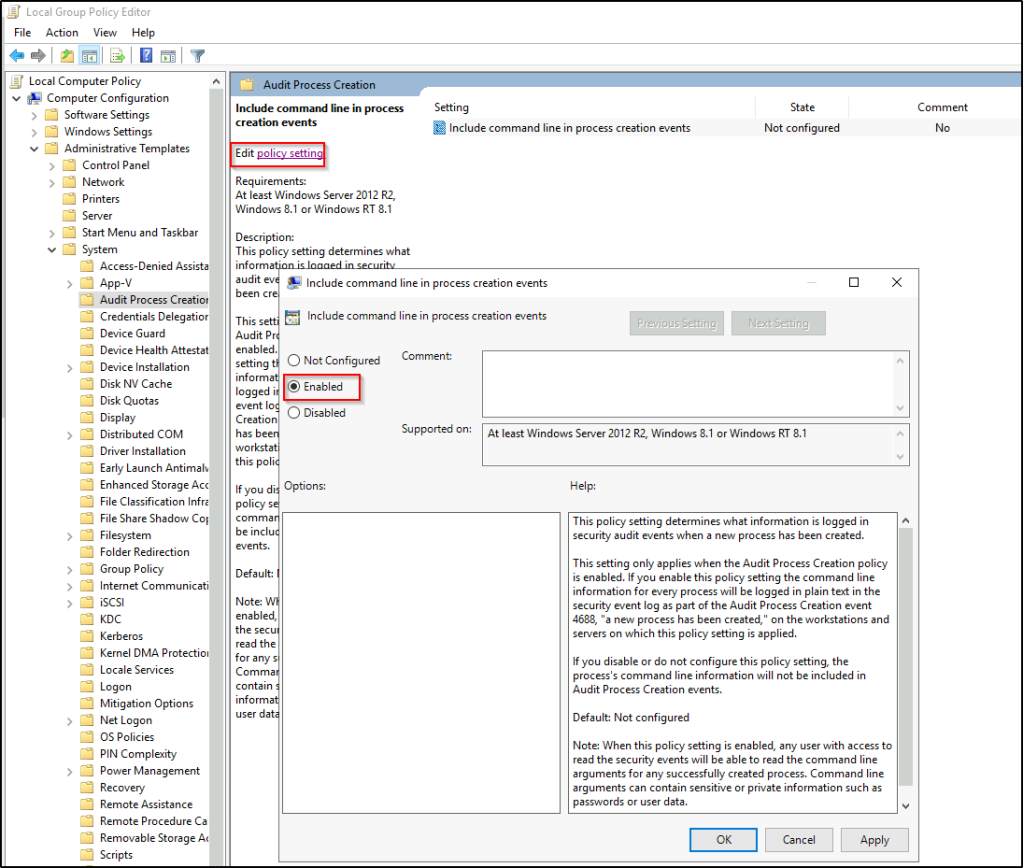
We have already enabled Audit Process Creation
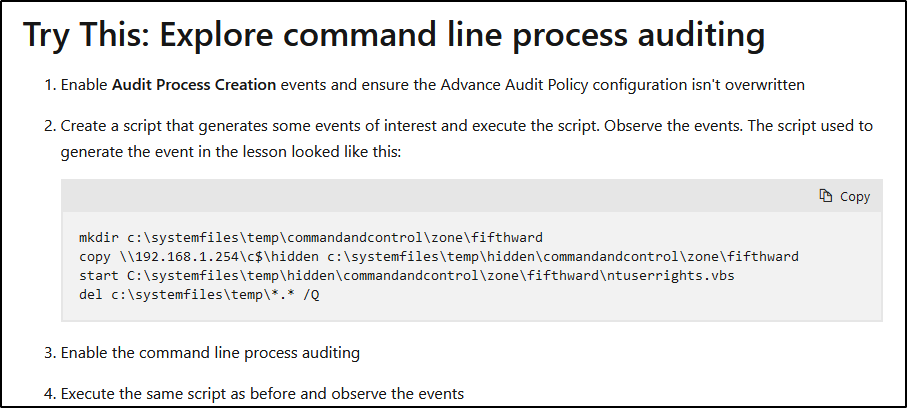
We will now perform step 2.
I run a simple command of whoami
Go to Event Viewer to see if the command was logged. We should look under Windows Logs > Security. It can be observed that it was not logged at all.
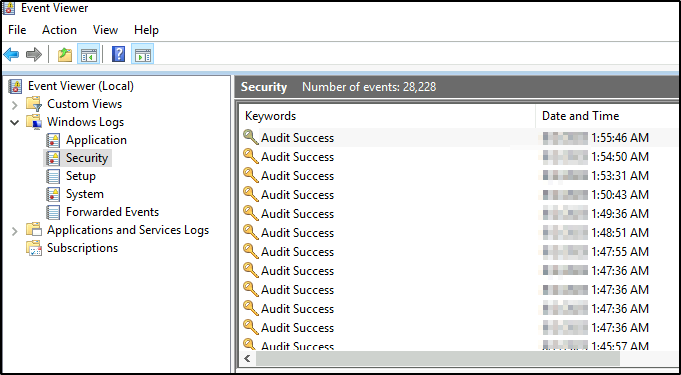
Now for step 3, Enable the command line process auditing.
- In the Group Policy Editor, go to “Computer Configuration” > “Windows Settings” > “Security Settings” > “Advanced Audit Policy Configuration” > “Audit Policies” > “Detailed Tracking.”
- In the right pane, locate the “Audit Process Creation” policy, and double-click on it to open the properties.
- In the properties window, select the “Define these policy settings” option.
- Check the “Success” and “Failure” boxes to enable auditing for successful and failed process creations. Click Apply and Ok.
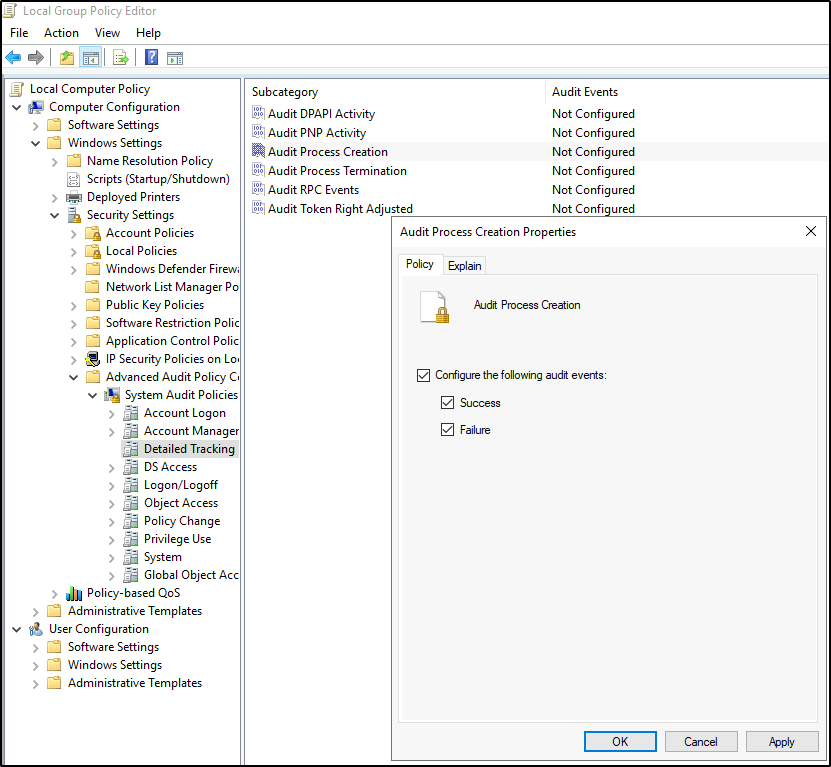
We’ll run the same command and notice if there’s a difference.
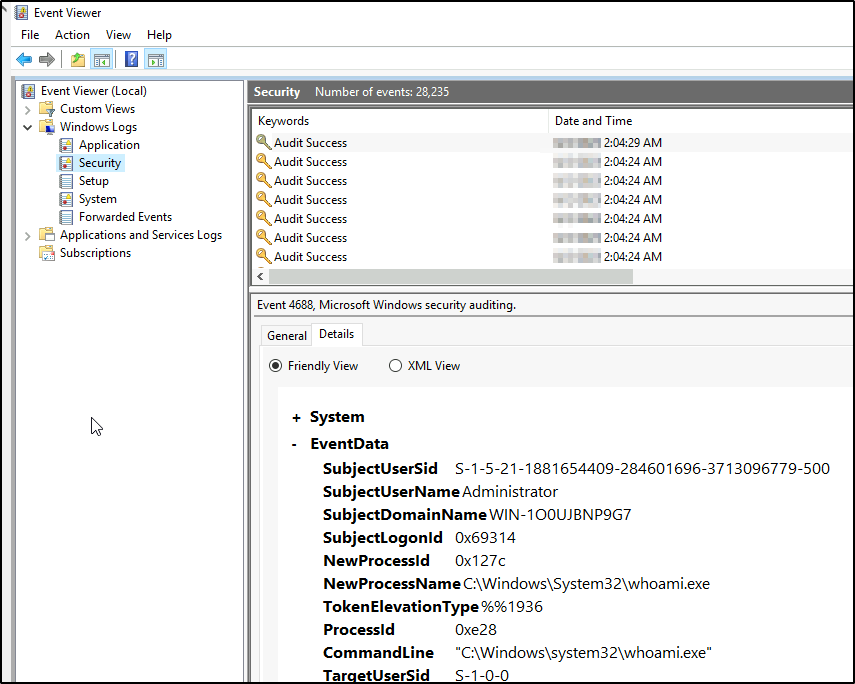
The command was logged this time.
The steps to test the configuration are at the bottom of the document.
The resources are not exhaustive list, hence we need to read more about this topic.
To effectively monitor and hunt, we need to know what to look for.
Answer the questions below
I’m ready to look at some event logs…
Task 7: Putting theory into practice
Let’s now test our newly acquired pool of knowledge on Windows Event Logs with the different scenarious presented below.
The next scenarios/questions are based on the external event log file titled merged.evtx found on the Desktop.
Scenario 1 (Questions 1 & 2): The server admins have made numerous complaints to Management regarding PowerShell being blocked in the environment. Management finally approved the usage of PowerShell within the environment. Visibility is now needed to ensure there are no gaps in coverage. You researched this topic: what logs to look at, what event IDs to monitor, etc. You enabled PowerShell logging on a test machine and had a colleague execute various commands.
Scenario 2 (Questions 3 & 4): The Security Team is using Event Logs more. They want to ensure they can monitor if event logs are cleared. You assigned a colleague to execute this action.
Scenario 3 (Questions 5, 6 & 7): The threat intel team shared its research on Emotet. They advised searching for event ID 4104 and the text “ScriptBlockText” within the EventData element. Find the encoded PowerShell payload.
Scenario 4 (Questions 8 & 9): A report came in that an intern was suspected of running unusual commands on her machine, such as enumerating members of the Administrators group. A senior analyst suggested searching for “C:\\Windows\\System32\\net1.exe“. Confirm the suspicion.
Answer the questions below
Open the merged.evtx file with event viewer
What event ID is to detect a PowerShell downgrade attack?
Answer: 400
A search on google would yield us about detecting PowerShell downgrade attacks. Here is an interesting article why attackers would downgrade to older versions of PowerShell.

What is the Date and Time this attack took place? (MM/DD/YYYY H:MM:SS [AM/PM])
Answer: 12/18/2020 7:50:33 AM
I used PowerShell for this task, added –Path parameter to indicate the source of the log file.
Get-WinEvent -Path .\\Desktop\\merged.evtx -FilterXPath '*/System/EventID=400' -MaxEvents 10
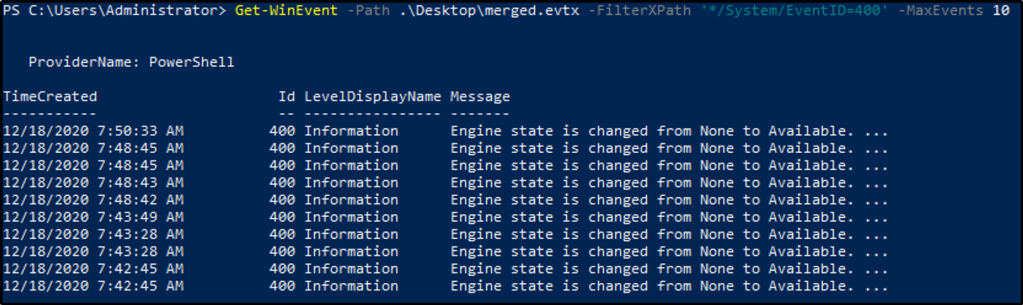
We can add the following to sort the results.
Sort-Object -Property TimeCreated -Descending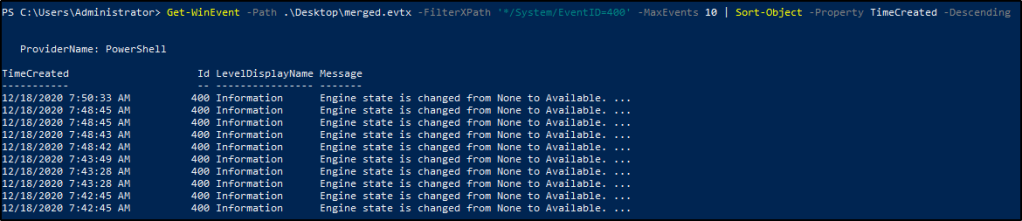
A Log clear event was recorded. What is the ‘Event Record ID’?
Answer: 27736
In one of the resources provided, an EventID of 104 is generated when the Application or System log were cleared.
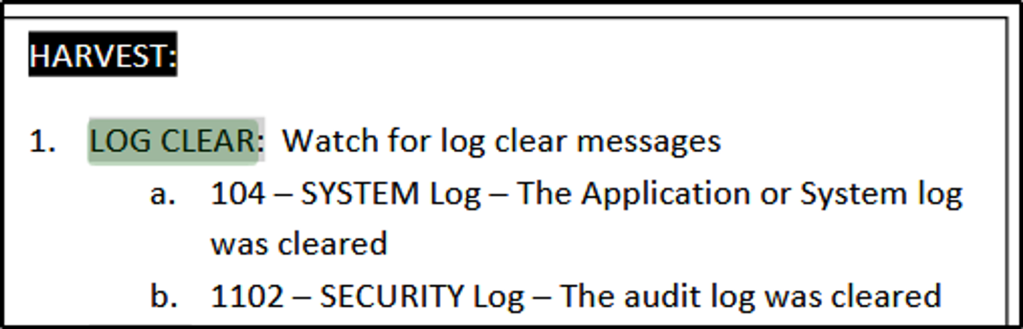
Now that we know the Event ID, let’s filter the logs with eEentID 104.
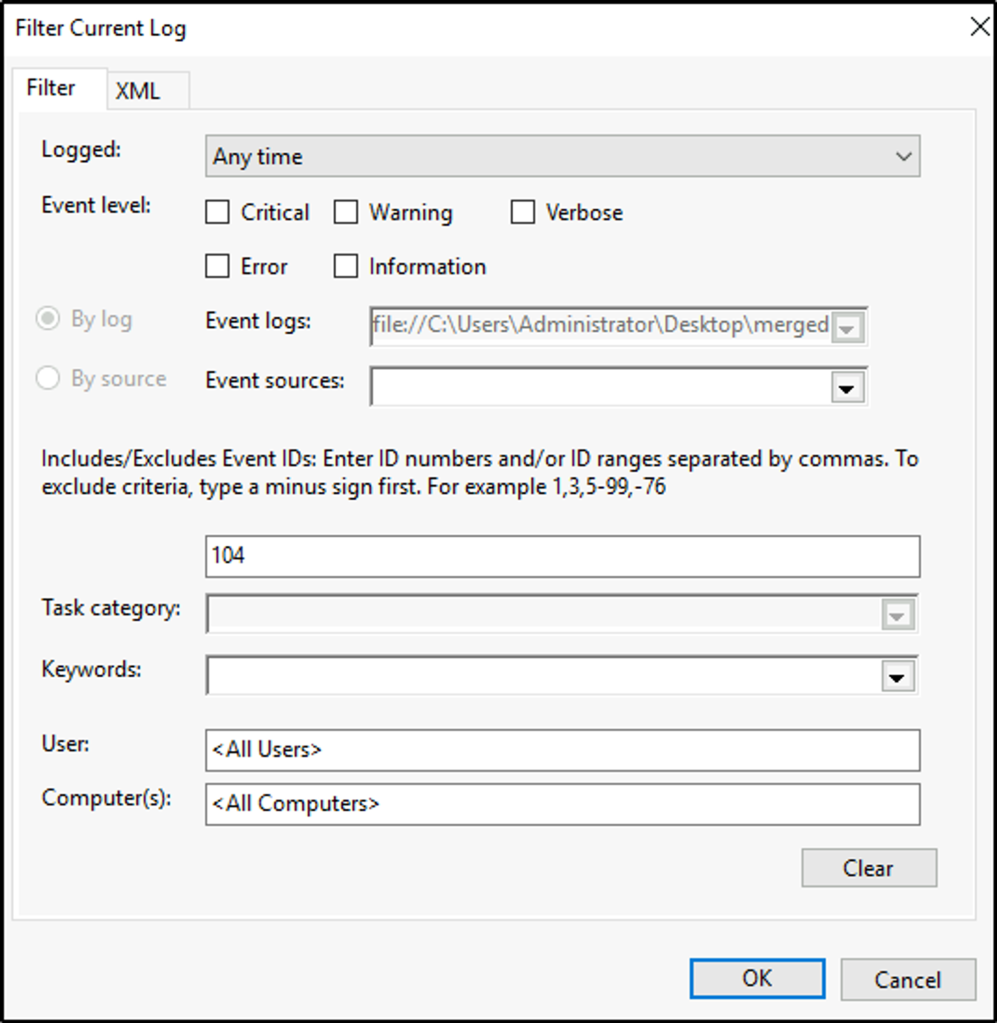
Select the windows event. In the lower pane, click on the “Details” tab and select “XML View”. We now see the ID for the recorded event.
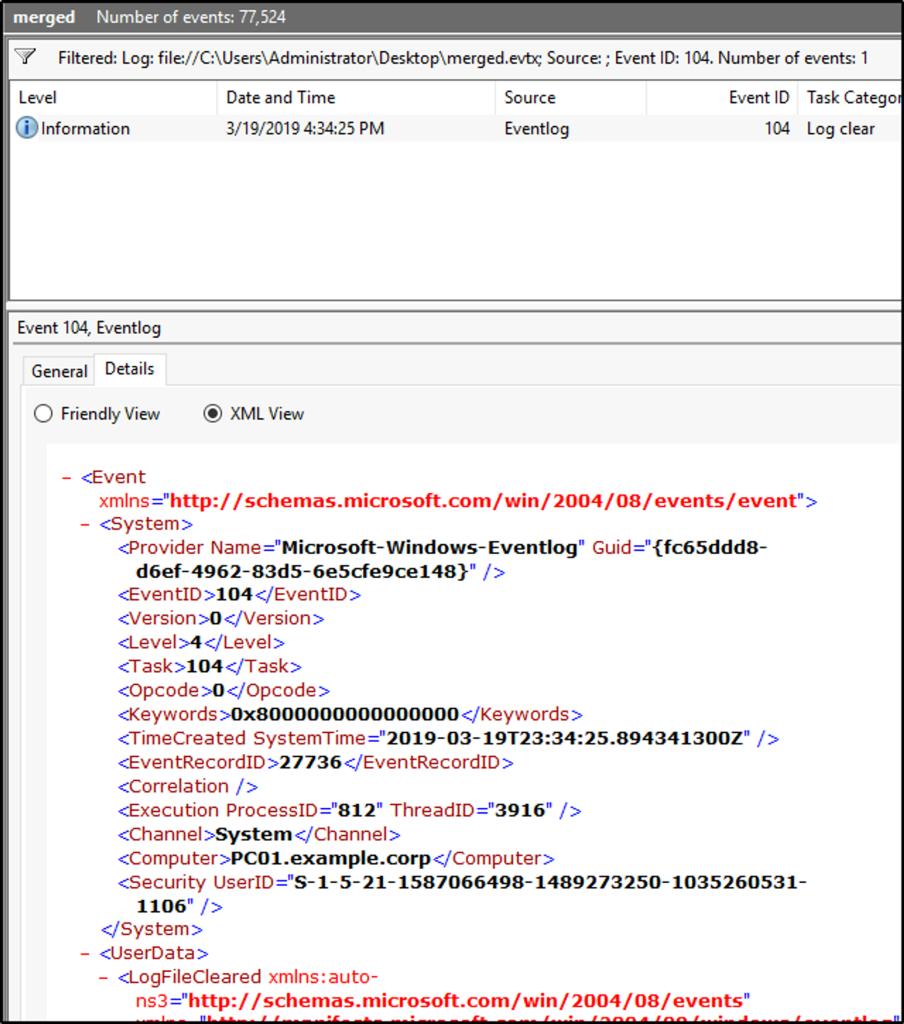
What is the name of the computer?
Answer: PC01.example.corp
The computer name is seen in the tag “Computer” or in the “General” tab.
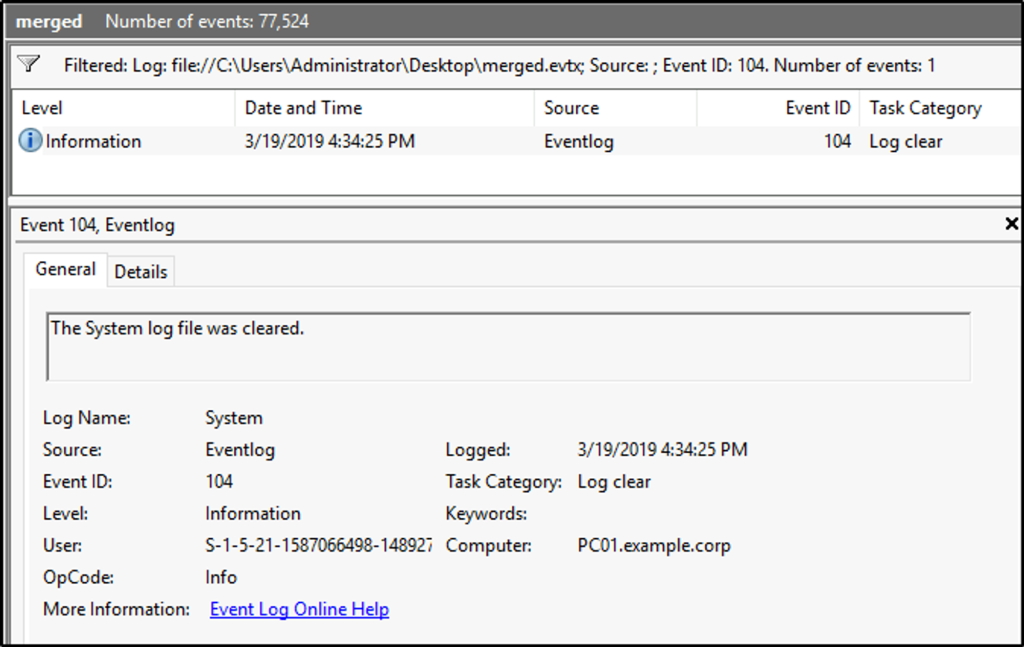
What is the name of the first variable within the PowerShell command?
Answer: $Va5w3n8=
It is important to know, that only when Script Block Logging is enabled, that these blocks of code, when executed by PowerShell are logged. Such events are recorded with EventID 4104.
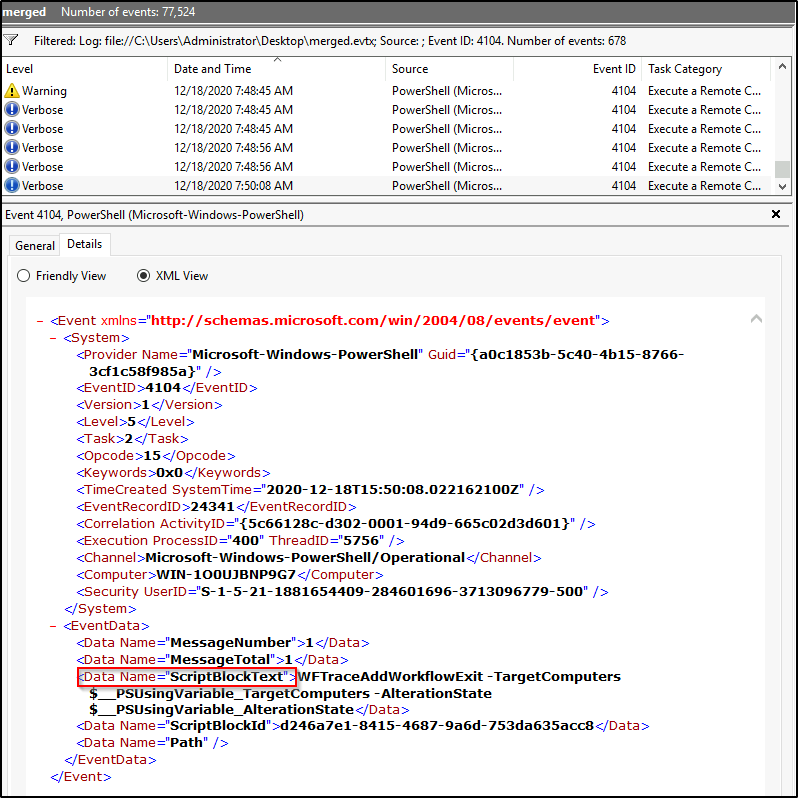
The following command would query, using XPath, all events with a 4104 ID, within “EventData” focusing on the tag “Data” that has the strings “ScriptBlockText”. Note: Variables always start with ‘$’.
Get-WinEvent -Path .\\Desktop\\merged.evtx -FilterXPath '*/System/EventID=4104 and */EventData/Data[@Name="ScriptBlockText"]' -Oldest -MaxEvents 1 | Format-List
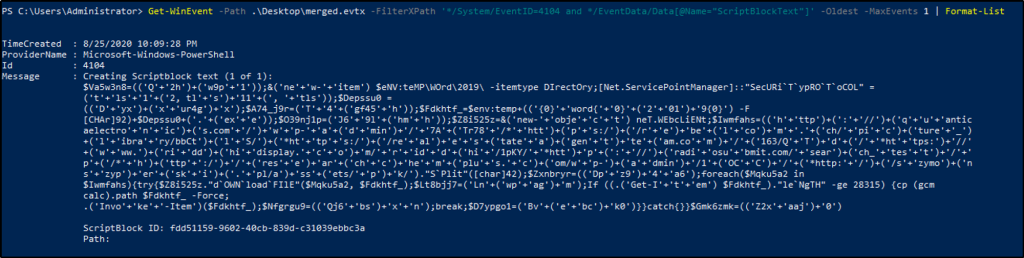
It took me a while to realize that the details displayed are incomplete, and I try not to rely on Event Viewer too much, because imagine if we have thousands of events to crumb through.
These commands would display all the info about the events and would also provide the answer for the next two questions.
Get-WinEvent -Path .\Desktop\merged.evtx -FilterXPath '*/System/EventID=4104 and */EventData/Data[@Name="ScriptBlockText"]' -Oldest -MaxEvents 1 | Select-Object -Property *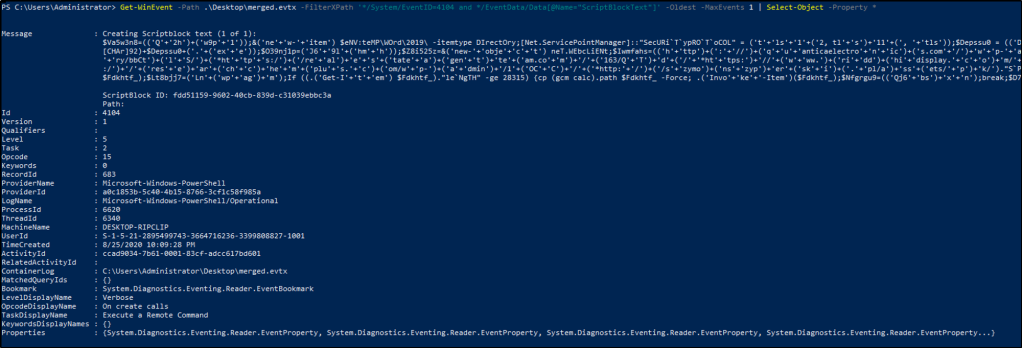
What is the Date and Time this attack took place? (MM/DD/YYYY H:MM:SS [AM/PM])
Answer: 8/25/2020 10:09:28 PM
What is the Execution Process ID?
Answer: 6620
What is the Group Security ID of the group she enumerated?
Answer:S-1-5-32-544
To confirm if she enumerated the “Administrators” group in her local machine, we would run the following commands. We will filter events with XPath within the elements of “EventData” and include the location of the suspected executed file. The piped results would display all the information about the queried events.
Get-WinEvent -Path .\merged.evtx -FilterXPath '*/EventData/Data[@Name="CallerProcessName"]="C:\Windows\System32\net1.exe"' | Select-Object -Property *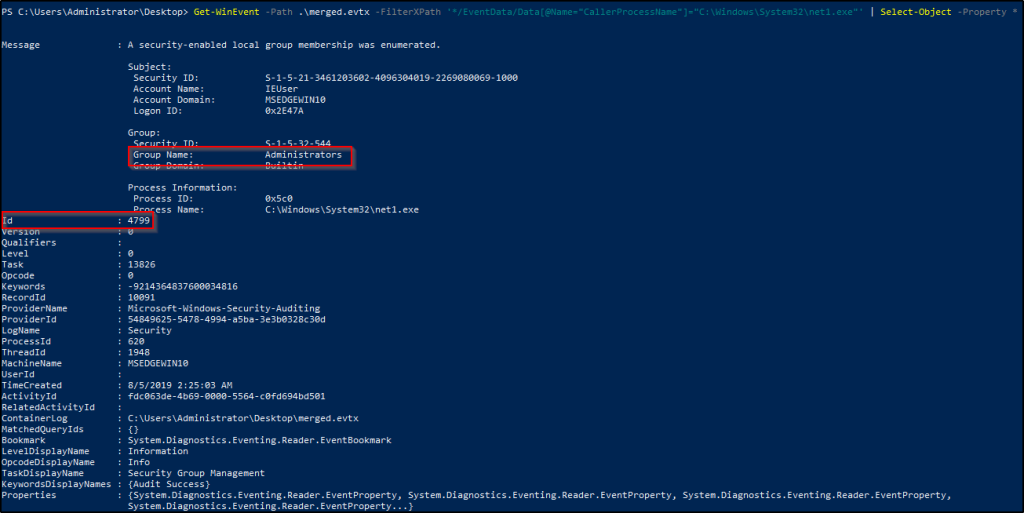
There were three events logged, but we are interested in the event where the local group “Administrators” was enumerated.
What is the event ID?
Answer: 4799
For reference, check this out.
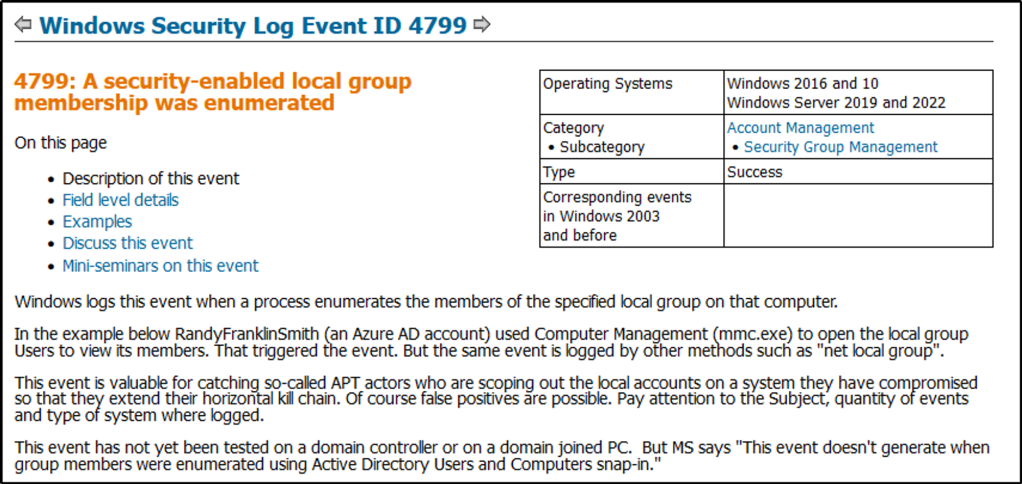
Task 8: Conclusion
We have covered a lot about Windows Event Logs, the important Event IDs we should monitor and hunt, and how to query them with the different tools and techniques.
We also touched on the features that need to be enabled or configured so that they can be logged for further visibility.
Windows event logs from various endpoints are also forwarded to SIEMs for easy filtering of evnts, correlating rules, generating reports, and detecting suspicous activities.
TryHackme provided us parting gifts for additional reading:
- EVTX Attack Samples (a few were used in this room)
- PowerShell ❤ the Blue Team
- Tampering with Windows Event Tracing: Background, Offense, and Defense
That concludes this room.
Thank you for reading 🙂
Happy learning!.