
Checking CPU utilization with the top command
top (table of processes) is a console command that displays a list of processes running in the system and information about them. By default, it sorts them in real time by CPU load.
Any server, has a limited amount of resources. Each program running in active or background mode uses a certain amount of virtual and physical memory, CPU time, etc. In other words, creates a certain load on the server.
It allows you to display a list of running processes in the form of a table and estimate how much resources they consume, i.e. how much load they create on the server and disk subsystem. This information helps to further optimize the system.
To do this, connect to the server via SSH and type top — Enter and you will see a table with the list of running processes. Initially the list is compiled in descending order of processor load.
Running the top command and deciphering the table
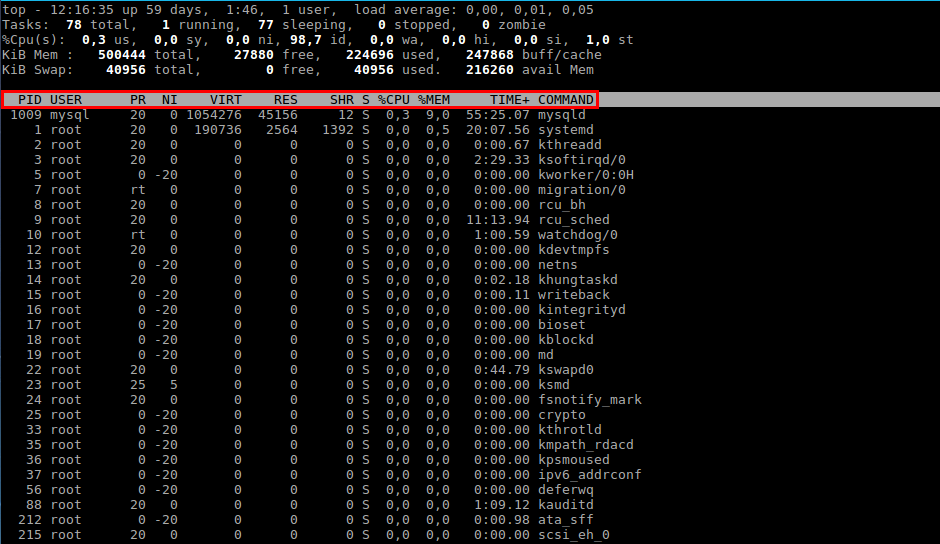
The first two columns are the process number (PID) and the name of the user running it (USER).
The next 2 columns show what priority the process has at the moment (PR) and the priority assigned to it by the NICE (NI) command.
The information in the other columns describes directly the level of resource consumption. They are decoded as follows:
-
VIRT — virtual memory used by the process
-
RES — physical memory used by the given process
-
SHR — total amount of memory, shared by the given process with others
-
S — current process status: R — running, S — sleeping, Z — zombie
-
%CPU — percentage of CPU time used
-
%MEM — percentage of RAM used by the process
-
TIME+ — process duration from the moment of its start
-
COMMAND — name of the command (program) which initiated the process.
Data decoding before the table
Useful information about the use of resources is contained not only in the table itself, but also in the five lines that precede it. They are a kind of summary on all the processes.
The first line gives us a general idea of the system load (top)

-
current time
-
up — the duration of the system from the moment of startup
-
user — current number of system users
-
load average — average load of the system one minute ago, five minutes ago and 15 minutes ago, respectively.
It is believed that this value should not normally exceed 1 for single-core processors. Correspondingly, the load average value equal to the number of cores is the limit.
The second line — process statistics (task)

-
total — total number of processes in the system
-
running — number of currently running processes
-
sleeping — number of pending processes
-
stopped — number of stopped processes
-
zombie — number of processes waiting for the parent process to transmit termination status
The third line — statistics of CPU usage (cpu)

-
us — the percentage of CPU usage by user processes
-
sy — the percentage of CPU usage by system processes
-
ni — percentage of CPU usage by processes with priority increased by calling
-
id — percentage of time when the CPU is not used
-
wa — percentage of CPU usage by processes waiting for I/O operations to complete
-
hi — Hardware IRQs — percentage of CPU usage by hardware interrupt handlers
-
si — Software Interrupts — percentage of CPU usage by software interrupt handlers
-
st — Steal Time — the amount of CPU time «borrowed» from the virtual machine by the hypervisor for other tasks (such as another virtual machine startup); this value will be zero on desktops and servers not running virtual machines
The fourth and fifth lines display information about the use of physical RAM and swap partition respectively (swap). Values in order: total memory (total), used memory (used), free memory (free), buffer cache (buffers).

Add columns and sort table top
We now know what information is encoded in each column of the top table. The basic sorting is done by CPU time utilization, aka %CPU. To perform sorting by memory (%MEM) in top, just type Shift+M in the top command mode. If you are interested in which process is running the longest, press Shift+T and you will see the information of interest in the TIME+ column. You can sort processes by their number (PID) by typing Shift+N.
To return to sorting mode by CPU resource consumption level, use combination Shift+P.
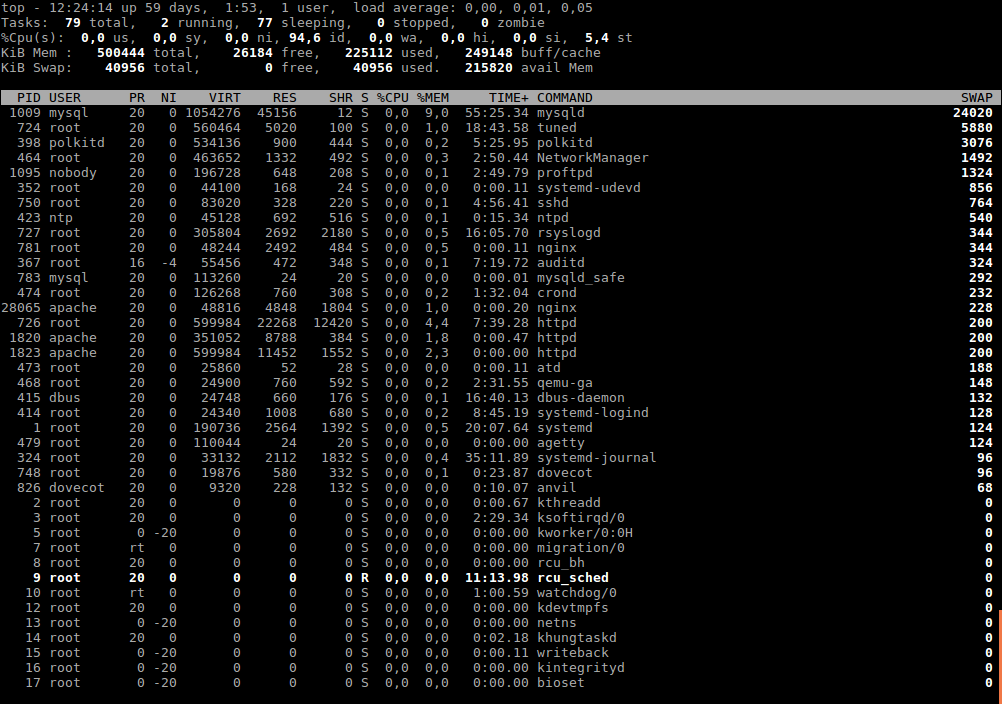
Not all sorting methods can be set with the help of «hotkeys». For example, to determine the processes that consume the most SWAP, use the field selection menu, which is called by the combination Shift+F.
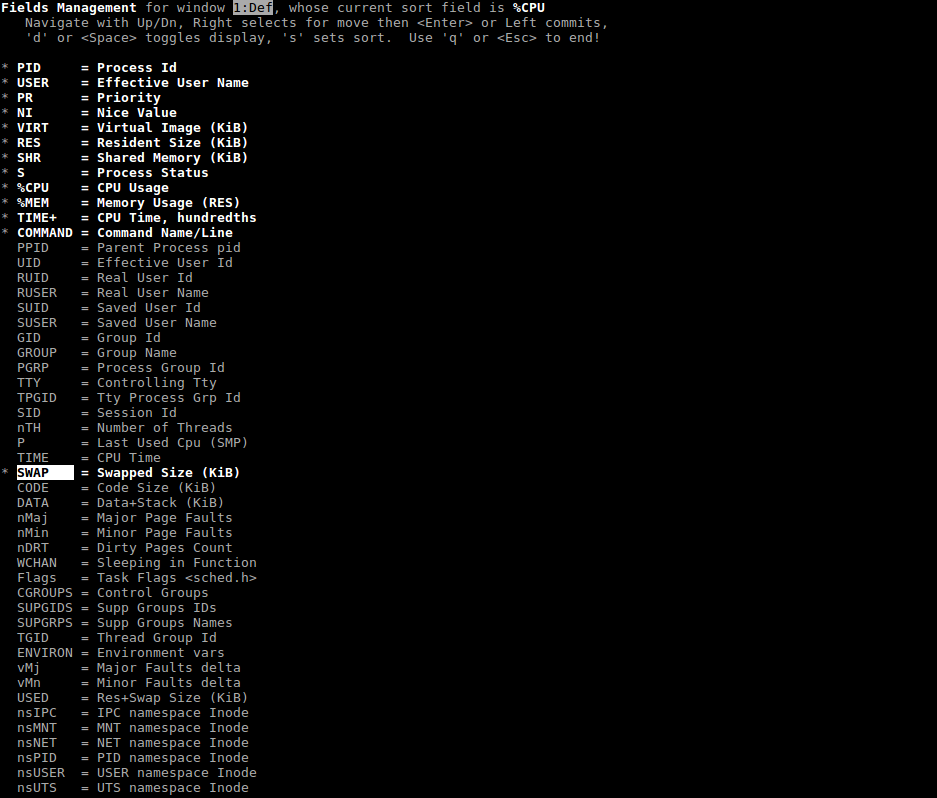
Use navigation keys to find SWAP (or any other parameter you need), use «d» to add it to the common table of top command (a «*» symbol will appear near it to confirm your choice). To set sorting by SWAP, press «s» here and exit the menu (ESC)
To make sure that sorting works by the specified attribute, press «x». The column with the corresponding attribute will be highlighted (highlighted in bold).
There is a more convenient utility called atop, more details about its functionality can be found on this [page] (https://fornex.com/help/atop/).
If you have any configuration difficulties or any additional questions, you can always contact our support team via [ticket system] (https://fornex.com/my/tickets/).
From Wikipedia, the free encyclopedia
| Original author(s) | William LeFebvre |
|---|---|
| Initial release | 1984; 41 years ago |
| Written in | C |
| Operating system | Unix-like |
| Type | Process viewer / System monitor |
top is a task manager or system monitor program, found in many Unix-like operating systems, that displays information about CPU and memory utilization.
The program produces an ordered list of running processes selected by user-specified criteria, and updates it periodically. Default ordering is by CPU usage, and only the top CPU consumers are shown (hence the name). top shows how much processing power and memory are being used, as well as other information about the running processes. Some versions of top allow extensive customization of the display, such as choice of columns or sorting method.
top is useful for system administrators, as it shows which users and processes are consuming the most system resources at any given time.
There are several different versions of top. The traditional Unix version was written by William LeFebvre and originally copyrighted in 1984.[1] It is hosted on SourceForge,[2] and release 3.7 was announced in 2008.[3]
The Linux version of top is part of the procps-ng group of tools. It was originally written by Roger Binns[4] and released in early 1992 but shortly thereafter taken over by others.[5]
On Solaris, the roughly equivalent program is prstat. Microsoft Windows has the tasklist command and the graphical Task Manager utility. IBM AIX has an updating running processes list as part of the topas and topas_nmon commands.
The load average numbers in Linux refers to the sum of the number of processes waiting in the run-queue plus the number currently executing. The number is absolute, not relative. And thus it can be unbounded; unlike utilization. The instant variations of the number of processes are damped with an exponential decay formula which is calculated using fixed point math.[6]
The ps program is similar to top, but instead produces a snapshot of processes taken at the time of invocation. top’s n (number of iterations) option can product a similar result, causing the program to run the specified number of iterations, then exit after printing its output.
The first 5 rows overview the entire system.
top - 14:21:23 up 2 days, 21:40, 44 users,  load average: 14.44, 14.13, 14.64
        |                   |    |                         |
      <time>    <system uptime> <user count>         <load average for the past 1, 5, 15 minutes>

Tasks: 1552 total,   8 running, 1544 sleeping,   0 stopped,   0 zombie

%Cpu(s):  9.6 us,  0.7 sy,  0.0 ni, 89.5 id,  0.0 wa,  0.0 hi,  0.2 si,  0.0 st
              |        |        |        |        |        |        |         '------.
           <user>  <system>  <nice>  <idle> <IOWait> <hardware/software interrupt> <steal time>

MiB Mem : 1031911.+total, 368915.2 free, 172285.0 used, 490711.5 buff/cache
MiB Swap:   2048.0 total,   2048.0 free,      0.0 used. 807110.1 avail Mem
load average is the exponential moving average of the run-queue length over the past 1/5/15 minutes. The run-queue includes both processes being run and waiting to be run. At complete utilization with no task switching, the load average is equal to the number of CPUs.[7]
Tasks counts the processes their statuses.
%Cpu(s) counts the percentage of CPU usage, broken down into categories.
MiB Mem: Memory usage in units of mebibyte. The buff/cache is for memory used by buffers and cache.
MiB Swap: Swap space usage in units of mebibyte. If the system needs more memory resources and the RAM is full, inactive pages in memory are moved to the swap space. In this snapshot, there’s a total of 2048 MiB of swap, all free, indicating that no swapping is occurring, which is good for performance.
avail Mem: The amount of memory available for new applications, without swapping. This considers not just the unused RAM, but also the memory that can be reclaimed from RAM caches.
The rest of the text provides a table with each row being a process, with the following columns often used out of many possible columns (the choice and ordering of columns are configurable):[8]
    PID USER      PR  NI    VIRT    RES    SHR S  %CPU  %MEM     TIME+ COMMAND
      1 root      20   0    2456   1612   1500 S   0.0   0.0   0:00.07 init(Ubuntu)
      4 root      20   0    2456      4      0 S   0.0   0.0   0:00.00 init
 656403 user2     20   0   80.0g   3.6g 370000 S 100.0   0.4   1594:38 python3
2024198 longnam+  20   0   50.5g   4.7g 609200 S   1.6   0.5 204:46.85 long-name-proc
2056804 longnam+  20   0  237.1g  31.1g  23.1g S 136.8   3.1  69:54.11 python3
PID: Process ID, a unique number identifying each running process.USER: The user who started the process. If the username is too long, it is cut-off with a+at the end.PR: Real-time priority of the task, computed by the system scheduler. Lower PR numbers are considered more important by the scheduler and more likely to be scheduled, which means it tends to have more CPU-time per real-time.NI: The niceness of the task, manually set by users and administrators to influence the real-time priority. A lower nice value tends to favor the process, and a higher nice value tends to disfavor the process. It ranges from -20 (most favored) to 19 (least favored).VIRT: Virtual memory size of the process. This includes all memory that the process can access, including memory that is swapped out, memory that is allocated but not used, and shared memory.RES: Resident set size, the portion of a process’s memory that is held in RAM. Compared withVIRT, this excludes memory that is swapped out, not yet used, or shared.SHR: Shared memory size: how much of the RAM claimed by the process is sharable with other processes.S: Status of process. The status can be:Rfor runningSfor sleepingIfor idleDfor disk sleep (uninterruptible)Zfor zombie (terminated but not reaped by its parent)Tfor stopped by a job control signal ortfor stopped by debugger during tracing.
%CPU: The percentage of the CPU time that the process is currently using.%MEM: The percentage of the physical RAM used by the process.TIME+: The total CPU time the task has used since it started. This is shown inminutes:seconds. The plus sign inTIME+means that it is accurate to 0.01 second. If it showsTIMEthen it is accurate to 1 second.COMMAND: The command line argument that started the process. UnlikeUSER, if the command is too long, it is cut-off without a+at the end.
- Bmon bandwidth monitoring for Linux
- htop interactive system-monitor for Linux
- iftop
- LatencyTOP
- mpstat
- nmon system-monitor for AIX and Linux
- ntop
- PowerTOP
- sar (Unix)
- ^ «Documentation». Unix Top. Archived from the original on 2008-04-13. Retrieved 2016-05-22.
- ^ LeFebvre, William (2014-09-16). «About Top». Unix Top. Archived from the original on 2004-04-20. Retrieved 2016-05-22.
- ^ «Top / News». SourceForge. Retrieved 2016-05-22.
- ^ «top(1): tasks — Linux man page». Linux Documentation. Retrieved 2016-05-22.
- ^ Binns, Roger. «Linux Top Origins | Roger’s world». Roger’s world. Retrieved 2016-05-22.
- ^ J. Gunther, Neil (2010). «UNIX Load Average Part 2: Not Your Average Average» (PDF). teamquest.com. Archived from the original (PDF) on 2012-06-02. Retrieved 2013-06-10.
- ^ Walker, Ray (1 December 2006). «Examining Load Average». Linux Journal. Retrieved 13 March 2012.
- ^ top(1) — Linux man page
top(1)– FreeBSD General Commands Manualtop(1)– OpenBSD General Commands Manualtop(1)– Linux User Manual – User Commands- «Decoded: The top utility (procps)». www.maizure.org. Retrieved 2024-02-11.. A deep dive into the mechanics of
top. - James, Hayden (2019-09-18). «How to customize the Linux top command». www.redhat.com. Retrieved 2024-02-11.
NTop
htop-like system-monitor with Vi-emulation for Windows. Because using Task Manager is not cool enough.

NTop as in Windows NT-op or NukeTop. Whatever you prefer (the latter obviously).
Installation
Chocolatey
$ choco install ntop.portable
Scoop
Winget
$ winget install gsass1.NTop
Usage
Options
| Option | Meaning |
|---|---|
-C |
Use monochrome color scheme. |
-h |
Display help info. |
-p PID, PID… |
Show only the given PIDs. |
-n NamePart, NamePart… |
Show only processes containing at least one of the name parts. |
-s COLUMN |
Sort by this column. |
-u USERNAME |
Only display processes belonging to this user. |
-v |
Print version. |
Interactive commands
| Key(s) | Purpose |
|---|---|
| Up and Down Arrows, PgUp and PgDown, j and k | Scroll the process list. |
| CTRL + Left and Right Arrows | Change the process sort column. |
| g | Go to the top of the process list. |
| G | Go to the bottom of the process list. |
| Space | Tag a selected process. |
| U | Untag all tagged processes. |
| K | Kill all tagged processes. |
| I | Invert the sort order. |
| F | Follow process: if the sort order causes the currently selected process to move in the list, make the selection bar follow it. Moving the cursor manually automatically disables this feature. |
| n | Next in search. |
| N | Previous in search. |
Vi commands
| Command(s) | Purpose |
|---|---|
:exec CMD |
Executes the given Windows command. |
:kill PID(s) |
Kill all given processes. |
:q, :quit |
Quit NTop. |
/PATTERN, :search PATTERN |
Do a search. |
:sort COLUMN |
Sort the process list after the given column. |
:tree |
View process tree. |
Configuration
The color scheme can be customized through the ntop.conf file. Follow link for example.
Building
Use CMake or use the build.bat file. Only tested with Visual Studio 2017.
$ cmake . # For enabling Unicode support: cmake -DENABLE_UNICODE=ON .
TODO
- Figure out buggy resizing.
- View process tree.
- Searching.
- Filtering.
- All of htop’s command line options.
- At least the most important interactive commands (e.g. following processes).
Если Ваш сайт медленно работает – необходимо проверить нагрузку на ваш сервер. При запуске большого количества процессов ресурсов сервера может не хватать. При этом будут задержки в выполнении всех задач. Обязательно учитывайте, что на работу операционной системы и панели управления также затрачиваются ресурсы сервера.
Для анализа нагрузки сервера с ОС Linux чаще всего используют утилиты:
- top – стандартная утилита, установлена во всех версиях Linux по умолчанию,
- htop – удобнее в использовании по сравнению с top, интерактивна,
- atop – позволяет вести логи.
top
Для запуска просто подключитесь к своему серверу по SSH и выполните:
top
В результате будет отображено следующее:
В верхней части окна выводится общая информация о системе. Ниже по убыванию степени нагрузки отображаются запущенные процессы. В утилите top выводимая информация обновляется каждые две секунды.
- Up – время работы системы (с момента запуска),
- User — количество пользователей в системе,
- Load average — средняя нагрузка на сервер. Здесь отображаются три значения – нагрузка 1, 5 и 15 минут назад.
- Tasks total – общее количество запущенных процессов,
- Tasks running – количество выполняемых процессов,
- Tasks sleeping – количество процессов в режиме ожидания,
- Tasks stopped – количество остановленных процессов,
- Tasks zombie – количество дочерних процессов, которые ожидают завершения родительского процесса.
Cpu(s) – загрузка процессора различными типами процессов в процентах, включает в себя:
- us — пользовательские процессы,
- sy — процессы ядра,
- ni – пользовательские процессы с ограничениями,
- id — неиспользуемые ресурсы,
- wa — операции ввода/вывода,
- hi – процедуры аппаратного прерывания,
- si – программные прерывания,
- st – принудительное ожидание, пока гипервизор обслуживает другой виртуальный процессор (т.е. сколько процессорного времени украдено у сервера).
Чем больше показатель id – тем лучше, то есть процессор загружен не полностью и есть резерв для дополнительных задач.
Высокое значение показателя us говорит о том, что необходимо оптимизировать код сайта.
Mem, Swap – использование оперативной памяти и подкачки:
- total – общий объем,
- free – свободный объем,
- used – используемый объем.
Все процессы отображены по возрастанию нагрузки на процессор.
- PID — идентификатор процесса;
- USER — пользователь, который запустил данный процесс;
- PR — приоритет процесса;
- NI — измененный приоритет процесса (присвоенный с использованием команды nice)
- VIRT — объем виртуальной памяти, используемой процессом. Например, если процесс запросил 100Мб, а использует только 50Мб, то VIRT покажет 100Мб.
- RES — объем фактически используемой оперативной памяти. Например, если процесс запросил 100Мб, а использует только 50Мб, то RES покажет 50Мб.
- SHR — объем памяти, разделяемой с другими процессами (т.е. память, которая может быть использована другими процессами).
- S — статус процесса (running, sleeping, zombie).
- %CPU — процент загрузки процессора текущим процессом;
- %MEM — процент использования ОЗУ процессом;
- TIME — время работы процесса с момента запуска;
- COMMAND — имя процесса (как командой был запущен).
Управление в утилите top
- Пробел — обновление окна вывода
- M — сортировка по столбцу использования памяти
- P — сортировка по столбцу использования процессора (стандартная сортировка)
- T — сортировка по времени работы процессов
- A — сортировка по потреблению разных ресурсов
- u — сортировка по имени пользователя (вводится имя пользователя)
- k – завершение процесса (указывается PID процесса — идентификатор)
- n – задание определенного количества процессов в выводе, после команды вводится число
- c – выводится полный путь процесса в столбце COMMAND
- h — справка
- q – завершение работы программы
htop
Утилита htop не является встроенной как top, ее нужно установить на сервер:
|
Ubuntu/Debian |
apt-get install htop |
|
CentOS |
yum install htop |
После этого для запуска выполните:
htop
Вывод утилиты выглядит примерно так:

Вывод утилиты htop имеет такую же структуру, как и top – в верхней части находится информация о системе: нагрузка на процессор, занятая оперативная память, средняя нагрузка за 1, 5 и 15 минут. Под ней — список процессов, отсортированных по степени нагрузки на процессор.
Изменение сортировки производится как и в top:
- M — по памяти
- P – по процессору
- T — по времени
Дополнительные команды:
- Пробел — отметить процесс (удобно использовать для выполнения операций над группой процессов),
- u – отобразить процессы определенного пользователя
Для управления htop используются функциональные клавиши:
- F1 – справка
- F2 – изменение параметров вывода
- F3 — поиск процессов
- F4 — фильтрация процессов (поиск по части названия)
- F5 — отображение дерева процессов – родительские и дочерние
- F6 – изменение сортировки
- F7 – повышение приоритета
- F8 — понижение приоритета
- F9 — завершение процесса (нужно выделить процесс мышью или клавиатурой, в top вводится PID процесса)
- F10 – завершение работы программы
Доступные действия и комбинации клавиш для их выполнения отображаются в нижней части окна программы htop (могут меняться в зависимости от того, в каком меню Вы находитесь).
atop
Утилиту atop удобно использовать для диагностики «плавающих» ошибок. Она позволяет вести логи, т.е. контролировать работу процессов за прошедший период.
Утилита atop не является встроенной как top, ее нужно установить на сервер:
|
Ubuntu/Debian |
apt-get install atop -y |
|
CentOS |
yum install atop -y |
Для более эффективного использования рекомендуется добавить atop в автозагрузку:
|
Ubuntu / Debian / CentOS 7 |
systemctl enable atop |
|
CentOS 6 |
chkconfig atop on |
|
Ubuntu 14.04 |
rm /etc/init/atop.override |
Для запуска выполните:
atop
Вывод утилиты atop выглядит так:

В верхней части находится общая информация о системе, а также нагрузка на процессор, ядро, память и сеть. В нижней части отображены процессы.
Команды для управления в утилите atop:
- m — сортировка процессов по использованию памяти
- d — сортировка процессов по нагрузке на диск
- n — сортировка процессов по нагрузке на сеть (доступна при установленном патче ядра)
- u – отображение нагрузки по пользователю
- v — подробная информация по процессу
- i — задание интервала обновления вывода (стандартно 10 секунд)
- g – восстановить вывод по умолчанию
Shift+d, Shift+m, Shift+n – сортировка текущего списка по заданным параметрам: диск, память, сеть.
Логи atop
Утилита atop по умолчанию сохраняет данные о состоянии системы каждые 10 минут. Файл лога располагается в директории /var/log/atop.
Имя файла логов за день имеет вид atop_ГГГГММДД.
Для просмотра, например, лога за 1 июля 2020 года, введите:
atop -r /var/log/atop/atop_20200701
Для изменения настройки лога откройте файл конфигурации утилиты atop. Он размещается в /etc/default/atop (в CentOS — etc/sysconfig/atop).
INTERVAL=600
Данный параметр задает интервал сохранения информации о нагрузки (в секундах). Для того чтобы установить интервал 20 минут — введите значение INTERVAL=1200
LOGPATH="/var/log/atop"
Данный параметр задает путь к директории с логами.
OUTFILE="$LOGPATH/daily.log"
Данный параметр задает имена файлов логов.
Чтобы изменения вступили в силу, перезапустите atop:
systemctl restart atop.service
Для ускорения работы сайта мы рекомендуем переносить временные файлы MySQL в tmpfs.
Если у Вас остались вопросы — создайте тикет в техподдержку.
Top is a Linux process that shows a list of processes running on the system and what levels of resources are being used. This application provides all processes running, the CPU and Memory consumed and with several switches available you can see things like the location of the executable that is running.
Unfortunately, they don’t make a TOP executable ported for Microsoft Windows but don’t despair. You can use Power Shell to script a simple TOP style display that operates just like TOP on a Linux system.
Here is the one liner you need to get a top style process viewer running on windows.
while (1) { ps | sort -desc cpu | select -first 30; sleep -seconds 2; cls }Copy the above line and paste it in to your Power Shell console. You should see something similar to the following image.