
If you’ve ever faced slow internet speeds, difficulty accessing websites, or issues with your network connection, you might have heard about the tracert/traceroute command. It’s a powerful diagnostic tool that helps you trace the route packets take across the internet or your local network, helping identify where problems may be occurring. Whether you’re a network admin, IT professional, or just a curious user, knowing how to use the tracert command in Windows 10 or Windows 11 can significantly improve your troubleshooting skills.
In this guide, we’ll understand the process of running the tracert command in both Windows 10 and Windows 11.
What is Tracert
Tracert (short for «Trace Route«) is a command-line utility used to trace the route that data packets take to reach a specific destination across an IP network, such as the Internet. It provides a detailed map of the path taken by the packets from the source device to the destination, showing each intermediate router or «hop» along the way.
Example: Imagine you’re unable to load a website, and you wonder if the problem lies with your internet service provider, the website’s server, or somewhere in between. Running tracert allows you to pinpoint where the connection fails, so you can narrow down the cause of the issue. It’s also incredibly helpful in diagnosing latency issues and understanding the health of your network.
Running Tracert/Traceroute: Step-by-Step Guide
Follow the below steps to Run a traceroute (tracert) command using Mircosoft Windows 10/11:
Step 1: Open the Command Prompt
- Simply type ‘cmd’ in the search bar and hit Enter. The Command Prompt window will open.
- Alternatively, Press
Win + R, typecmd, and hit Enter.
Step 2: Run the Tracert Command
To trace the route to a specific website, type ‘tracert’ followed by the domain or IP address i.e. tracert [hostname or IP address]
Traceroute Command with Example:
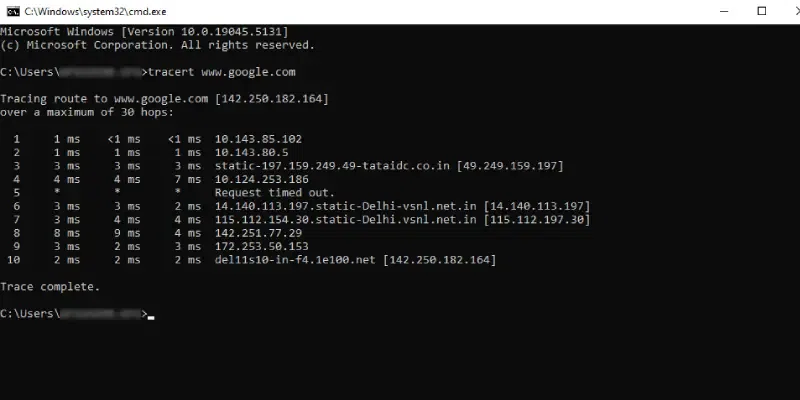
Here we want to Trace the route of www.google.com, In the Command Prompt or Terminal, type the following command:
tracert www.google.com
Step 3: Reading a Traceroute
The output will display the following for each hop:
- The hop number.
- The router’s IP address or domain name.
- The round-trip time (RTT) for the packet to reach that hop and return.
Explanation of the above example:
- The packet first hits the 10.143.85.102 router.
- Then it moves to 10.143.80.5, followed by static and so on, until it reaches 142.250.182.164, which is the IP address of
google.com. - The round-trip time (RTT) for each hop is also shown.
Tracert Command List with Parameters
Here’s a complete table of the Tracert (Trace Route) command along with its common parameters, their descriptions, and how they are used. These parameters allow to customize the behavior of Tracert, making it more flexible for troubleshooting network issues.
| Command | Description | Example |
|---|---|---|
tracert <destination> |
Basic syntax to run Tracert to a specified destination (IP address or domain name). | tracert www.google.com |
tracert -d <destination> |
Disables the domain name resolution; shows only IP addresses instead of hostnames. | tracert -d www.google.com |
tracert -h <max_hops> |
Sets the maximum number of hops to trace before terminating. | tracert -h 20 www.google.com |
tracert -w <timeout> |
Specifies the timeout in milliseconds to wait for each reply. Default is 4000 ms. | tracert -w 1000 www.google.com |
tracert -4 <destination> |
Forces Tracert to use IPv4 for the trace. | tracert -4 www.google.com |
tracert -6 <destination> |
Forces Tracert to use IPv6 for the trace. | tracert -6 www.google.com |
tracert -l <packet_size> |
Specifies the number of bytes in the ICMP packet sent. Default is 32 bytes. | tracert -l 1500 www.google.com |
tracert -p <port> |
Sends the trace to the specified port number (useful in some network troubleshooting). | tracert -p 80 www.google.com |
tracert -R <route_option> |
This option routes each hop in reverse, from destination back to the source. | tracert -R www.google.com |
tracert -T |
Specifies the use of a TCP-based probe instead of the default ICMP packets. | tracert -T www.google.com |
tracert -f <TTL> |
Sets the initial Time-to-Live (TTL) value for the first hop (useful for debugging routing). | tracert -f 64 www.google.com |
tracert -R <destination> |
Routes each hop using a reverse path to the source. | tracert -R www.google.com |
Common Error Messages in Tracert
While using Tracert, you may encounter various error messages that can help diagnose network problems. These messages typically indicate issues with connectivity, routing, or firewalls. Below are some of the most common error messages you might see when running a Tracert command, along with explanations and troubleshooting steps.
1. * * * Request Timed Out
This is one of the most common error messages in Tracert. It means that the Tracert command did not receive a response within the specified timeout period from one of the hops along the route.
Possible Causes:
- The router or server may be configured to ignore ICMP requests (ping requests) for security reasons.
- The router or server may be temporarily down or overloaded.
- Firewalls or security policies may block ICMP traffic.
Troubleshooting:
- This message doesn’t always indicate a serious issue. It is normal for certain routers or firewalls to block ICMP traffic (which is used by Tracert).
- If the timeout occurs only on a particular hop and the rest of the route is fine, the network may be functioning correctly.
- Try running Tracert to different destinations or check if other users are experiencing the same issue.
2. Destination Net Unreachable
This error appears when Tracert cannot find a route to the destination network, meaning the path to the target is completely blocked or the destination network is unreachable.
Possible Causes:
- There may be a routing issue, either within your local network or on the internet.
- A misconfigured router or gateway might be preventing the route.
- The destination might be temporarily down or disconnected from the network.
Troubleshooting:
- Check the local network for misconfigurations, such as incorrect IP settings or faulty network equipment.
- Contact your Internet Service Provider (ISP) if the issue persists beyond your network.
- You can also verify if the destination is reachable via other network tools like
pingortelnet.
3. Request Timed Out - All Hops
When every hop returns the Request Timed Out message, it generally suggests that no ICMP traffic is allowed past the first router in the path. This typically indicates a configuration issue.
Possible Causes:
- A firewall or router along the path is blocking ICMP packets (the type of packet used by Tracert).
- Network-level security policies prevent the Tracert tool from working.
Troubleshooting:
- Check if a firewall on your local machine, router, or ISP is blocking ICMP requests.
- If you are troubleshooting from behind a corporate network, it’s likely that network policies prevent the use of Tracert for security reasons.
- Test using alternative tools like
pingorPathPing.
4. General Failure
This error occurs when Tracert encounters a general issue that prevents it from performing the trace. It typically happens when there is a problem with the local machine’s networking or configuration.
Possible Causes:
- Issues with the network interface on your local machine (e.g., Wi-Fi or Ethernet).
- A misconfigured IP address or DNS settings.
- A software conflict or firewall blocking Tracert.
Troubleshooting:
- Restart your computer and check your network connection.
- Verify that your computer’s IP address and DNS settings are correct.
- Temporarily disable any third-party firewalls or security software and test again.
5. Unable to Resolve Target System Name
This error happens when Tracert is unable to resolve the domain name you provided into an IP address. This suggests a DNS (Domain Name System) resolution issue.
Possible Causes:
- The DNS server is not functioning or configured incorrectly.
- The domain name may be misspelled or the destination website may not exist.
Troubleshooting:
- Check if the domain name is correct and try to visit it in a web browser to ensure it’s active.
- Test your DNS configuration by running
nslookuporpingon the domain name to confirm that it resolves to an IP address. - Try using a different DNS server, such as Google’s public DNS (8.8.8.8), to see if the issue resolves.
6. Time To Live Exceeded
The Time To Live Exceeded error indicates that the packet has traversed more hops than the set TTL (Time To Live) value, which means the packet is stuck in a routing loop or has failed to reach the destination within the set hop limit.
Possible Causes:
- A network routing loop where the packet continuously circulates between two or more routers without reaching the destination.
- A misconfigured router or network device could be creating circular routing paths.
Troubleshooting:
- This error is typically a sign of a problem within the network itself, such as a misconfigured router or a routing loop.
- If the loop is within your network, check the routing tables and configuration on your routers or gateways.
- Contact your ISP if the issue appears to be outside your local network.
7. Network Unreachable
This error occurs when Tracert is unable to find a valid path to the destination network. It suggests a significant connectivity issue between your machine and the target destination.
Possible Causes:
- The destination network may be completely disconnected or misconfigured.
- A major network routing issue exists between your device and the destination.
Troubleshooting:
- Verify that your local network is connected and functional (e.g., check cables or Wi-Fi settings).
- If possible, try accessing a different website or service to verify that the issue is specific to the target destination.
- Contact your ISP or the administrator of the destination network to investigate potential connectivity issues.
How Does Tracert Work?
When you run a Tracert command, it sends a series of Internet Control Message Protocol (ICMP) Echo Request messages (like ping requests) to the target IP address. However, unlike a typical ping, Tracert uses TTL (Time To Live) values to track each hop along the route.
- Initial Packet: Tracert sends the first packet with a TTL of 1. The first router it encounters will decrement the TTL value by 1. Once the TTL reaches 0, the router sends back a «TTL Expired» message (ICMP Time Exceeded message).
- Increasing TTL: Tracert then sends another packet, but this time with a TTL of 2. The first router decrements the TTL to 1, and the second router decrements it to 0. The second router then responds with the «TTL Expired» message. This process continues, incrementing the TTL by one each time until the destination is reached.
- Destination: When the packet reaches the final destination, the destination device responds with an ICMP Echo Reply message, and Tracert stops.
Note: Each router along the path sends an ICMP «Time Exceeded» message to the origin, and Tracert records the round-trip time for each hop. The round-trip time is measured in milliseconds (ms), and the information is displayed for each hop in the output.
Conclusion
Tracert is an valuable tool for network administrators and IT professionals to troubleshoot network issues, analyze network performance, and verify connectivity. It helps pinpoint areas of congestion, identify bottlenecks, and provide a clear map of how data flows across the network. Whether you’re troubleshooting latency issues, ensuring proper routing, or optimizing network paths, Tracert is an essential tool for diagnosing and understanding network behavior.
By using Tracert in combination with other network diagnostic tools like Ping or PathPing, you can quickly identify and resolve network issues, improving overall network performance and reliability.
Also Read
- Most Useful CMD Commands in Windows
- Command Prompt Hacks for Windows
- Linux vs Windows Commands
- Networking Commands For Troubleshooting Windows
Для начала, определимся с тем, что такое PING. Пинг — специальная утилита, способная проверить целостность соединения. Она основывается на TCP и IP узлах. Протоколы определяют подключение компьютера или сервера к общей сети. Команды, с помощью которых можно проверить IP-адрес и сделать трассировку маршрута, помогают узнать доступность сервера, а также его состояние в момент подключения.
Само понятие трассировки разнится. Кто-то утверждает, что это полученные данные, в то время, как traceroute – это программа, помогающая определить следование (маршрутизацию) данных в сетях IP/TCP.
Проще говоря, мы будем делать с вами трассу и пинговать сервер из оболочки WIndows.
CMD Windows – ищем и проверяем
Необходимо выполнить следующие действия, независимо от вашей версии ПО:
- Пуск — Все программы — Стандартные — Командная строка;
- В окне поиска — вводите тоже самое;
- Открываете панель управления — выполнить — и вводим команду cmd.
Любой из этих способов откроет черное окно, которое выглядит так:
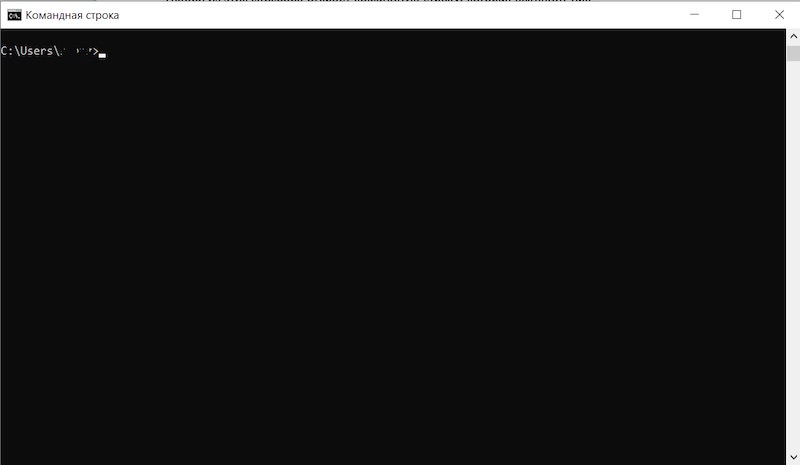
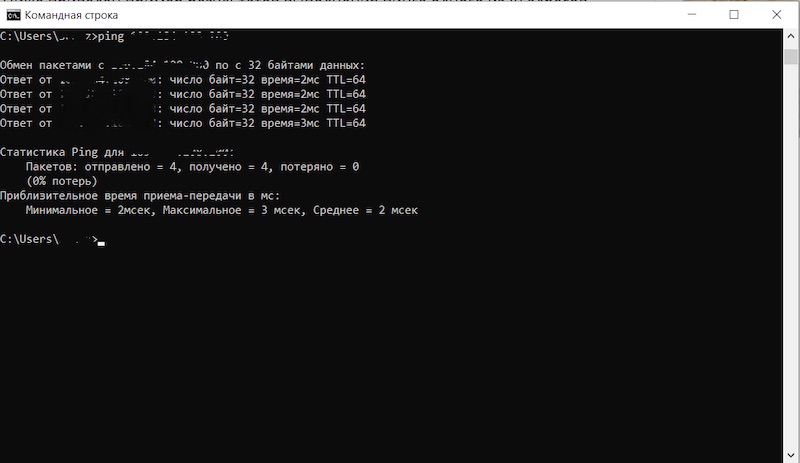
После того, как вы узнали свой IP (достаточно в строке ввести ipconfig), также вам доступна команда PING.
Делаем всё, как на скриншотах.
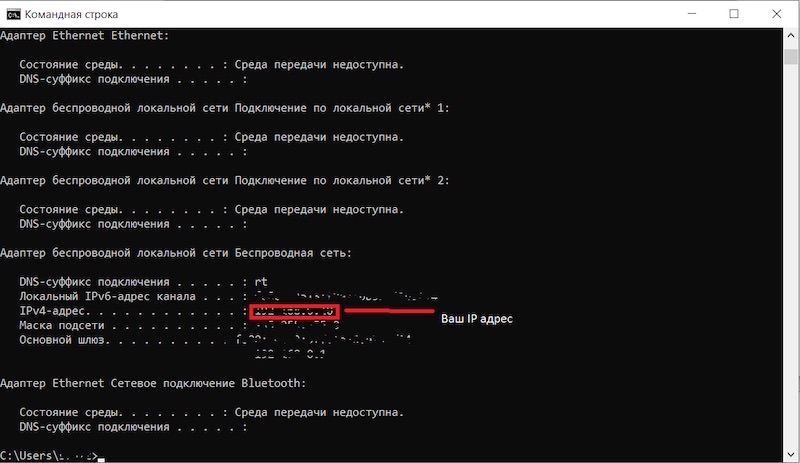
После введенной IPCONFIG – не обязательно заглавными — вы получаете свой IP-адрес в графе IPv4. Его можно скопировать для удобства или запомнить, что более трудно. Многие просто переписывают на листок.
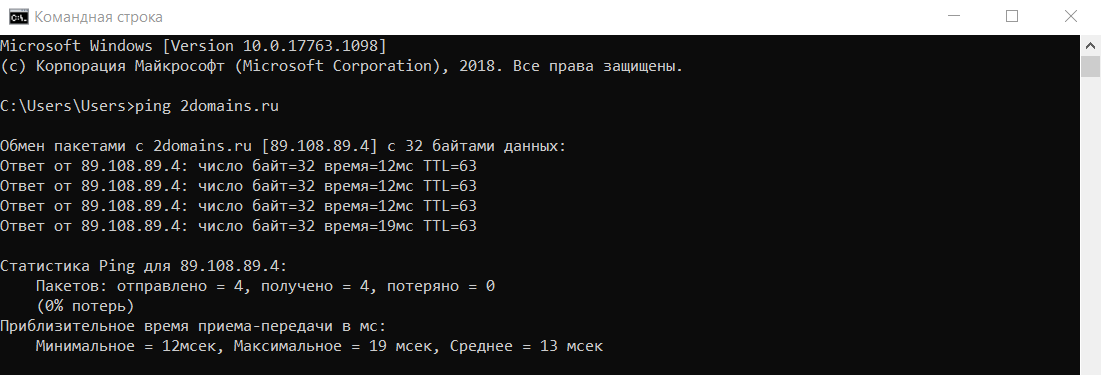
Командная строка всегда выдает по 4 пакета. Мы видим, что каждый пакет передает информацию в 32 бита за 3 миллисекунды каждый.
Все указано на скриншоте ниже.
Вы можете самостоятельно изменить количество отправляемых пакетов, если перед «PING» добавите «-N». Тогда ваша команда будет выглядеть так:
ping -n (число пакетов) IP-адрес
Также вы можете изменить количество бит, и тогда ваша команда будет выглядеть так:
ping -l (количество байт) 22.11.33.444 (к примеру)
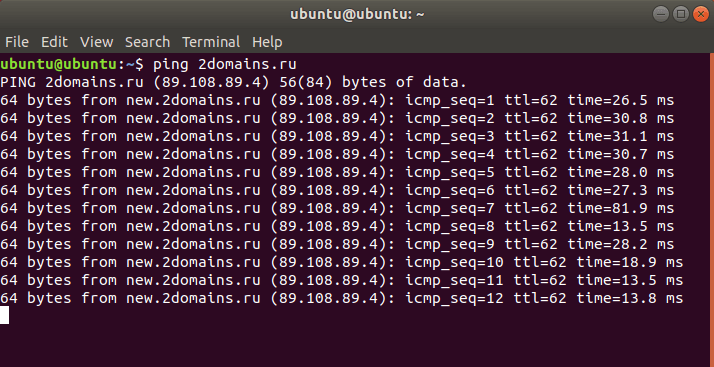
В отличие от Windows, на Linux ручная проверка айпи не прекращается до тех пор, пока вы сами не остановите этот процесс. В Виндовс такую операцию сделать также можно с помощью команды добавочной команды «-T», и выглядит это так:
ping -t какой-нибудь IP (к примеру)
Останавливается проверка с помощью нажатия Ctrl + C.
Вы узнали ваш IP-адрес. Теперь вам доступна информация о скорости соединения вашего компьютера с общей сетью.
Проверяем трассу tracert
Трассировка показывает нам скорость прохождения наших пакетов между маршрутизаторами, которые базируются в сети компьютера, который отправляет запросы к итоговому (конечному серверу).
Трасса часто помогает обнаружить проблему в серверной части. Большинство опытных специалистов при каждом изменении кода СУБД ежеминутно проверяют трассировку для определения проблемы и скорости прохождения данных.
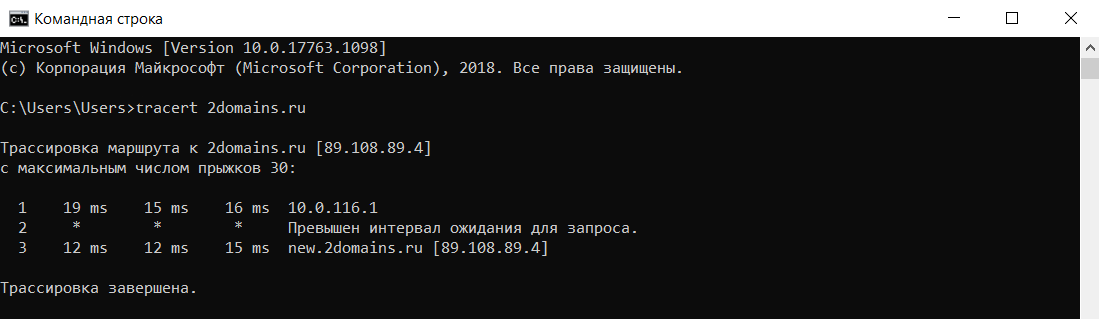
Функция tracert – показывает полный сетевой маршрут до указанного места. Выглядит это так (в качестве примера был взял wikipedia.org):
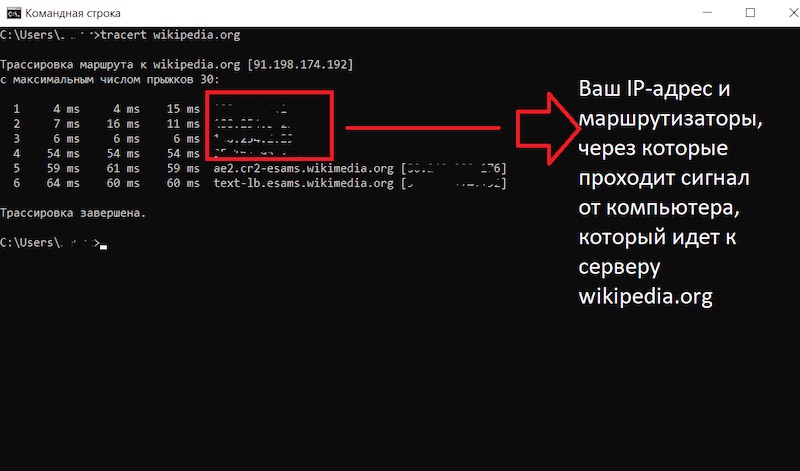
Как мы видим, команда «tracert» — помогает нам увидеть количество промежуточных маршрутизаторов, а также конечное время, которое нам приходится выжидать.
От А до Я: как работают Tracert и Traceroute
Поскольку есть множество возможных причин неполадок в сети, наличие знаний и инструментов для их устранения поможет вам существенно сэкономить время.
Один из наиболее распространённых и удобных инструментов, которые используются для этой цели, – это Tracert или Traceroute. В этой статье мы рассмотрим, как работают эти команды, за что они отвечают и чем отличаются.
- Что такое Tracert и Traceroute
- Что такое трассировка
- Как работает трассировка
- Как работает Traceroute / Tracert
- В чём заключаются отличия Tracert от Traceroute
- Как использовать Tracert / Traceroute
- Утилита Tracert (Windows)
- Утилита Traceroute (Linux и macOS)
- Как расшифровать выводы Tracert и Traceroute
Что такое Tracert и Traceroute
Traceroute и Tracert – это сетевые утилиты, которые используются для определения маршрута (пути), по которому пакеты данных передаются от одной точки к другой в интернете или других IP-сетях. Они помогают пользователям и сетевым администраторам анализировать, как именно данные передаются от исходного компьютера к целевому устройству, и выявлять возможные проблемы в сетевой инфраструктуре.
Хотя у этих команд и разные названия, они выполняют аналогичные функции в зависимости от операционной системы – Tracert в Windows и Traceroute в Linux и MacOS. Они позволяют отслеживать маршрут, который данные проходят от отправителя к получателю. Это особенно важно в условиях сложных сетевых инфраструктур, где данные могут проходить через множество промежуточных устройств: например, маршрутизаторов, коммутаторов и файрволов.
Как мы уже упомянули, когда данные отправляют от одного узла сети к другому, они проходят через несколько промежуточных устройств. Traceroute и Tracert позволяют наблюдать за каждым этапом этого пути, предоставляя информацию о времени задержки при передаче данных (RTT), а также об именах и IP-адресах устройств.
В отличие от команды Ping, которая может лишь указать на наличие проблемы в сети, Traceroute и Tracert помогают точно определить, где именно возникла проблема. Они стали неоценимыми инструментами для администраторов сетей, потому что помогают им быстро локализовать и устранить неполадки.
Что такое трассировка
Трассировка (а точнее распределённая трассировка) представляет собой критически важный инструмент для анализа и управления сложными информационными системами, особенно когда дело доходит до микросервисных архитектур.
Она позволяет отслеживать жизненный цикл запроса в распределённой системе, начиная от момента его поступления и заканчивая завершением обработки. Это достигается за счёт сбора и анализа данных о том, как запрос перемещается и обрабатывается через различные службы, которые могут быть работать независимо друг от друга.
Если журналирование фиксирует конкретные события – например, доступ к базам данных или запись файлов, – то трассировка создаёт связанную картину всех событий в ходе обработки запроса. Трассировку можно сравнить с интерактивной картой, которая показывает путь вашего запроса через систему. Она объединяет фрагменты информации из журналов разных служб в цельную картину, позволяя пользователям лучше понять взаимосвязь между различными компонентами системы и выявить слабые места.
Каждый этап трассировки детально показывает, через какие этапы прошёл запрос, сколько времени заняло каждое действие и общее время, необходимое для обработки запроса. В то время как журналы предоставляют детали о действиях, выполняемых каждым сервисом, система трассировки предлагает полную карту всех событий, начиная с первоначального запроса.
Таким образом, трассировка не просто предоставляет данные о событиях в системе, она создаёт полный путеводитель по жизненному циклу запроса, который помогает разработчикам распознавать проблемы с производительностью и эффективно реагировать на них.
Как работает трассировка
Перед началом работы с трассировкой стоит разобраться в структуре монолитных или микросервисных приложений.
Монолитные приложения создаются как единая блочная структура, где все функции приложения тесно связаны и работают как одно целое. В отличие от них, микросервисные архитектуры состоят из отдельных, независимо функционирующих модулей или служб, каждая из которых отвечает за отдельную функцию в приложении и часто поддерживается отдельной командой разработчиков.
Микросервисные архитектуры стали основой многих современных приложений, поскольку они облегчают масштабирование, тестирование и быстрое внедрение обновлений. Эта модульность также помогает предотвратить возникновение единой точки отказа, повышая надёжность системы.
Однако диагностика проблем в микросервисных приложениях – это довольно трудная задача из-за их разнообразия и сложности взаимодействий между отдельными сервисами, а также множественных связей между службами, которые могут участвовать в обработке одного запроса.
Трассировка позволяет разработчикам визуализировать весь путь запроса от фронтенда к серверным процессам, тем самым точно локализуя места сбоев или узкие места в производительности. При отправке запроса пользователем, например, через веб-форму, система трассировки генерирует уникальный идентификатор, который присваивается запросу. Этот идентификатор помогает отслеживать каждый шаг обработки запроса, что значительно упрощает процесс устранения неполадок.
Для сбора данных о маршруте запросов в сети и используются такие инструменты, как Traceroute и Tracert. Эти утилиты позволяют выявлять маршруты прохождения данных в сети, что полезно не только для диагностики сетевых проблем, но и для анализа производительности сетевой инфраструктуры.
Как работает Traceroute / Tracert
- Утилита использует определённый протокол для отправки последовательности IP-пакетов (UPD или ICPM).
- По умолчанию количество пакетов ограничено и равно 3.
- Каждый следующий пакет отправляется с увеличением времени жизни TTL (Time To Live) на 1. Так, у первого пакета TTL=1, у второго – TTL=2 и так далее.
- При передаче от одного маршрутизатора к другому TTL каждого пакета уменьшается на 1, чтобы предотвратить возможное бесконечное перемещение пакета между маршрутизаторами.
- Когда TTL пакета достигает нуля, маршрутизатор уничтожает пакет и отправляет обратно сообщение об ошибке.
Этот путь помогает утилите определить каждый маршрутизатор на пути к назначению, поскольку каждый из них отклоняет пакет и отвечает на него.
В чём заключаются отличия Tracert от Traceroute
Хотя Tracert и Traceroute выполняют схожие функции, их реализация в различных операционных системах отличается по методам и протоколам.
Tracert
Tracert – это утилита, которая использует протокол ICMP (Internet Control Message Protocol) для отслеживания пути пакетов данных.
Процесс начинается с отправки ICMP-пакета с начальным TTL (Time to Live) равным 1. TTL – это условных счётчик на каждом маршрутизаторе, который уменьшается на единицу при каждом переходе пакета от одного устройства к другому.
Когда TTL достигает нуля, маршрутизатор, обработавший пакет, не отправляет его дальше, а возвращает исходному хосту сообщение ICMP «Time Exceeded», что позволяет Tracert зарегистрировать устройство как промежуточный пункт (хоп).
Этот процесс повторяется, увеличивая TTL на единицу за каждую итерацию, пока либо не будет достигнут конечный хост, либо не будет достигнут предел (как правило, в 30 или 64 прыжка). Когда пакет наконец достигает целевого хоста, он посылает сообщение Echo Reply, сообщая об успешном завершении трассировки.
Traceroute
На Unix-подобных системах (например, Linux и MacOS) используется утилита Traceroute, которая отличается использованием UDP (User Datagram Protocol) вместо ICMP для отправки пакетов.
Traceroute отправляет несколько UDP-пакетов с последовательно увеличивающимися значениями TTL (начиная с 1 и далее). Как и в случае с Tracert, каждый маршрутизатор уменьшает TTL на 1, и при достижении нуля отправляет обратно ICMP сообщение «Time Exceeded».
Ключевое отличие состоит в том, как Traceroute определяет достижение конечной цели: когда UDP-пакет достигает целевого хоста, последний обычно отвечает сообщением «Destination Port Unreachable» из-за того, что целевой порт (обычно редко используемый порт, например, 34434) закрыт. Это сообщение означает, что пакет достиг своего конечного пункта.
Как использовать Tracert / Traceroute
Утилита Tracert (Windows)
Общий синтаксис:
tracert [-d] [-h максимальное-число] [-j список-узлов] [-w таймаут] [-R] [-S адрес-источника] [-4] [-6] <доменное имя или IP-адрес>
- Нажмите клавишу Win, чтобы открыть меню «Пуск».
- Введите cmd в поисковой строке и выберите «Командная строка» в результатах поиска.
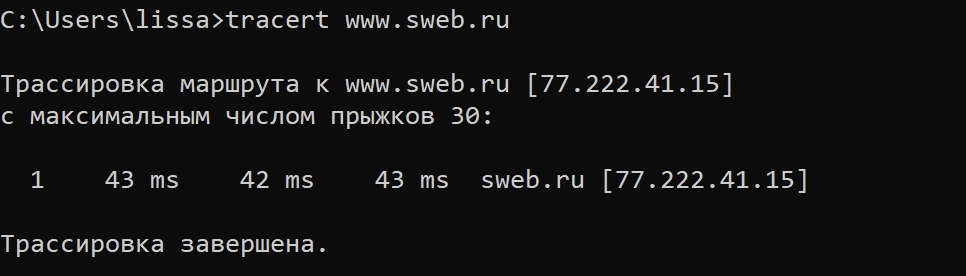
- В открывшемся окне командной строки введите tracert, затем добавьте доменное имя или IP-адрес цели. Например:
tracert www.sweb.ru
- Нажмите Enter, чтобы выполнить команду и начать трассировку.
Результат будет примерно следующим:
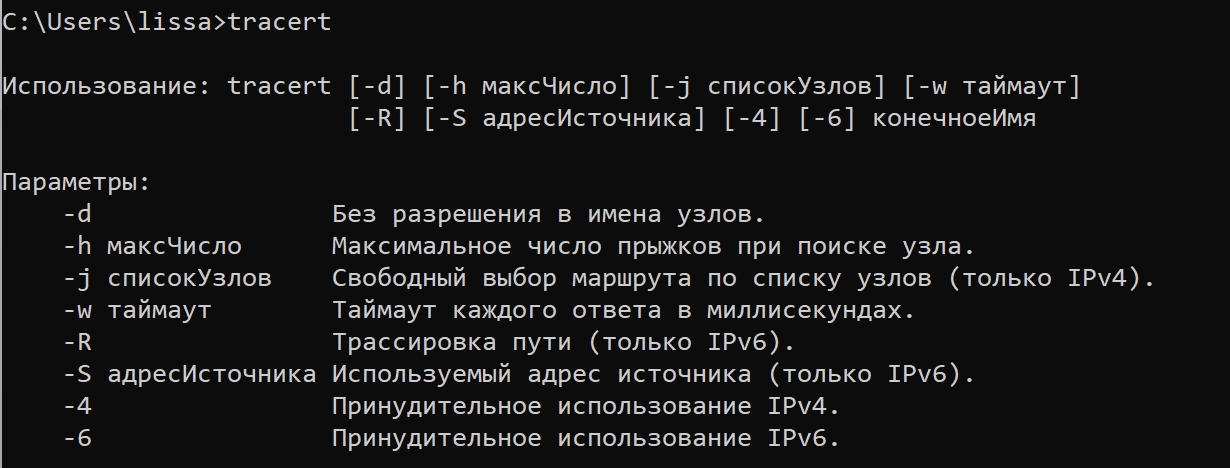
Вы также можете включить добавить к команде Tracert различные дополнительные параметры, которые помогут уточнить и улучшить результаты вашей трассировки.
Ниже приведены примеры некоторых параметров для этих команд:
|
Команда |
Описание |
|---|---|
|
-h [количество-прыжков] |
Укажите максимальное количество прыжков при поиске узла. По умолчанию это значение равно 30. |
|
-n |
Исключает доменные имена из результатов Traceroute. |
|
-q [количество пакетов] |
По умолчанию команда Tracert отправляет 3 пакета. Этот параметр помогает изменить это число. |
|
-j [список-узлов] |
Позволяет выбрать маршрут по списку узлов (только для IPv4). |
|
-w wait_time |
Устанавливает максимальное время ожидание каждого ответа в миллисекундах. |
|
-p |
Задаёт порт назначения для запроса. |
|
-f |
Указывает, с какого TTL начать. По умолчанию значение равно 1. |
|
-4 |
Задаёт принудительное использование IPv4. |
|
-6 |
Задаёт принудительное использование IPv6. |
Утилита Traceroute (Linux и macOS)
Общий синтаксис:
traceroute [опции] <доменное имя или IP-адрес>
- Зажмите сочетание клавиш Ctrl + Shift + T, чтобы открыть терминал.
- Введите команду traceroute, затем добавьте доменное имя или IP-адрес цели. Например:
traceroute www.sweb.ru
- Для запуска процесса нажмите Enter.
Результат будет примерно следующим:
Вы также можете включить добавить к команде Traceroute различные дополнительные параметры, которые помогут уточнить и улучшить результаты вашей трассировки.
Ниже приведены примеры некоторых параметров для этих команд:
|
Параметр |
Описание |
|---|---|
|
-I |
Команда Traceroute в Linux по умолчанию отправляет пакеты-пробы с использованием протокола UDP. Эта опция позволяет изменить их на пакеты ICMP. |
|
-n |
Исключает имена устройств из результатов Traceroute. |
|
-q [количество-пакетов] |
По умолчанию Traceroute отправляет три пакета. Вы можете изменить это количество, используя эту опцию и указав количество пакетов. |
|
-d |
Включает отладку на уровне сокетов. |
|
-m [максимальное-TTL] |
Задаёт максимальное количество прыжков для процесса трассировки. По умолчанию максимальное значение TTL составляет 30. |
|
-w [время-ожидания] |
Задаёт максимальное время ожидания для каждого ответа. |
|
-r |
Позволяет обойти обычные таблицы маршрутизации и направить IP-пакеты непосредственно хосту в прямо подключенной сети. |
|
-p |
Устанавливает порт назначения для запроса. По умолчанию используется порт 33434. |
|
-g [адрес-шлюза] |
Направляет исходящие пакеты на указанный шлюз, используя опцию маршрутизации по исходному IP. |
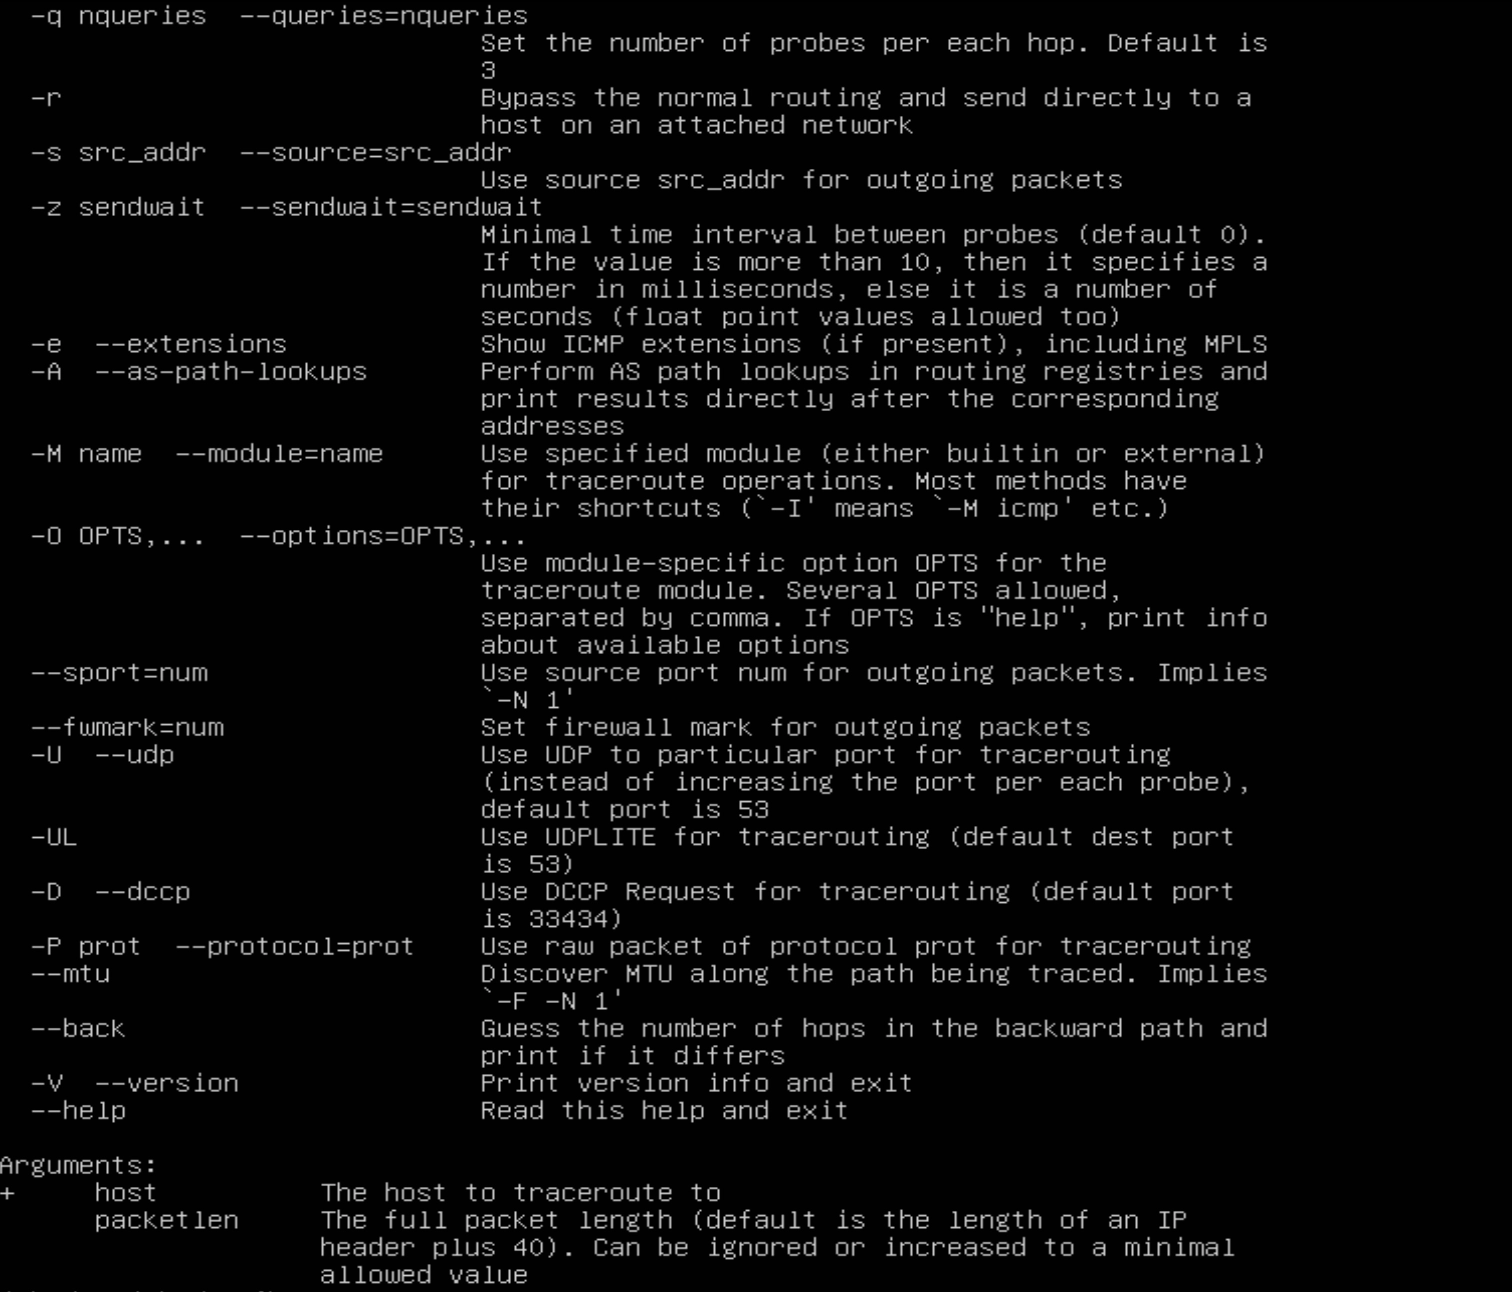
|
-e |
Показывает расширения ICMP (если они есть). |
|
— А |
Выполняет поиск пути AS в реестрах маршрутизации и выдаёт результаты непосредственно после соответствующих адресов. |
|
-M [название-модуля] |
Использует указанный модуль (встроенный или внешний) для трассировки. |
Как расшифровать выводы Tracert и Traceroute
После запуска команды Tracert или Traceroute, система отобразит результаты в форме строк. Отчёт может выглядеть по-разному в зависимости от используемой операционной системы, но обычно он содержит аналогичные данные.
Стандартный отчёт по результатам Tracert или Traceroute состоит из нескольких строк, где каждая строка соответствует одному прыжку (хопу) пакета к конечному хосту. Эти строки поделены на столбцы, в которых отображена различная информация.
Рассмотрим подробнее, что представляет собой каждый столбец и какие детали он содержит:
|
Номер прыжка |
Имя хоста/IP-адрес |
RTT1 |
RTT2 |
RTT3 |
|---|---|---|---|---|
|
8 |
188.128.126.238 |
24.793 ms |
24.411 ms |
24.406 ms |
|
11 |
77.222.41.15 |
57.337 ms |
42.930 ms |
53.653 ms |
|
18 |
216.58.211.228 |
56.633 ms |
60.929 ms |
53.285 ms |
Где:
- Номер прыжка указывает, какой по счёту сделанный прыжок (хоп).
- Имя хоста/IP-адрес указывает IP-адрес или имя хоста устройства на определённом переходе.
- RTT – это время приёма-передачи. Благодаря ему можно узнать, сколько времени потребовалось каждому пакету, чтобы достичь определённого IP-адреса и вернуться обратно.
Если в процессе трассировки время ожидания на каком-то узле превышено, это может указывать на проблему в этой точке или на то, что маршрут выбран неправильно, из-за чего пакет не может достичь конечной цели.
В отчёте это отображается следующим образом:
|
Номер прыжка |
RTT1 |
RTT2 |
RTT3 |
|
|---|---|---|---|---|
|
20 |
* |
* |
* |
Превышен интервал ожидания для запроса. |
Таким образом, утилиты Traceroute и Traceroute – это полезные инструменты для диагностики сети. Они могут отличаться в зависимости от операционной системы – Linux и macOS используют Traceroute, в то время как Windows работает с Tracert. Однако общая функциональность и представленная информация в отчёте схожи.
Надеемся, что эта статья помогла вам понять, что это за команды и как сделать трассировку.
The tracert (which is short for trace route) is a Windows network command-line utility used to help diagnose network routing issues. If you are familiar with Linux, this tool is similar to traceroute. With tracert, you can learn details about each router (hop) that make up your network connection pathway to a remote device. It can help to determine why your connections may be poor and can help you identify where exactly the problem is.
These commands shown here are tested on a computer with Windows 10 but most will work in other versions of Windows as well.
Table of Content
- Overview
- How to Launch Command Prompt
- Tracert Syntax
- Tracert Parameters
- Example Usage
- tracert <IP Address> — Perform a Trace Route to a Specific IP Address
- tracert <URL> — Perform a Trace Route to a Specific Website
- tracert -h — Set the Maximum Number of Hops to Trace
- tracert -d — Skip Reverse Lookup to Speed Up Tracert
- Reading tracert Results
- Analyzing tracert Results
- Other Usages and Getting Help
- Tips
- General Tracert Tips
- Example of a Good Tracert Result
- Example Tracert Result of a Failed Hop
- Example Tracert Result of a Routing Loop Problem
- Redirect Output to Text File
- Recommended Reading
- Summary
Overview
The tracert utility is a Windows command-line tool used to diagnose network issues. It is used to report pathway between one network device to another. By using tracert, we can identify the route your connection takes to reach the remote device. The network pathway typically requires traversing multiple routers (refer to as hops) to reach the remote device. This makes troubleshooting network connectivity issues a bit more involved as there are many devices that can contribute to the problem. With the tracert tool, you’ll be able to check on connection problems with ease as it can help you identify the specific device that is causing problems. It will trace the pathway your connection takes to the destination by providing information on each device (typically a router) and on its progress.
It is important to be aware that tracert result is a single snapshot of the network at the time it was performed. You should perform tracert multiple times to ensure you have a fair sampling of data to use in your troubleshooting efforts.
How to Open Command Prompt
To use this utility, you will need to launch the Command Prompt window. The three common ways to launch the Command Prompt window are:
- Search for
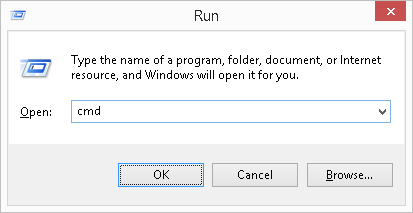
cmdusing the built-in Windows search tool. - Right-click on the Start icon and select Command Prompt.
- Press the keyboard combination WinKey + R, then type
cmdat the Run window that appears.
Tracert Syntax
tracert [-d] [-h <MaximumHops>] [-j <Hostlist>] [-w <timeout>] [-R] [-S <Srcaddr>] [-4][-6] <TargetName>
Tracert Parameters
| Parameter | Description |
|---|---|
| -d | Do not resolve addresses of intermediate routers to their hostnames. This can speed up tracert performance. |
| -h maximum_hops | Set the maximum number of hops in the path to search for target. Default is 30 hops. |
| -j host-list | Loose source route along host-list (IPv4-only). With loose source routing, successive intermediate destinations can be separated by one or more routers. The maximum number of addresses of names is the host list is nine (9). The hostlist is simply a series of IP addresses in dotted decimal notation (e.g., 192.168.128.8) each separated by spaces. This parameter is only for IPv4 addresses. |
| -w timeout | Set the amount of time (in milliseconds) to wait for each reply. |
| -R | Trace round-trip path (IPv6-only). |
| -S srcaddr | Source address to use (IPv6-only). |
| -4 | Force tracert to use IPv4 for the trace. |
| -6 | Force tracert to use IPv6 for the trace. |
| TargetName | Specifies the destination, either an IP address or a host name. |
| /? | Displays help information. |
Example Usage
There are a variety of switches (sub commands) available with the tracert utility that allows your to configure how it behaves
tracert <IP Address> — Trace Route to a Specific IP Address
To trace the route to a specific IP address, for example 72.47.244.140, type the following in the command window then press Enter: tracert 72.47.244.140
It can take a few minutes for the trace to complete. If you wish to abort a trace, press CTRL+C on your keyboard.
As the illustration below shows, each time the data packet reaches a router (a hop) along its way to the destination, tracert will report back information about that router. This information include the IP address and hostname, if available, of the router, and the time it took between each hop.

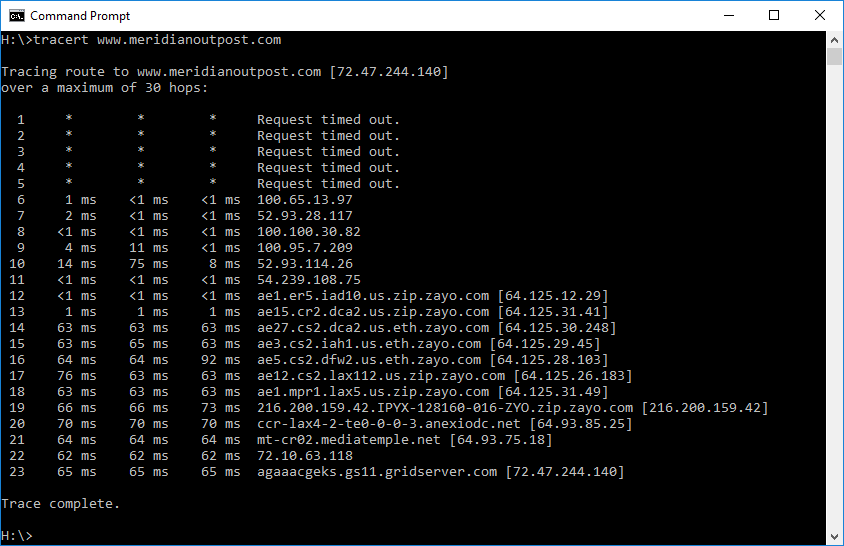
tracert <URL> — Trace Route to a Specific Website
To trace the route to a specific domain, such as www.meridianoutpost.com, type the following in the command window then press Enter: tracert www.meridianoutpost.com
It can take a few minutes for the trace to complete. If you wish to abort a trace, press CTRL+C on your keyboard.
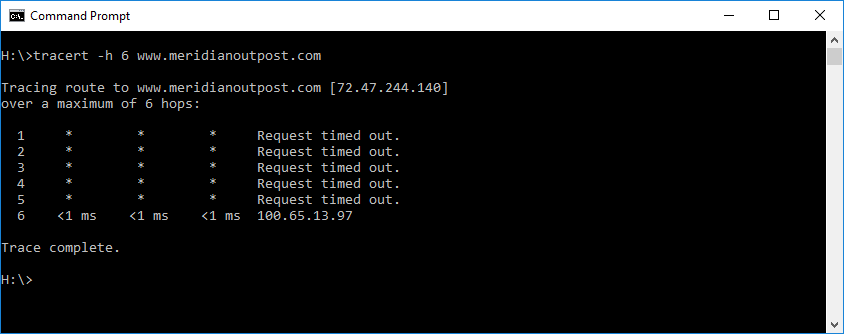
tracert -h — Set the Maximum Number of Hops to Trace
By default, tracert will trace the complete pathway from your computer to the remote host. However, sometimes you only need to trace up to a specific router or a specific number of hops. Limiting a trace to just a specific number of hops will help you use tracert more efficiently. By using the -h switch, you can specify the maximum number of hops tracert will go through.
For example, to trace to the 6th hop to the website www.meridianoutpost.com, type the following in the command window then press Enter: tracert -h 6 www.meridianoutpost.com
tracert -d — Skip Reverse Lookup to Speed Up Tracert
By default, tracert will perform a reverse IP lookup to identify the hostname for each hop. If there is no hostname available, tracert will have to wait for a timeout before it continues to the next hop. Waiting for the timeout can account for the majority of time it take tracert to complete a trace. If knowing the hostname is not important for your troubleshooting efforts, you can use the -d switch to skip this lookup.
For example, to perform a trace to www.meridianoutpost.com without resolving IP addresses to host names, type the following in the command window then press Enter: tracert -d www.meridianoutpost.com
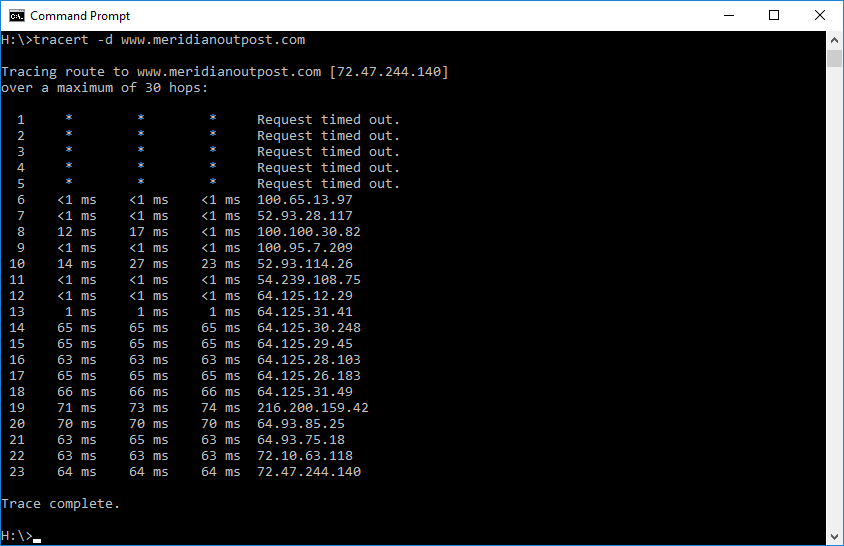
Reading Tracert Results
The information in a tracert reports can look overwhelming. This section will help you better understand what it means.
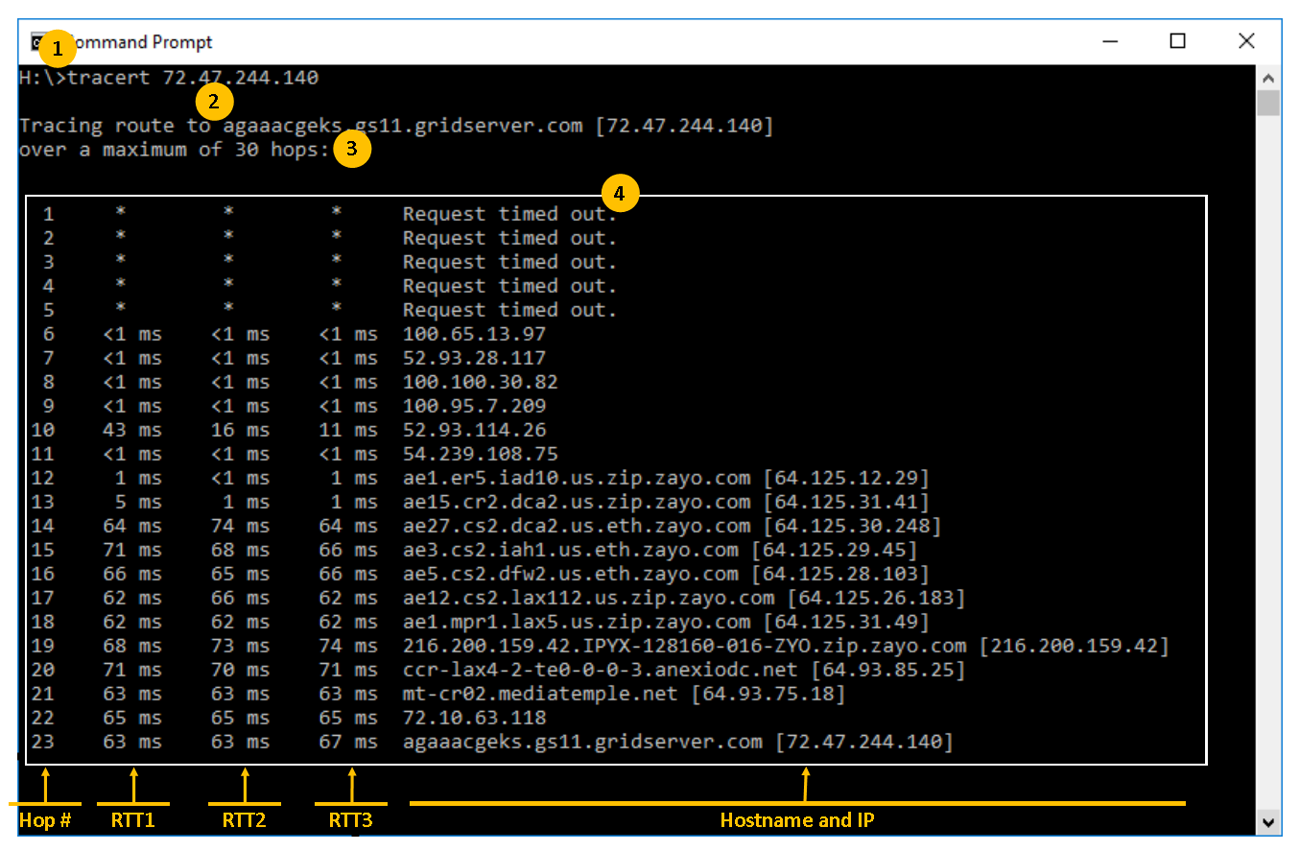
Area 1 — This is the tracert command that was typed
Area 2 — This shows what tracert is performing. In the example illustration, it is performing a trace to the destination IP of 72.47.244.140, which a reverse lookup identifies this with a hostname of agaaacgeks.gs11.gridserver.com.
Area 3 — This is the maximum number of hops that will be used to trace the route. For Windows tracert, the default is 30 hops. This means, tracert will only trace to the first 30 routers. This parameter can be increased by using the -h switch if necessary.
Area 4 — This portion of the tracert output shows information on each hop that handled your data packet to help it along to the destination. There are five columns of data shown in this report.
- Hop Number — This is the first column and is simple the number of the hop in the network pathway from your computer to the remote device. The highest this will go to will be no more than the Windows tracert of 30, or what you define using the
-hswitch. - Round Trip Times (RTT) — Expressed in milliseconds (ms), these three columns report the time it took for a data packet to go from your computer to the hop and back to your computer (sometimes refer to as latency). By default, Windows tracert sends three packets to each hop. Thus, each hop line in the report will show three round trip times. In the illustration below, these are highlighted as RTT1, RTT2, and RTT3.
- Host Name / IP — This last column shows the hostname and the IP address of the hop.
Analyzing Tracert Results
Round Trip Times (RTT)
- RTT (latency) is the main thing you want to focus on in your tracert report. For these values, the lower the number, the better. You also want to see fairly consistent times for each hop.
- RTT above 150ms within the United States is considered to be long, but may be normal if the remote device is in the opposite side of the world.
- If an asterisk (*) appears for RTT instead of a time, this indicates that the packet was not received back within the expected time frame. For Windows tracert, the default is 4,000 milliseconds (or 4 seconds). This parameter can be increased by using the
-wswitch if necessary. Seeing one or two asterisks does not necessarily indicate a problem. Routers can be configured to limit the number of ping or tracert packets it responses to as a way to prevent them from being affected by denial-of-service attacks. - If there are three asterisks followed by a Request Timed Out message, there can be a few reasons for this:
- If this appears at the beginning of a tracert report, it can be ignored as it is often due to the device configured to not respond to ping and tracert packets.
- If this appears toward the end of a tracert report, it can indicate one of the following:
- Firewall — A security device (such as a firewall) at the destination network is blocking the request. However, this does not mean the destination device is not reachable (such as a web server). This only indicates that a security device is configured to not response to ping or tracert packets.
- Problem with Return Path — As mentioned, RTT measures the round trip time a packet traverse from your computer to the router and back. The pathway to the hop is often not going to be same for the return trip.
- Problem with Remote Device — The remote device is not configured correctly or has system problems affecting your connection.
- A progressively increase in latency to the remote device can indicate an issue starting with the hop where the sudden increase began.
- A high latency in the middle of your tracert report does not necessarily indicate a problem as the associated router may have be configured to respond to ping and tracert packets with low priority.
- A high latency at the beginning of a tracert report (the first two hops) may indicate issues with your local network or Internet Service Provider (ISP). To resolve, contact the I.T. department of your organization or your ISP.
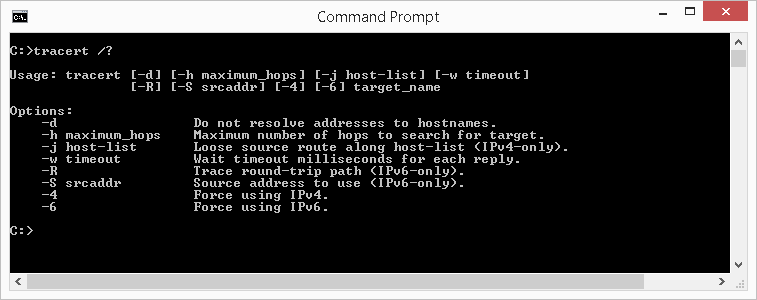
Other Usages and Getting Help
The example usage described in the article shows only some of the sub commands available with tracert. To get a list of the available switches, type the following in the command window then press Enter: tracert /?
Tips
General Tracert Tips
- If pinging a host fails, try using the tracert utility to identify where the data packet is failing along its route.
- RTT of over 150ms, within the United States, is considered high. If your remote host is on another continent, RTT of over 150ms may be normal.
- A network device must be configured to response to ping or tracert packets (ICMP echo requests), otherwise you will see asterisks for RTTs.
- Use the
-dswitch to skip reverse IP lookup to speed up tracert.
Example of a Good Tracert Result
The following is an example of a good tracert result. On hop 9, the device did not respond, as indicated with the asterisks.. However, because hop 10 responded, we know hop 9 was able to handle the packet to move to forward to the next hop. In this scenario, the router on hop 9 is likely configured to not response to ICMP packets, but it is functioning properly to in routing data packets. A tracert result with no asterisks is also a good result.
1    13 ms    22 ms    25 ms  52.93.114.64
1    <1 ms    <1 ms     1 ms  54.239.108.177
2    <1 ms    <1 ms    <1 ms  64.125.12.29
3     2 ms     2 ms     2 ms  64.125.31.41
4     65 ms    65 ms    65 ms  64.125.30.248
5     65 ms    66 ms    65 ms  64.125.29.45
6     65 ms    65 ms    65 ms  64.125.28.103
7     82 ms    65 ms    65 ms  64.125.26.183
8     65 ms    65 ms    65 ms  64.125.31.49
9     *        *        *      216.200.159.42
10    64 ms    65 ms    64 ms  64.93.85.25
11    66 ms    66 ms    66 ms  64.93.75.18
12    65 ms    65 ms    65 ms  72.10.63.118
13    64 ms    64 ms    64 ms  72.47.244.140
Example Tracert Result of a Failed Hop
The following is an example of a tracert result.showing a failed hop.Starting with hop 9, we see all hops from that point forward are not responding. This indicates hop 9 is faulty or mis-configured and not forwarding traffic to the next hop. Hop 9 is where you want to start your troubleshooting.
1    13 ms    22 ms    25 ms  52.93.114.64
1    <1 ms    <1 ms     1 ms  54.239.108.177
2    <1 ms    <1 ms    <1 ms  64.125.12.29
3     2 ms     2 ms     2 ms  64.125.31.41
4     65 ms    65 ms    65 ms  64.125.30.248
5     65 ms    66 ms    65 ms  64.125.29.45
6     65 ms    65 ms    65 ms  64.125.28.103
7     82 ms    65 ms    65 ms  64.125.26.183
8     65 ms    65 ms    65 ms  64.125.31.49
9     *        *        *      Request timed out
10    *        *        *      Request timed out
11    *        *        *      Request timed out
12    *        *        *      Request timed out
13    *        *        *      Request timed out
Example Tracert Result of a Routing Loop Problem
The following is an example of a tracert result showing a routing problem. Starting with hop 8 and hop 9, our packet is bouncing back and forth between these two routers (routing loop). The packet will continued to be passed between 64.125.31.49 and 216.200.159.42 until the maximum hop count is reached (30 is this example) or until the session times out. With a routing loop problem, data will not reach the intend destination.
1 13 ms 22 ms 25 ms 52.93.114.64
1 <1 ms <1 ms 1 ms 54.239.108.177
2 <1 ms <1 ms <1 ms 64.125.12.29
3 2 ms 2 ms 2 ms 64.125.31.41
4 65 ms 65 ms 65 ms 64.125.30.248
5 65 ms 66 ms 65 ms 64.125.29.45
6 65 ms 65 ms 65 ms 64.125.28.103
7 82 ms 65 ms 65 ms 64.125.26.183
8 65 ms 65 ms 65 ms 64.125.31.49
9 65 ms 65 ms 72 ms 216.200.159.42
10 64 ms 65 ms 64 ms 64.125.31.49
11 66 ms 66 ms 66 ms 216.200.159.42
…
…
…
29 64 ms 65 ms 66 ms 216.200.159.42
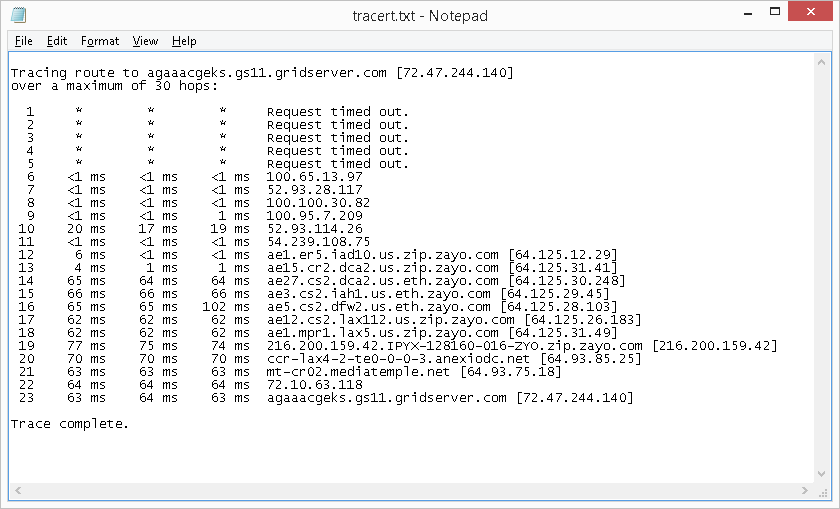
30 64 ms 64 ms 64 ms 64.125.31.49Redirect Output to Text File
- Instead of displaying the results on the screen, you can have the results saved automatically to a text file on your computer. To do this, simply use the «>» symbol followed by the folder path and file name of your choice. For example, to redirect the output of tracert 72.47.244.140, type the following in the command window then press Enter:
tracert 72.47.244.140 > c:\temp\tracert.txtThis will create a file named tracert.txt in the folder path c:\temp that will have your result. You can then open this file with any text editor, such as Notepad on a Windows computer, as illustrated below.
Recommended Reading
Improve confidence and job performance
Improve productivity and efficiency
Learn more,
earn more
Life-long
investment
To learn more about this topic, we are providing you with recommendations to help you further your knowledge. These are our affiliate links to Amazon where you can purchase them and also explore a variety of other relevant books.
Summary
The tracert utility is a valuable tool for troubleshooting network issues, particularly for large networks. It will help you identify where a problem lies on a network if you are unable to reach a remote host. If you are a network administrator or network engineer, this is a great utility to become familiar with.
- Команда ping
- Как пользоваться ping
- Команда tracert
- Как запустить tracert
В статье мы расскажем, для чего нужны утилиты ping и tracert, как запустить эти утилиты, а также приведем примеры команды ping для диагностики сети.
Ping и tracert — это утилиты для проверки целостности соединений в сетях и определения маршрутов следования данных на основе TCP/IP. Без этих утилит не обойтись не только при администрировании серверов (или целой сети), но и в условиях «домашней» диагностики.
Команда ping
Команда ping — один из базовых инструментов для работы с сетью. С помощью ping можно проверить сервер и его доступность с любого компьютера, а также соединение между устройствами.
Если вы задавались вопросом «Как я могу узнать мой IP адрес и порт?», то мы дадим вам ответ: командой пинг можно как узнать порт компьютера, так и определить его IP.
Также с помощью команды ping можно выполнить такие диагностические задачи, как:
-
измерить время взаимодействия между двумя хостами;
-
проверить IP-адрес конкретного хоста в локальной и глобальной сети;
-
автоматически проверить сетевое устройство (например, когда ping является частью bash-скрипта);
-
проверить пинг до сервера и др.
Как пользоваться ping
Если у вас Windows
-
Откройте меню «Пуск», кликните по пункту Выполнить или нажмите сочетание клавиш Win + R.
-
В поиске введите команду «cmd» и кликните Enter.
-
В окне терминала введите команду:
ping имя_сайта (домен) или ping IP_сервера.
Если у вас Linux
1. Откройте терминал. Для этого:
-
в Unity (Ubuntu): перейдите в «Главное меню» и введите слово «Терминал» в поисковой строке или наберите сочетание клавиш Ctrl+Alt+T;
-
в Xfce (Xubuntu): перейдите в «Главное меню» — «Приложения», затем выберите «Система» — «Терминал»;
-
в KDE (Kubuntu): перейдите в «Главное меню» — «Приложения», затем выберите «Система» — «Терминал».
2. В окне терминала введите команду:
ping имя_сайта (домен) или ping IP_сервера.
Если у вас кириллический домен
Для Windows и Linux кириллические домены нужно вводить в формате Punycode. Перевести домен в формат Punycode можно через сервис. Сконвертируйте имя кириллического домена и вставьте его в окно терминала следующим образом: ping xn--2-8sble8ahe.xn--p1ai
Если у вас MacOS
-
В Spotlight выберите и запустите сетевую утилиту Network Utility.
-
В открывшемся окне перейдите на нужную вкладку.
На вкладке Ping введите имя домена (или IP-адрес) и кликните Отследить:
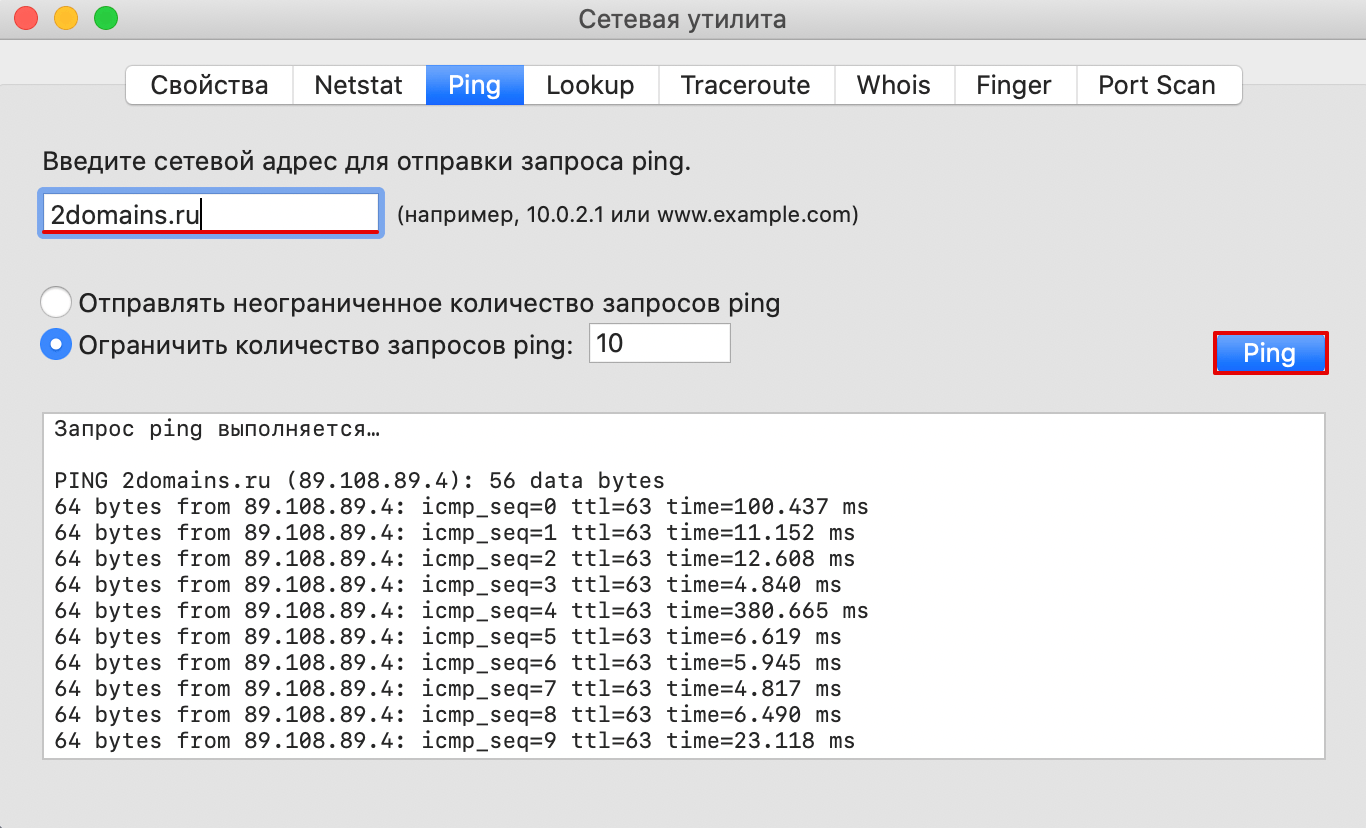
Готово, вы запустили утилиту ping.
Команда tracert
Команда tracert – самый популярный инструмент сетевой диагностики. С помощью tracert можно проверить путь запроса к серверу и выявить проблемы, связанные с доступностью удаленного сервера. Сообщения отправляются с эхо-запросом по протоколу ICMP, и после каждой передачи выводится сообщение с эхо-ответом.
Командой tracert можно проверить:
-
маршрут от локального компьютера до удаленного узла;
-
количество узлов в сети;
-
время прохождения пакета до конечного, транзитного и промежуточного узлов;
-
точку потери пакета;
-
пинг порта через командную строку.
Как запустить tracert
Если у вас Windows
-
Откройте меню «Пуск», кликните по пункту Выполнить или нажмите сочетание клавиш Win + R.
-
В поиске введите команду «cmd» и кликните Enter.
-
В открывшемся окне терминала введите команду:
tracert имя_сайта (домен) или tracert IP_сервера.
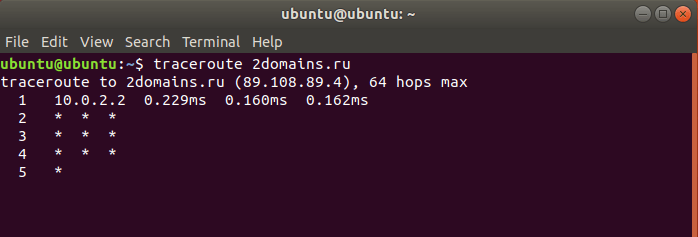
Если у вас Linux
1. Откройте терминал. Для этого:
-
в Unity (Ubuntu): перейдите в «Главное меню» и введите слово «Терминал» в поисковой строке или нажмитесочетание клавиш Ctrl+Alt+T;
-
в Xfce (Xubuntu): перейдите в «Главное меню» — «Приложения», затем выберите «Система» — «Терминал»;
-
в KDE (Kubuntu): перейдите в «Главное меню» — «Приложения», затем выберите «Система» — «Терминал».
2. В окне терминала введите команду:
traceroute имя_сайта (домен) или traceroute IP_сервера.
Если у вас MacOS
-
В Spotlight выберите и запустите сетевую утилиту Network Utility.
-
В открывшемся окне перейдите на нужную вкладку.
На вкладке Traceroute введите имя домена (или IP-адрес) и кликните Отследить:
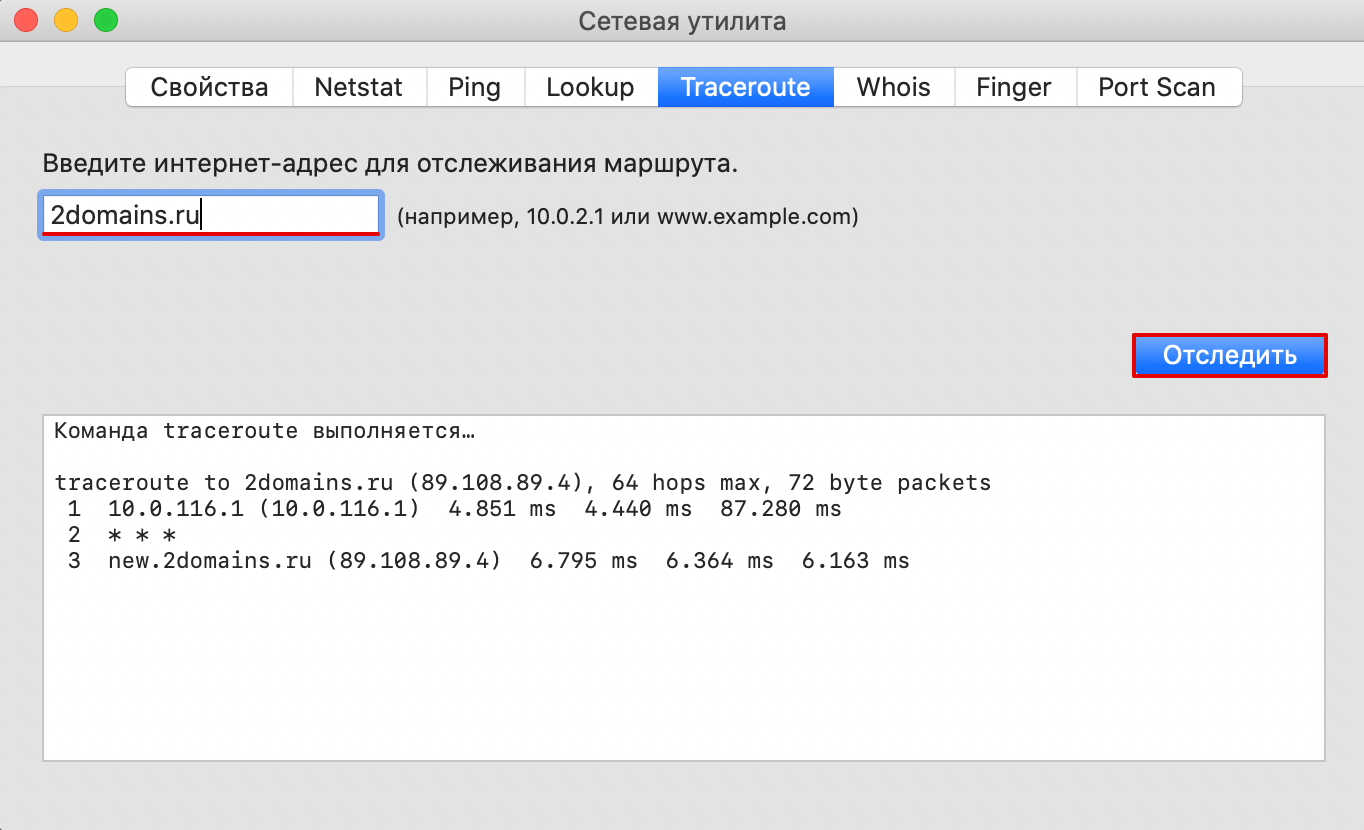
Готово, вы запустили утилиту tracert.
Если у вас установлена ОС Windows и вы хотите упростить диагностику подключения, скачайте утилиту WinMTR. Как пользоваться WinMTR, читайте на тематических блогах.