
Рассказываем, как открыть диспетчер задач в Windows и что делать, если привычные методы не работают.
Функции
Как открыть
Альтернативные методы
Не открывается
Доступ запрещен
Функции
Как открыть
Альтернативные методы
Не открывается
Доступ запрещен

Если компьютер начал тормозить, первое, что стоит сделать — запустить менеджер процессов. Он помогает увидеть, какие приложения запущены сейчас, сколько они потребляют ресурсов и что нагружает программное обеспечение. Это ключ к управлению системой.
Инструмент часто нужен в тот момент, когда система зависает и перестает реагировать на команды. Поэтому полезно знать разные способы открыть диспетчер задач в Windows. Делимся подборкой методов и разбираемся, почему средство мониторинга может не открываться. Выясняем, как вернуть к нему доступ.
Функции диспетчера задач
Если утилита перестает открываться, это не просто неудобство, а серьезное ограничение в управлении Windows. Пользователь теряет инструмент контроля, поскольку диспетчер задач — это не только список процессов.
Вот что позволяет делать менеджер.
-
Следить за тем, какие процессы перегружают систему и могут снижать производительность.
-
Завершать работу зависших или конфликтующих между собой приложений.
-
Принудительно завершать зависшие процессы программ, которые не закрылись корректно.
-
Просматривать активные приложения и фоновые процессы.
-
Отслеживать нагрузку на процессор, оперативную память, диск, сеть и видеокарту.
-
Управлять автозагрузкой программ при старте системы.
-
Просматривать список активных пользователей и уровень их нагрузки на систему.
-
Вручную запускать новые задачи.
-
Получать подробную информацию о каждом процессе — от пути к файлу до цифровой подписи.
-
Принудительно закрывать вредоносные программы или нестабильные процессы.
Как быстро открыть диспетчер задач на компьютере
Самые простые и надежные способы, которых в большинстве случаев вполне достаточно.
1. Горячие клавиши
Нажмите одновременно горячие клавиши Ctrl + Shift + Esc. Пока клавиатура работает без сбоев и система хоть немного откликается, этот метод станет вашим главным способом.

2. Экран безопасности
Нажмите комбинацию Ctrl + Alt + Del. В появившемся служебном меню выберите пункт диспетчер задач. Эта легендарная комбинация, вошедшая в поп-культуру, выручает, например, во время игр, которые не дают использовать стандартное Ctrl + Shift + Esc. Комбинация будет работать, поскольку имеет приоритет над большинством процессов. После ее ввода можно заблокировать компьютер, сменить пользователя, выйти из системы, перезагрузить или перевести компьютер в режим ожидания.

3. Меню «Пуск»
Кликните по кнопке «Пуск» и начните вводить в поисковом окне диспетчер задач или Task Manager.

4. Панель задач
Щелкните правой кнопкой мыши по пустому месту на панели задач и выберите пункт диспетчер задач в открывшемся меню.

5. Панели управления
Нажмите [Windows] + S и введите диспетчер задач или Task Manager.

6. Win + X меню
Щелкните правой кнопкой по иконке «Пуск» или нажмите [Windows] + X. Удобный вариант, особенно если клавиатура не работает и приходится пользоваться мышью. Меню опытного пользователя содержит множество полезных инструментов — в том числе и диспетчер задач.
Альтернативные методы открытия диспетчера задач
В некоторых ситуациях стандартные варианты бывают недоступны. Например, если приложение блокирует работу горячих клавиш. Тогда на помощь приходят альтернативные методы.
1. Диалоговое окно Win + R
Нажмите [Windows] + R, в диалоговом окне введите taskmgr и нажмите OK.

2. Проводник
Откройте любой каталог в Проводнике, впишите taskmgr в адресную строку и подтвердите.

3. Командная строка
Нажмите [Windows] + R, введите cmd и нажмите Enter. В открывшейся командной строке наберите taskmgr и снова подтвердите ввод кнопкой Enter. Это не самый быстрый путь, но он выручит, если, например, не работает Проводник или вы уже находитесь в терминале.

4. Запуск исполняемого файла вручную
У диспетчера задач есть свой .exe-файл, как у любого другого приложения.
-
Откройте Проводник.
-
Перейдите в папку C:\Windows\System32.
-
Найдите файл с именем Taskmgr и запустите его двойным щелчком.
Если файлов в папке много, проще вбить имя в строку поиска. А если Windows установлена не на диске C, просто замените букву на ту, где находится система.

Другой вариант: введите адрес C:\Windows\System32\ в строке поиска Проводника, чтобы напрямую получить доступ к местоположению утилиты.

Что делать, если диспетчер задач не открывается
Если утилита в Windows не открывается вообще — ни с клавиатуры, ни через поиск, ни каким-либо другим способом — скорее всего, система столкнулась со сбоем. Он может быть вызван поврежденными файлами, действиями вредоносного программного обеспечения или некорректной работой интерфейса.
Первое, что стоит сделать — проверить систему на вирусы. Некоторые вредоносные программы намеренно деактивируют диспетчер задач, чтобы скрыть свою активность.
Если с безопасностью все в порядке, проверьте целостность системных файлов. Прежде чем перейти к следующим шагам и вносить серьезные изменения в систему, создайте точку восстановления системы и сделайте резервную копию важных данных.
Для этого потребуется запустить командную строку от имени администратора и ввести команду sfc /scannow. Система начнет сканирование и автоматически исправит найденные ошибки. Иногда программа не запускается из-за неправильных записей в реестре. Если вы уверены, что причина в этом, отредактируйте соответствующие ключи самостоятельно.
Иногда проблема связана не с системой в целом, а с конкретной учетной записью. В таком случае стоит попробовать создать нового пользователя и проверить, откроется ли интерфейс мониторинга там. Если все работает, значит, дело в настройках или повреждениях профиля, и возможно, имеет смысл перенести данные на созданный аккаунт.
Если ни один из этих способов не помогает, возможно, повреждения системы слишком серьезные. Тогда потребуется восстановление Windows — через встроенные средства или с установочного носителя.
Как восстановить диспетчер задач после отключения администратором
Если утилита отключена администратором, при попытке ее открыть появляется сообщение, что доступ запрещен. Это бывает сделано намеренно — например, в организациях, где пользователям ограничивают возможности управления системой. Но если вы уверены, что блокировка неуместна или появилась после сбоя, ее возможно снять.
Один из способов — через изменение системного реестра.
-
Откройте окно «Выполнить» комбинацией [Windows] + R и введите команду regedit.
-
В редакторе перейдите в HKEY_CURRENT_USER\Software\Microsoft\Windows\CurrentVersion\Policies\System.
-
Если в правой части окна есть параметр DisableTaskMgr, его значение, скорее всего, установлено в 1 — это и блокирует программу.
-
Поменяйте значение на 0 или удалите параметр совсем, после чего перезагрузите систему. Если параметра нет — можно ничего не трогать. Просто проверьте, не задан ли он.
Будьте осторожны с корректировками в реестре — лучше не менять ничего лишнего.
Иногда блокировка задается через групповую политику. Если у вас есть права администратора, откройте редактор локальной групповой политики.
-
Нажмите [Windows] + R и напишите gpedit.msc.
-
В открывшемся окне перейдите в «Конфигурация пользователя», затем — «Административные шаблоны», «Система».

-
Выберите раздел «Параметры Ctrl + Alt + Del». Там есть настройка «Удалить диспетчер задач».

-
Убедитесь, что она отключена или не задана — тогда система больше не будет мешать запуску инструмента.

После внесения этих изменений менеджер процессов должен снова открываться без ограничений. Если этого не происходит, стоит перезагрузить компьютер и проверить еще раз.
From Wikipedia, the free encyclopedia
Task Manager
|
Task Manager in Windows 11 |
|
| Original author(s) | David Plummer |
|---|---|
| Initial release | August 24, 1996; 28 years ago |
| Written in | C++ |
| Operating system | Windows NT 4.0 and onwards |
| Platform | IA-32, x86-64, ARM and Itanium (and historically DEC Alpha, MIPS, and PowerPC) |
| Predecessor | System Monitor |
| Type | Task manager, system monitor and startup manager |
Task Manager, previously known as Windows Task Manager, is a task manager, system monitor, and startup manager included with Microsoft Windows systems. It provides information about computer performance and running software, including names of running processes, CPU and GPU load, commit charge, I/O details, logged-in users, and Windows services. Task Manager can also be used to set process priorities, processor affinity, start and stop services, and forcibly terminate processes.
The program can be started in recent versions of Windows by pressing ⊞ Win+R and then typing in taskmgr.exe, by pressing Ctrl+Alt+Delete and clicking Task Manager, by pressing Ctrl+⇧ Shift+Esc, by using Windows Search in the Start Menu and typing taskmgr, by right-clicking on the Windows taskbar and selecting «Task Manager», by typing taskmgr in the File Explorer address bar, or by typing taskmgr in Command Prompt or Windows PowerShell.
Task Manager was introduced in its current form with Windows NT 4.0. Prior versions of Windows NT, as well as Windows 3.x, include the Task List application, are capable of listing currently running processes and killing them, or creating new processes. Windows 9x has a program known as Close Program which lists the programs currently running and offers options to close programs as well shut down the computer.[1]
Since Windows 8, Task Manager has two views. The first time Task Manager is invoked by a user, it shows in a simplified summary mode (described in the user experience as Fewer Details). It can be switched to a more detailed mode by clicking More Details. This setting is remembered for that user on that machine.[2]
Since around the release of Windows 2000, the CPU usage could be displayed as a tray icon in the task bar for a quick glance.[3][4]
In summary mode, Task Manager shows a list of currently running programs that have a main window. It has a «more details» hyperlink that activates a full-fledged Task Manager with several tabs.
Right-clicking any of the applications in the list allows switching to that application or ending the application’s task. Issuing an end task causes a request for graceful exit to be sent to the application.
Processes and details
[edit]
The Processes tab shows a list of all running processes on the system. This list includes Windows Services and processes from other accounts. The Delete key can also be used to terminate processes on the Processes tab. By default, the processes tab shows the user account the process is running under, the amount of CPU, and the amount of memory the process is currently consuming. There are more columns that can be shown. The Processes tab divides the process into three categories:
- Apps: Programs with a main window
- Windows processes: Components of Windows itself that do not have a main window, including services
- Background process: Programs that do not have a main window, including services, and are not part of the Windows itself
This tab shows the name of every main window and every service associated with each process. Both a graceful exit command and a termination command can be sent from this tab, depending on whether the command is sent to the process or its window.
The Details tab is a more basic version of the Processes tab, and acts similar to the Processes tab in Windows 7 and earlier. It has a more rudimentary user experience and can perform some additional actions. Right-clicking a process in the list allows changing the priority the process has, setting processor affinity (setting which CPU(s) the process can execute on), and allows the process to be ended. Choosing to End Process causes Windows to immediately kill the process. Choosing to «End Process Tree» causes Windows to immediately kill the process, as well as all processes directly or indirectly started by that process. Unlike choosing End Task from the Applications tab, when choosing to End Process the program is not given a warning nor a chance to clean up before ending. However, when a process that is running under a security context different from the one which issued the call to Terminate Process, the use of the KILL command-line utility is required.[5]
The Performance tab shows overall statistics about the system’s performance, most notably the overall amount of CPU usage and how much memory is being used. A chart of recent usage for both of these values is shown. Details about specific areas of memory are also shown.
There is an option to break the CPU usage graph into two sections: kernel mode time and user mode time. Many device drivers, and core parts of the operating system run in kernel mode, whereas user applications run in user mode. This option can be turned on by choosing Show kernel times from the View menu. When this option is turned on the CPU usage graph will show a green and a red area. The red area is the amount of time spent in kernel mode, and the green area shows the amount of time spent in user mode.
The Performance tab also shows statistics relating to each of the network adapters present in the computer. By default, the adapter name, percentage of network utilization, link speed, and state of the network adapter are shown, along with a chart of recent activity.
The App history tab shows resource usage information about Universal Windows Platform apps. Windows controls the life cycle of these apps more tightly. This tab is where the data that Windows has collected about them, and then be viewed at a later time. In Windows 11, it’s updated to show resource use information of regular apps as well.
The Startup tab manages software that starts with Windows shell.
The Users tab shows all users that currently have a session on the computer. On server computers, there may be several users connected to the computer using Terminal Services (or the Fast User Switching service, on Windows XP). Users can be disconnected or logged off from this tab.
Task Manager was originally an external side project developed at home by Microsoft developer David William Plummer;[6] encouraged by Dave Cutler and coworkers to make it part of the main product «build», he donated the project in 1995. The original task manager design featured a different Processes page with information being taken from the public Registry APIs rather than the private internal operating system metrics.
A Close Program dialog box comes up when Ctrl+Alt+Delete is pressed in Windows 9x.[1] Also, in Windows 9x, there is a program called Tasks (TASKMAN.EXE) located in the Windows directory. It is rudimentary and has fewer features. The System Monitor utility in Windows 9x contains process and network monitoring functionality similar to that of the Windows Task Manager. Also, the Tasks program is called by clicking twice on the desktop if the Explorer process is down.
In Windows XP only, there is a «Shut Down» menu that provides access to Standby, Hibernate, Turn off, Restart, Log Off, and Switch User. This is because, by default in Windows XP, pressing Ctrl+Alt+Delete opens the Task Manager instead of opening a dialog that provides access to the Task Manager in addition to the options mentioned above.
On the Performance tab, the display of the CPU values was changed from a display mimicking a LED seven-segment display, to a standard numeric value. This was done to accommodate non-Arabic numeral systems, such as Eastern Arabic numerals, which cannot be represented using a seven-segment display.[7]
Prior to Windows XP, process names longer than 15 characters in length are truncated. This problem is resolved in Windows XP.[8]
The users tab is introduced by Windows XP.
Beginning with Windows XP, the Delete key is enabled on the Processes tab.
Windows Task Manager has been updated in Windows Vista with new features,[9] including:
- A «Services» tab to view and modify currently running Windows services and start and stop any service as well as enable/disable the User Account Control (UAC) file and registry virtualization of a process.
- New «Image Path Name» and «Command Line», and «Description» columns in the Processes tab. These show the full name and path of the executable image running in a process, any command-line parameters that were provided, and the image file’s «Description» property.
- New columns showing DEP and virtualization statuses. Virtualization status refers to UAC virtualization, under which file and registry references to certain system locations will be silently redirected to user-specific areas.
- By right-clicking on any process, it is possible to directly open the Properties of the process’s executable image file or of the directory (folder) containing the process.
- The Task Manager has also been made less vulnerable to attack from remote sources or viruses as it must be operating under administrative rights to carry out certain tasks, such as logging off other connected users or sending messages. The user must go into the «Processes» tab and click «Show processes from other users» in order to verify administrative rights and unlock these privileges. Showing processes from all users requires all users including administrators to accept a UAC prompt, unless UAC is disabled. If the user is not an administrator, they must enter a password for an administrator account when prompted to proceed, unless UAC is disabled, in which case the elevation does not occur.
- By right-clicking on any running process, it is possible to create a dump. This feature can be useful if an application or a process is not responding, so that the dump file can be opened in a debugger to get more information.
- The «Shut Down» menu containing Standby, Hibernate, Turn off, Restart, Log Off and Switch User has been removed. This was done due to low usage, and to reduce the overall complexity of Task Manager.[10]
- The Performance tab shows the system uptime.
In Windows 8, Windows Task Manager has been overhauled and the following changes[2] were made:
- Starting in Windows 8, the tabs are hidden by default and Task Manager opens in summary mode (Fewer details). This view only shows applications and their associated processes. Prior to Windows 8, what is shown in the summary mode was shown in the tab named «Applications».
- Resource utilization in the Processes tab is shown with various shades of yellow, with darker color representing heavier use.
- The Performance tab is split into CPU, memory, disk, ethernet, and wireless network (if applicable) sections. There are overall graphs for each, and clicking on one reaches details for that particular resource. This includes consolidating information that previously appeared in the Networking tab from Windows XP through Windows 7.
- The CPU tab no longer displays individual graphs for every logical processor on the system by default. It now can show data for each NUMA node.
- The CPU tab now displays simple percentages on heat-mapping tiles to display utilization for systems with many (64 up to 640) logical processors.[11] The color used for these heat maps is blue, with darker color again indicating heavier utilization.
- Hovering the cursor over any logical processor’s data now shows the NUMA node of that processor and its ID.
- A new Startup tab has been added that lists running startup applications.[12] Previously, MSConfig was in charge of this task, or in Windows Vista only, the «Software Explorer» section of Windows Defender.[13] The Windows Defender that shipped built-into Windows 7 lacked this option, and it was also not present in the downloadable Microsoft Security Essentials either.
- The Processes tab now lists application names, application status, and overall usage data for CPU, memory, hard disk, and network resources for each process.
- A new App History tab is introduced.
- The application status can be changed to suspended.
- The normal process information found in the older Task Manager can be found in the new Details tab.
- The Processes tab is divided into categories.[14]
- Display GPU information in the Performance tab, if the GPU supports WDDM 2.0 or later.
- Since Windows 10 2004, Task Manager can display disk type (HDD or SSD) in the Performance tab.
- Windows 11 22H2 has introduced a redesigned Task Manager.
- During a 2022 update, Efficiency mode was introduced to Task Manager.
- The new Task Manager features a search function.
- Since Windows 11 24H2, Task Manager uses MT/s as unit for main memory speed, replaced older MHz.
- Since Windows 11 24H2 26100.2454, Task Manager can display disk interface type in the Performance tab.[15]
Task Manager is a common target of computer viruses and other forms of malware; typically malware will close or otherwise disable the Task Manager as soon as it is started, so as to hide itself from users. Some malware will also disable the Task Manager as an administrator. Variants of the Zotob and Spybot worms have used this technique, for example.[16][obsolete source] Using Group Policy, it is possible to disable the Task Manager. Many types of malware also enable this policy setting in the registry. Rootkits can prevent themselves from getting listed in the Task Manager, thereby preventing their detection and termination using it.
- Resource Monitor
- Process Explorer
- Taskkill
- Tasklist
- Windows Task Scheduler
- ^ a b «How to end task on the items that are running in the background». Nuance Communications. June 22, 2002.
- ^ a b «Windows 8 Task Manager In-Depth». Microsoft Corporation. June 6, 2013. Retrieved February 6, 2019.
- ^ Hoffman, Chris (August 19, 2020). «How to Keep the Task Manager’s CPU Stats In Your System Tray». How-To Geek. Retrieved January 25, 2022.
- ^ Bailey, Carol (November 16, 2001). «Get IT Done: Start your troubleshooting with the Windows 2000 Task Manager». TechRepublic. Retrieved January 25, 2022.
- ^ «Cannot End Service Processes with Task Manager». Support. Microsoft. February 27, 2007. Archived from the original on March 8, 2007. Retrieved December 6, 2012.
- ^ Tung, Liam (May 27, 2020). «Windows 10: The developer who wrote Windows Task Manager reveals its secrets». ZDNET. Retrieved October 14, 2024.
- ^ Raymond Chen (July 25, 2007). «What is Dave’s frame class?».
- ^ Magic 15 with GetProcessesByName on Windows 2000 [dead link]
- ^ Brien Posey (May 2008). «Microsoft’s Windows Task Manager: What’s new in Vista?». Retrieved February 4, 2019.
- ^ Raymond Chen (June 19, 2014). «What happened to the Shut Down menu in classic Task Manager?».
- ^ Sinofsky, Steven (October 27, 2011). «Using Task Manager with 64+ logical processors». Building Windows 8. Microsoft. Archived from the original on February 17, 2012. Retrieved October 29, 2011.
- ^ Serban, Alex (October 24, 2011). «How to Get the Most out of New Windows 8 Task Manager?». ITProPortal. Future Publishing.
- ^ «Manage startup programs in Vista using Windows Defender’s Software Explorer». August 9, 2007.
- ^ Corden, Jez (September 4, 2015). «How to use Task Manager to optimize your Windows 10 experience». Windows Central. Retrieved February 4, 2019.
- ^ «November 21, 2024—KB5046740 (OS Build 26100.2454) Preview — Microsoft Support». support.microsoft.com. Retrieved April 3, 2025.
- ^ «Task Manager, MSCONFIG, or REGEDIT disappears while opening». Ramesh’s website. December 19, 2005. Archived from the original on December 6, 2010. Retrieved September 17, 2007.
- How to use and troubleshoot issues with Windows Task Manager, Microsoft Help and Support
- Windows 8 Task Manager In-Depth Archived April 2, 2015, at the Wayback Machine, Gavin Gear, Blogging Windows
- Youtube, Inside Task Manager with the Original Author, Dave’s Garage Dave Plummer History of writing and debugging Task Manager.
Для работы проектов iXBT.com нужны файлы cookie и сервисы аналитики.
Продолжая посещать сайты проектов вы соглашаетесь с нашей
Политикой в отношении файлов cookie
Диспетчер задач — это инструмент Windows, который помогает следить за работой компьютера, закрывать зависшие программы, контролировать загрузку процессора, памяти, диска и сети. Разберу каждую вкладку и объясню, как ее использовать.
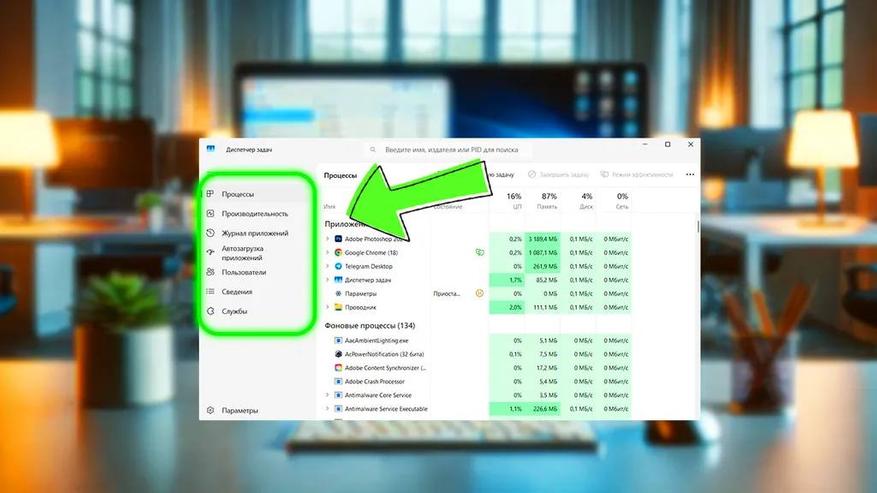
Здесь отображаются все запущенные программы и фоновые процессы. Колонки показывают, сколько ресурсов они потребляют:
- ЦП (процессор) — загруженность в процентах. Если одно приложение сильно нагружает процессор, его можно закрыть. Или
- Память — сколько оперативной памяти использует программа. Если памяти мало, стоит закрыть тяжелые приложения.
- Диск — активность работы с диском. Если диск загружен на 100%, возможно, проблема с жестким диском или программами, активно читающими/записывающими данные.
- Сеть — скорость передачи данных. Можно выявить, какая программа потребляет интернет.
Как использовать:
- Если компьютер тормозит, смотрю, что грузит процессор или диск.
- Закрываю зависшие или ненужные процессы. Для этого использую функцию «Снять задачу» — она появится, если кликнуть правой кнопкой мыши на любую задачу в списке.
- Контролирую потребление памяти.
Еще некоторые тут могут посмотреть функцию «Создать файл дампа». Обычно это не надо, но пригодится разработчикам программ. Если вы пишете код, делаете тестирование и у вас программа плохо оптимизирована, файл дампа помогает посмотреть, что именно не так. Ну и оптимизировать свой код.
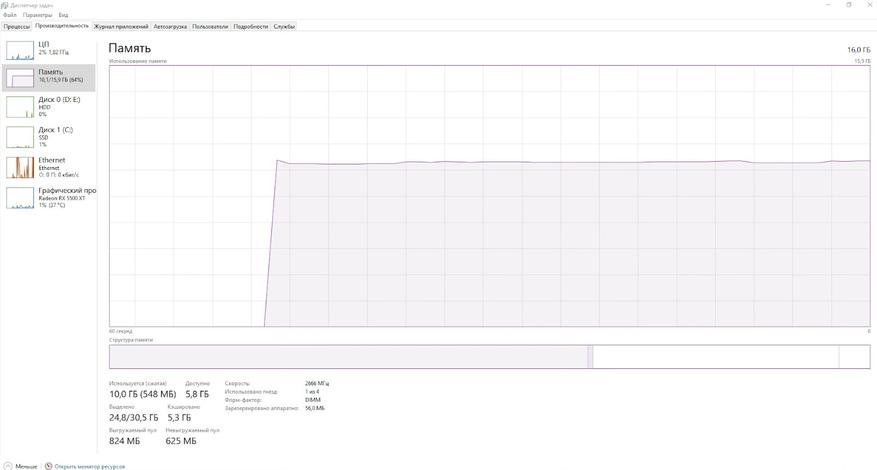
Графики загрузки системы:
- ЦП — частота, загруженность, температура (в новых версиях). Очень полезно, если у вас перегревается компьютер или ноутбук. Можно посмотреть, какие процессы греют систему. Не всегда виноваты именно программы — может, просто пришла пора менять термопасту. Но знать об этом полезно.
- Память — сколько занято, сколько доступно. Как мы все знаем, «железо» устаревает. И если память постоянно загружена, то надо ее увеличивать. Вот это тут и увидите.
- Диск — активность чтения/записи. Если диск пишет или считывает очень активно, а вы вроде бы не задавали что-то «тяжелое», вроде рендеринга видео, это могут быть вирусы.
- Сеть (Ethernet/Wi-Fi) — скорость входящего и исходящего трафика. Если сосед подключился к Wi-Fi, взломав ваш пароль, вы здесь это увидите по перерасходу ресурсов.
Итого, как использовать:
- Если процессор или память загружены под 100%, ищу причину.
- Если диск постоянно на 100%, проверяю фоновые процессы.
- Если интернет медленный, смотрю, нет ли перегрузки сети.
Здесь же есть кнопка «Открыть мониторинг ресурсов», который дает еще больше деталей.
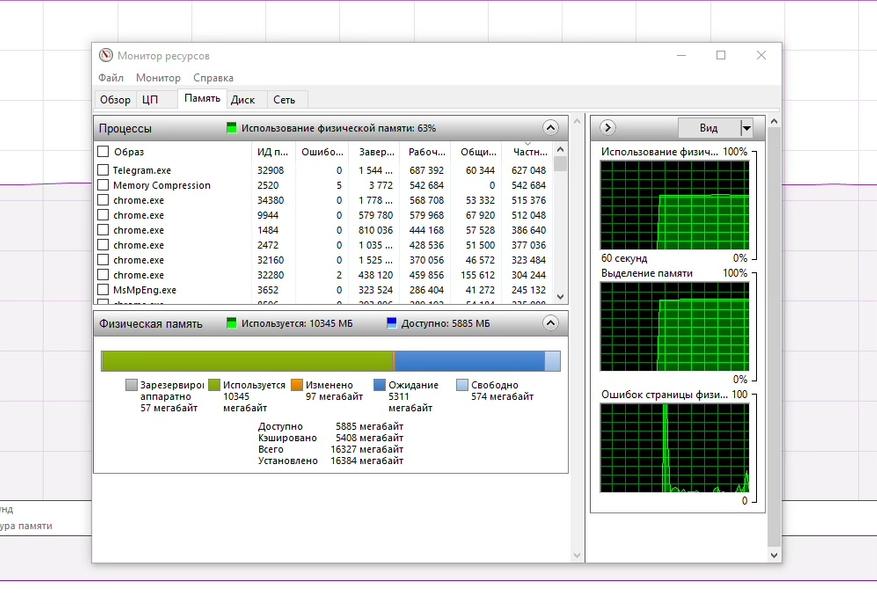
Мониторинг ресурсов
Расширенная версия вкладки «Производительность». Он нужен, чтобы более подробно посмотреть, что происходит на компьютере и почему. Разделы:
- Обзор — суммарная информация о загрузке ЦП, памяти, диска и сети.
- ЦП — какие процессы нагружают процессор. Если загрузка 100%, смотрю, что в списке.
- Память — какие процессы занимают память. Удобно для выявления утечек памяти.
- Диск — какие процессы активно работают с диском.
- Сеть — какие программы используют интернет и на какие IP-адреса идут соединения.
Соответственно, каждая вкладка — это информация о происходящем. Можно выбрать определенные столбцы и посмотреть только на них: для этого нажимаем по заголовку правой кнопкой, далее — «Выбрать столбцы». А еще можно отметить флажком определенные процессы, по ним тогда приложение будет делать фильтрацию. Удобно, когда вам надо отследить деятельность конкретных приложений. Например, если ищете вирус.
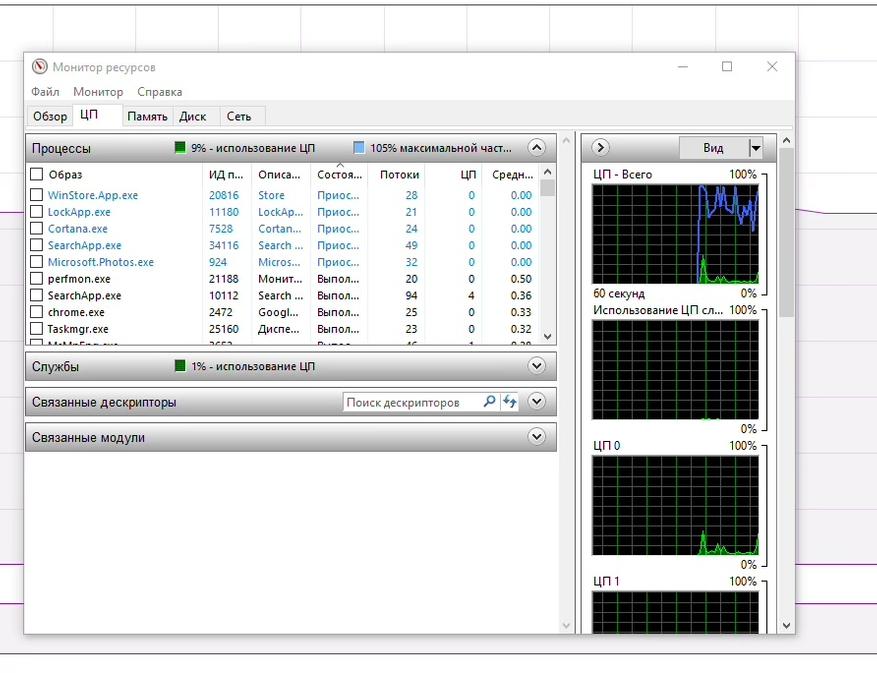
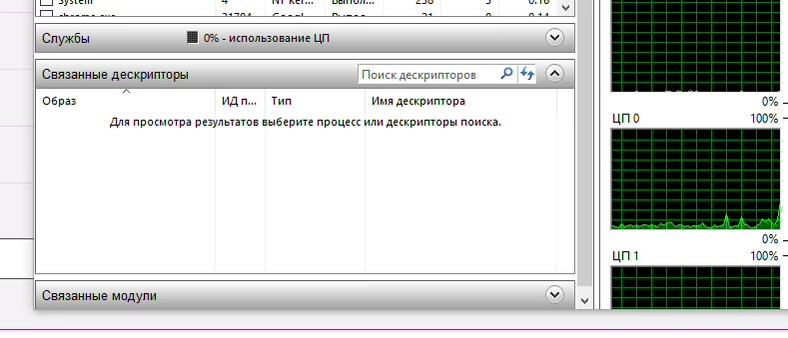
Иногда система может запрещать «убить» процесс. Она тогда говорит, что файл используется другим приложением, удалить его нельзя. И тогда надо будет найти блокировщик. Для этого заходим на вкладку ЦП, вводим название файла или его часть в подвкладке «Связанные дескрипторы». И узнаем, в чем проблема.
Во вкладке «Диск» очередной полезный график: «Длина очереди диска». Если очередь больше, чем в два раза превышает количество физических дисков, то это сигнал о низкой производительности. Возможно, даже о том, что диск «умирает» и того гляди «посыплется».
Наконец, есть еще вкладка «Сеть». Здесь ловим майнеры, вирусы и другие вредоносные приложения, которые используют интернет. Можно посмотреть, какие порты открыты, какое состояние у брандмауэра. Если есть проблемы с подключением, обязательно смотрим «Процент потерянных пакетов» и «Задержка». Пакеты теряются из-за разных причин — от проблем на стороне провайдера до майнеров или троянов.
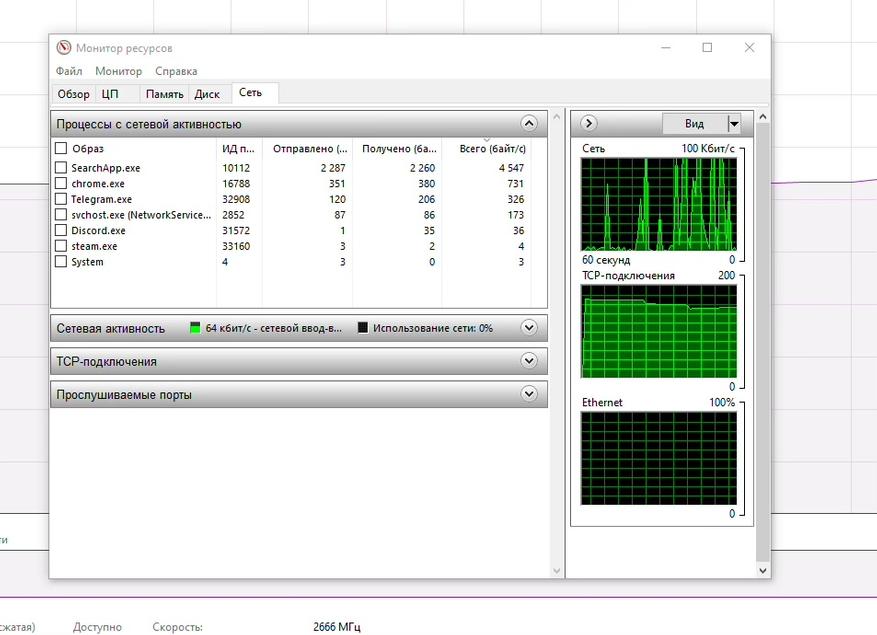
Но здесь же раздел TCP-подключения укажет на возможных «виновников»: он выводит список приложений, которые активно используют интернет. И если там что-то помимо понятного Chrome и Telegram, то уже стоит задуматься.
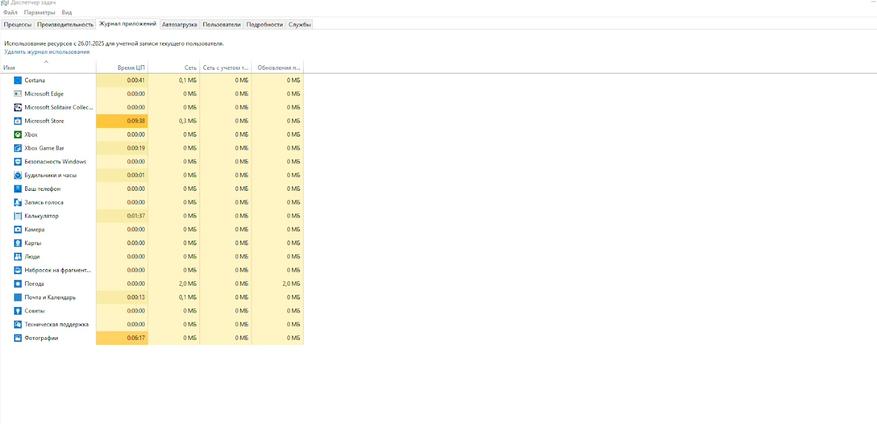
Возвращаемся в основное меню Диспетчера. Идем в «Журнал приложений». Он показывает, сколько ресурсов использовали программы из Microsoft Store.
- CPU Time — сколько процессорного времени потратило приложение.
- Network — сколько данных передало приложение по сети.
Не самая полезная вкладка, если у вас большинство приложений не из Microsoft Store. Но все равно стоит знать, для чего она нужна.
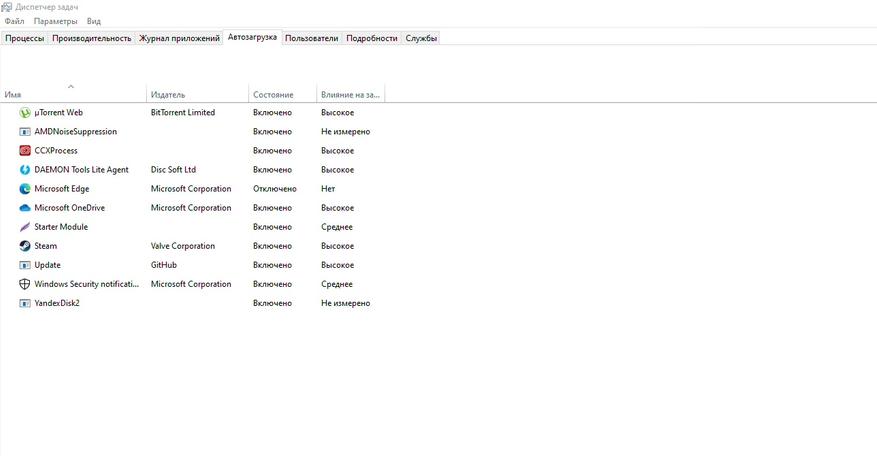
Список программ, запускающихся при включении компьютера. Иногда туда любят «прописываться» приложения при установке. Здесь можно их все увидеть.
- Состояние — включена или отключена автозагрузка.
- Влияние на запуск — низкое, среднее или высокое.
Если программ в автозагрузке много, а компьютер не очень мощный, он будет тормозить. После того, как посмотрели в Диспетчере, можно будет пойти в папку «Автозагрузки» уже через Панель управления и удалить лишнее.
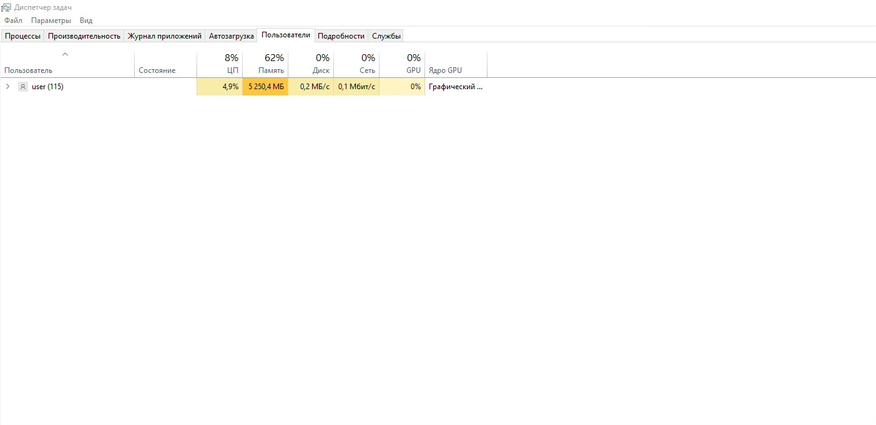
Показывает, кто сейчас работает на компьютере и сколько ресурсов потребляет каждая сессия. Помогает поймать «нарушителей» — не очень актуально на домашнем компьютере, который вы используете единолично, но важно, если пользователей много или устройство сетевое.
Как использовать:
- Если работают несколько пользователей, вижу, кто грузит систему. И чем, какой программой.
- Если кто-то забыл выйти, могу завершить его сеанс.
Полезная фишка, если вы админ в компании и следите за не слишком аккуратными сотрудниками.
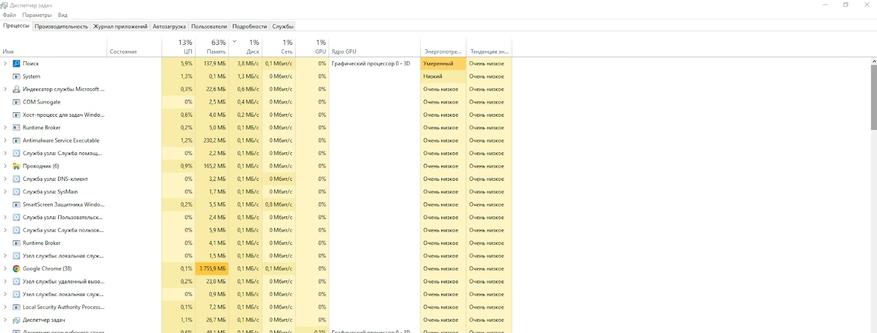
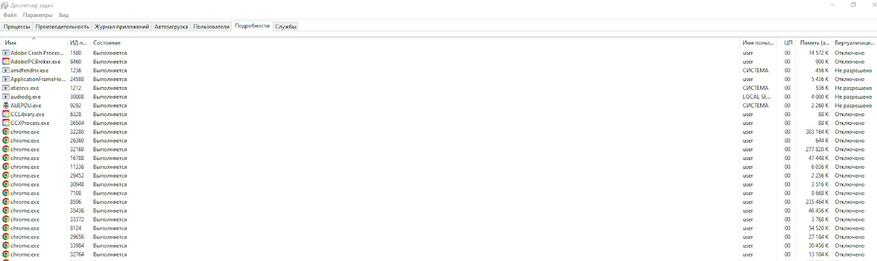
Список всех процессов с техническими параметрами. Полезно для продвинутых пользователей. Здесь показано, сколько конкретно памяти «ест» приложение.
Как использовать:
- Проверяю, не запущены ли подозрительные процессы.
- Если программа зависла и не закрывается, завершаю процесс вручную.
- Могу выдать повышенный приоритет — это важно, если у нас тяжелое приложение, которому надо дать завершить свою работу. Например, рендеринг видео.
Здесь еще будет возможность «завершить дерево процессов», то есть «убить» сразу несколько взаимосвязанных.
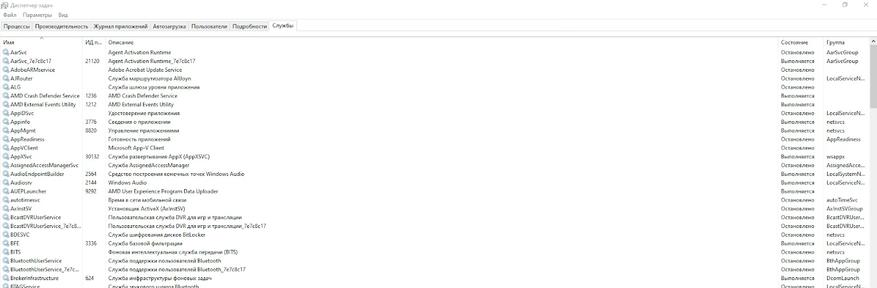
Фоновые процессы Windows. Тут можно включать и отключать службы. Использую так:
- Если какая-то функция Windows не работает, проверяю, включена ли нужная служба.
- Если служба зависла, перезапускаю ее. Например, я подключил микрофон по Bluetooth, а он не работает. Здесь можно отыскать bthserv — службу поддержки Bluetooth и запустить ее вручную.
Раздел удобен тем, что поясняет, зачем нужны разные мелкие программы-драйверы.
Диспетчер задач — неплохой инструмент для стартовой диагностики. Он не заменит специальных программ, таких как FurMark под разгон и тест видеокарты. Или профессиональный антивирус. Но для простых случаев Диспетчера вполне хватит. Я лично его использую, если компьютер тормозит, программы зависают или что-то ведет себя странно.
Если хотите удаленно следить за домом, советую посмотреть статью — Как обезопасить дом? Рейтинг IP-камер видеонаблюдения Xiaomi.
How To Open Task Manager In Windows 11 & 10 – Full Guide
Task Manager is an essential tool in Windows operating systems, allowing users to monitor system performance, manage running applications, and troubleshoot issues. In this comprehensive guide, we will walk you through various methods to open Task Manager in both Windows 10 and Windows 11, and we will provide insights into its features and functionalities.
Understanding Task Manager
Task Manager serves multiple purposes, including:
-
Monitoring system performance: View real-time data on CPU usage, memory consumption, disk activity, and network performance.
-
Managing applications and processes: End non-responsive applications, close unnecessary processes, and launch new tasks.
-
Startup management: Control which programs load during system startup.
-
User management: View active users and log off or disconnect users as needed.
-
Accessing system tools: Launch system utilities like Resource Monitor and Performance Monitor.
With such functionalities, Task Manager is a critical tool for both casual users and IT professionals alike.
How to Open Task Manager in Windows 10
Windows 10 offers various methods to access Task Manager. Below are the most commonly used ones:
Method 1: Using Keyboard Shortcuts
Ctrl + Shift + Esc: This combination will directly open Task Manager. It’s often considered the quickest way to access the tool.
Ctrl + Alt + Delete: Pressing this combination brings up a security screen where you can select «Task Manager» from the list of options.
Windows + X: This combination will open the Quick Access menu. From there, click on «Task Manager» to open it.
Method 2: Using the Start Menu
- Click on the Start button or press the Windows key on your keyboard.
- Scroll down to find the Windows System folder.
- Click on it to expand, and then select Task Manager.
Method 3: Using the Run Dialog Box
- Press Windows + R to open the Run dialog.
- Type taskmgr and press Enter. This command launches Task Manager immediately.
Method 4: Using the Command Prompt
- Open the Command Prompt by right-clicking the Start button and selecting Windows Terminal (Admin) or Command Prompt (Admin).
- Type taskmgr and press Enter.
Method 5: Using PowerShell
- Right-click the Start button.
- Select Windows Terminal or PowerShell from the menu.
- Type taskmgr and hit Enter.
Method 6: Creating a Desktop Shortcut
- Right-click on your desktop.
- Select New > Shortcut.
- In the location box, type C:WindowsSystem32taskmgr.exe and click Next.
- Name your shortcut (e.g., Task Manager) and click Finish.
How to Open Task Manager in Windows 11
Windows 11 retains several methods to open Task Manager, with some adjustments in the user interface and functionalities. Here are the ways to access Task Manager in Windows 11:
Method 1: Using Keyboard Shortcuts
The same keyboard shortcuts apply here, making it easy for Windows 10 users to adapt.
Ctrl + Shift + Esc: Directly opens Task Manager.
Ctrl + Alt + Delete: Brings up a security screen where you can access Task Manager.
Windows + X: This opens the quick menu from where you can select Task Manager.
Method 2: Using the Start Menu
- Click on the Start button.
- Use the search bar to type «Task Manager.»
- Click on the Task Manager app from the search results.
Method 3: Using the Run Dialog Box
- Press Windows + R to open the Run dialog.
- Type taskmgr and press Enter.
Method 4: Using the Command Prompt or PowerShell
Just like in Windows 10, you can use Command Prompt or PowerShell to run Task Manager.
- Open Windows Terminal or PowerShell.
- Type taskmgr and press Enter.
Method 5: Using the Settings App
- Press Windows + I to open the Settings app.
- Go to System > About.
- Scroll down and click on Task Manager under related links.
Method 6: Adding Task Manager to the Taskbar
- Right-click on an empty space on the Taskbar.
- Select Taskbar settings.
- Scroll down to Taskbar corner overflow and select Task Manager.
- Turn it on to make it easily accessible.
Task Manager Interface Overview
Once you have opened Task Manager, you will be greeted by a fairly simple and organized interface. In both Windows 10 and Windows 11, the Task Manager presents a set of tabs that categorize different functions:
1. Processes Tab
This tab displays all running applications and background processes. Here, you can view how much CPU, memory, disk, and network resources each process is consuming. To end a task, simply right-click on the process and select End task.
2. Performance Tab
The Performance tab provides in-depth graphs and metrics for CPU, memory, disk, and GPU usage. This visual representation helps you to identify bottlenecks in system performance and monitor resource allocation over time.
3. App History Tab
This tab is particularly useful for users who want to monitor resource usage over time. It lists app usage data, allowing you to evaluate the resource consumption of applications in relation to their execution history.
4. Startup Tab
In this tab, you can view all applications set to run when Windows starts. You can enable or disable them to potentially improve boot times and system performance. Disabling unnecessary startup programs can speed up your computer’s startup.
5. Users Tab
You can monitor other users logged into the system simultaneously, checking their resource usage. This feature is especially useful in multi-user environments.
6. Details Tab
For advanced users, the Details tab provides a more granular view of running processes. You can see the executable name, PID (Process ID), and the status of each process.
7. Services Tab
This tab allows you to see all Windows services and their status. You can start or stop services here, though caution is advised, as ending critical system services could lead to instability.
Advanced Features
Task Manager is more than just a tool for closing unresponsive applications. The following advanced features can enhance your user experience:
Resource Monitor
From the Performance tab, you can launch the Resource Monitor, which offers a more detailed analysis of CPU, memory, disk, and network usage.
Performance Monitoring
Task Manager allows users to keep an eye on system performance over time, helping to identify trends and persistent issues.
Creating a New Task
Through Task Manager, users can create new processes or applications. Click on File > Run new task, which lets you type the name of the application you wish to start.
Troubleshooting with Task Manager
Task Manager can be a valuable tool for troubleshooting performance issues on Windows systems. Here’s how to use it effectively:
-
Identify Resource Hogs: Use the Processes tab to identify applications consuming excessive resources. If an application is taking too much CPU or memory, consider closing it or checking for updates that may resolve performance issues.
-
End Non-Responsive Applications: If an application becomes unresponsive, right-click it in the Processes tab and select End task to close it.
-
Evaluate Startup Impact: In the Startup tab, check the Startup impact column. Programs with a high impact may slow down your system at boot, so consider disabling them.
-
Monitor Performance Trends: Regularly check the Performance tab to monitor trends in resource usage. This can help detect when and where performance issues may arise.
-
Check for Malware: If you notice unexpected processes using high CPU or memory, it may indicate malware presence. Consider running a security scan if unfamiliar processes are present.
Tips for Effective Task Management
To make the most out of Task Manager, consider the following tips:
-
Familiarize Yourself with Processes: Learn the names of legitimate processes to differentiate them from potentially harmful ones. A quick internet search can clarify unknown processes.
-
Use Search for Quick Access: In Windows 11, the search function in the Start menu allows you to quickly find Task Manager. This saves time compared to navigating through menus.
-
Regularly Check Startup Items: Periodically review the Startup tab to ensure only necessary applications load at startup, minimizing boot time.
-
Utilize Context Menus: Right-clicking on processes and applications provides quick actions such as ending tasks or searching the web for more information.
-
Stay Organized: If you regularly use Task Manager for specific applications, consider creating shortcuts on your desktop or taskbar for easier access.
Conclusion
Task Manager is a robust tool offering far more than just the ability to end unresponsive programs. Understanding how to efficiently access it and utilizing its comprehensive features is invaluable for users of Windows 10 and 11, whether you use your device for simple tasks or complex operations. With the methods outlined above, you can easily access Task Manager and use its capabilities to monitor and manage your system effectively. By investing time in learning how to navigate this tool, you empower yourself to maintain optimal system performance and troubleshoot issues as they arise.
The Task Manager is a powerful Windows 11 utility that provides detailed real-time information about the software and hardware on your PC. It’s also indispensable when troubleshooting applications, monitoring hardware resource usage, and managing startup programs.
In this in-depth guide and overview, you’ll learn everything you need to know about the Task Manager in Windows 11, including ways to use it effectively.

Opening the Windows 11 Task Manager
In Windows 11, you can launch the Task Manager just like any other program by selecting Start > All Apps > Windows Tools > Task Manager. However, the most convenient way to invoke it is through the Power User menu (right-click the Start button and select Task Manager).

If you prefer keyboard shortcuts, pressing Ctrl + Shift + Esc will quickly bring up the Task Manager. If the operating system appears stuck, you can still get to it by pressing Ctrl + Alt + Delete (which opens Windows 11’s Security Screen) and then selecting Task Manager.
The Default Task Manager
The Windows 11 Task Manager appears as a stripped-down version of the full user interface by default. It’s tiny, features no menu options, and simply shows a list of active apps on your computer.

You can choose any app within the list and forcibly shut it down by selecting the End task button. That’s the quickest way to quit unresponsive programs.
Right-clicking any app within the list also reveals multiple contextual options as follows:

- Switch to: Immediately brings the app into focus.
- End task: Forcibly shuts down the app. It’s the same as selecting the End task button.
- Provide feedback: Provide feedback to Microsoft.
- Create dump file: Generate a dump (.DMP) file of the program, which is often requested by support engineers for troubleshooting purposes. You can also analyze dump files yourself.
- Run new task: Launch a new program, folder, or document with or without elevated privileges in Windows.
- Always on top: Place the Task Manager on top of other apps. This option also works in expanded view, which then helps you track resource usage in real-time.
- Go to details: Automatically select the executable file related to the program within the Details tab in the expanded view.
- Open file location: Opens the directory of the program’s main executable file in a File Explorer window.
- Search online: Perform an online search using Bing. If you don’t recognize a program, use this option to learn more about it.
- Properties: Brings up the program executable’s Properties dialog box. You can then check or modify its general, compatibility, and security settings and view additional details such as the version, publisher, etc.
The Expanded Task Manager
Select the More details button at the bottom left corner to expand the Task Manager’s user interface. You can always select Fewer details to go back to the stripped-down version whenever you want.

The expanded Task Manager consists of multiple tabs—Processes (default), Performance, App History, Startup, Users, Details, and Services. You can change the default tab that appears when you open Task Manager by selecting Options > Set default tab on the menu bar.
Task Manager – Tab Overview
You’ll go through each tab in more detail below, but here’s a brief overview:

- Processes: Offers a rundown of all active, background, and Windows processes on your computer, including performance stats per process.
- Performance: Provides real-time monitoring of the CPU (central processing unit), memory, storage drive, network adapter, and video card.
- App History: Displays the resource usage history of Microsoft Store apps (default view) and traditional programs (optional).
- Startup: Lists programs that launch at startup and the related performance impact on your PC.
- Users: Displays the processes and resource usage on your computer for each user.
- Details: Provides a comprehensive list of processes and the relevant executable files in traditional format.
- Services: Features native and third-party services, along with options to start, stop, and restart them.
Task Manager – Menu Options
In the expanded view, you’ll find a list of menu options to the top of the Task Manager—File, Options, and View.

- File > Run new task: Open a program, folder, or document with or without administrative privileges.
- File > Exit: Exit the Task Manager.
- Options > Always on top: Keep the Task Manager on top of other windows.
- Options > Minimize on use: Hide the Task Manager while using the Switch to right-click option on an app or process.
- Options > Hide when minimized: Hide the Task Manager in the system tray while minimizing it.
- Options > Set default tab: Change the default tab that you see each time you open the Task Manager.
- Options > Show full account name: Display each user’s entire account name (profile and email ID) under the Users tab.
- Options > Show history for all processes: Reveal the history for both Microsoft Store apps and non-Store apps under the App History tab.
- View > Refresh now: Immediately refresh all tabs within the Task Manager.
- View > Update speed: Determine the Task Manager’s refresh speed—High, Normal (default), or Low. Selecting Paused lets you stop all updates.
- View > Group by type: Group or ungroup processes under the Processes tab.
- View > Expand all: Expand all processes to reveal sub-processes under the Processes tab.
- View > Collapse all: Collapse all expanded processes under the Processes tab.
The Processes Tab
The Processes tab in the Windows 11 Task Manager features a list of live processes on your PC, along with real-time usage stats under separate columns.
Processes Tab – Name Column
The Apps section at the top of the Name column sports a list of all open programs in Windows 11. The Background processes section features apps that run in the background (e.g., the system tray). A third section—labeled Windows processes—lists processes related to the operating system.

If you want, you can merge the sections list by unchecking View > Group by type on the Task Manager menu. However, that makes it harder to locate specific apps and processes.
By default, the Task Manager groups and hides the sub-processes related to each program. To reveal them, simply double-click a program’s name or select the tiny arrow icon next to it.

Optionally, use the View > Expand all and Collapse all menu options to expand and collapse all sub-processes under the Processes tab.
Right-clicking a process reveals multiple options, similar to what you get in the Task Manager’s simplified view. An exception is the integral Windows Explorer process, which features a Restart option instead of End task. That allows you to troubleshoot File Explorer-related issues by restarting it.

Processes Tab – Other Columns
The Processes tab contains additional columns that provide real-time system resource usage stats and insights for each process and subprocess, along with colors that shift between yellow and red to indicate minor to heavy resource usage.
The CPU, Memory, and Disk columns are arguably the most important since they let you spot programs that consume lots of resources. Selecting a column enables you to sort processes from the most resource-intensive to the least and vice-versa. This can be useful, for example, in figuring out things like which apps are causing the most CPU or Disk activity.

- Status: Displays a leaf-shaped icon to denote if Windows 11 has suspended the process to conserve power.
- CPU: Current CPU resource consumption of each process in percentage terms. An aggregate value is listed at the top of the column.
- Memory: Current memory usage in megabytes for each process, along with the total amount as a percentage at the top.
- Disk: Disk usage for each process.
- Network: Live network activity of each process in megabits per second.
Processes Tab – Additional Columns
Right-clicking any column also gives you the option to activate additional columns:

- Type: Displays the process category—App, Background process, or Windows process.
- Publisher: Reveals the publisher of the related program or service—e.g., Microsoft.
- PID: Unique decimal number assigned to each process, helpful in distinguishing between multiple instances of the same program.
- Process Name: This shows the filename and extension of the process.
- Command Line: Displays the full command line, options, and variables related to the process.
- GPU: GPU activity in percentage terms for each process.
- GPU Engine: Displays the GPU engine in active use by the process—3D, Video Decode, Video Processing, etc.
- Power Usage: Power consumption of a process on a scale of Very Low, Low, Moderate, High, and Very High at any given moment.
- Power Usage Trend: Power usage of a process as an average. This is a better indicator since it accounts for time.
- Resource values: This lets you change the Memory, Disk, and Network columns to display values instead of percentages.
The Performance Tab
The Performance tab in the Task Manager lets you monitor total real-time utilization of the CPU, memory, disk, network, and GPU in Windows 11. Select each hardware component on the sidebar to view the relevant information.
Performance Tab – CPU
Displays CPU utilization by all processes over 60 seconds on a scale of 0-100. On multi-core CPUs, right-click the graph and select Change graph to > Logical processors to display separate charts for each logical processor. Hovering your cursor over a processor will reveal if the operating system has “parked” it to conserve power.

Underneath the graph, you’ll find the following information:
- Utilization: CPU utilization as a percentage.
- Speed: Current speed of the CPU.
- Processes: Total number of processes handled by the CPU.
- Threads: Thread count for all processes handled by the CPU.
- Handles: Total number of associations with shared resources (files, programs, memory locations, etc.).
- Up time: Time since you last turned on your PC.
The rest consists of general information related to the CPU, such as the processor model, base speed, and virtualization status.
Performance Tab – Memory
Displays total RAM usage in graphical format over 60 seconds on a scale of 0-100. In addition, a separate graph labeled Memory composition reveals a snapshot of the memory consisting of the following in different shades of color:
- In use: Memory in active use by processes, drivers, and the operating system.
- Modified: Memory that must be written to the disk before it can be repurposed.
- Standy: Memory consisting of cached data not in active use.
- Free: Memory that’s immediately available for use.

Underneath both graphs, you’ll see the following information as numeric values:
- In use: The amount of memory actively used by processes, drivers, and the operating system.
- Available: Memory available for use by the operating system (the sum of the Standby and Free categories in the memory composition graph).
- Committed: Displays a couple of values related to the page file in Windows.
- Cached: The sum of the Modified and Standby categories in the memory composition graph.
- Paged pool: Kernel and device driver memory that can be moved from RAM to the page file.
- Non-paged pool: Kernel and device driver memory that must stay in RAM.
The rest is general information about the physical memory modules—speed, the number of RAM slots used, and the form factor.
Performance Tab – Disk
Depending on the number of partitions and removable drives on your PC, you may see multiple disks listed under the sidebar. Each consists of two graphs that display disk utilization over 60 seconds on a scale of 0-100.
The Active time graph reveals the read and write requests, while the Disk transfer rate graph displays transfer rates between the drive and the operating system.

In addition to general drive-related information such as capacity, model, and type (HDD or SSD), you’ll see the following information:
- Active time: Percentage of time the disk spends reading or writing data. Higher percentages may indicate bottlenecks (often the case with mechanical hard drives).
- Average response time: Average amount of time to complete read and write requests.
- Read speed: The disk drive’s current read speed in kilobytes per second.
- Write speed: Current write speed of the disk drive in kilobytes per second.
Performance Tab – Wi-Fi/Ethernet
Reveals network information such as the adapter name, SSID, connection type, send and receive speeds (in Kbps), IPv4 and IPv6 addresses, and signal strength.

The graph displays total network utilization by apps and the operating system. Right-clicking the chart and selecting View network details will reveal extra information regarding network activity.
Performance Tab – GPU
Displays the GPU model, utilization, and other information regarding your PC’s video card, such as the amount of dedicated or shared memory and driver version. However, this section may not show up on computers with integrated graphics.

You can switch the default graph to display activity by GPU engine (3D, Video Decoding, Video Processing, etc.) by right-clicking and selecting Change graph to > Multiple engines.
Note: Windows 11 also includes an advanced hardware monitoring utility dubbed the Resource Monitor. Select Open Resource Monitor at the bottom of the Performance tab to get to it.
The App History Tab
The Task Manager’s App History tab displays the total CPU and network usage stats for Microsoft Store apps. If you want, you can include non-Store apps within the list by selecting Options > Show history for all processes on the menu bar.

You can reset the count for all columns by selecting Delete usage history at the top of the screen.
App History Tab – Default Columns
The App History tab displays the following columns:
- Name: The name of the program.
- CPU time: The total time the program has utilized the CPU since the last reset.
- Network: The total bandwidth (in megabytes) consumed by the program.
- Metered network: The total amount of data the program has consumed on metered networks.
- Tile updates: Data consumption related to live tile updates in the Start menu. This option is irrelevant since live tiles aren’t present in Windows 11. However, you may still see activity in the column with older apps that attempt to trigger updates in the background.
App History Tab – Additional Columns
Optionally, you can right-click any of the existing columns to activate the following columns:

- Non-metered Network: Total data usage on non-metered networks.
- Downloads: Overall data usage related to downloads performed by apps.
- Uploads: Overall data usage related to uploads performed by apps.
App History Tab – Contextual Options
Right-clicking an app reveals the following options:

- Search online: If an app appears unfamiliar, select this option to perform a cursory check online.
- Properties: Open the Properties pane of the app’s main executable file.
The Startup Tab
The Startup tab in the Task Manager lists every app that loads at computer startup. Since multiple start programs can adversely impact the operating system’s performance, you can use this tab to manage them.

Startup Tab – Default Columns
The startup tab lists the following columns:
- Name: The name of the startup program.
- Publisher: The program’s publisher.
- Status: The program’s status (Enabled or Disabled).
- Startup Impact: The startup impact of the program (Low, Normal, High, or Very High).
Startup Tab – Contextual Options
Right-clicking an app reveals the following options:

- Enable/Disable: Enable or disable the startup program.
- Open file location: Opens the program’s executable file in a File Explorer window.
- Search online: Perform a search of the program online.
- Properties: Open the Properties pane of the program’s executable file.
Startup Tab – Additional Columns
You can also right-click an existing column to activate any of the following columns:

- Startup type: The startup source of the program (the system registry or the Startup folder in Windows).
- Disk I/O at startup: The amount of disk activity in megabytes related to the process at startup.
- CPU at startup: The impact on CPU usage at startup.
- Running now: Reveals if the program is running at the moment or not.
- Disabled time: The time since you last disabled the program.
- Command line: Displays the program’s command line path, including any options and variables related to it.
The Users Tab
The Users tab in the Task Manager displays a list of all users on your computer. It’s similar to the Processes tab, except that you can view resource usage by user.

Users Tab – Default Columns
You can find the following columns within the tab:
- User: Lists the names of signed-in users. Double-click a name to reveal all processes related to the user.
- Status: Displays the status of each process for a user, including if the processes are suspended or not.
The CPU, Memory, Disk, Network, GPU, and GPU engine are essentially the same compared to what you see on the Processes tab.
Users Tab – Additional Columns
Right-clicking an existing column allows you to activate additional columns:

- ID: The user’s ID.
- Session: The session duration of the user.
- Client Name: The user’s hostname (if the user connects to your PC via a remote connection).
Users Tab – Contextual Options
Right-clicking a user reveals the following contextual actions:

- Expand: Reveal processes related to the user account.
- Connect: Switch to the user account by inserting its password.
- Sign off: Forcibly signs off the user and may result in data loss.
- Send message: Send a message to the user. Enter a title and message and select OK.
- Switch user account: Switch to the user account.
- Manage user account: Opens the User Accounts screen in the Control Panel.
The Details Tab
The Details tab offers an expanded view of all processes on your computer, including those from other user accounts. It’s similar to the Processes tab from the Task Manager in Windows 7 and earlier.

Details Tab – Default Columns
The Details tab is broken down into the following columns:
- Name: Name of the process.
- PID: Unique number assigned to each process.
- Status: Status of the process—Running or Suspended.
- User name: What initiated the process—you, another user, the operating system, etc.
- CPU: CPU activity related to the process.
- Memory: The amount of memory used in kilobytes.
- Architecture: Architecture of the process – 32 or 64-bit.
You can also activate a host of additional columns by right-clicking an existing column and selecting Enable additional columns. However, these are highly technical and best suited for power users, so we won’t go over them here.
Details Tab – Contextual Options
Right-clicking a process reveals the following options:

- End task: Forcibly shut down the process.
- End process tree: End the entire process tree related to the process. This is similar to ending a group of processes in the Processes tab.
- Set priority: Determine the priority given by the CPU to the process compared to others. Options include Realtime, High, Above Normal, Normal, Below Normal, and Low.
- Set affinity: Specify the CPU core or cores used by the process.
- Analyze wait chain: Identify and end other processes that the process is using or waiting to use.
- UAC virtualization: Change the UAC virtualization status. If enabled, it allows processes to write into a virtualized location instead of areas where they don’t have permissions. That could improve compatibility with legacy apps.
- Create dump file: Create a memory dump for troubleshooting purposes.
- Open file location: Open the executable file’s location.
- Search online: Search online for more details about the process or task.
- Properties: Access the executable file’s Properties pane.
- Go to services: Highlight related services within the Services tab.
The Services Tab
The Services tab details every native and third-party service on your PC, such as those related to Windows Update, Bluetooth, the Print Spooler, etc. It lets you start, stop, and restart services.

Services Tab – Default Columns
The services pane consists of the following columns:
- Name: Name of the service.
- PID: Process ID of the service (helpful in identifying the service-related process).
- Description: Brief description of each service.
- Status: Status of the process (Running or Stopped). Some processes may show up as Starting if they appear to be stuck.
- Group: Reveals any related group that a service is a part of.
Services Tab – Contextual Options
Right-clicking a service will reveal the following contextual options:

- Start: Start the service.
- Step: Stop the service.
- Restart: Restart the service.
- Open Services: Opens the Services applet (a utility that provides configuration options for each service).
- Search online: Search online for details about the service.
- Go to details: Switches to the Details tab and highlights the relevant executable (useful for troubleshooting).
Put the Task Manager to Good Use
The Task Manager in Windows 11 is instrumental in identifying how your PC’s various programs and hardware work. Despite being filled with lots of information and options, however, getting a brief understanding of what it takes to shut down troublesome apps and manage resource-heavy processes alone can positively impact day-to-day usage.
Related Posts
- How to Fix a “This file does not have an app associated with it” Error on Windows
- How to Add OneDrive to Windows File Explorer
- How to Fix an Update Error 0x800705b4 on Windows
- How to Resolve “A JavaScript error occured in the main process” Error on Windows
- How to Fix the Network Discovery Is Turned Off Error on Windows