Одной из основных метрик, позволяющих оценить производительность существующей или проектируемой системы хранения данных является IOPS (Input/Output Operations Per Second — количество операций ввода/вывода). Говоря простым языком, IOPS – этой количество блоков, которое успевает считаться или записаться на носитель или файловую систему в единицу времени. Чем это число больше – тем больше производительность данной дисковой подсистемы (откровенно говоря, само по себе значение IOPS стоит рассматривать в комплексе с другими характеристиками СХД, таким как средняя задержка, пропускная способность и т.п.).
В этой статье мы рассмотрим несколько способов измерения производительности используемой системы хранения данных в IOPS под Windows (локальный жесткий, SSD диск, сетевая папка SMB, CSV том или LUN на СХД в сети SAN).
Содержание:
- Счетчики производительности дисковой подсистемы Windows
- Тестирование IOPS в Windows с помощью DiskSpd
- Как получить IOPS и производительность дисковой подсистемы с помощью PowerShell?
Счетчики производительности дисковой подсистемы Windows
Вы можете оценить текущий уровень нагрузки на дисковую подсистему с помощью встроенных счетчиков производительности Windows из Performance Monitor. Чтобы собрать данные по этим счетчикам:
- Запустите
Perfmon
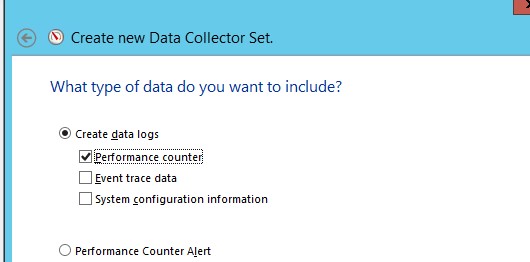
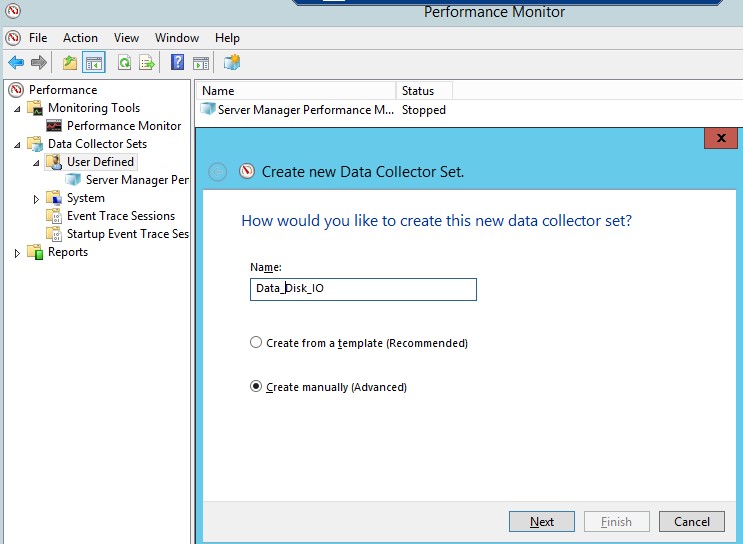
; - Создайте новый набор сборщиков данных (Data Collector Set). Выберите Create manually;

- Выберите опцию Create data logs -> Performance counter;
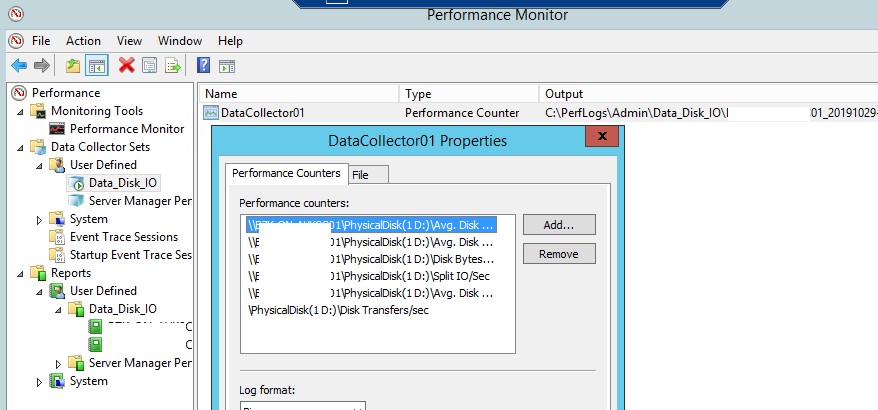
- Avg. Disk Sec./Transfer
- Avg. Disk Queue Length
- Avg Disk Bytes/Transfer
- Disk Bytes/sec
- Disk Transfers/sec
- Split IO/sec
Чтобы отображать данные о производительности дисков в реальном времени нужно добавить указанные счётчик в Perfmon в разделе Monitoring Tools -> Performance Monitor.
Ctrl+Gпереключитесь в режим Report.
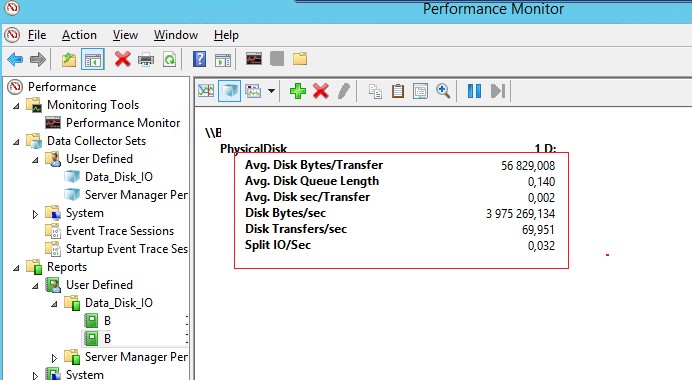
Как интерпретировать результаты производительности дисков в Perfmon? Для быстрого анализа производительности дисковой подсистемы необходимо посмотреть на значения как минимум следующих 5 счетчиков.
При анализе данные счётчиков желательно иметь представление о конфигурации физических дисков (используется ли RAID/Stripe/количество и типы дисков, наличие кэша и т.д.).
- Disk sec/Transfer – время, необходимое для выполнения одной операции записи/чтения на устройство хранения/диск — disk latency. Если задержка более 25 мс (0.25) или выше, значит дисковый массив не успевает выполнять операции. Для высоконагруженных систем значение не должно превышать 10 мс (0.1);
- Disk Transfers/sec – количество операций чтения/записи в секунду (IOPS). Это основной показатель интенсивности обращений к дискам (примерные значения в IOPS для разных типов дисков представлены в конце статьи);
- Disk Bytes/Sec – средняя скорость обмена с диском (чтения/записи) за 1 секунду. Максимальные значения зависит от типа диска (150-250 Мб/секунду — для обычного диска и 500-10000 для SSD);
- Split IO/sec – показатель фрагментации диска, когда операционной системе приходится разделять одну операцию ввода/вывода на несколько операций. Может также говорить о том, приложение запрашивает слишком большие блоки данных, которые немогут быть переданы за одну операцию;
- Avg. Disk Queue Length– длина очереди к диску (количество транзакций ожидающий обработку). Для одиночного диска длина очереди не должна превышать 2. Для RAID массива из 4 дисков длина очереди до 8 будет считаться допустимым значением.
Тестирование IOPS в Windows с помощью DiskSpd
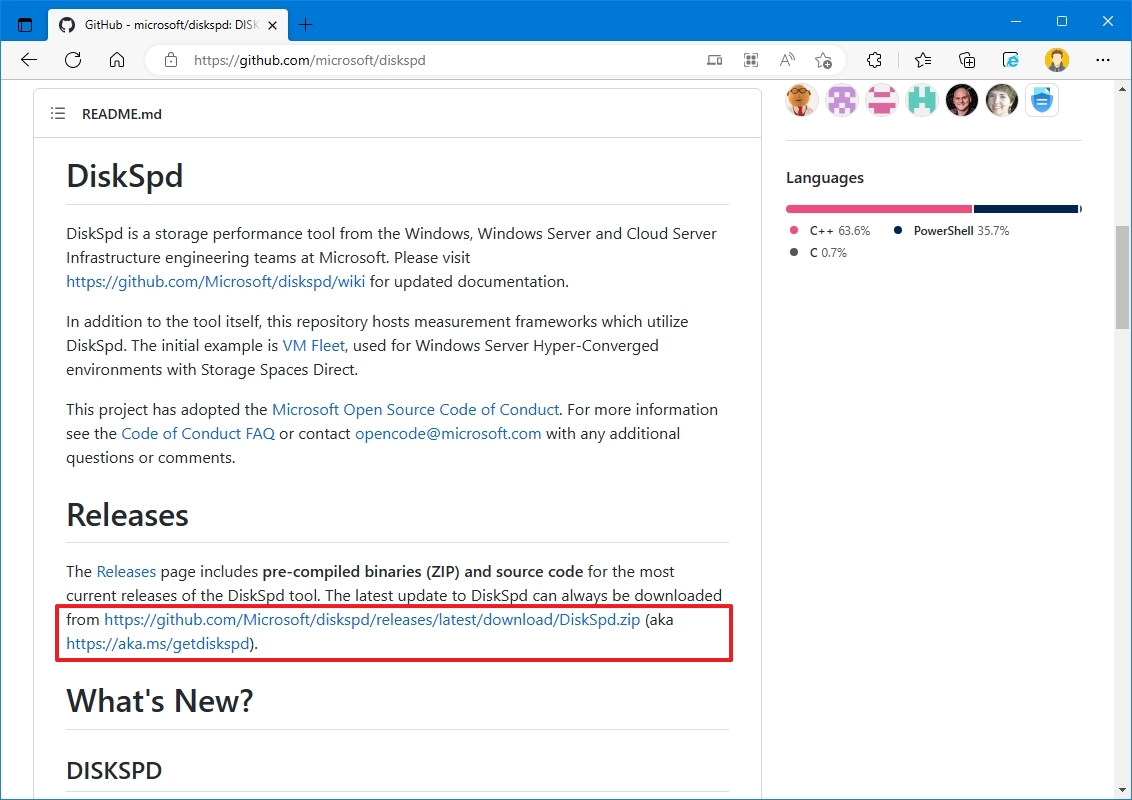
Для генерации нагрузки на дисковую подсистему и измерения ее производительности Microsoft рекомендует использовать утилиту DiskSpd (https://aka.ms/diskspd). Эта консольная утилита, которая в несколько потоков может осуществлять операции I/O с указанным таргетом. Я довольно часто использую эту утилиту чтобы замерить производительность СХД в IOPS и получить максимальную скорость чтения/записи c данного сервера (можно конечно измерить производительность и со стороны СХД, в этом случае diskspd будет использоваться для генерации нагрузки).
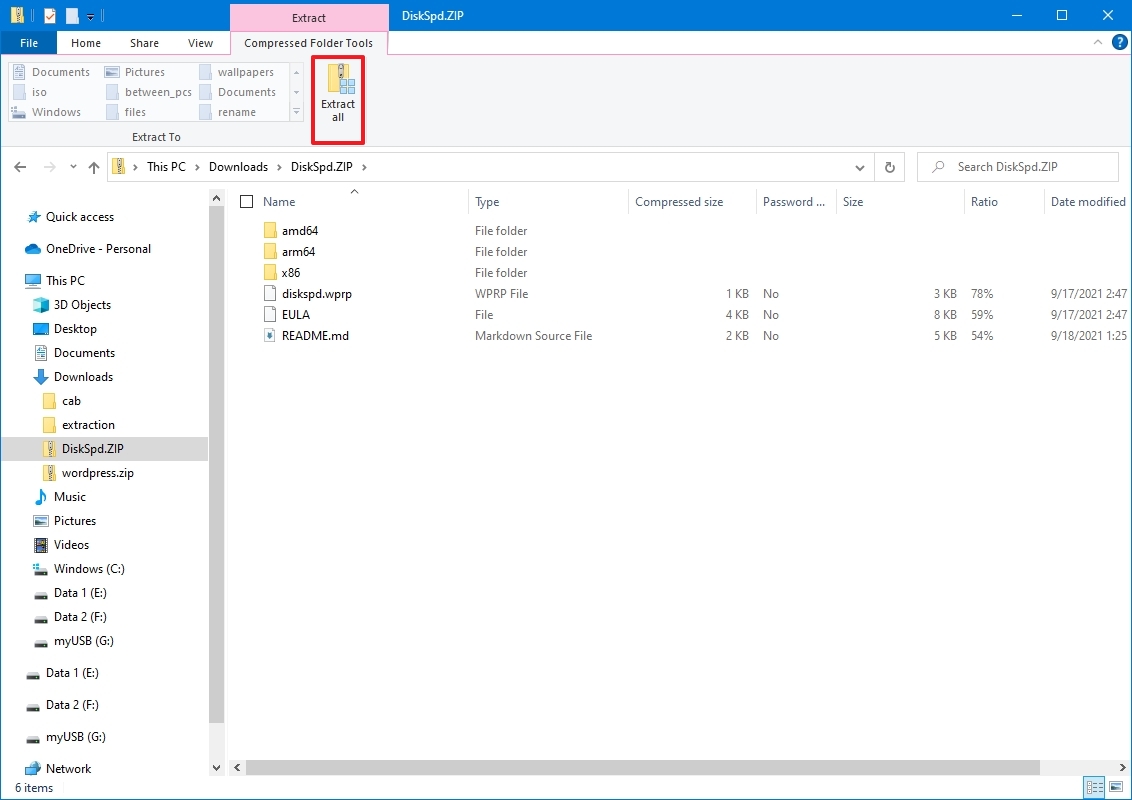
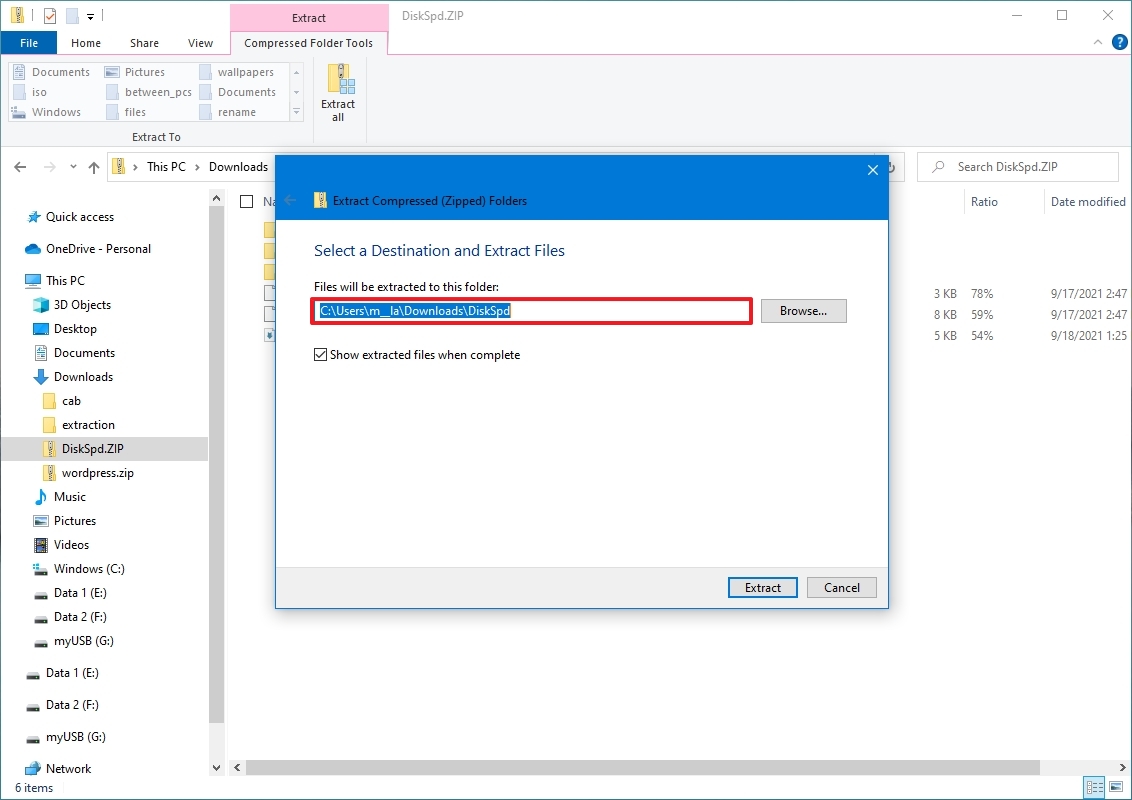
Утилита не требует установки, просто скачайте и распакуйте архив на локальный диск. Для x64 битных систем используйте версию diskspd.exe из каталога amd64fre.
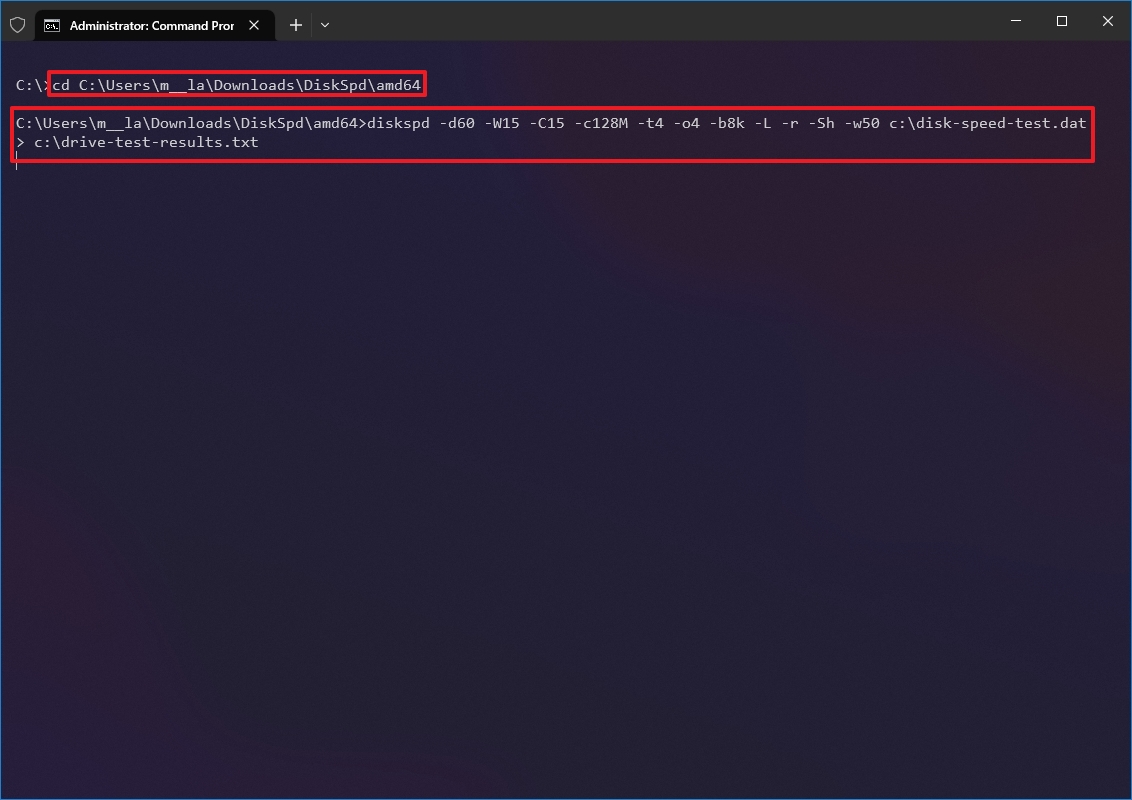
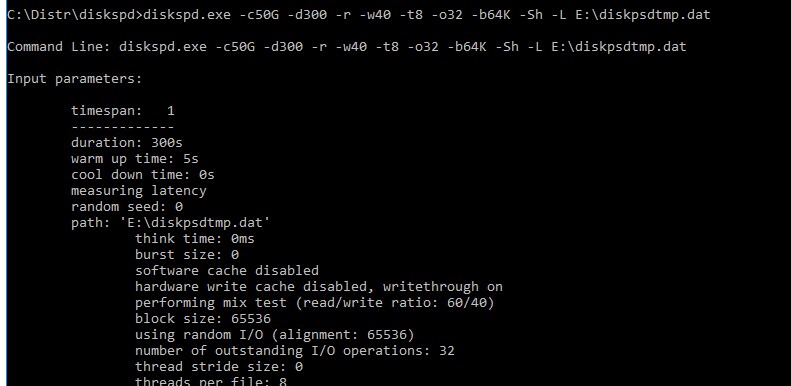
Я использую такую команду для тестирования диска:
diskspd.exe –c50G -d300 -r -w40 -t8 -o32 -b64K -Sh -L E:\diskpsdtmp.dat > DiskSpeedResults.txt
Важно. При использовании diskspd.exe генерируется довольно большая нагрузка на диски и CPU тестируемой системы. Поэтому, чтобы не вызвать падение производительности для пользователей, не рекомендуем запускать ее на продуктивных системах в часы пиковой нагрузки.
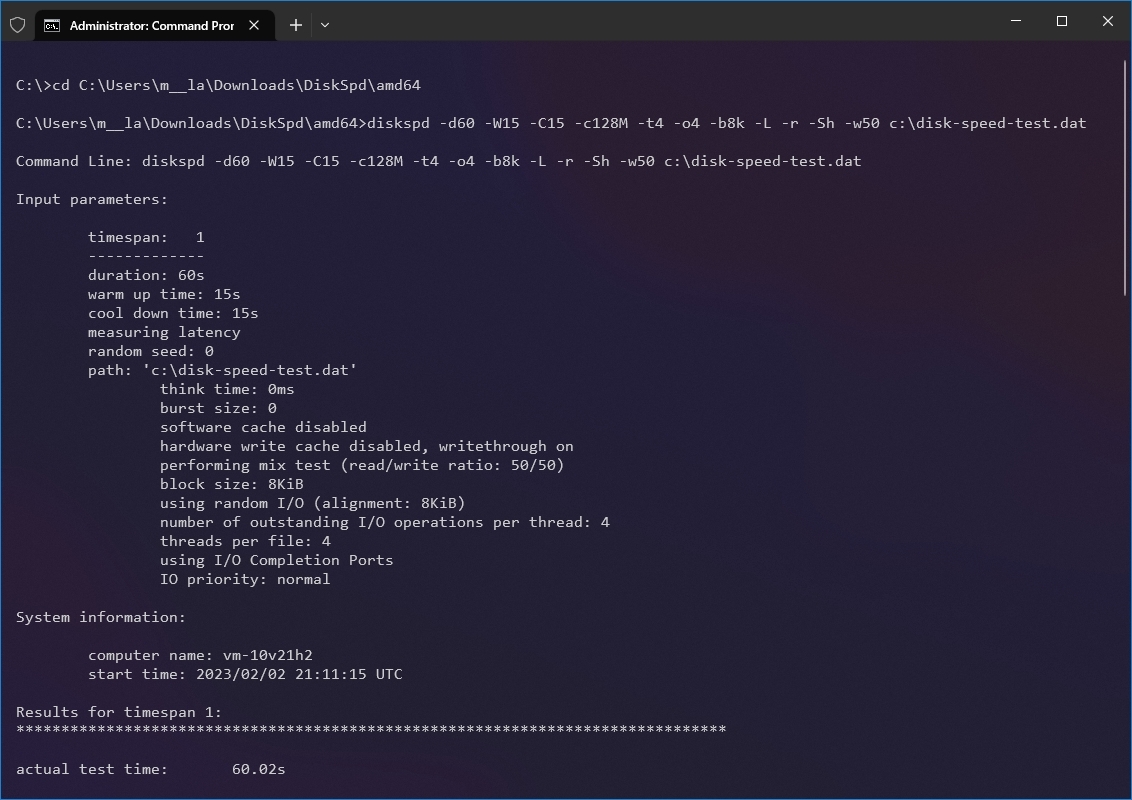
-
-c50G
– размер файла 50 Гб (лучше использовать большой размер файла, чтобы он не поместился в кэш контроллера СХД); -
-d30
0 – продолжительность тестирования в секундах; -
-r
– произвольное чтение/запись (если нужно тестировать последовательный доступ, используйте –s); -
-t8
– количество потоков; -
-w40
– соотношение операций записи к операциям чтения 40% / 60%; -
-o32
— длина очереди; -
-b64K
— размер блока; -
-Sh
— не использовать кэширование; -
-L
— измерять задержки (latency) ; -
E:\diskpsdtmp.dat
– путь к тестовому файл.
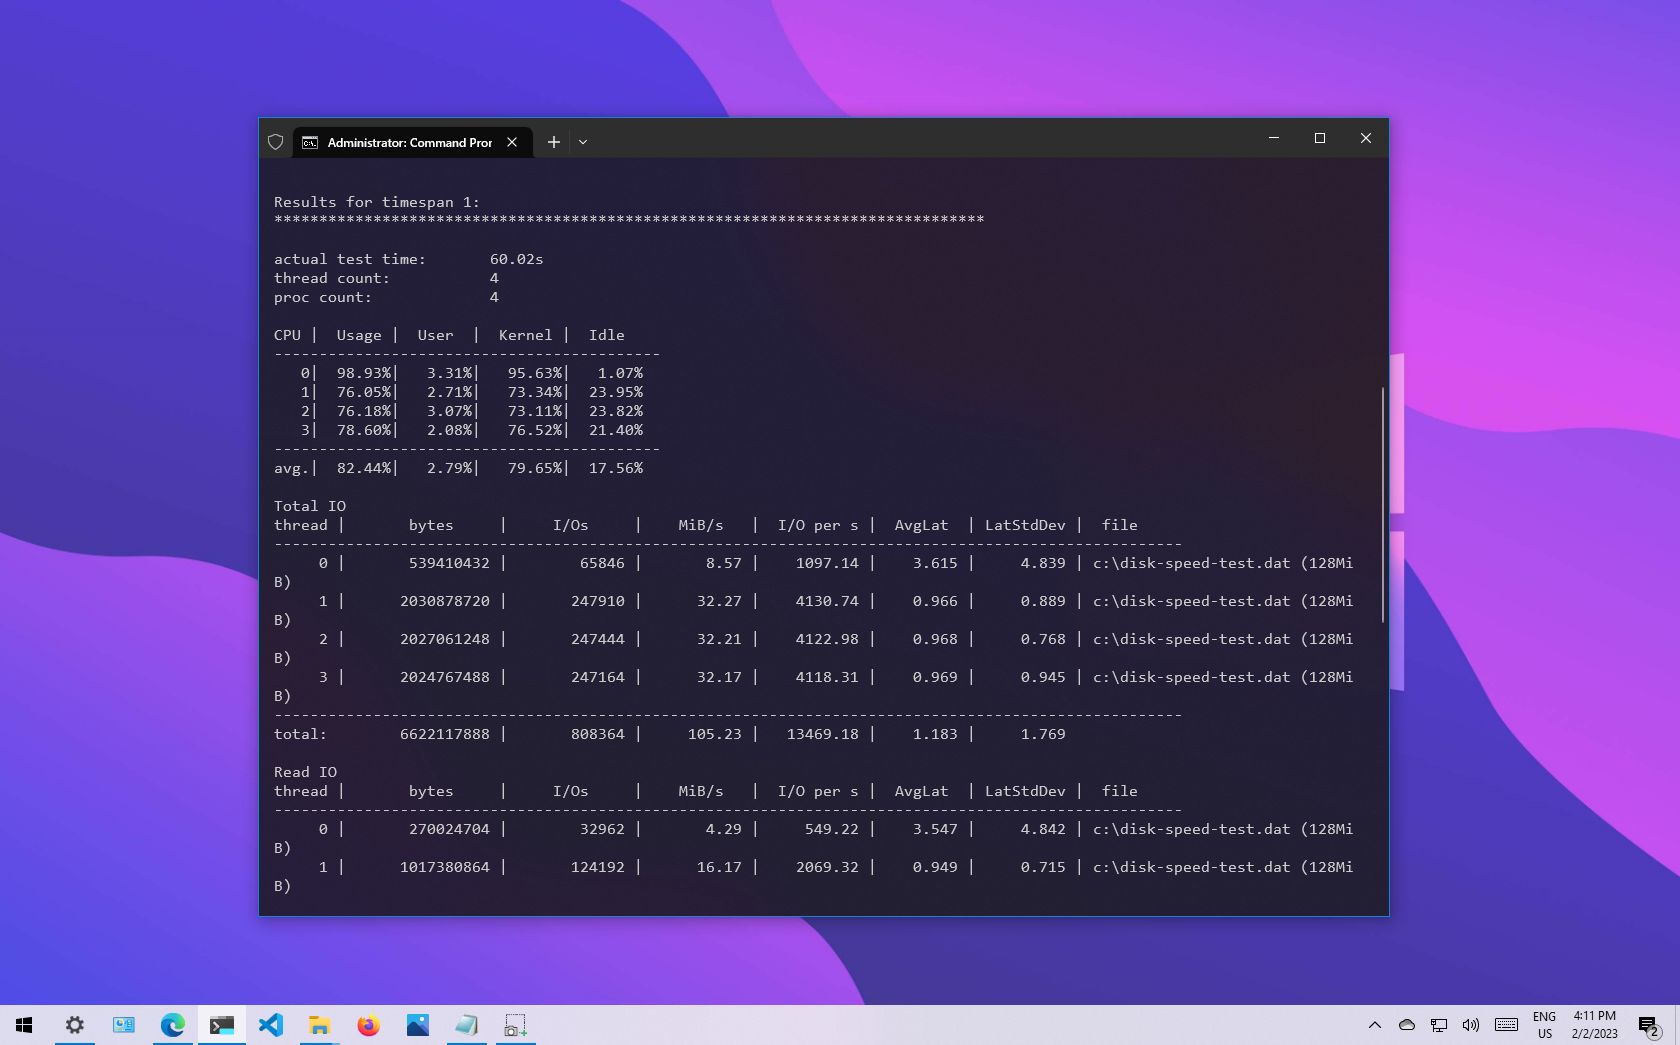
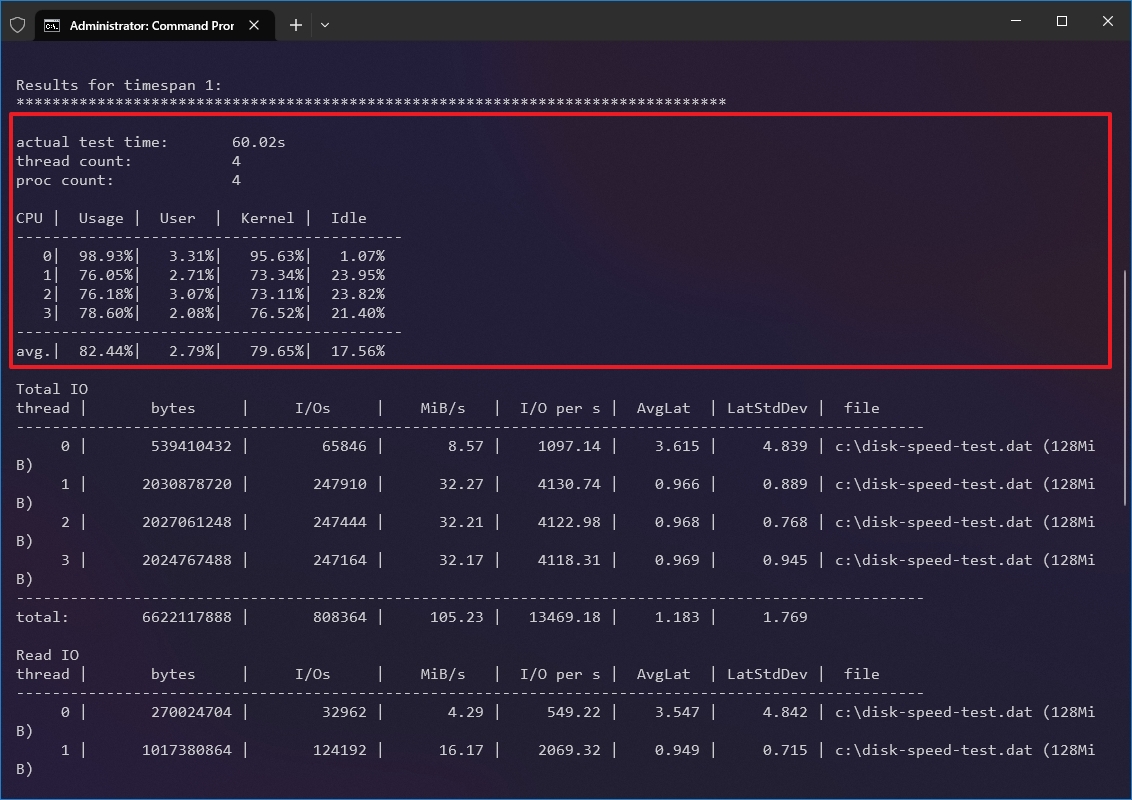
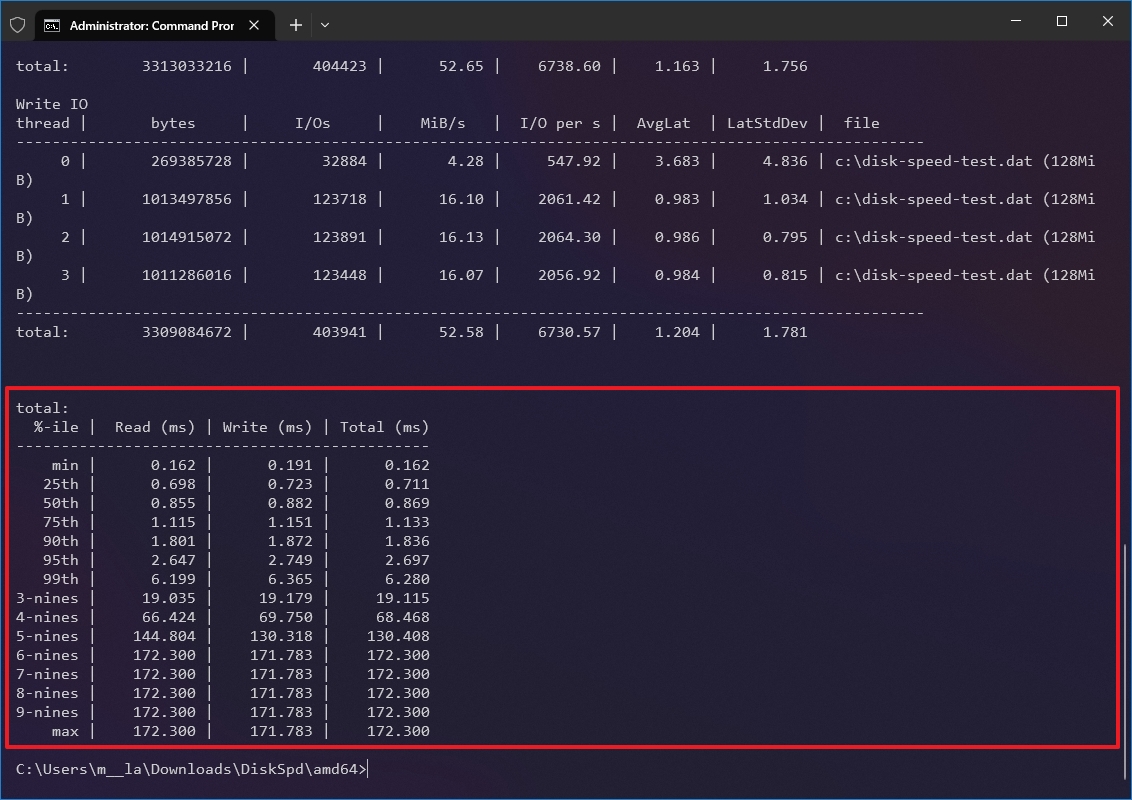
После окончания стресс-теста из полученных таблиц можно получить средние значения производительности.
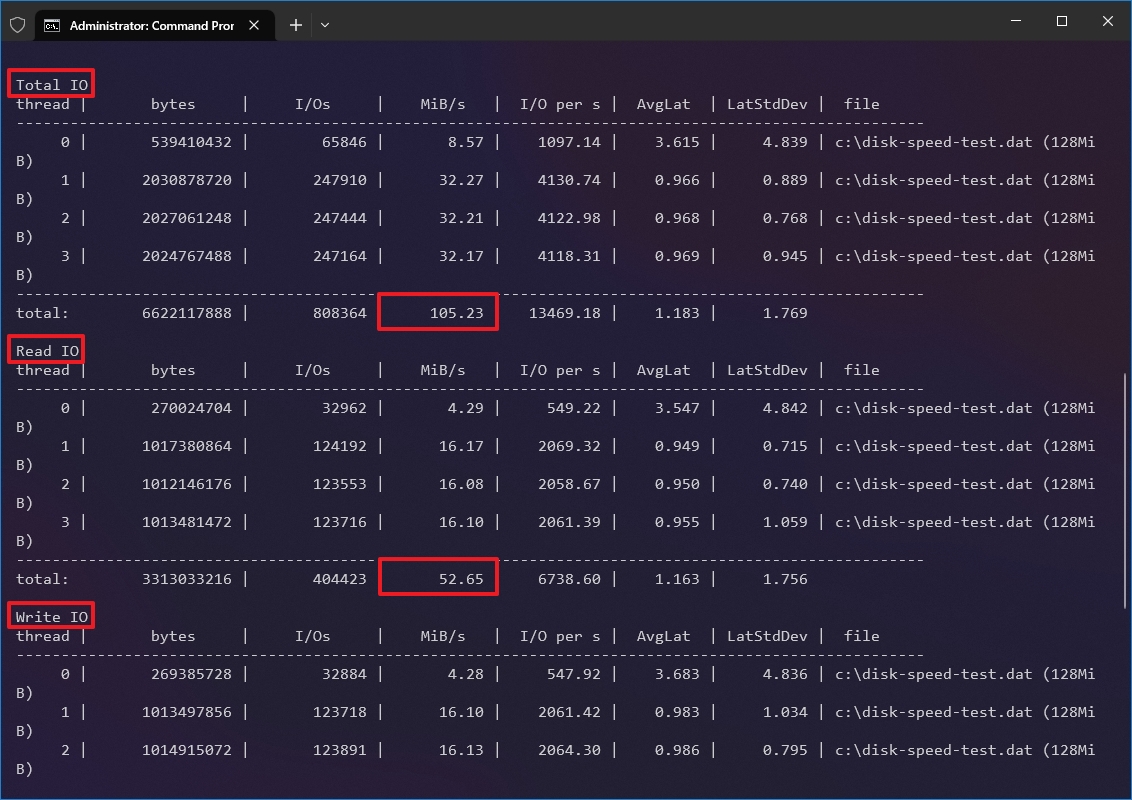
Например, в моем тесте получены следующие общие данные про производительности (Total IO):
- MiB/s — 241 (около 252 Мб/сек, неплохо)
- IOPS — 3866.49 (отлично!)
- Средняя задержка — 66.206 мс (высоковато!)
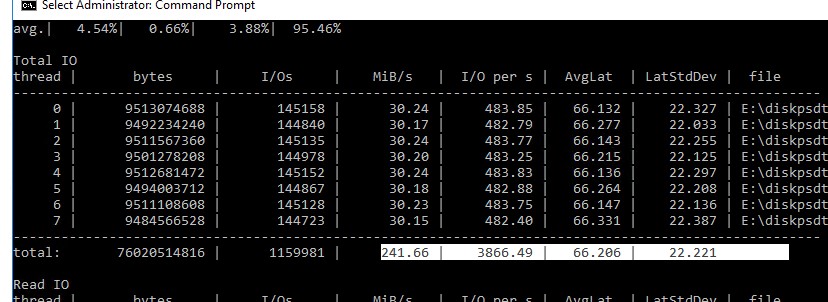
Можно получить отдельные значения только по операциям чтения (секция Read IO ) или записи (секция Write IO ).
Протестировав с помощью diskspd несколько дисков или LUN на СХД, вы сможете сравнить их или выбрать массив с нужной производительностью под свои задачи.
Как получить IOPS и производительность дисковой подсистемы с помощью PowerShell?
Недавно мне на глаза попался PowerShell скрипт (автор Microsoft MVP, Mikael Nystrom), являющийся по сути надстройкой над утилитой SQLIO.exe (набора тестов для расчета производительности файлового хранилища).
Примечание. В декабре 2015 года Microsoft объявила о прекращении поддержки утилиты и замене SQLIO на более универсальный инструмент — Diskspd, удалив файлы с дистрибутивом SQLIO со своего сайта. Поэтому, вам придется искать sqlio.exe самостоятельно, либо скачать с нашего сайта (находится в архиве со скриптом).
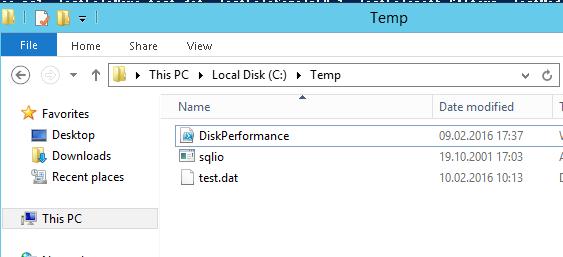
Итак, скачайте архив содержащий 2 файла: SQLIO.exe и DiskPerformance.ps1 (disk-perf-iops.ZIP — 73Кб) и распакуйте архив в произвольный каталог.
Пример запуска PowerShell скрипта для определения IOPS:
.\DiskPerformance.ps1 -TestFileName test.dat –TestFileSizeInGB 1 -TestFilepath C:\temp -TestMode Get-LargeIO -FastMode True -RemoveTestFile True -OutputFormat Out-GridView
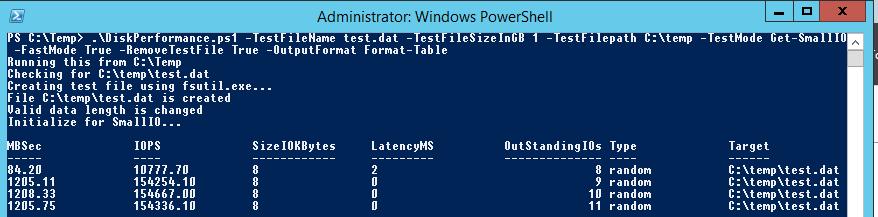
Я использовал в скрипте следующие аргументы:
- -TestFileName test.dat — имя файла, создаваемого утилитой FSUTIL;
- –TestFileSizeInGB 1 — размер файла для тестов. Допустимые варианты 1,5,10,50,100,500,1000 Гб. Размер файла должен быть больше, чем размер кэша системы. Иначе будет измеряться IOPS для данных в кэше, а не на диске;
- -TestFilepath C:\Temp — указывается диск, для которого будет выполняться расчет производительности и каталог на диске, в котором будет создаваться тестовый файл. Допустимо указать UNC путь к сетевой папке;
- —TestMode Get-LargeIO — есть два варианта измерения нагрузки, Get-SmallIO – измеряются IOPS, Get-LargeIO – измеряется скорость передачи данных. Разница между аргументами SmallIO и LargeIO, в размерах блоков при замере скорости 8 Кбайт и 512 Кбайт, и типе доступа Random или Sequential соответственно;
- -FastMode True — в режиме Fastmode каждый тест выполняется 10 секунд, иначе 60 сек;
- -RemoveTestFile True — удалить тестовый файл по окончании теста;
- -OutputFormat Out-GridView — возможен вывод результатов измерения в консоль PowerShell (Format-Table) или в отдельное окно графической таблицы (Out-Gridview);
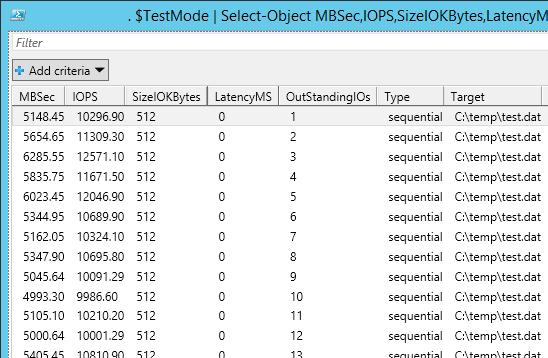
В нашем случае дисковый массив (тестировался виртуальный vmdk диск на VMFS хранилище, расположенном на дисковой полке HP MSA 2040 с доступом через SAN) показал среднее значение IOPS около 15000 и скорости передачи данных (пропускная способность) около 5 Гбит/сек.
В следующей таблице указаны примерные значения IOPS для различных типов дисков:
| Тип | IOPS |
| SSD(SLC) | 6000 |
| SSD(MLC) | 1000 |
| 15K RPM | 175-200 |
| 10K RPM | 125-150 |
| 7.2K RPM | 50-75 |
| RAID5 из 6 дисков с 10000 RPM | 900 |
Ниже приведены ряд рекомендаций по производительности дисков в IOPS для распространенных сервисов:
- Microsoft Exchange 2010 – с 5000 пользователей, каждый из которых получает 75 и отправляет 30 писем в день, потребует как минимум 3750 IOPS
- Microsoft SQL 2008 Server – с 3500 SQL транзакциями в секунду (TPS) — 28000 IOPS
- Обычный сервер приложений Windows на 10-100 пользователей — 10-40 IOPS