
1. Overview of TCP Window Full Analysis
Wireshark‘s TCP dissector, by default, monitors the state of each TCP session and provides insights when it detects problems such as “TCP Window Full” or other potential issues. When you open a capture file, Wireshark analyzes each TCP packet sequentially as they appear in the packet list. This feature can be controlled through the “Analyze TCP sequence numbers” setting in the TCP preferences, allowing users to enable or disable the analysis based on their troubleshooting needs.
2. Background on TCP Window Full Conditions
When conducting TCP analysis on packet files, the “TCP Window Full” alert typically appears as follows:
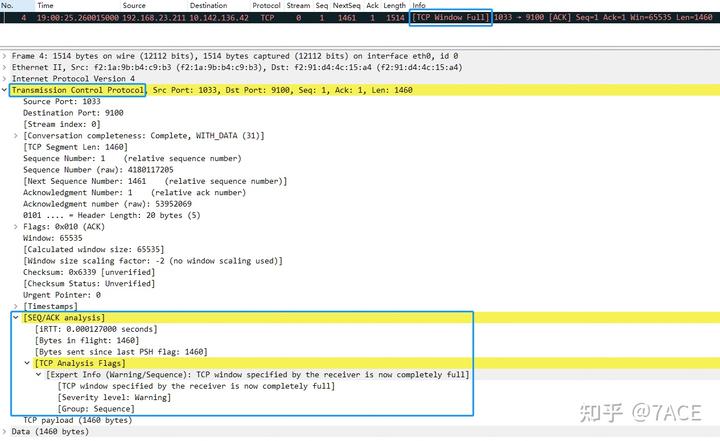
- 2.1 Packet List Window: In the Info column, “[TCP Window Full]” is highlighted in red text on a black background.
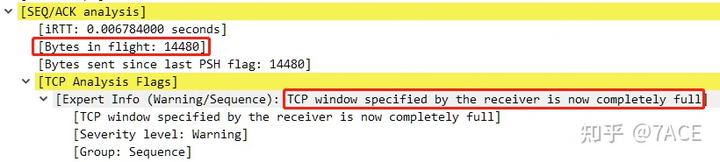
- 2.2 Packet Details Window: In the TCP protocol tree, under [SEQ/ACK analysis] -> [TCP Analysis Flags], the analysis of the TCP packet is explained.
3. Defining TCP Window Full
In simple terms, a “TCP Window Full” condition occurs when the size of a TCP segment sent by the sender exceeds the receiver’s advertised window size. This limitation is due to the receiver’s window size, which is a condition marked by the sender, not the receiver.
When the segment size is non-zero, and the window size in the reverse direction is known, if the segment size exceeds the reverse window size, the “TCP Window Full” flag is set.
Here’s an example of code that detects the “Window Full” condition in TCP data streams. The flag is set when the current data segment reaches the boundary of the receiver’s advertised window:
/* WINDOW FULL
 * If we know the window scaling
 * and if this segment contains data and goes all the way to the
 * edge of the advertised window
 * then we mark it as WINDOW FULL
 * SYN/RST/FIN packets are never WINDOW FULL
 */
if( seglen>0
&&  tcpd->rev->win_scale!=-1
&&  (seq+seglen)==(tcpd->rev->tcp_analyze_seq_info->lastack+(tcpd->rev->window<<(tcpd->rev->is_first_ack?0:(tcpd->rev->win_scale==-2?0:tcpd->rev->win_scale))))
&&  (flags&(TH_SYN|TH_FIN|TH_RST))==0 ) {
    if(!tcpd->ta) {
        tcp_analyze_get_acked_struct(pinfo->num, seq, ack, TRUE, tcpd);
    }
    tcpd->ta->flags|=TCP_A_WINDOW_FULL;
}
4. Packetdrill Example
The logic for TCP analysis is straightforward, making it easy to simulate the “TCP Window Full” condition using packetdrill. Here’s an example:
# cat tcp_window_full.pkt
0 socket(..., SOCK_STREAM, IPPROTO_TCP) = 3
+0 setsockopt(3, SOL_SOCKET, SO_REUSEADDR, [1], 4) = 0
+0 bind(3, ..., ...) = 0
+0 listen(3, 1) = 0
+0 < S 0:0(0) win 1000 <mss 1460>
+0 > S. 0:0(0) ack 1 <...>
+0.01 < . 1:1(0) ack 1 win 1000
+0 accept(3, ..., ...) = 4
+.1 write(4, ..., 500) = 500
+0 > P. 1:501(500) ack 1
+0.1 < . 1:1(0) ack 501 win 1000
+.1 write(4, ..., 1000) = 1000
+0 > . 501:1001(500) ack 1
+0 > P. 1001:1501(500) ack 1
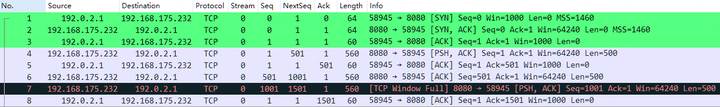
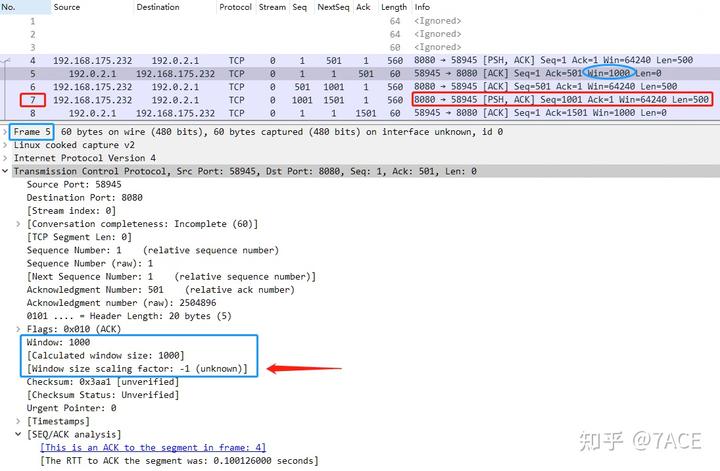
+0.1 < . 1:1(0) ack 1501 win 1000After capturing packets with tcpdump and analyzing them in Wireshark, it becomes evident that since the client (No. 5) advertised a window size (Win) of 1000, the server can only send data segments up to 1000 bytes. Consequently, the server sends two packets (No. 6 and No. 7), each with a length (Len) of 500 bytes. In packet No. 7, Wireshark flags it as “[TCP Window Full]” because the total size of the sent bytes has reached the window size advertised by the client.
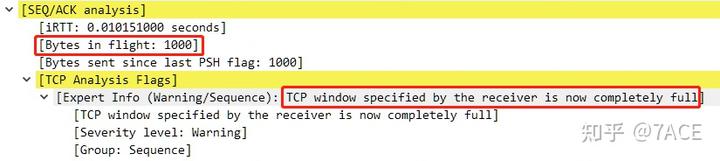
The BIF size is 1000, and the expert information indicates that the TCP window specified by the receiver is now completely full.
5. Problem Analysis Using TCP Window Full Indicators
Regarding examples of TCP Window Full, under normal circumstances, considering the release speed of the receiver’s window and the presence of Window Scaling, the occurrence of a TCP Window Full condition is relatively uncommon. However, in different scenarios, related events such as TCP Window Update, TCP ZeroWindow, TCP ZeroWindowProbe, and TCP ZeroWindowProbeAck may also appear.
5.1 Window Full
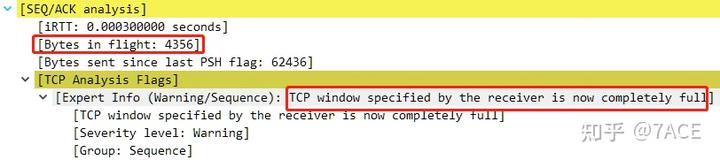
It can be seen that the client at No. 277 declared a window size (Win) of 8712, while the server at No. 278 marked [TCP Window Full] because the in-flight bytes reached 8712.
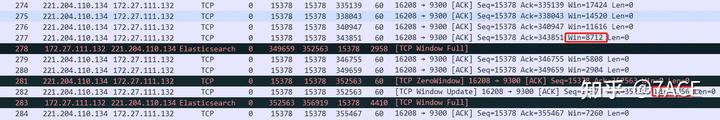
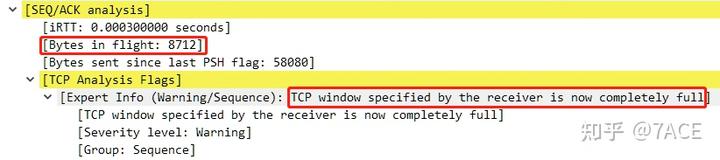
Later in the communication process, the client’s window size dropped to 0, leading to the marking of [TCP ZeroWindow] at No. 281. As the receive window was released, an ACK with a window size of 4356 was sent at No. 282. When the server sent the next data segment at No. 283, [TCP Window Full] was once again marked, for the same reason: the in-flight bytes reached 4356.
In this case, the client does not support Window Scaling, as the option was not included in the TCP SYN.
5.2 Special Cases of Window Full
When the TCP communication rate is slow, and you suspect that one end’s receive window is full or problematic, but there’s no clear [TCP Window Full] indication, trust your judgment—it could very well be a TCP window full issue. The absence of a [TCP Window Full] marker might simply mean that the packet capture or TCP stream is incomplete, missing information from the TCP three-way handshake. Without this data, you can’t determine whether the stream supports Window Scaling or know its exact value. Without this info, it’s impossible to calculate the actual window size based on the Win field in the packet, so you can’t assess when a window full event occurs. For instance, if the only information available is a receive window of 250, without knowing that the Window Scale factor is 4, how would you calculate the Win size as 1000?
In such cases, what you observe is one side announcing a small Win value, but the other side sending in-flight data that exceeds this value. You can infer that the TCP three-way handshake is missing. It’s important to note that Wireshark cannot make this judgment because the packet capture is incomplete. However, in a real data stream where both sides support Window Scaling, the communication flow would proceed with both sides using their respective scaling factors to calculate and transmit data. This can be easily simulated by omitting the first three packets of the TCP handshake in the packetdrill example. In such a case, by No. 7, the [TCP Window Full] marker no longer appears, even though the peer at No. 5 advertised a Win of 1000. The Window size scaling factor is marked as -1 (unknown), and the [TCP Window Full] code (tcpd->rev->win_scale = -1) has no further basis for judgment, so the marker doesn’t reappear. Note the distinction from a Window size scaling factor of -2 (no window scaling used), which indicates that the packet capture is complete, including the TCP three-way handshake, but both sides opted not to use Window Scaling.
How do you verify this? If possible, reproduce the TCP connection and capture the TCP three-way handshake again. Whether the scaling factor is -2 (not supported) or some other value, knowing this won’t allow you to manually set the Window Scale value and trigger the [TCP Window Full] marker again.
5.3 First ACK and Window Full
This brings us to the earlier code segment involving tcpd->rev->is_first_ack. As shown below, if is_first_ack is true, the offset for the Window, i.e., the Window Scale, is set to 0 instead of using the Window Scale value from the TCP three-way handshake.
tcpd->rev->window << (tcpd->rev->is_first_ack ? 0 : (tcpd->rev->win_scale == -2 ? 0 : tcpd->rev->win_scale))The is_first_ack flag is specifically set during the TCP three-way handshake, meaning it’s initialized as True for both SYN and SYN/ACK packets.
if(tcph->th_flags & TH_SYN) {
    if(tcph->th_flags & TH_ACK) {
        expert_add_info_format(pinfo, tf_syn, &ei_tcp_connection_synack,
                               "Connection establish acknowledge (SYN+ACK): server port %u", tcph->th_sport);
        /* Save the server port to help determine dissector used */
        tcpd->server_port = tcph->th_sport;
    } else {
        expert_add_info_format(pinfo, tf_syn, &ei_tcp_connection_syn,
                               "Connection establish request (SYN): server port %u", tcph->th_dport);
        /* Save the server port to help determine dissector used */
        tcpd->server_port = tcph->th_dport;
        tcpd->ts_mru_syn = pinfo->abs_ts;
    }
    /* Remember where the next segment will start. */
    if (tcp_desegment && tcp_reassemble_out_of_order && tcpd && !PINFO_FD_VISITED(pinfo)) {
        if (tcpd->fwd->maxnextseq == 0) {
            tcpd->fwd->maxnextseq = tcph->th_seq + 1;
        }
    }
    /* Initialize the is_first_ack */
    tcpd->fwd->is_first_ack = TRUE;
}
In the following case, No. 79 is marked as [TCP Window Full]. At first glance, this seems odd since the TCP three-way handshake clearly indicates that both sides support Window Scaling, and both have a large scaling factor of WS 128. Yet, after transmitting just 10 MSS 1448 segments between No. 70 and No. 79, the window full condition occurs.
No. 79 shows a BIF size of 14480, which equals the Win value advertised in the SYN/ACK (Win 14480), but Window Scaling was not applied. Instead, for the [TCP Window Full] evaluation, a scaling factor of 0 was used rather than WS 128.
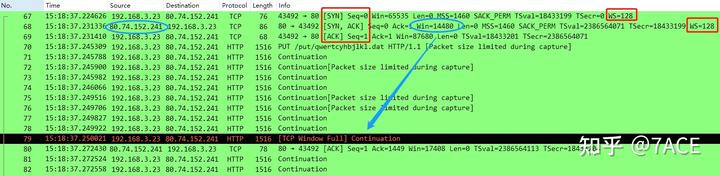
This happens because, for the client at No. 79, tcpd->rev->is_first_ack corresponds to the is_first_ack value on the server side. Since the only packet in the rev direction is the No. 68 SYN/ACK, is_first_ack remains True. As a result, the Window offset (i.e., Window Scale) is set to 0, leading to the final determination of [TCP Window Full].
5.4 Continuing the Discussion on Special Cases of Window Full
Here’s another case: the server’s packet No. 5 is flagged as [TCP Window Full]. This occurs because the client’s packet No. 3 advertised a Win of 1000, which means the Win value of 250 was multiplied by a Window Scale of 4. As a result, the server could send two 500-byte data segments in packets No. 4 and No. 5, and No. 5 was marked with [TCP Window Full].
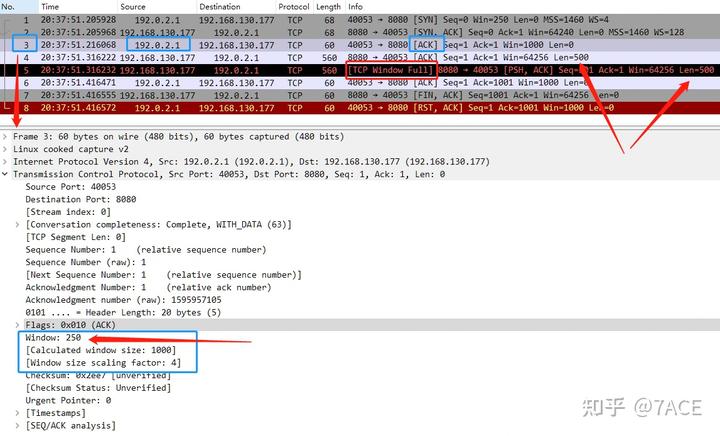
This means that when analyzing packet No. 5 on the server side, the Window Scale value in the reverse direction was correctly interpreted as 4, not 0, which indicates that the client’s is_first_ack value was False. This is achieved while analyzing the client’s ACK packet No. 3 through the following code:
/*
 * Remember if we have already seen at least one ACK,
 * then we can neutralize the Window Scale side-effect at the beginning (issue 14690)
 */
if(tcp_analyze_seq
    && (tcph->th_flags & (TH_SYN | TH_ACK)) == TH_ACK) {
    if(tcpd->fwd->is_first_ack) {
        tcpd->fwd->is_first_ack = FALSE;
    }
}
6. Conclusion
In summary, understanding the “TCP Window Full” condition and its implications in TCP analysis is crucial for effective troubleshooting. By carefully interpreting window sizes and packet flows, Wireshark users can identify bottlenecks and optimize network performance.
I summarized the display related to «TCP Window» which is frequently observed with Wireshark.
目次
- What is TCP Window
- The situation indicated by [TCP ZeroWindow]
- The situation indicated by [TCP Window Update]
- The situation indicated by [TCP Window Full]
- What are the situations where these three indications occur frequently
What is TCP Window
The TCP Window associated with these displays is an implementation of TCP flow control.
To put it briefly, from the standpoint of receiving data , it is reasonable to control the problem of «It is inefficient even if a small amount of information is sent even though a large amount of data can be handled even though it can be handed off» It’s a way to send it to your opponent with speed.Please refer to this page for details.
The situation indicated by [TCP ZeroWindow]
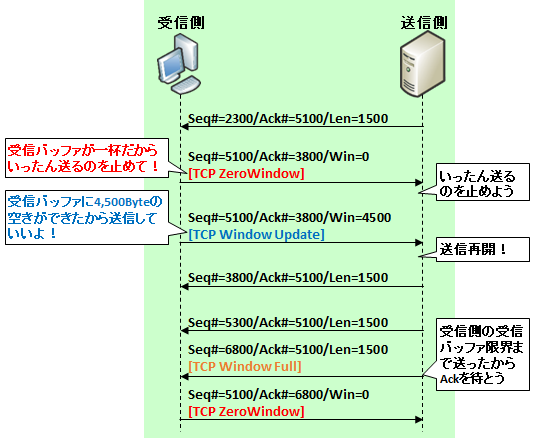
[TCP ZeroWindow] will be transmitted because the data receiver side informs the sender that «Since it can not be processed anymore, wait for it to be sent once«.Specifically, it is displayed when a packet with TCP «Window field» set to 0 is observed along with Ack with the other party.
The situation indicated by [TCP Window Update]
On the other hand, the transmission of [TCP Window Update] tells the sender that «You can process the buffer, so please resume transmission!«Specifically, it is displayed when packets with the same ACK number as ZeroWindow and the numerical value of its own receive buffer is set in TCP «Window field».
Even within normal TCP exchanges, Window’s update is done, but this is displayed when updating when there is no business to send to the other party (Ack for the last received data has also been sent) I will.
The situation indicated by [TCP Window Full]
Finally, [TCP Window Full] , this is the situation that the sending side «has sent off to the limit of the receiving buffer on the receiving side«.This is because Wireshark calculates Window and transmission volume, it grasps the situation and displays it bothers me.Expert Info will show » tcp window specified by the receiver is now completely full«.
What are the situations where these three indications occur frequently
There are two possibilities.
Processing on the receiving side is merely slow
One is simply that «the buffer on the data receiving side overflows, tells the sender to stop sending data (ZeroWindow), when the buffer is created it tells its capacity (Window Update) and before the client side handles it The sending side sends it to the limit of buffer capacity.»
In other words, it is the case that the processing capacity of the data receiving side is very slow compared to the network speed.
In this case, there is no other way to raise specs on the data receiving side.
The data receiving side is controlling the bandwidth
The other is the possibility that the client intentionally created such a condition for bandwidth control.
Specifically, this depends on how to create the application’s TCP / IP socket API. For example, if you add the «—limit — rate» option with curl or wget command, or «—bwlimit» with the rsync command, When downloading a certain amount , etc., the client repeats these series of operations to control the speed.
The following is an example of limiting the speed to 100 kbps with curl command.
curl —limit — rate 100k http://www.yahoo.co.jp
In this example, it is easy to understand because it is explicitly executed with the command option, but depending on the application this may not be explicit, so if it seems to occur frequently it is necessary to contact the application development vendor.
TCP sliding window is very crucial concept in understanding how TCP behaves. In order to see how this mechanism works, I have rate limited an HTTP download and observed what happens during this scenario in which we will see reports from Wireshark that [TCP Window Full] and [TCP ZeroWindow]. The aim of this post is to try to show how wireshark understands that Window is full.

We have a web server and a client machine on this setup. We intentionally rate limit the traffic by using wget to allow us investigate this scenario.
root@LAB1021-PC10:~# wget http://10.11.5.2/test.iso --limit-rate=50K
Connecting to 10.11.5.2:80... connected.
HTTP request sent, awaiting response... 200 OK
Length: 1048576 (1.0M) [application/x-iso9660-image]
Saving to: test.iso

100%[================================================================>] 1,048,576   50.3KB/s   in 20s

(50.1 KB/s) - test.iso saved [1048576/1048576]
Yes we have downloaded the the file. During the download I also took packet capture on the client side. In order to understand the behaviour, first this rate limiting needs a bit of explanation. When you set the option “–limit-rate” on wget, software in order to sustain the throughput you set, sends a TCP segment with Window Size set to 0 which literally instructs the sender to pause. As my aim is to try to understand how Wireshark notices window full situation, we are starting to investigate the packet capture right after client sends a TCP ACK with Window Size zero.
We should better zoom into particular time frame in order to understand this event easier as the whole story is developed between Pkt 181 and Pkt 200 in this capture. You need to take a look at this screenshot before going further in the article since it shows how we go from “Window Zero” to Window full state.

Packet no: 181 is sent from client with Win=0 as you can see. At that particular moment, sender knows that it isn’t allowed to send any more packets.
Packet no: 182 client this time decides to accept packets because of which sets the WindowSize to 22656 (Win=22656). What does this mean practically? As window size is a number which tells the sender that “You can send this number of bytes without expecting any acknowledgement from me“, sender resumes sending segments as fast as it can from this point on.
Packet no: 183 – 197 In a normal TCP communication you don’t see this number of segments which aren’t acknowledged. This is because of our rate limiting actually.
Now we stop the clock right after packet 197 is received i.e T=0.653210000 and take a closer look at the status of the window or we somehow take a snapshot of the receive window at this point.

Have you stopped the clock at Time = 0.653210000. Remember! client had told sender that your window is 22656Bytes. You can only send this amount with no ACK from me. What we see here is that packets from 183 to 197 didn’t receive any ACK from client (receiver). Hence number of bytes sent but not ACKed are 20272Bytes. This means sender can send 22656 – 20272 = 2280Bytes more and if doesn’t receive any feedback(ACK), then it will stop.
Packet 198: but something happens here. Receiver(client) decides to acknowledge some of the bytes by setting ACK=4109684389. What does really this mean? With this single number, Receiver is telling the Sender that “I have received all the bytes up to this byte”. By this announcement, Receiver has actually acknowledged Pkt 183 sent from the sender. Not clear? Maybe I can show it like this. Let’s open the bytes on Pkt 183 and see how the bytes are counted.

SEQ number (4109683925) is the first byte in the TCP segment which is an inclusive number and our packet’s TCP payload has 464 bytes which means the last byte number is (4109684388). Hence on the ACK Pkt 198, receiver says that it is acknowledging the last byte 4109684388 by setting the ACK to 4109684389. It is important to understand that ACK number is the next expected sequence number of the TCP segment from the other side.
Now what happens. This is really important to understand the whole topic. At the beginning of the transaction on Pkt 183, receiver had set the Window to 22656 but now on this latest ACK (Pkt 198), it is reducing the window size further to 22272 (Win=22272) hence sender should send less bytes and the below image shows both how window is sliding and reduced at the same time.

What does this snapshot of the Receive window mean?
It means sender can send 2000 Bytes more without any acknowledgement from the receiver.
and bingo!!!
Pkt 199 (1448 Bytes) and Pkt 200 (552 Bytes) are sent from the sender which fills this usable window 2000Bytes. Therefore there isn’t any available space left in the receive window and Wireshark immediately detects and displays you the message [TCP Window Full]
I must say that it is really cool! Wireshark is doing a wonderful job to help people troubleshooting network issues.
I am hoping I haven’t done any conceptual mistake here. This is how I understand this behaviour. If you have anything to add or correct, please do let me know.
Genco.
Время на прочтение5 мин
Количество просмотров6.5K
Задержки (а по‑простому тормоза) в работе сети вряд ли кого‑то оставят равнодушным. Мы все очень не любим, когда медленно загружаются наши любимые веб‑ресурсы, или когда обрывается на 99% загрузка какого‑либо файла. Причин тормозов в сети может быть много — от проблем на физическом уровне и до медленной работы на уровне приложений. Сегодня мы поговорим об одной из причин задержек в сети, которую можно выявить с помощью анализатора пакета Wireshark. При этом не имеет особого значения, передается ли наш трафик в открытом виде или прячется за SSL: на верхние уровни мы забираться не будем. Важно только то, что это TCP трафик.
Окна в TCP
Протокол TCP содержит в своей архитектуре ряд функций, позволяющих препятствовать потере пакетов — например, такие механизмы, как повторные передачи и дублирующие подтверждения. Для предотвращения начала потери пакетов в TCP используется механизм скользящего окна (sliding‑window).
В механизме скользящего окна используется окно приема на стороне получателя пакетов для управления потоком данных. Принимающий хост указывает размер окна приема в байтах, сохраняет его в ТСР‑заголовке и сообщает передающему хосту, сколько данных он готов сохранить в памяти своего ТСР‑буфера. Именно в этой памяти данные временно хранятся до тех пор, пока они не будут переданы вверх по стеку протоколов на уровень приложений для последующей обработки. В итоге передающий хост может одновременно послать только то количество данных, которое указано в поле Window size (Размер окна) заголовка, полученного в ответ пакета ТСР. Чтобы передающий хост мог послать больше данных, принимающий хост должен отправить ему подтверждение о получении предыдущей порции данных. Он должен также очистить память своего ТСР‑буфера, обработав данные, занимающие эту память.

В целом, все достаточно просто. Принимающая сторона говорит, что готова принять, условно, три блока данных, отправитель передает их. Получает отправляет подтверждение, после чего отправляются следующие три блока данных и так далее.
В идеальном мире с постоянной пропускной способностью каналов размер окна действительно был бы постоянным значением. Однако, в реальности загрузка канала у нас постоянно меняется, и вместе с ней меняется и размер Window size. Процесс изменения размеров окна приема действует как в сторону уменьшения, так и увеличения. Так, если сервер способен обработать данные с большей скоростью, он может послать подтверждающий пакет АСК с большим размером окна приема.
Но ниже представлен пример приложения, у которого по каким‑то причинам уменьшился объем памяти, доступной в буфере, в результате чего получатель был вынужден уменьшить размер окна.

В случае, если получателю удалось решить свои проблемы с памятью, окно может быть снова увеличено. Но если быстро решить проблемы не удалось, и есть риск, что следующий блок данных обработать не удастся, получатель может указать размер Window=0. Что произойдет в таком случае?
Получив такой пакет, клиент прервет передачу данных и будет периодически отправлять пакет поддержания активным соединения. По сути, мы просто поддерживаем TCP соединение, при этом не передавая никаких данных. Когда получатель наконец‑то решит свои проблемы с памятью, он отправит пакет с обновлением размеров окна и передача полезной нагрузки продолжится.
От теории к практике
Теперь давайте вооружимся Wireshark и посмотрим, как выглядит соответствующий трафик.
В примере ниже у нас происходит информационный обмен между 192.168.0.20 и 192.168.0.30. В первых трех ACK пакетах значение Window уменьшается, видимо, у получателя проблемы с памятью и он не может обрабатывать больший объем данных.
Затем получатель отправляет пакет с нулевым окном. Однако после этого, по прошествии небольшого интервала времени, он отправляет обновление информации о размерах окна, в результате чего передача полезной нагрузки возобновляется.

В самом пакете информация о размере окна находится в TCP заголовке:

Теперь посмотрим более печальный случай: когда получателю не удается быстро решить свои проблемы с памятью и значение Window остается нулевым некоторое время.

Здесь мы видим обмен трафиком между двумя узлами. В какой‑то момент один из участников отказывается принимать полезную нагрузку, отправив TCP ZeroWindow. После этого второй участник обмена с некоторой периодичностью отправляет Keep‑Alive пакеты, на которые первый участник продолжает отвечать нулевыми окнами. Пакеты Keep‑Alive также являются служебными и не несут в себе никакой полезной нагрузки.
Как искать
В приведенных примерах наши служебные пакеты были представлены в уже отфильтрованном виде без лишнего трафика. В реальных дампах у нас будет много других пакетов, и нам потребуется осуществить фильтрацию.
Для того чтобы отфильтровать в Wireshark пакеты с определенным размером окна, нужно воспользоваться фильтром tcp.window_size_value.
Например, для того, чтобы найти все пакеты с ненулевым размером окна, нужно указать tcp.window_size_value > 0
Для фильтрации пакетов с ZeroWindow можно, конечно, явно указать фильтр tcp.window_size_value == 0, а можно воспользоваться фильтром
tcp.analysis.zero_window
Для обнаружения Keep_Alive воспользуемся фильтром tcp.analysis.keep_alive

Также узнать, как с течением времени менялось значение TCP Window, можно с помощью графика. Для этого нужно выбрать Statistics → TCP Stream Graph → Window Scaling.

Заключение
Механизм скользящего окна, о котором мы сегодня говорили, непосредственно связан с неспособностью сервера принимать и обрабатывать данные. Любое уменьшение размера окна приема или даже его установка в нулевое состояние является непосредственным результатом какого‑то затруднения, возникшего на сервере. Поэтому, если вы видите большое количество таких пакетов в трафике, то это верный признак проблем с производительностью на принимающем узле и возможная причина задержек и сбоев в работе сетевых приложений.
В завершение рекомендую открытые уроки в Otus, подробнее о них ниже. Занятия пройдут в онлайн-формате и будут полезны сетевым инженерам, сетевым архитекторам и всем, кто глубоко интересуется современными сетевыми технологиями.
-
5 февраля: ISIS vs. OSPF, или почему же ISIS до сих пор проигрывает битву OSPF в корпоративных сетях? Записаться
-
18 февраля: Надежность и сети, или почему скорость сходимости STP уже очень давно никому не нравится? Записаться
Recently, I have been sent a network trace file to analyze. The common complains were related poor (slow) TCP performance. After examining the trace file in detail, I found the culprit was TCP Zero Window packets.
What is TCP Zero Window?
In previous article (https://www.golinuxcloud.com/tcp-receive-window/), I have explained what a TCP receive window is. TCP zero window is a mechanism used to control the data flow. When receiver gets overwhelmed by sender, it can reduce its receive window. If it fills, the receiver reduces the receive window to zero which simply means that “I am full, please do not send any more data”. The sender will not send any data until the receiver frees (processes) the data in the receive window (TCP buffer). Once the buffer gets empty, the receiver increases (updates) the receive window and informs the sender that it has a free buffer to store some data.
Assume we have a sender and a receiver exchanging data like figures below. I will overview TCP zero window in a couple of steps.
Step-1: Zero window only happens when TCP is used as the transport protocol. There is no such thing in UDP. During TCP 3way handshaking both the sender and the receiver advertise their receive window. As seen below, the receiver sets its receive window to 4 bytes. The same goes for the sender. For sake of simplicity, each cell represents a byte. At the start, both of the buffers are fully free.

Step-2: The application on the sender delivers 4 bytes to the sender’s buffer and the sender sends one of them to the receiver like below. The receiver stores the data in its buffer and acknowledges the sender with the window size of 3.

Step-3: The sender puts another byte on the fly, freeing its buffer one more byte. As soon as the receiver gets the data, it places it in one of the free cells and lets the sender know there are only two cells left free with setting receive window to 2.

Step-4: The same pattern happens here as well.

Step-5: In this step, the sender sends the last byte in the buffer to the receiver. The receiver stores the data in its buffer. As seen below, the receiver’s application has not emptied the buffer. Because of that, there is no room for storing more data in the buffer, the receiver has to inform the server to stop sending more data with setting its receive window to zero. Once the sender sees the zero window, it stops sending data until the receiver increasing its receive window.

Step-6: The application on the server delivers some data to TCP and the data is stored in the buffer. Since the sender has not gotten any window update from the receiver, it has to wait without sending any data. This causes a delay in the network. As a result, the clients experience a slow network.

Step-7: The receiver frees 3 cells (bytes) and lets the server know that. After this step, the server will continue to send the data.

Analyzing TCP Zero Window in Wireshark
Zero window generally happens when there is heavy data exchange between the parts and low resources to consume. It is not easy to reproduce a TCP window zero event in a lab, so I will use Curl tool to cause a TCP zero window. It provides rate limiting by specifying the maximum upload and download transfer rate.
Step-1: For demonstration, I will use Curl to download a web page with setting rate limit 1K for each direction (download and upload). After starting Wireshark, apply the command below for rate limiting. The tool will optimize TCP receive window accordingly.
┌──(kali㉿kali)-[~]
└─$ wget http://info.cern.ch/hypertext/WWW/TheProject.html --limit-rate=1K
--2022-06-03 15:00:05--  http://info.cern.ch/hypertext/WWW/TheProject.html
Resolving info.cern.ch (info.cern.ch)... 188.184.21.108, 2001:1458:d00:34::100:125
Connecting to info.cern.ch (info.cern.ch)|188.184.21.108|:80... connected.
HTTP request sent, awaiting response... 200 OK
Length: 2217 (2.2K) [text/html]
Saving to: ‘TheProject.html.7’

TheProject.html.7             100%[=================================================>]   2.17K  1023 B/s    in 2.2s

2022-06-03 15:00:07 (1023 B/s) - ‘TheProject.html.7’ saved [2217/2217]
┌──(kali㉿kali)-[~]
Following screenshot shows the packets I captured. Notice that there is some nice expert info related to “[TCP ZeroWindow]” and “[TCP Window Full]”.

Step-2: The receiver advertises its receive window of 1152 bytes to the sender in the packet number 1.

Step-3: The sender advertises its receive window of 28960 bytes to the receiver in the packet number 2.

Step-4: After completing TCP 3way handshaking, the receiver sends a http GET request in packet number 4.

Step-5: After receiving the request, the sender (the server) responses with a packet size of 576 bytes in packet number 6.

Step-6: The sender sends another packet with size of 576 bytes in packet number 8. The total number of bytes sent to the receiver is equal to 576+576=1152. Since it is equal to receive window, Wireshark predicts that the receiver receive window has been filled.

Step-7: The receiver ACKs the sender with packet number 9, which means the receiver has freed the receive window.

Step-8: The sender sends a packet size of 1152 bytes, which fills the receiver receive window. Wireshark shows that in packet number 10.

Step-9: Since the receiver window is full, the receiver notifies the server to stop sending data with setting window size to zero in packet number 11.

Step-10: with packet number 12, the sender ACKs the receiver and tells it to keep the connection alive.

Step-11: The receiver keeps setting its window to zero in packet number 13.

Step-12: The receiver and sender keep repeating the same pattern for the next two packets.

Step-13: After freeing the buffer, the receiver updates its window to 1152 and the data transfer starts again. When we look at the time column, we can see that the zero window caused almost 2 seconds delay.

Final thoughts
TCP zero window plays a great role in experiencing a slow network. There can be variety of reason behind it. To address some common reason:
Check if both side the sender and the receiver advertise window scaling, which lets use of much larger receive window. The larger buffers mean less overwhelm. It is important that both side supporting window scaling, otherwise window scaling will not be utilized. Window scaling only works if both sides include it as an option during the initial 3-way handshake.
To investigate the culprit behind TCP zero window, one should take a look at the receiver resources to find out why the receiving buffer does not get emptied in the time. The receiver resources need to be observed, including counters for logical disk, physical disk, RAM, page file, all the TCP counters, processes and CPU.
References
https://accedian.com/blog/tcp-receive-window-everything-need-know/
https://www.linkedin.com/pulse/tcp-retransmits-window-size-0-problem-maybe-larry-brasher-brasher
https://packetpioneer.com/wireshark-graphing-tcp-zero-windows/
https://support.f5.com/csp/article/K35612380