
This post explains how to use program symbol files to debug applications or kernel drivers on Windows operating system. On Windows platform, the program symbols are stored in a separate file. These files are referred as pdb files and has the extension .pdb. When debugging a program in windbg, we need these symbol files otherwise what we see in the stack trace is just numerical addresses instead of function names and variable names. We won’t be able to make out anything from these numerical addresses. The symbols stored in pdb files are function names, local variable names, global variable names etc.
Setting symbol path
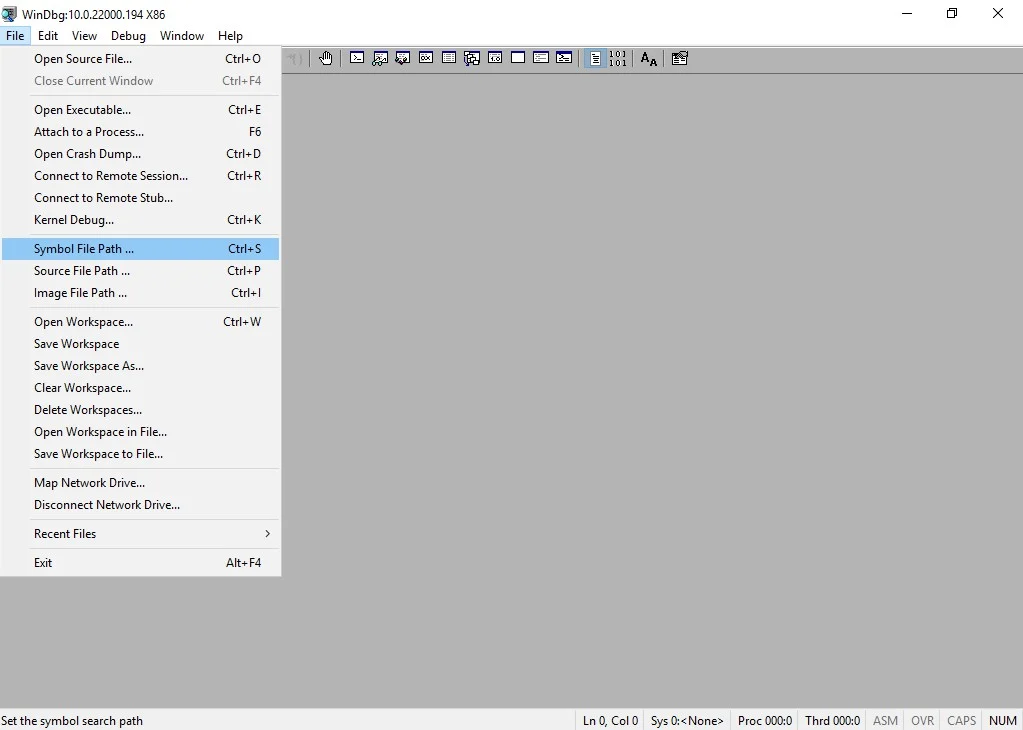
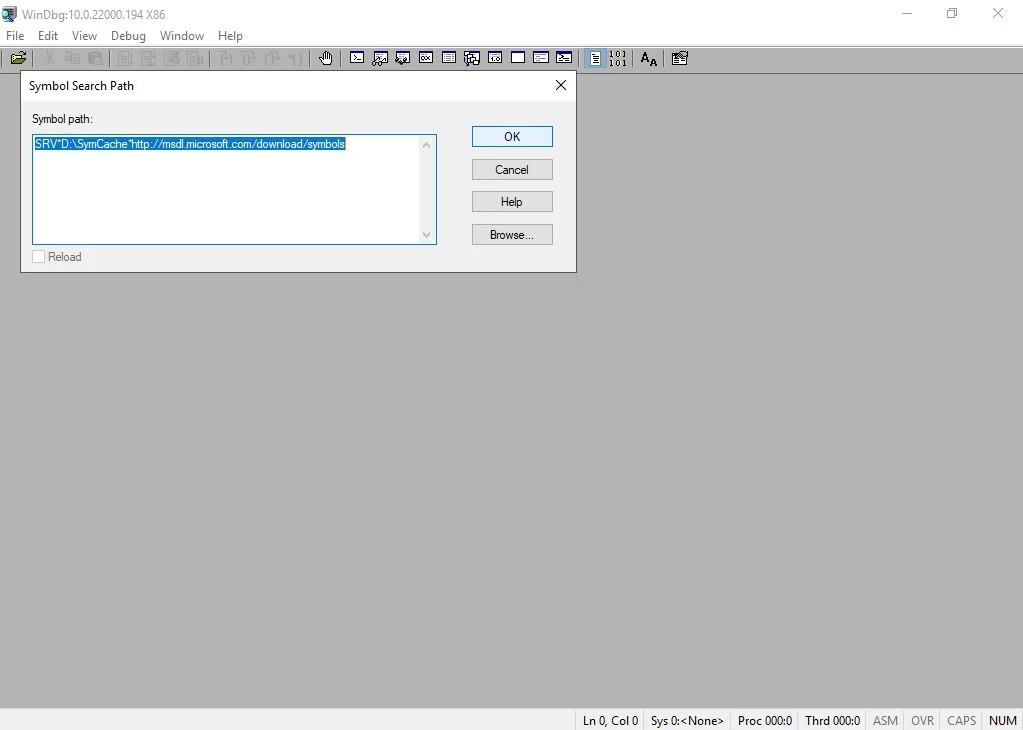
To use the symbols for debugging, we need to tell windbg which directories it should look into, to find the symbols. To do this, click on File menu and then Symbol File Path. You can enter the path as shown in the below image.
The symbol path in this example is srv*c:symbols*//msdl.microsoft.com/download/symbols.
The first path is a local directory and the second path is the Microsoft’s symbol server path. This path is required to get the symbols for Windows libraries like shell32.dll, gdi32.dll, advapi32.dll, kernel32.dll, ntdll.dll and many more libraries. The application we need to debug might be using these libraries.
We can specify the symbol search path in windbg prompt also. The command for this is .sympath
For example to set the above search path we need to run the below command.
.sympath srv*c:symbols*//msdl.microsoft.com/download/symbols
To print the current symbol search path just run .sympath command.
.sympath
Loading symbols after setting the path
After setting the symbol search path we need to load the symbols for all the loaded modules in memory. For this run the below command.
.reload /f
To load symbols for a particular binary we can specify the binary file name in the .reload command. For example to load symbols for myapplication.exe you can run the below command.
.reload /f myapplication.exe
In this command you need to provide the full name of the binary name along with the extension. Otherwise you might see the message like below.
“Myapplication” was not found in the image list.
Debugger will attempt to load “Myapplication” at given base 00000000`00000000.Please provide the full image name, including the extension (i.e. kernel32.dll)
for more reliable results.
Issues with symbols loading
If none of the symbol files match with the binary file then .reload command fails with the below error message.
0:041> .reload /f MyApplication.exe
*** ERROR: Module load completed but symbols could not be loaded for MyApplication.exe
When you get this do the following. Enable verbose mode for symbols loading by running the command !sym noisy. And run the .reload command again. Check for the error messages it prints.
0:041> !sym noisy
noisy mode – symbol prompts on
0:041> .reload /f myapplication.exe
SYMSRV: c:symbolsmyapplication.pdb38266E74B06B4EF3BCC16713A4A1E5E82myapplication.pdb not found
SYMSRV: //msdl.microsoft.com/download/symbols/myapplication.pdb/38266E74B06B4EF3BCC16713A4A1E5E82/myapplication.pdb not found
*** WARNING: Unable to verify checksum for myapplication.exe
*** ERROR: Module load completed but symbols could not be loaded for myapplication.exe
DBGHELP: myapplication – no symbols loaded
As you can see none of the symbol search paths have the Myapplication.pdb file. Before looking at how to fix this issue, let’s understand how windbg interpretes the symbol server path.
Understanding ‘SRV’ in symbol server path
Another thing you can notice in the above error is that, Windbg looks for the symbols files in a sub directory with the name myapplication.pdb/38266E74B06B4EF3BCC16713A4A1E5E82. This is because we used the keyword SRV in the symbol search path which indicates that this path need to be used as a symbol server path. For symbol servers, to identify the files path easily, Windbg uses the format binaryname.pdb/GUID. Each binary is given a unique GUID when the application is built and this GUID can be printed by the command !lmi binaryname. For example, to print GUID information for MyApplication.exe I need to run the command !lmi myapplication.
Now back to the symbol loading issue for Myapplication.exe. As the existing paths does not have this file, we need to add the path where the file is present. Let’s say the file is located at C:localsymbls. Then we can add this path to the symbols search using .sympath+ command. In our example, we need to run .symapth+ C:localsymbols. This is a normal directory which directly stores pdb files, it’s not a server path. So we don’t prefix the path with SRV.
0:041> .sympath+ c:localsymbols
DBGHELP: Symbol Search Path: srv*c:symbols*//msdl.microsoft.com/download/symbols;c:localsymbols
DBGHELP: Symbol Search Path: srv*c:symbols*//msdl.microsoft.com/download/symbols;c:localsymbols
Symbol search path is: srv*c:symbols*//msdl.microsoft.com/download/symbols;c:localsymbols
Expanded Symbol search path is: srv*c:symbols*//msdl.microsoft.com/download/symbols;c:localsymbols
0:041> .reload /f myapplication.exe
SYMSRV: c:symbolsmyapplication.pdb38266E74B06B4EF3BCC16713A4A1E5E82myapplication.pdb not found
SYMSRV: //msdl.microsoft.com/download/symbols/myapplication.pdb/38266E74B06B4EF3BCC16713A4A1E5E82/myapplication.pdb not found
DBGHELP: c:localsymbolsmyapplication.pdb – mismatched pdb
DBGHELP: c:localsymbolsexemyapplication.pdb – file not found
DBGHELP: c:localsymbolssymbolsexemyapplication.pdb – file not foundDBGHELP: Couldn’t load mismatched pdb for myapplication.exe
*** ERROR: Module load completed but symbols could not be loaded for myapplication.exeDBGHELP: myapplication – no symbols loaded
Now we are into another problem. Windbg detected the symbol file but it says that the symbol file is not matching with the exe file. Let’s see how to fix this in the next section.
Symbol file not matching
If you see this issue, you need to crosscheck with your build numbers and pick up the right pdb file. If you are sure that the pdb file you are using is the right one, but still seeing this message, then you can use /i switch to load the symbols even if there is no match.
0:041> .reload /i myapplication.exe
SYMSRV: c:symbolsmyapplication.pdb38266E74B06B4EF3BCC16713A4A1E5E82myapplication.pdb not found
SYMSRV: //msdl.microsoft.com/download/symbols/myapplication.pdb/38266E74B06B4EF3BCC16713A4A1E5E82/myapplication.pdb not found
DBGHELP: c:localsymbolsmyapplication.pdb – mismatched pdb
DBGHELP: c:localsymbolsexemyapplication.pdb – file not found
DBGHELP: c:localsymbolssymbolsexemyapplication.pdb – file not foundDBGHELP: Loaded mismatched pdb for myapplication.exe
DBGENG: myapplication.exe has mismatched symbols – type “.hh dbgerr003” for details
DBGHELP: myapplication – private symbols & lines
c:localsymbolsmyapplication.pdb – unmatched
As you can see it looks for a matching pdb in all the search paths. As it does not find any, it loads the mismatched pdb in the end.
I hope this post has helped you in understanding how symbols loading works in Windbg. If something is not clear to you, or if you have any other questions, please share it in the comments below.
Relevant posts:
Windbg commands reference
Download Windbg
- 1 Intro
- 2 Documentation
- 3 Symbol Servers and Store
- 4 Specifying The Symbol Path Syntax
- 5 Viewing The Symbol Path
- 6 Local Symbols
- 7 Debug Issues Loading Symbols
- 7.1 Forcing Symbol Reload
Intro
The Windows Debugger (WinDbg) can be used to debug kernel-mode and user-mode code, analyze crash dumps, and examine the CPU registers while the code executes.
This article shows you how to set the path to a symbol server that can be used to get proper names for objects and methods.
Documentation
-
Symbol Stores and Symbol Servers
-
Microsoft public symbol server
-
Symbol path for Windows debuggers — This Microsoft article goes into detail about the syntax used for specifying symbol servers and local caches.
Symbol Servers and Store
In order to have meaningful names shown in the stack traces, you will need to find the debugging symbols for the application. Public symbol servers are maintained by most appliction developers.
-
Microsoft public symbol server:
https://msdl.microsoft.com/download/symbols
Specifying The Symbol Path Syntax
You can specify the local cache for the symbol server as follows
srv*c:\symbols\microsoft\*https://msdl.microsoft.com/download/symbols
The local directory c:\symbols\microsoft will be used for storing the symbol cache for the Microsoft symbols.
You can add multiple servers by separating them with a semicolon. For example, to add the Chrome symbols
srv*c:\symbols\chrome*https://chromium-browser-symsrv.commondatastorage.googleapis.com
More information on debugging Chrome can be found here: https://sites.google.com/a/chromium.org/dev/chromium-os/packages/crash-reporting/debugging-a-minidump
Viewing The Symbol Path
0:000> .sympath

Symbol search path is: srv*c:\symbols\microsoft\*https://msdl.microsoft.com/download/symbols

Expanded Symbol search path is: srv*c:\symbols\microsoft\*https://msdl.microsoft.com/download/symbols


************* Path validation summary **************

Response                         Time (ms)     Location

Deferred                                       srv*c:\symbols\microsoft\*https://msdl.microsoft.com/download/symbols
Local Symbols
Note that WinDbg will not search all subdirectories of the specified parent local directories when looking for symbols. It only looks in 3 locations as specified here: Symbol path syntax
For each directory in the symbol path, the debugger looks in three directories. For example, if the symbol path includes the c:\MyDir directory, and the debugger is looking for symbol information for a DLL, the debugger first looks in c:\MyDir\symbols\dll, then in c:\MyDir\dll, and finally in c:\MyDir. The debugger then repeats this process for each directory in the symbol path. Finally, the debugger looks in the current directory and then in the current directory with ..\dll appended to it. (The debugger appends ..\dll , ..\exe , or ..\sys , depending on which binaries it is debugging.)
You can copy all PDB files scattered through multiple subdirectories into one directory by using this command
(Get-ChildItem -Path <source> -Filter *.pdb -Recurse -File).FullName | ForEach-Object { Copy-Item -Path $_ -Destination <dest> }
Verify Symbols are correctly loaded for your module: lmDvm <module name>
Debug Issues Loading Symbols
Use !sym noisy to turn on verbose logging for symbol loading. To turn if off, use !sym quiet
More info: Verifying Symbols
Forcing Symbol Reload
By default, symbols are not loaded until needed (ie lazy loading). I find it convenient to keep a local cache of the symbols so I use this command .reload /f to force the symbol download to my local cache. This may take some time.
-
You can see the symbols get downloaded to your local cache as specified in the symbol path.
You can specify a separate cache for each server. For example, I added the Chrome symbols to a different directory
Before you can properly debug crash and memory dumps in Windows (Windows 11, Windows 10, Windows Server), you need to install WinDbg -Windows Debugger- and its debugging symbols. In this article I explain how to set up these debugging symbols for WinDbg in Windows.
Assuming you’ve already installed WinDbg through the Windows SDK sdksetup.exe program, the steps to configure Windows debugging symbols in WinDbg are pretty easy and straightforward:
- Start WinDbg
- Click File
- Click Symbol File Path (shortcode Ctrl+S)

- Fill in a new Symbol Path: SRV*D:\SymCache*http://msdl.microsoft.com/download/symbols
- Click OK
- Click Save Workspace in the File menu
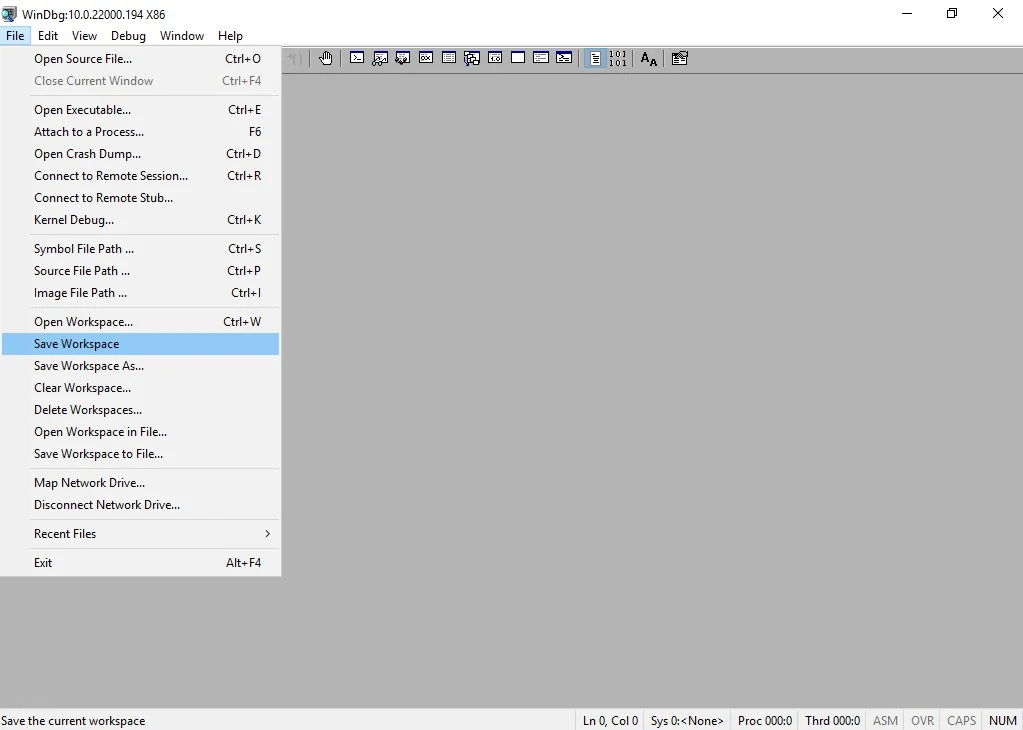
The path D:\SymCache is specific to my environment. If the target folder of your choosing doesn’t yet exist, it’ll be created.
All done, now you can debug BSOD like a boss.
Want to dive into fundamental concepts that are important for understanding debugging and troubleshooting complex issues on Windows? Then check out this GitHub repo by «DebugPrivilege»: https://github.com/DebugPrivilege/InsightEngineering. Each section goes beyond just the theory aspects, emphasizing practical examples using tools like Visual Studio, Process Explorer, and WinDbg.
Set symbol path
Symbol path environment variable using
When WinDbg starts, according to_NT_ALT_SYMBOL_PATH and _NT_SYMBOL_PATHThe value symbol path:
> set _NT_ALT_SYMBOL_PATH="D:\symbols"
> windbg notepad.exe
Start symbol path using parameters
You can use options-ySpecified symbol path:
> windbg -y "E:\symbols" notepad.exeSet and view the symbol path in WinDbg command line
Check the symbol path:
0:000> .sympathSet the symbol path:
0:000> .sympath D:\symbolsAdditional symbol path:
0:000> .sympath+ G:\work\symbolsSet Microsoft public symbol repository:
0:000> .symfixAdditional Microsoft public symbol repository:
0:000> .symfix+pass cache*Set the cache:
0:000> .sympath cache*d:\symbols;G:\work\symbolsSet the symbol server, the basic syntax is:SRV*[cache*]toppath,in SRVIt indicates that this is a symbol server path,[cache*]To set path to store the downloaded from the server symbol file. The following example is provided Microsoft public symbol server path, and the downloaded files are stored in the symbolD:\symbols Under contents.
0:000> .sympath SRV*D:\symbols*http://msdl.microsoft.com/download/symbolsView loaded modules and symbol files
pass lmView module and symbol files have been loaded:
0:000> lm
start    end        module name
013a0000 013de000   notepad    (deferred)
...
77160000 772e3000   ntdll      (export symbols)       C:\WINDOWS\SYSTEM32\ntdll.dll
pass lmiView module header information:
0:000> !lmi ntdll.dll
Loaded Module Info: [ntdll.dll]
         Module: ntdll
   Base Address: 77160000
     Image Name: ntdll.dll
   Machine Type: 332 (I386)
     Time Stamp: 58256ca0 Fri Nov 11 15:00:48 2016
           Size: 183000
       CheckSum: 1883ce
Characteristics: 2102
Debug Data Dirs: Type  Size     VA  Pointer
             CODEVIEW    23, 1f9ec,   1edec RSDS - GUID:
Reload symbol
pass .reloadReload symbol. Note that this command does not actually reload symbol, but only the loaded module symbol information clear, in the specific implementation of the command needs to resolve the symbol, really loaded symbols.
0:000> .reloadReload a module:
0:000> .reload combase.dllReload a module, and force analysis:
0:000> .reload /f combase.dllpass !sym noisyOpen execution.reloadDetails of when the series of commands:
0:000> !sym noisypass !sym quietClosed execution.reloadDetails of when the series of commands:
0:000> !sym quietVerify sign
pass !chksymTo verify the symbol file matches the image file:
0:000> !chksym bcrypt

C:\WINDOWS\SysWOW64\bcrypt.dll
    Timestamp: 584A7C20
  SizeOfImage: 1B000
          pdb: bcrypt.pdb
      pdb sig: BEFD22F9-21C0-4067-B22B-B4CC1E8ED238
          age: 1

Loaded pdb is d:\symbols\bcrypt.pdb\BEFD22F921C04067B22BB4CC1E8ED2381\bcrypt.pdb

bcrypt.pdb
      pdb sig: BEFD22F9-21C0-4067-B22B-B4CC1E8ED238
          age: 1

MATCH: bcrypt.pdb and C:\WINDOWS\SysWOW64\bcrypt.dll
View Symbol
pass xCommand to view the symbol, the syntax is:x [options] module!symbols. in module and symbolsIt can include wildcards.
exist notepadModule FindsThread symbol:
0:000> x notepad!*Thread*pass lnIt lists the symbols associated with a particular address:
0:000> ln 013bf344
(013bf344)   notepad!_imp__CoCreateFreeThreadedMarshaler   |  (013bf348)   notepad!_imp__CoWaitForMultipleHandles
Exact matches:
notepad!_imp__CoCreateFreeThreadedMarshaler = <no type information>В момент критического сбоя операционная система Windows прерывает работу и показывает синий экран смерти (BSOD). Содержимое оперативной памяти и вся информация о возникшей ошибке записывается в файл подкачки. При следующей загрузке Windows создается аварийный дамп c отладочной информацией на основе сохраненных данных. В системном журнале событий создается запись о критической ошибке.
Внимание! Аварийный дамп не создается, если отказала дисковая подсистема или критическая ошибка возникла на начальной стадии загрузки Windows.
Содержание:
- Типы аварийных дампов памяти Windows
- Как включить создание дампа памяти в Windows?
- Установка WinDBG в Windows
- Настройка ассоциации .dmp файлов с WinDBG
- Настройка сервера отладочных символов в WinDBG
- Анализ аварийного дампа памяти в WinDBG
Типы аварийных дампов памяти Windows
На примере актуальной операционной системы Windows 10 (Windows Server 2016) рассмотрим основные типы дампов памяти, которые может создавать система:
- Мини дамп памяти (Small memory dump) (256 КБ). Этот тип файла включает минимальный объем информации. Он содержит только сообщение об ошибке BSOD, информацию о драйверах, процессах, которые были активны в момент сбоя, а также какой процесс или поток ядра вызвал сбой.
- Дамп памяти ядра (Kernel memory dump). Как правило, небольшой по размеру — одна треть объема физической памяти. Дамп памяти ядра является более подробным, чем мини дамп. Он содержит информацию о драйверах и программах в режиме ядра, включает память, выделенную ядру Windows и аппаратному уровню абстракции (HAL), а также память, выделенную драйверам и другим программам в режиме ядра.
- Полный дамп памяти (Complete memory dump). Самый большой по объему и требует памяти, равной оперативной памяти вашей системы плюс 1MB, необходимый Windows для создания этого файла.
- Автоматический дамп памяти (Automatic memory dump). Соответствует дампу памяти ядра с точки зрения информации. Отличается только тем, сколько места он использует для создания файла дампа. Этот тип файлов не существовал в Windows 7. Он был добавлен в Windows 8.
- Активный дамп памяти (Active memory dump). Этот тип отсеивает элементы, которые не могут определить причину сбоя системы. Это было добавлено в Windows 10 и особенно полезно, если вы используете виртуальную машину, или если ваша система является хостом Hyper-V.
Как включить создание дампа памяти в Windows?
С помощью Win+Pause откройте окно с параметрами системы, выберите «Дополнительные параметры системы» (Advanced system settings). Во вкладке «Дополнительно» (Advanced), раздел «Загрузка и восстановление» (Startup and Recovery) нажмите кнопку «Параметры» (Settings). В открывшемся окне настройте действия при отказе системы. Поставьте галку в чек-боксе «Записать события в системный журнал» (Write an event to the system log), выберите тип дампа, который должен создаваться при сбое системы. Если в чек-боксе «Заменять существующий файл дампа» (Overwrite any existing file) поставить галку, то файл будет перезаписываться при каждом сбое. Лучше эту галку снять, тогда у вас будет больше информации для анализа. Отключите также автоматическую перезагрузку системы (Automatically restart).
В большинстве случаев для анализа причины BSOD вам будет достаточно малого дампа памяти.
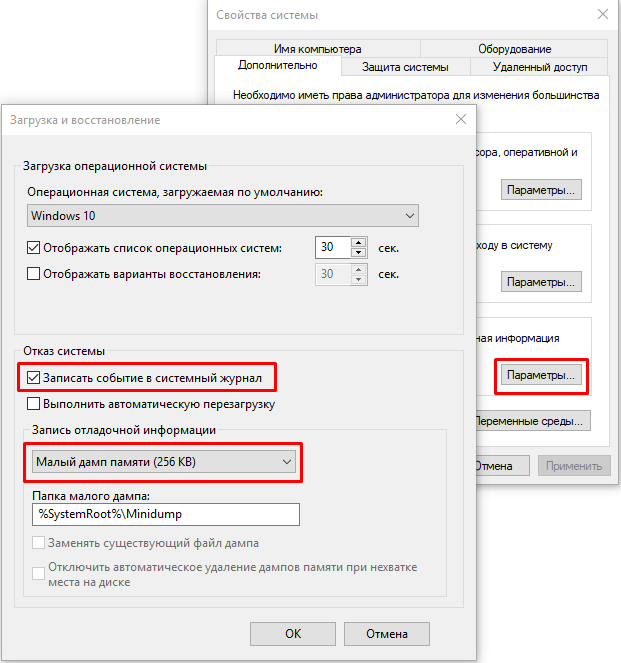
Теперь при возникновении BSOD вы сможете проанализировать файл дампа и найти причину сбоев. Мини дамп по умолчанию сохраняется в папке %systemroot%\minidump. Для анализа файла дампа рекомендую воспользоваться программой WinDBG (Microsoft Kernel Debugger).
Установка WinDBG в Windows
Утилита WinDBG входит в «Пакет SDK для Windows 10» (Windows 10 SDK). Скачать можно здесь.
Файл называется winsdksetup.exe, размер 1,3 МБ.
WinDBG для Windows7 и более ранних систем включен в состав пакета «Microsoft Windows SDK for Windows 7 and .NET Framework 4». Скачать можно здесь.
Запустите установку и выберите, что именно нужно сделать – установить пакет на этот компьютер или загрузить для установки на другие компьютеры. Установим пакет на локальный компьютер.
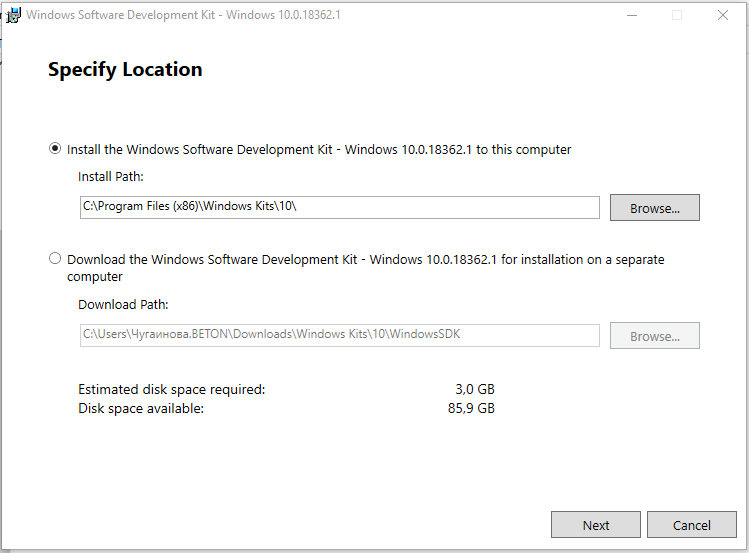
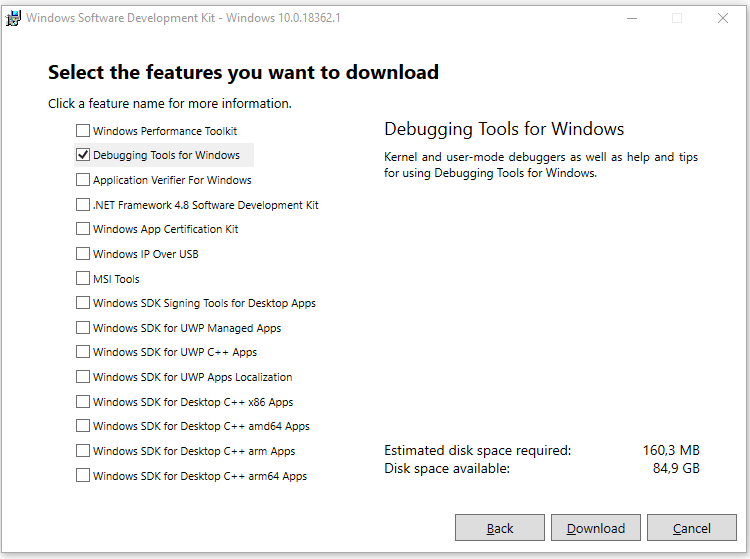
Можете установить весь пакет, но для установки только инструмента отладки выберите Debugging Tools for Windows.
После установки ярлыки WinDBG можно найти в стартовом меню.
Настройка ассоциации .dmp файлов с WinDBG
Для того, чтобы открывать файлы дампов простым кликом, сопоставьте расширение .dmp с утилитой WinDBG.
- Откройте командную строку от имени администратора и выполните команды для 64-разрядной системы:
cd C:\Program Files (x86)\Windows Kits\10\Debuggers\x64
windbg.exe –IA
для 32-разрядной системы:
C:\Program Files (x86)\Windows Kits\10\Debuggers\x86
windbg.exe –IA - В результате типы файлов: .DMP, .HDMP, .MDMP, .KDMP, .WEW – будут сопоставлены с WinDBG.
Настройка сервера отладочных символов в WinDBG
Отладочные символы (debug-символы или symbol files) – это блоки данных, генерируемые в процессе компиляции программы совместно с исполняемым файлом. В таких блоках данных содержится информация о именах переменных, вызываемых функциях, библиотеках и т.д. Эти данные не нужны при выполнении программы, но полезные при ее отладке. Компоненты Microsoft компилируются с символами, распространяемыми через Microsoft Symbol Server.
Настройте WinDBG на использование Microsoft Symbol Server:
- Откройте WinDBG;
- Перейдите в меню File –> Symbol File Path;
- Пропишите строку, содержащую URL для загрузки символов отладки с сайта Microsoft и папку для сохранения кэша:
SRV*E:\Sym_WinDBG*http://msdl.microsoft.com/download/symbols
В примере кэш загружается в папку E:\Sym_WinDBG, можете указать любую. - Не забывайте сохранить изменения в меню File –> Save WorkSpace;
WinDBG произведет поиск символов в локальной папке и, если не обнаружит в ней необходимых символов, то самостоятельно загрузит символы с указанного сайта. Если вы хотите добавить собственную папку с символами, то можно сделать это так:
SRV*E:\Sym_WinDBG*http://msdl.microsoft.com/download/symbols;c:\Symbols
Если подключение к интернету отсутствует, то загрузите предварительно пакет символов с ресурса Windows Symbol Packages.
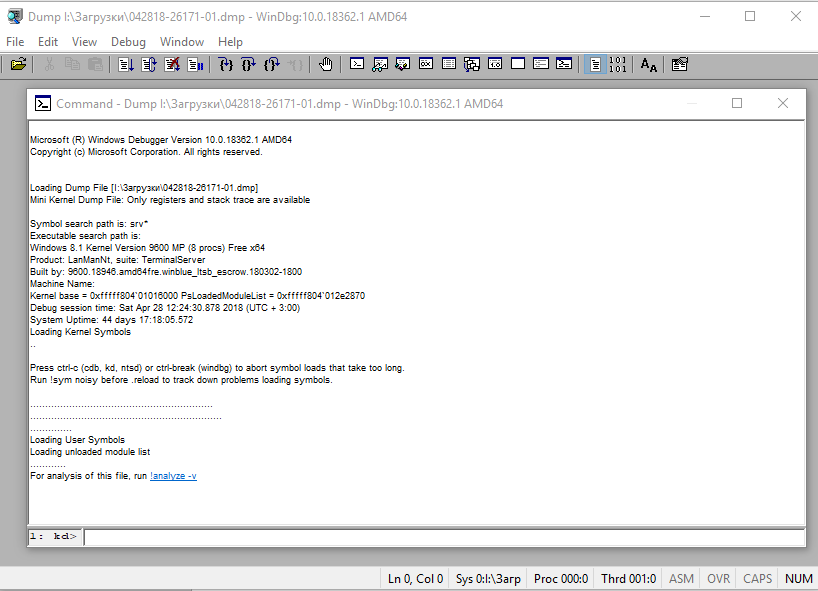
Анализ аварийного дампа памяти в WinDBG
Отладчик WinDBG открывает файл дампа и загружает необходимые символы для отладки из локальной папки или из интернета. Во время этого процесса вы не можете использовать WinDBG. Внизу окна (в командной строке отладчика) появляется надпись Debugee not connected.
Команды вводятся в командную строку, расположенную внизу окна.
Самое главное, на что нужно обратить внимание – это код ошибки, который всегда указывается в шестнадцатеричном значении и имеет вид 0xXXXXXXXX (указываются в одном из вариантов — STOP: 0x0000007B, 02.07.2019 0008F, 0x8F). В нашем примере код ошибки 0х139.
Полный справочник ошибок можно посмотреть здесь.
Отладчик предлагает выполнить команду !analyze -v, достаточно навести указатель мыши на ссылку и кликнуть. Для чего нужна эта команда?
- Она выполняет предварительный анализ дампа памяти и предоставляет подробную информацию для начала анализа.
- Эта команда отобразит STOP-код и символическое имя ошибки.
- Она показывает стек вызовов команд, которые привели к аварийному завершению.
- Кроме того, здесь отображаются неисправности IP-адреса, процессов и регистров.
- Команда может предоставить готовые рекомендации по решению проблемы.
Основные моменты, на которые вы должны обратить внимание при анализе после выполнения команды !analyze –v (листинг неполный).
1: kd>
!analyze -v
*****************************************************************************
* *
* Bugcheck Analysis *
* *
*****************************************************************************
Символическое имя STOP-ошибки (BugCheck)
KERNEL_SECURITY_CHECK_FAILURE (139)
Описание ошибки (Компонент ядра повредил критическую структуру данных. Это повреждение потенциально может позволить злоумышленнику получить контроль над этой машиной):
A kernel component has corrupted a critical data structure. The corruption could potentially allow a malicious user to gain control of this machine.
Аргументы ошибки:
Arguments:
Arg1: 0000000000000003, A LIST_ENTRY has been corrupted (i.e. double remove).
Arg2: ffffd0003a20d5d0, Address of the trap frame for the exception that caused the bugcheck
Arg3: ffffd0003a20d528, Address of the exception record for the exception that caused the bugcheck
Arg4: 0000000000000000, Reserved
Debugging Details:
------------------
Счетчик показывает сколько раз система упала с аналогичной ошибкой:
CUSTOMER_CRASH_COUNT: 1
Основная категория текущего сбоя:
DEFAULT_BUCKET_ID: FAIL_FAST_CORRUPT_LIST_ENTRY
Код STOP-ошибки в сокращенном формате:
BUGCHECK_STR: 0x139
Процесс, во время исполнения которого произошел сбой (не обязательно причина ошибки, просто в момент сбоя в памяти выполнялся этот процесс):
PROCESS_NAME: sqlservr.exe
CURRENT_IRQL: 2
Расшифровка кода ошибки: В этом приложении система обнаружила переполнение буфера стека, что может позволить злоумышленнику получить контроль над этим приложением.
ERROR_CODE: (NTSTATUS) 0xc0000409 - The system detected an overrun of a stack-based buffer in this application. This overrun could potentially allow a malicious user to gain control of this application.
EXCEPTION_CODE: (NTSTATUS) 0xc0000409 - The system detected an overrun of a stack-based buffer in this application. This overrun could potentially allow a malicious user to gain control of this application.
Последний вызов в стеке:
LAST_CONTROL_TRANSFER: from fffff8040117d6a9 to fffff8040116b0a0
Стек вызовов в момент сбоя:
STACK_TEXT:
ffffd000`3a20d2a8 fffff804`0117d6a9 : 00000000`00000139 00000000`00000003 ffffd000`3a20d5d0 ffffd000`3a20d528 : nt!KeBugCheckEx
ffffd000`3a20d2b0 fffff804`0117da50 : ffffe000`f3ab9080 ffffe000`fc37e001 ffffd000`3a20d5d0 fffff804`0116e2a2 : nt!KiBugCheckDispatch+0x69
ffffd000`3a20d3f0 fffff804`0117c150 : 00000000`00000000 00000000`00000000 00000000`00000000 00000000`00000000 : nt!KiFastFailDispatch+0xd0
ffffd000`3a20d5d0 fffff804`01199482 : ffffc000`701ba270 ffffc000`00000001 000000ea`73f68040 fffff804`000006f9 : nt!KiRaiseSecurityCheckFailure+0x3d0
ffffd000`3a20d760 fffff804`014a455d : 00000000`00000001 ffffd000`3a20d941 ffffe000`fcacb000 ffffd000`3a20d951 : nt! ?? ::FNODOBFM::`string'+0x17252
ffffd000`3a20d8c0 fffff804`013a34ac : 00000000`00000004 00000000`00000000 ffffd000`3a20d9d8 ffffe001`0a34c600 : nt!IopSynchronousServiceTail+0x379
ffffd000`3a20d990 fffff804`0117d313 : ffffffff`fffffffe 00000000`00000000 00000000`00000000 000000eb`a0cf1380 : nt!NtWriteFile+0x694
ffffd000`3a20da90 00007ffb`475307da : 00000000`00000000 00000000`00000000 00000000`00000000 00000000`00000000 : nt!KiSystemServiceCopyEnd+0x13
000000ee`f25ed2b8 00000000`00000000 : 00000000`00000000 00000000`00000000 00000000`00000000 00000000`00000000 : 0x00007ffb`475307da
Участок кода, где возникла ошибка:
FOLLOWUP_IP:
nt!KiFastFailDispatch+d0
fffff804`0117da50 c644242000 mov byte ptr [rsp+20h],0
FAULT_INSTR_CODE: 202444c6
SYMBOL_STACK_INDEX: 2
SYMBOL_NAME: nt!KiFastFailDispatch+d0
FOLLOWUP_NAME: MachineOwner
Имя модуля в таблице объектов ядра. Если анализатору удалось обнаружить проблемный драйвер, имя отображается в полях MODULE_NAME и IMAGE_NAME:
MODULE_NAME: nt
IMAGE_NAME: ntkrnlmp.exe
Если кликнете по ссылке модуля (nt), то увидите подробную информацию о пути и других свойствах модуля. Находите указанный файл, и изучаете его свойства.
1: kd>
lmvm nt
Browse full module list
Loaded symbol image file: ntkrnlmp.exe
Mapped memory image file: C:\ProgramData\dbg\sym\ntoskrnl.exe\5A9A2147787000\ntoskrnl.exe
Image path: ntkrnlmp.exe
Image name: ntkrnlmp.exe
InternalName: ntkrnlmp.exe
OriginalFilename: ntkrnlmp.exe
ProductVersion: 6.3.9600.18946
FileVersion: 6.3.9600.18946 (winblue_ltsb_escrow.180302-1800)
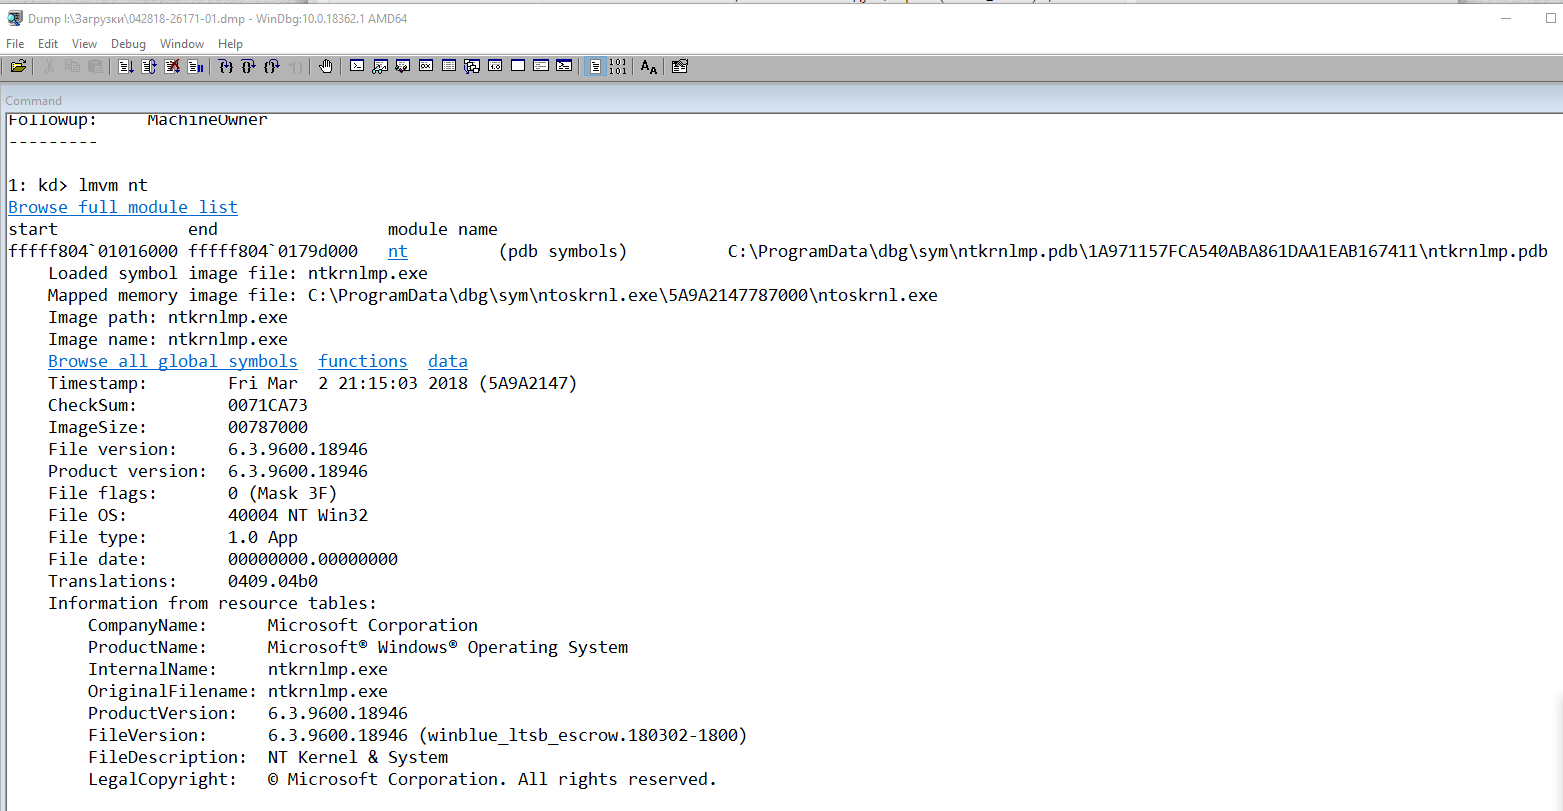
В приведенном примере анализ указал на файл ядра ntkrnlmp.exe. Когда анализ дампа памяти указывает на системный драйвер (например, win32k.sys) или файл ядра (как в нашем примере ntkrnlmp.exe), вероятнее всего данный файл не является причиной проблемы. Очень часто оказывается, что проблема кроется в драйвере устройства, настройках BIOS или в неисправности оборудования.
Если вы увидели, что BSOD возник из-за стороннего драйвера, его имя будет указано в значениях MODULE_NAME и IMAGE_NAME.
Например:
Image path: \SystemRoot\system32\drivers\cmudaxp.sys
Image name: cmudaxp.sys
Откройте свойсва файла драйвера и проверьте его версию. В большинстве случаев проблема с драйверами решается их обнвовлением.