
The usage share of an operating system is the percentage of computers running that operating system (OS). These statistics are estimates as wide scale OS usage data is difficult to obtain and measure. Reliable primary sources are limited and data collection methodology is not formally agreed. Currently devices connected to the internet allow for web data collection to approximately measure OS usage.
As of March 2025, Android, which uses the Linux kernel, is the world’s most popular operating system with 46% of the global market, followed by Windows with 25%, iOS with 18%, macOS with 6%, and other operating systems with 5% .[1] This is for all device types excluding embedded devices.
- For smartphones and other mobile devices, Android has 72% market share, and Apple’s iOS has 28%.[2]
- For desktop computers and laptops, Microsoft Windows has 71%, followed by Apple’s macOS at 16%, unknown operating systems at 8%, desktop Linux at 4%, then Google’s ChromeOS at 2%.[3][4]
- For tablets, Apple’s iPadOS (a variant of iOS) has 52% share and Android has 48% worldwide.[5]
- For the top 500 most powerful supercomputers, Linux distributions have had 100% of the marketshare since 2017.
- The global server operating system marketshare has Linux leading with a 62.7% marketshare, followed by Windows, Unix and other operating systems.[6]
Linux is also most used for web servers, and the most common Linux distribution is Ubuntu, followed by Debian. Linux has almost caught up with the second-most popular (desktop) OS, macOS, in some regions, such as in South America,[7] and in Asia it’s at 6.4% (7% with ChromeOS) vs 9.7% for macOS.[8] In the US, ChromeOS is third at 5.5%, followed by (desktop) Linux at 4.3%, but can arguably be combined into a single number 9.8%.[9][10]
The most numerous type of device with an operating system are embedded systems. Not all embedded systems have operating systems, instead running their application code on the «bare metal»; of those that do have operating systems, a high percentage are standalone or do not have a web browser, which makes their usage share difficult to measure. Some operating systems used in embedded systems are more widely used than some of those mentioned above; for example, modern Intel microprocessors contain an embedded management processor running a version of the Minix operating system.[11]
Worldwide device shipments
[edit]
|
|
This section needs to be updated. The reason given is: Some stats have not been updated in nearly a decade.. Please help update this article to reflect recent events or newly available information. (November 2024) |
According to Gartner, the following is the worldwide device shipments (referring to wholesale) by operating system, which includes smartphones, tablets, laptops and PCs together.
Worldwide device shipments by Operating System
| Source | Year | Android | iOS/macOS | Windows | Others |
|---|---|---|---|---|---|
| Gartner[13] | 2019 (2.161 bln) | ||||
| Gartner[14] | 2017 (2.278 bln) | ||||
| Gartner[15] | 2016 (2.332 bln) | 10.63% (248 mln) | 11.2% (260 mln) | ||
| Gartner[12] | 2015 (2.4 bln) | 54.16% (1.3 bln) | 12.37% (297 mln)
macOS = 1% |
11.79% (283 mln) | 21.66% |
| Gartner[16] | 2014 | 48.61% | 11.04% | 14.0% | 26.34% |
| Gartner[17] | 2013 | 38.51% | 10.12% | 13.98% | 37.41% |
| Gartner[18] | 2012 | 22.8% | 9.6% | 15.62% | 51.98% |
Shipments (to stores) do not necessarily translate to sales to consumers, therefore suggesting the numbers indicate popularity and/or usage could be misleading. Not only do smartphones sell in higher numbers than PCs, but also a lot more by dollar value, with the gap only projected to widen, to well over double.[19]
On 27 January 2016, Paul Thurrott summarized the operating system market, the day after Apple announced «one billion devices»:
Apple’s «active installed base» is now one billion devices. [..] Granted, some of those Apple devices were probably sold into the marketplace years ago. But that 1 billion figure can and should be compared to the numbers Microsoft touts for Windows 10 (200 million, most recently) or Windows more generally (1.5 billion active users, a number that hasn’t moved, magically, in years), and that Google touts for Android (over 1.4 billion, as of September).
My understanding of iOS is that the user base was previously thought to be around 800 million strong, and when you factor out Macs and other non-iOS Apple devices, that’s probably about right. But as you can see, there are three big personal computing platforms.— Paul Thurrott[20]
For 2015 (and earlier), Gartner reports for «the year, worldwide PC shipments declined for the fourth consecutive year, which started in 2012 with the launch of tablets» with an 8% decline in PC sales for 2015 (not including cumulative decline in sales over the previous years).[21]
Microsoft backed away from their goal of one billion Windows 10 devices in three years (or «by the middle of 2018»)[22] and reported on 26 September 2016 that Windows 10 was running on over 400 million devices,[23] and in March 2019 on more than 800 million.[24]
In May 2020, Gartner predicted further decline in all market segments for 2020 due to COVID-19, predicting a decline of 13.6% for all devices. while the «Work from Home Trend Saved PC Market from Collapse», with only a decline of 10.5% predicted for PCs. However, in the end, according to Gartner, PC shipments grew 10.7% in the fourth quarter of 2020 and reached 275 million units in 2020, a 4.8% increase from 2019 and the highest growth in ten years.» Apple in 4th place for PCs had the largest growth in shipments for a company in Q4 of 31.3%, while «the fourth quarter of 2020 was another remarkable period of growth for Chromebooks, with shipments increasing around 200% year over year to reach 11.7 million units. In 2020, Chromebook shipments increased over 80% to total nearly 30 million units, largely due to demand from the North American education market.» Chromebooks sold more (30 million) than Apple’s Macs worldwide (22.5 million) in pandemic year 2020.[25]
According to the Catalyst group, the year 2021 had record high PC shipments with total shipments of 341 million units (including Chromebooks), 15% higher than 2020 and 27% higher than 2019, while being the largest shipment total since 2012.[26]
According to Gartner, worldwide PC shipments declined by 16.2% in 2022, the largest annual decrease since the mid-1990s, due to geopolitical, economic, and supply chain challenges. [27]
Tablet computers shipments
[edit]
In 2015, eMarketer estimated at the beginning of the year that the tablet installed base would hit one billion[28] for the first time (with China’s use at 328 million, which Google Play doesn’t serve or track, and the United States’s use second at 156 million). At the end of the year, because of cheap tablets – not counted by all analysts – that goal was met (even excluding cumulative sales of previous years) as:
Sales quintupled to an expected 1 billion units worldwide this year, from 216 million units in 2014, according to projections from the Envisioneering Group.
While that number is far higher than the 200-plus million units globally projected by research firms IDC, Gartner and Forrester, Envisioneering analyst Richard Doherty says the rival estimates miss all the cheap Asian knockoff tablets that have been churning off assembly lines.[..]
Forrester says its definition of tablets «is relatively narrow» while IDC says it includes some tablets by Amazon — but not all.[..]
The top tech purchase of the year continued to be the smartphone, with an expected 1.5 billion sold worldwide, according to projections from researcher IDC. Last year saw some 1.2 billion sold.[..]
Computers didn’t fare as well, despite the introduction of Microsoft’s latest software upgrade, Windows 10, and the expected but not realized bump it would provide for consumers looking to skip the upgrade and just get a new computer instead.
Some 281 million PCs were expected to be sold, according to IDC, down from 308 million in 2014. Folks tend to be happy with the older computers and keep them for longer, as more of our daily computing activities have moved to the smartphone.[..]
While Windows 10 got good reviews from tech critics, only 11% of the 1-billion-plus Windows user base opted to do the upgrade, according to Microsoft. This suggests Microsoft has a ways to go before the software gets «hit» status. Apple’s new operating system El Capitan has been downloaded by 25% of Apple’s user base, according to Apple.
This conflicts with statistics from IDC that say the tablet market contracted by 10% in 2015 with only Huawei, ranked fifth, with big gains, more than doubling their share; for fourth quarter 2015, the five biggest vendors were the same except that Amazon Fire tablets ranked third worldwide, new on the list, enabled by its not quite tripling of market share to 7.9%, with its Fire OS Android-derivative.[30]
Global tablet shipments[a]
| Source | Year | Android | iOS | Windows | Others |
|---|---|---|---|---|---|
| Strategy Analytics[31] | Q2 2022 | 49% | 38% | 11% | 2% |
| Statista[32] | 2020 | 59.4% | 29.8% | 10.21% | 0.59% |
| Strategy Analytics[33] | 2015 | 68% | 22% | 10% | <0.1% |
| Gartner[34] | 2013 | 61.9% | 36.0% | 2.1% | <0.1% |
| Gartner[34] | 2012 | 45.8% | 52.8% | 1.0% | 0.3% |
Gartner excludes some devices from their tablet shipment statistic and includes them in a different category called «premium ultramobiles» with screen sizes of more than 10″ inches.[35]
Smartphone shipments
[edit]
There are more mobile phone owners than toothbrush owners,[36] with mobile phones the fastest growing technology in history.[citation needed] There are a billion more active mobile phones in the world than people (and many more than 10 billion sold so far with less than half still in use), explained by the fact that some people have more than one, such as an extra for work.[37] All the phones have an operating system, but only a fraction of them are smartphones with an OS capable of running modern applications. In 2018, 3.1 billion smartphones and tablets were in use across the world (with tablets, a small fraction of the total, generally running the same operating systems, Android or iOS, the latter being more popular on tablets. In 2019, a variant of iOS called iPadOS built for iPad tablets was released).
On 28 May 2015, Google announced that there were 1.4 billion Android users and 1 billion Google play users active during that month.[38][39] This changed to 2 billion monthly active users in May 2017.[40][41]
By late 2016, Android had been said to be «killing» Apple’s iOS market share (i.e. its declining sales of smartphones, not just relatively but also by number of units, when the whole market was increasing).[42] Gartner’s press release stated: «Apple continued its downward trend with a decline of 7.7 percent in the second quarter of 2016»,[43] which is their decline, based on absolute number of units, that underestimates the relative decline (with the market increasing), along with the misleading «1.7 percent [point]» decline. That point decline means an 11.6% relative decline (from 14.6% down to 12.9%).
Although by units sold Apple was declining in the late 2010s, the company was almost the only vendor making any profit in the smartphone sector from hardware sales alone. In Q3 2016 for example, they captured 103.6% of the market profits.[44]
In May 2019 the biggest smartphone companies (by market share) were Samsung, Huawei and Apple, respectively.[45]
In November 2024, a new competitor to Android and iOS emerged, when sales of the Huawei Mate 70 started with the all-new operating system HarmonyOS NEXT installed[46] on the flagship device. Future Huawei devices are to be sold mainly with this operating system, creating a third player on the market for smartphone operating systems.[47]
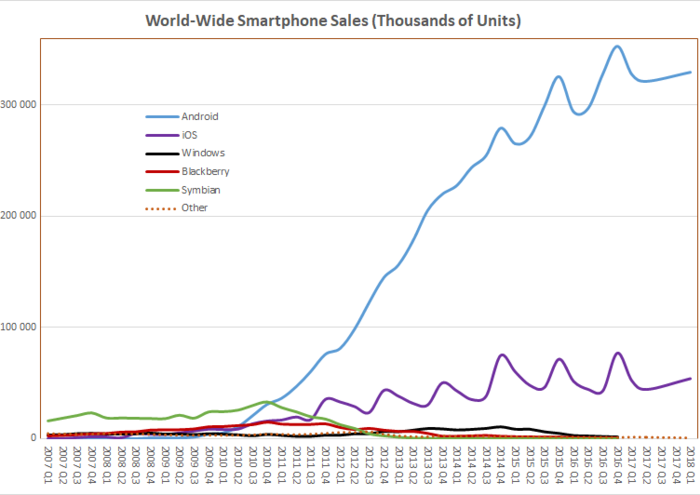
The following table shows worldwide smartphone sales to end users by operating systems, as measured by Gartner, International Data Corporation (IDG) and others:
Smartphone shipments by OS from 2017 (Windows and BlackBerry no longer measurable)
| Source | Method | Year/quarter | Android (including forks) |
HarmonyOS[48] | iOS | Others |
|---|---|---|---|---|---|---|
| Counterpoint[49] | Units sold per quarter | 2024 Q4 | 74% | 4% | 22% | 0% |
| Gartner[50] | Units sold in quarter | 2018 Q1 | 85.9% | — | 14.1% | 0.0% |
| Gartner[51] | Units sold per year | 2017 | 85.9% | — | 14.0% | 0.1% |
| Gartner[52] | Units sold in quarter | 2017 Q1 | 86.1% | — | 13.7% | 0.2% |
Smartphone shipments by OS until 2016
| Source | Method | Year/quarter | Android (including forks) |
BlackBerry (all versions) |
iOS | Symbian | Windows (all versions) |
Others |
|---|---|---|---|---|---|---|---|---|
| Gartner[53] | Units sold per year | 2016 | 84.8% | — | 14.4% | — | — | 0.8% |
| Gartner[54] | Units sold in quarter | 2016 Q4 | 81.7% | 0.0% | 17.9% | — | 0.3% | 0.1% |
| Gartner[55] | Units sold in quarter | 2016 Q3 | 87.8% | 0.1% | 11.5% | — | 0.4% | 0.2% |
| Gartner[56] | Units sold in quarter | 2016 Q2 | 86.2% | 0.1% | 12.9% | — | 0.6% | 0.2% |
| Gartner[57] | Units sold in quarter | 2016 Q1 | 84.1% | 0.2% | 14.8% | — | 0.7% | 0.2% |
| Gartner[58] | Units sold in quarter | 2015 Q4 | 80.7% | 0.2% | 17.7% | — | 1.1% | 0.2% |
| Gartner[59] | Units sold in quarter | 2015 Q2 | 82.2% | 0.3% | 14.6% | — | 2.5% | 0.4% |
| Gartner[60] | Units sold in quarter | 2014 Q4 | 76.0% | 0.5% | 20.4% | — | 2.8% | 0.4% |
| Strategy Analytics[61] | Units shipped in quarter | 2014 Q3 | 81.3% | 1.0% | 13.4% | — | 4.1% | 0.2% |
| Gartner[62] | Units sold in quarter | 2014 Q2 | 83.8% | 0.7% | 12.2% | — | 2.8% | 0.5% |
| Gartner[63] | Units sold in quarter | 2013 Q2 | 79.0% | 2.7% | 14.2% | 0.3% | 3.3% | 0.6% |
| Gartner[64] | Units sold in quarter | 2013 Q1 | 74.4% | 3.0% | 18.2% | 0.6% | 2.9% | 1.0% |
| International Data Corporation[65] | Units shipped in quarter | 2013 Q1 | 75.0% | 2.9% | 17.3% | 0.6% | 3.2% | 0.0% |
|
|
This section needs to be updated. Please help update this article to reflect recent events or newly available information. |
| Web clients’ OS family statistics | ||
|---|---|---|
| Android | 45.49% | |
| Windows | 25.35% | |
| iOS | 18.26% | |
| macOS | 5.67% | |
| Unknown | 2.97% | |
| Linux | 1.38% | |
| Web clients’ OS family market share according to StatCounter for February 2025.[66] The information on web clients is obtained from user agent information obtained through JavaScript code run by web browsers supplied to web servers. «Unknown» is probably mostly Windows operating systems.[citation needed] These figures have a large margin of error for a variety of reasons. For a discussion on the shortcomings see usage share of web browsers. |
Data from various sources published over the 2021/2022 period is summarized in the table below. All of these sources monitor a substantial number of websites, any statistics that relate to only one web site have been excluded.
Android currently ranks highest,[67] above Windows (incl. Xbox console) systems. Windows Phone accounted for 0.51% of the web usage, before it was discontinued.[68]
Considering all personal computers, Microsoft Windows is well below 50% usage share on every continent, and at 30% in the US (24% single-day low) and in many countries lower, e.g. China, and in India at 19% (12% some days) and Windows’ lowest share globally was 29% in May 2022 (25% some days), and 29% in the US.[69]
For a short time, iOS was slightly more popular than Windows in the US, but this is no longer the case. Worldwide, Android holds 45.49%, more than Windows at 25.35%, and iOS third at 18.26%.
In Africa, Android is at 66.07%, Windows is 13.46 (and iOS third at 10.24%).[70]
Before iOS became the most popular operating system in any independent country, it was most popular in Guam, an unincorporated territory of the United States, for four consecutive quarters in 2017–18,[71][72] although Android is now the most popular there.[73] iOS has been the highest ranked OS in Jersey (a British Crown dependency in Europe) for years, by a wide margin, and iOS was also highest ranked in Falkland Islands, a British Overseas Territory, for one quarter in 2019, before being overtaken by Android in the following quarter.[74][75] iOS is competitive with Windows in Sweden, where some days it is more used.[76]
The designation of an «Unknown» operating system is strangely high in a few countries such as Madagascar where it was at 32.44% (no longer near as high).[77] This may be due to the fact that StatCounter uses browser detection to get OS statistics, and there the most common browsers are not often used. The version breakdown for browsers in Madagascar shows «Other» at 34.9%,[78] and Opera Mini 4.4 is the most popular known browser at 22.1% (plus e.g. 3.34% for Opera 7.6). However browser statistics without version-breakdown has Opera at 48.11% with the «Other» category very small.[79][clarification needed]
In China, Android became the highest ranked operating system in July 2016 (Windows has occasionally topped it since then, while since April 2016 it or all non-mobile operating systems haven’t outranked mobile operating systems, meaning Android plus iOS).[80] In the Asian continent as a whole, Android has been ranked highest since February 2016 and Android alone has the majority share,[81] because of a large majority in all the most populous countries of the continent, up to 84% in Bangladesh, where it has had over 70% share for over four years.[82] Since August 2015, Android is ranked first, at 48.36% in May 2016, in the African continent – when it took a big jump ahead of Windows 7,[83] and thereby Africa joined Asia as a mobile-majority continent. China is no longer a desktop-majority country,[84] joining India, which has a mobile-majority of 71%, confirming Asia’s significant mobile-majority.
Online usage of Linux kernel derivatives (Android + ChromeOS + other Linux) exceeds that of Windows. This has been true since some time between January and April 2016, according to W3Counter[85] and StatCounter.[86]
However, even before that, the figure for all Unix-like OSes, including those from Apple, was higher than that for Windows.
| Source | Date | Microsoft Windows (kernel): | Apple Darwin: |
Linux kernel: | Others:[b] | |||||||||
|---|---|---|---|---|---|---|---|---|---|---|---|---|---|---|
| 10 | 8/8.1 | 7 | Vista | XP | WP&RT | Other | macOS | iOS | Linux | Android | Other | |||
| W3Counter[87] | Feb 2025 | 20.95% | 4.45% | 11.71% | 2.56% | 43.09% | — | |||||||
| W3Counter[88] | Oct 2022 | 19.23% | — | 3.4% | — | — | — | — | 4.03% | 19.23% | — | 45.18% | — | — |
| W3Counter[89] | Oct
2020 |
20.55% |
— |
6.74% |
— | — | — | — |
8.06% |
13.67% |
— |
37.44% |
— | — |
| W3Counter[90] | Jun 2019 | 16.23% | N/A | 14.32% | N/A | N/A | N/A | N/A | 3.58% | 13.54 | N/A | 38.76% | N/A | N/A |
| W3Counter[90] | Jun 2018 | 11.14 | N/A | 12.29% | N/A | N/A | N/A | N/A | 2.80% | 10.68% | N/A | 53.21% | — | N/A |
| W3Counter[91] | Dec 2016 | 13.79 | 4.54% | 18.45% | N/A | N/A | — | N/A | 4.45% | 12.60% | 3.8% | 34.37% | — | 8% |
| StatCounter Global Stats[92] | Mar 2017 | 12.98% | 4.57% | 17.84% | 0.41% | 2.07% | 0% | 0.06% | 5.17% | 13.09% | 0.75% | 37.93% | 0.76% | 7.21% |
| StatCounter Global Stats[92] | Dec 2016 | 12.5% | 4.79% | 18% | 0.46% | 2.24% | 0.64% | 0.09% | 4.92% | 12.71% | 0.86% | 37.8% | 0.72% | 4.61% |
| StatCounter Global Stats[93] | Oct 2016 | 12.08% | 5.21% | 18.97% | 0.6% | 2.44% | 0.7% | 0.05% | 5.3% | 12.04% | 0.85% | 34.46% | 0.63% | 6.67% |
| StatCounter Global Stats[94] | May 2016 | 10.27% | 6.68% | 22.25% | 0.73% | 3.44% | 0.83% | 0.8% | 5.05% | 11.38% | 0.91% | 31.6% | 0.64% | 6.15% |
| StatCounter Global Stats[94] | Dec 2015 | 6.67% | 8.5% | 26.66% | 1.0% | 4.75% | 0.92% | 0.2% | 5.51% | 10.82% | 1.03% | 27.01% | 0.36% | 6.57% |
| Wikimedia[95] | Dec 2016 | 14.0% | 4.65% | 18.0% | 0.43% | 1.70% | 0.93% | 0.50% | 5.4% | 19.0% | 0.80% | 23.0% | 0.30% | 11.29% |
Desktop and laptop computers
[edit]
|
|
This section needs to be updated. Please help update this article to reflect recent events or newly available information. |
Windows is still the dominant desktop OS, but the dominance varies by region and it has gradually lost market share to other desktop operating systems (not just to mobile) with the slide very noticeable in the US, where macOS usage has more than quadrupled from Jan. 2009 to Dec. 2020 to 30.62% (i.e. in Christmas month; and 34.72% in April 2020 in the middle of COVID-19, and iOS was more popular overall that year;[97] globally Windows lost to Android that year,[98] as for the two years prior), with Windows down to 61.136% and ChromeOS at 5.46%, plus traditional Linux at 1.73%.[99]
There is little openly published information on the device shipments of desktop and laptop computers. Gartner publishes estimates, but the way the estimates are calculated is not openly published. Another source of market share of various operating systems is StatCounter[100] basing its estimate on web use (although this may not be very accurate). Also, sales may overstate usage. Most computers are sold with a pre-installed operating system, with some users replacing that OS with a different one due to personal preference, or installing another OS alongside it and using both. Conversely, sales underestimate usage by not counting unauthorized copies. For example, in 2009, approximately 80% of software sold in China consisted of illegitimate copies.[101] In 2007, the statistics from an automated update of IE7 for registered Windows computers differed with the observed web browser share, leading one writer to estimate that 25–35% of all Windows XP installations were unlicensed.[102]
The usage share of Microsoft’s (then latest operating system version) Windows 10 has slowly increased since July/August 2016, reaching around 27.15% (of all Windows versions, not all desktop or all operating systems) in December 2016. It eventually reached 79.79% on 5 October 2021, the same day on which its successor Windows 11 was released. In the United States, usage of Windows XP has dropped to 0.38% (of all Windows versions), and its global average to 0.59%, while in Africa it is still at 2.71%, and in Armenia it is more than 70%, as of 2017.[103]
StatCounter web usage data of desktop or laptop operating systems varies significantly by country. For example, in 2017, macOS usage in North America was at 16.82%[104] (17.52% in the US[105]) whereas in Asia it was only 4.4%.[106] As of July 2023, macOS usage has increased to 30.81% in North America[107] (31.77% in the US)[108] and to 9.64% in Asia.[109]
Since mid-2020, the world uses smartphones more than desktop (including laptop) computers.[110][111][112] For global statistics it’s every day of the week. It has also happened for all individual continents[113][114][115] (at least for some weeks, and also for the United States where the smartphone share reached 54.26% in July 2022,[116][117][118][119] and also that high in 2021). The proportions do vary widely by region (more so than by the day), e.g. in Africa the smartphone share is highest at 72%, in Asia at 69% and in South America at 60%, in Europe is 49% while desktop is slightly lower, and in the United States it’s at 43% and desktop at 54% (previously at 50%). On some continents, e.g. North America and the US, smartphone use may only go over 50% on weekends, since smartphones usage increases on weekends,[120][121][122][123] while the smartphone share has gone up to 54% for a single day (Thanksgiving), and on average over 50% for full week.[124][125]
- Smartphones (58.01%)
- Desktops/Laptops (39.49%)
- Tablets (2.46%)
- Console (0.06%)
The 2023 Stack Overflow developer survey counts 87,222 survey responses. However, usage of a particular system as a desktop or as a server was not differentiated in the survey responses. The operating system share among those identifying as professional developers was:[126]
- Windows: 46.91%
- macOS: 33%
- Ubuntu: 26.69%
- BSD: 0.59%
Microsoft data on Windows usage
In June 2016, Microsoft claimed Windows 10 had half the market share of all Windows installations in the US and UK, as quoted by BetaNews:
Microsoft’s Windows trends page [shows] Windows 10 hit 50 percent in the US (51 percent in the UK, 39 percent globally), while … Windows 7 was on 38 percent (36 percent in the UK, 46 percent globally).
A big reason for the difference in numbers comes down to how they are recorded. … actual OS usage (based on web browsing), while Microsoft records the number of devices Windows 10 is installed on. … Microsoft also only records Windows 7, Windows 8, Windows 8.1 and Windows 10, while NetMarketShare includes both XP and Vista.— BetaNews[127]
Desktop computer games
[edit]
The digital video game distribution platform Steam publishes a monthly «Hardware & Software Survey», with the statistics below:
| Month | Microsoft Windows | Mac OS | Linux | Other |
|---|---|---|---|---|
| December 2023[128] | 96.40% | 1.63% | 1.97% | |
| December 2022[129] | 96.15% | 2.48% | 1.38% | |
| December 2021 | 96.19% | 2.70% | 1.11% | |
| December 2020[129] | 96.41% | 2.82% | 0.78% | |
| December 2019[130] | 96.89% | 2.47% | 0.67% | |
| January 2019[131] | 95.92% | 3.27% | 0.82% | |
| January 2018[132] | 97.76% | 1.84% | 0.41% | |
| January 2017[133] | 95.79% | 3.31% | 0.80%† | |
| January 2016[134] | 95.39% | 3.55% | 0.95% | |
| January 2015[135] | 95.48% | 3.32% | 1.09% | |
| January 2014[136] | 94.93% | 3.47% | 0.86% | 0.74% |
^† These figures, as reported by Steam, do not include SteamOS statistics.[137]
Smartphones OS by usage
[edit]
By Q1 2018, mobile operating systems on smartphones included Google’s dominant Android (and variants) and Apple’s iOS which combined had an almost 100% market share.[138]
Smartphone penetration vs. desktop use differs substantially by country. Some countries, like Russia, still have smartphone use as low as 22.35% (as a fraction of all web use),[139] but in most western countries, smartphone use is close to 50% of all web use. This doesn’t mean that only half of the population has a smartphone, could mean almost all have, just that other platforms have about equal use. Smartphone usage share in developing countries is much higher – in Bangladesh, for example, Android smartphones had up to 84% and currently 70% share,[82] and in Mali smartphones had over 90% (up to 95%) share for almost two years.[140][141] (A section below has more information on regional trends on the move to smartphones.)
There is a clear correlation between the GDP per capita of a country and that country’s respective smartphone OS market share, with users in the richest countries being much more likely to choose Apple’s iPhone, with Google’s Android being predominant elsewhere.[142][143][144]
Global mobile OS web usage[c]
| Source | Method | Quarter/month | Android (including forks) |
iOS | Windows (all versions) |
BlackBerry (all versions) |
Symbian | Others |
|---|---|---|---|---|---|---|---|---|
| Statista[145] | based on page views per month worldwide | 2022 Q4 | 71.1% | 28.3% | — | — | — | 0.6% |
| StatCounter Global Stats[146] | Browsing (page view) | 2021, Oct | 71.09% | 28.21% | 0.01% | — | — | 0.69% |
| StatCounter Global Stats[147] | Browsing (page view) | 2020, Oct | 72.93% | 26.53% | 0.03% | — | — | 0.51% |
| StatCounter Global Stats | Browsing (page view) | 2019, Sep | 76.24% | 22.48% | 0.17% | 0.02% | 0.02% | 1.07% |
| StatCounter Global Stats[148] | Browsing (page view) | 2015, Mar | 61.94% | 22.64% | 2.27% | NA | 6.00% | 7.09% |
| StatCounter Global Stats[148] | Browsing (page view) | 2014, Aug | 54.87% | 23.57% | 2.36% | 1.59% | 9.73% | 7.87% |
| StatCounter Global Stats[148] | Browsing (page view) | 2014, Feb | 47.57% | 22.97% | 2.22% | 2.62% | 14.86% | 6.08% |
| Wikimedia (includes tablets)[d] | Browsing (page view) | 2013, Mar | 25.93% | 66.53% | 1.85% | 2.02% | 3.03% | 1.12% |
United States mobile OS web usage
| Source | Method | Quarter/month | Android (including forks) |
iOS | Windows (all versions) |
BlackBerry (all versions) |
Symbian | Others |
|---|---|---|---|---|---|---|---|---|
| comScore[149] (US only) | US subscribers | 2017, Jan | 52.0% | 43.9% | 1.5% | 0.5% | — | — |
| comScore[150] (US only) | US subscribers | 2016, Jan | 52.8% | 43.6% | 2.7% | 0.8% | — | — |
| comScore[151] (US only) | US subscribers | 2015, Jan | 53.2% | 41.3% | 3.6% | 1.8% | 0.1% | N/A |
| comScore[152] (US only) | US subscribers | 2014, Jan | 51.7% | 41.6% | 3.2% | 3.1% | 0.2% | N/A |
| comScore[153] (US only) | US subscribers | 2012, Feb | 50.1% | 30.2% | 3.9% | 13.4% | 1.5% | — |
| comScore[154] (US only) | US subscribers | 2010, Dec | 28.7% | 25.0% | 8.4% | 31.6% | — | 3.7% |
Tablet computers OS by usage
[edit]
|
|
This section needs to be updated. Please help update this article to reflect recent events or newly available information. |
Tablet computers, or simply tablets, became a significant OS market share category starting with Apple’s iPad. In Q1 2018, iOS had 65.03% market share and Android had 34.58% market share.[155] Windows tablets may not get classified as such by some analysts, and thus barely register; e.g. 2-in-1 PCs may get classified as «desktops», not tablets.
Since 2016, in South America (and Cuba[156] in North America), Android tablets have gained majority,[157] and in Asia in 2017 Android was slightly more popular than the iPad, which was at 49.05% usage share in October 2015.[158][159][160] In Africa, Android tablets are much more popular while elsewhere the iPad has a safe margin.
As of March 2015, Android has made steady gains to becoming the most popular tablet operating system:[161] that is the trend in many countries, having already gained the majority in large countries (India at 63.25%,[162] and in Indonesia at 62.22%[163]) and in the African continent with Android at 62.22% (first to gain Android majority in late 2014),[164] with steady gains from 20.98% in August 2012[165] (Egypt at 62.37%,[166] Zimbabwe at 62.04%[166]), and South America at 51.09% in July 2015.[167] (Peru at 52.96%[168]). Asia is at 46%.[169] In Nepal, Android gained majority lead in November 2014 but lost it down to 41.35% with iOS at 56.51%.[170] In Taiwan, as of October 2016, Android after having gained a confident majority, has been on a losing streak.[171] China is a major exception to Android gaining market share in Asia (there Android phablets are much more popular than Android tablets, while similar devices get classified as smartphones) where the iPad/iOS is at 82.84% in March 2015.[172]
Global tablet web usage
| Source | Month | iOS/iPadOS | Android | Windows | Others |
|---|---|---|---|---|---|
| StatCounter[173] | Aug 2023 | 54.68% | 45.11% | 0.02% | 0.07% |
| StatCounter[174] | Oct 2020 | 58.86% | 41.02% | 0.08% | 0.04% |
| StatCounter[175] | Dec 2019 | 63.11% | 36.65% | 0.15% | 0.09% |
| StatCounter[176] | Jul 2018 | 65.03% | 34.58% | 0.21% | 0.18% |
| StatCounter[177] | Jul 2015 | 65.51% | 31.36% | 0.78% | 2.93% |
| StatCounter[178] | Feb 2015 | 66.47% | 29.6% | 1.16% | 2.73% |
| StatCounter[179] | Oct 2014 | 71.67% | 25.62% | 0.08% | 2.63% |
|
|
This section needs to be updated. Please help update this article to reflect recent events or newly available information. |
According to StatCounter web use statistics (a proxy for all use), smartphones are more popular than desktop computers globally (and Android in particular more popular than Windows). Including tablets with mobiles/smartphones, as they also run so-called mobile operating systems, even in the United States (and most countries) are mobiles including tablets more popular than other (older originally made for desktops) operating systems (such as Windows and macOS). Windows in the US (at 33.42%) has only 8% head-start (2.55-percentage points) over iOS only; with Android, that mobile operating system and iOS have 52.14% majority.[180] Alternatively, Apple, with iOS plus their non-mobile macOS (9.33%) has 20% more share (6.7-percentage points more) than Microsoft’s Windows in the country where both companies were built.
Although desktop computers are still popular in many countries (while overall down to 44.9% in the first quarter of 2017[181]), smartphones are more popular even in many developed countries. A few countries on all continents are desktop-minority with Android more popular than Windows; many, e.g. Poland in Europe, and about half of the countries in South America, and many in North America, e.g. Guatemala, Honduras, Haiti; up to most countries in Asia and Africa[182] with smartphone-majority because of Android, Poland and Turkey in Europe highest with 57.68% and 62.33%, respectively. In Ireland, smartphone use at 45.55% outnumbers desktop use and mobile as a whole gains majority when including the tablet share at 9.12%.[183][184] Spain was also slightly desktop-minority. As of July 2019, Sweden had been desktop-minority for eight weeks in a row.[185]
The range of measured mobile web use varies a lot by country, and a StatCounter press release recognizes «India amongst world leaders in use of mobile to surf the internet»[186] (of the big countries) where the share is around (or over) 80%[187] and desktop is at 19.56%, with Russia trailing with 17.8% mobile use (and desktop the rest).
Smartphones (discounting tablets), first gained majority in December 2016 (desktop-majority was lost the month before),[where?] and it wasn’t a Christmas-time fluke, as while close to majority after smartphone majority happened again in March 2017.[188][clarification needed]
In the week of 7–13 November 2016, smartphones alone (without tablets) overtook desktop for the first time, albeit for a short period.[189] Examples of mobile-majority countries include Paraguay in South America, Poland in Europe and Turkey and most of Asia and Africa. Some of the world is still desktop-majority, with for example the United States at 54.89% (but not on all days).[190] However, in some territories of the United States, such as Puerto Rico,[191] desktop is significantly under majority, with Windows just under 25%, overtaken by Android.
On 22 October 2016 (and subsequent weekends), mobile showed majority.[192] Since 27 October, the desktop hasn’t had a majority, including on weekdays. Smartphones alone have shown majority since 23 December to the end of the year, with the share topping at 58.22% on Christmas Day.[193] To the «mobile»-majority share of smartphones, tablets could be added giving a 63.22% majority. While an unusually high top, a similar high also occurred on Monday 17 April 2017, with the smartphone share slightly lower and tablet share slightly higher, combining to 62.88%.
Formerly, according to a StatCounter press release, the world has turned desktop-minority;[194] as of October 2016, at about 49% desktop use for that month, but mobile wasn’t ranked higher, tablet share had to be added to it to exceed desktop share.
For the Christmas season (i.e. temporarily, while desktop-minority remains and smartphone-majority on weekends[195][196]), the last two weeks in December 2016, Australia (and Oceania in general)[197] was desktop-minority for the first time for an extended period, i.e. every day from 23 December.[198]
In South America, smartphones alone took majority from desktops on Christmas Day,[196] but for a full-week-average, desktop is still at least at 58%.[199]
The UK desktop-minority dropped down to 44.02% on Christmas Day and for the eight days to the end of the year.[200] Ireland joined some other European countries with smartphone-majority, for three days after Christmas, topping that day at 55.39%.[201][202]
In the US, desktop-minority happened for three days on and around Christmas (while a longer four-day stretch happened in November, and happens frequently on weekends).[203]
According to StatCounter web use statistics (a proxy for all use), in the week from 7–13 November 2016, «mobile» (meaning smartphones) alone (without tablets) overtook desktop, for the first time, with them highest ranked at 52.13% (on 27 November 2016)[204] or up to 49.02% for a full week.[205][206] Mobile-majority applies to countries such as Paraguay in South America, Poland in Europe and Turkey; and the continents Asia and Africa. Large regions of the rest of the world are still desktop-majority, while on some days, the United States,[207] (and North America as a whole)[208] isn’t; the US is desktop-minority up to four days in a row,[209] and up to a five-day average.[210] Other examples, of desktop-minority on some days, include the UK,[208] Ireland,[211] Australia[212] (and Oceania as a whole); in fact, at least one country on every continent[213][214][215] has turned desktop-minority (for at least a month). On 22 October 2016 (and subsequent weekends), mobile has shown majority.[216]
Previously, according to a StatCounter press release, the world has turned desktop-minority;[217] as of October 2016, at about 49% desktop use for that month,[218][219] with desktop-minority stretching up to an 18-weeks/4-months period from 28 June to 31 October 2016,[220][221] while whole of July, August or September 2016, showed desktop-majority (and many other long sub-periods in the long stretch showed desktop-minority; similarly only Fridays, Saturdays and Sundays are desktop-minority). The biggest continents, Asia and Africa, have shown vast mobile-majority for long time (any day of the week), as well as several individual countries elsewhere have also turned mobile-majority: Poland, Albania (and Turkey)[222] in Europe and Paraguay and Bolivia[223] in South America.[224]
According to StatCounter’s web use statistics, Saturday 28 May 2016, was the day when smartphones («mobile» at StatCounter, that now counts tablets separately) became a most used platform, ranking first, at 47.27%, above desktops.[225][226] The next day, desktops slightly outnumbered «mobile» (unless counting tablets: some analysts count tablets with smartphones or separately while others with desktops – even when most tablets are iPad or Android, not Windows devices).[227]
Since Sunday 27 March 2016, the first day the world dipped to desktop-minority,[228] it has happened almost every week, and by week of 11–17 July 2016, the world was desktop-minority,[229] followed by the next week, and thereon also for a three-week period.[230] The trend is still stronger on weekends, with e.g. 17 July 2016 showed desktop at 44.67%, «mobile» at 49.5% plus tablets at 5.7%.[231] Recent weekly data shows a downward trend for desktops.[232][233]
According to StatCounter web use statistics (a proxy for overall use), on weekends desktops worldwide lose about 5 percent points, e.g. down to 51.46% on 15 August 2015, with the loss in (relative) web use going to mobile (and also a minuscule increase for tablets),[234] mostly because Windows 7, ranked 1st on workdays, declines in web use, with it shifting to Android and lesser degree to iOS.[235]
Two continents have already crossed over to mobile-majority (because of Android), based on StatCounters web use statistics. In June 2015, Asia became the first continent where mobile overtook desktop[236] (followed by Africa in August;[237] while Nigeria had mobile majority in October 2011,[238][239] because of Symbian – that later had 51% share, then Series 40 dominating, followed by Android as dominating operating system[240]) and as far back as October 2014, they had reported this trend on a large scale in a press release: «Mobile usage has already overtaken desktop in several countries including India, South Africa and Saudi Arabia».[241] In India, desktop went from majority, in July 2012, down to 32%.[242] In Bangladesh desktop went from majority, in May 2013, down to 17%, with Android alone now accounting for majority web use.[243] Only a few African countries were still desktop-majority[244] and many have a large mobile majority including Ethiopia and Kenya, where mobile usage is over 72%.[245]
The popularity of mobile use worldwide has been driven by the huge popularity increase of Android in Asian countries, where Android is the highest ranked operating system statistically in virtually every south-east Asian country,[246] while it also ranks most popular in almost every African country. Poland has been desktop-minority since April 2015,[247] because of Android being vastly more popular there,[248] and other European countries, such as Albania (and Turkey), have also crossed over. The South America continent is somewhat far from losing desktop-majority, but Paraguay had lost it as of March 2015.[249] Android and mobile browsing in general has also become hugely popular in all other continents where desktop has a large desktop base and the trend to mobile is not as clear as a fraction of the total web use.
While some analysts count tablets with desktops (as some of them run Windows), others count them with mobile phones (as the vast majority of tablets run so-called mobile operating systems, such as Android or iOS on the iPad). iPad has a clear lead globally, but has clearly lost the majority to Android in South America,[250] and a number of Eastern European countries such as Poland; lost virtually all African countries and has lost the majority twice in Asia, but gained the majority back (while many individual countries, e.g. India and most of the middle East have clear Android majority on tablets).[251] Android on tablets is thus second most popular after the iPad.[252]
In March 2015, for the first time in the US the number of mobile-only adult internet users exceeded the number of desktop-only internet users with 11.6% of the digital population only using mobile compared to 10.6% only using desktop; this also means the majority, 78%, use both desktop and mobile to access the internet.[253] A few smaller countries in North America, such as Haiti (because of Android) have gone mobile majority (mobile went to up to 72.35%, and is at 64.43% in February 2016).[254]
The region with the largest Android usage[67] also has the largest mobile revenue.[255]
Mobile app revenue (US$bn)
| 2020[256] | |
|---|---|
| Asia Pacific | $85.3B |
| North and South America | $74.5B |
| Europe, Middle East, and Africa | $29.1B |
Public servers on the Internet
[edit]
Internet based servers’ market share can be measured with statistical surveys of publicly accessible servers, such as web servers, mail servers[257] or DNS servers on the Internet: the operating systems powering such servers are found by inspecting raw response messages. This method gives insight only into market share of operating systems that are publicly accessible on the Internet.
There will be differences in the result depending on how the sample is done and observations weighted. Usually the surveys are not based on a random sample of all IP addresses, domain names, hosts or organisations, but on servers found by some other method.[citation needed] Additionally, many domains and IP addresses may be served by one host and some domains may be served by several hosts or by one host with several IP addresses.
| Source | Date | Unix, Unix-like | Microsoft Windows | References |
|---|---|---|---|---|
| W3Techs | 29 March 2025 | 88.8% | 11.4% | [258] |
| W3Techs | 14 July 2022 | 80.1% | 20.1% | [259][260] |
| Security Space | Feb 2014 | <79.3% | >20.7% | [261][262] |
|
- Note
- Revenue comparisons often include «operating system software, other bundled software»[264] and are not appropriate for usage comparison as the Linux operating system costs nothing (including «other bundled software»), except if optionally using commercial distributions such as Red Hat Enterprise Linux (in that case, cost of software for all software bundled with hardware has to be known for all operating systems involved, and subtracted). In cases where no-cost Linux is used, such comparisons underestimate Linux server popularity and overestimate other proprietary operating systems such as Unix and Windows.
Mainframes are larger and more powerful than most servers, but not supercomputers. They are used to process large sets of data, for example enterprise resource planning or credit card transactions.
The most common operating system for mainframes is IBM’s z/OS.[265][citation needed] Operating systems for IBM Z generation hardware include IBM’s proprietary z/OS,[266] Linux on IBM Z, z/TPF, z/VSE and z/VM.
Gartner reported on 23 December 2008 that Linux on System z was used on approximately 28% of the «customer z base» and that they expected this to increase to over 50% in the following five years.[267] Of Linux on IBM Z, Red Hat and Micro Focus compete to sell RHEL and SLES respectively:
- Prior to 2006, Novell claimed a market share of 85% or more for SUSE Linux Enterprise Server.
- Red Hat has since claimed 18.4% in 2007 and 37% in 2008.[268]
- Gartner reported at the end of 2008 that Novell’s SUSE Linux Enterprise Server had an 80% share of mainframe Linux.[267][dead link]
Like today’s trend of mobile devices from personal computers,[253] in 1984 for the first time estimated sales of desktop computers ($11.6 billion) exceeded mainframe computers ($11.4 billion). IBM received the vast majority of mainframe revenue.[269]
From 1991 to 1996, AT&T Corporation briefly owned NCR, one of the major original mainframe producers. During the same period, companies found that servers based on microcomputer designs could be deployed at a fraction of the acquisition price and offer local users much greater control over their own systems given the IT policies and practices at that time. Terminals used for interacting with mainframe systems were gradually replaced by personal computers. Consequently, demand plummeted and new mainframe installations were restricted mainly to financial services and government. In the early 1990s, there was a rough consensus among industry analysts that the mainframe was a dying market as mainframe platforms were increasingly replaced by personal computer networks.[270]
In 2012, NASA powered down its last mainframe, an IBM System z9.[271] However, IBM’s successor to the z9, the z10, led a New York Times reporter to state four years earlier that «mainframe technology—hardware, software and services—remains a large and lucrative business for IBM, and mainframes are still the back-office engines behind the world’s financial markets and much of global commerce».[272] As of 2010, while mainframe technology represented less than 3% of IBM’s revenues, it «continue[d] to play an outsized role in Big Blue’s results».[273]
The TOP500 project lists and ranks the 500 fastest supercomputers for which benchmark results are submitted. Since the early 1990s, the field of supercomputers has been dominated by Unix or Unix-like operating systems, and starting in 2017, every top 500 fastest supercomputer uses Linux as its supercomputer operating system.
The last supercomputer to rank #1 while using an operating system other than Linux was ASCI White, which ran AIX. It held the title from November 2000 to November 2001,[274] and was decommissioned in 2006. Then in June 2017, two AIX computers held rank 493 and 494,[275] the last non-Linux systems before they dropped off the list.

Historically all kinds of Unix operating systems dominated, and in the end ultimately Linux remains.
| Category | Source | Date | Linux | UNIX and Unix-like (not incl. Linux) | Windows | In‑house | Other |
|---|---|---|---|---|---|---|---|
| Desktop, laptop | StatCounter Global Stats[277] | June 2023 | Linux kernel family 7.23%: ChromeOS 4.15% (in the US up to 8.0%) plus traditional «Linux» 3.08% | 21.38% (macOS) | 68.15% (all versions) | 3.24% | |
| Embedded[e] | EE Times[278] | Mar 2019 | 38.42% (embedded Linux, Ubuntu, Android, other) | 2.82% (QNX, LynxOS) | 10.73% (Windows 10, Windows Embedded Compact) | 10.73% | 37.30% |
| Mainframe | Gartner[268] | Dec 2008 | 28% (SLES, RHEL) | 72% (z/OS)[f] | |||
| Server (web) | W3Techs[279] | Sep 2021 | Likely 77.4% (39.8% confirmed)[g] (Ubuntu, CentOS, Debian, Gentoo, RHEL, …)[280] | Less than 1% is confirmed to be UNIX or Unix-like and non-Linux. The top operating systems in order are: 0.3% BSD (97.8% of which is FreeBSD),[281] <0.1% Darwin,[282] <0.1% HP-UX,[283] <0.1% Solaris,[284] and <0.1% Minix.[285][g] | 22.7% (Windows Server 2019, WS2016, WS2012) Microsoft’s own webserver runs 6.6% of websites.[286] |
||
| Smartphone, tablet | StatCounter Global Stats[287] | Apr 2020 | 70.80% (Android, KaiOS) | 28.79% (iOS) | 0.07% | 0.34% | |
| Supercomputer | TOP500[288] | Nov 2019 | 100% (Custom) | ||||
| Supercomputer | TOP500[288] | Nov 2024 | 100% (Custom) |
- Comparison of operating systems
- List of operating systems
- Timeline of operating systems
- Usage share of web browsers
- Mobile OS market share
- ^ «Shipments refer to sell-in», that is, wholesale.
- ^ The ‘Others’ column is obtained by summing all percentage data and subtracting from 100%.
- ^ Table is only showing mobile OS market share – not the overall market share.
- ^ Wikimedia Foundation statistics consider tablets as part of the mobile OS market share.
- ^ Embedded is a vast category, which has subcategories that include automotive, avionics, health, medical equipment, consumer electronics, intelligent homes, and telecommunications. The aggregated information above may be very different for each subcategory taken separately.
- ^ z/OS’s UNIX environment coexists with its native environment, which dates back to OS/360.
- ^ a b «UNIX and Unix-like (including Linux)» represents 77.4% of the total web server/website market share however 48.2% of that market share does not show «more specifically» which operating system.
- ^ «Operating System Market Share Worldwide». StatCounter Global Stats. Retrieved 9 March 2025.
- ^ «Mobile Operating System Market Share Worldwide». StatCounter Global Stats. Retrieved 9 March 2025.
- ^ «Now more than ever, ChromeOS is Linux with Google’s desktop environment». About Chromebooks. 1 August 2023. Retrieved 25 September 2024.
- ^ «Desktop Operating System Market Share Worldwide». StatCounter Global Stats. Retrieved 9 March 2025.
- ^ «Tablet Operating System Market Share Worldwide». StatCounter Global Stats. Retrieved 9 March 2025.
- ^ «Server Operating System Market Volume». Fortune Business Insights. Retrieved 15 November 2024.
- ^ «Desktop Operating System Market Share South America». StatCounter Global Stats. Retrieved 22 October 2024.
- ^ «Desktop Operating System Market Share Asia». StatCounter Global Stats. Retrieved 22 October 2024.
- ^ «Desktop Operating System Market Share United States Of America». StatCounter Global Stats. Retrieved 22 October 2024.
- ^ «Desktop Operating System Market Share North America». StatCounter Global Stats. Retrieved 22 October 2024.
- ^ Vaughan-Nichols, Steven (6 November 2017). «MINIX: Intel’s hidden in-chip operating system». ZDNET. Retrieved 29 May 2024.
- ^ a b «Windows comes up third in OS clash two years early». 1 April 2016. Retrieved 12 April 2016.
- ^ «Gartner Forecasts Worldwide Device Shipments to Decline 14% in 2020 Due to Coronavirus Impact». Gartner. Retrieved 3 March 2021.
- ^ «Gartner Says Worldwide Device Shipments Will Increase 2.1 Percent in 2018». 29 January 2018. Retrieved 18 December 2019.
- ^ «Gartner: Windows OS device shipments will falter in 2017». 10 January 2017. Retrieved 18 December 2019.
- ^ «Gartner Says Tablet Sales Continue to Be Slow in 2015». 5 January 2015. Archived from the original on 7 January 2015. Retrieved 6 March 2015.
- ^ «Gartner Says Worldwide Traditional PC, Tablet, Ultramobile and Mobile Phone Shipments to Grow 4.2 Percent in 2014». 7 July 2014. Archived from the original on 11 July 2014. Retrieved 6 March 2015.
- ^ «Gartner Says Worldwide PC, Tablet and Mobile Phone Shipments to Grow 4.5 Percent in 2013 as Lower-Priced Devices Drive Growth». 21 October 2013. Archived from the original on 21 October 2013. Retrieved 6 March 2015.
- ^ «Gartner Says Worldwide End-User Spending on Devices Will Grow 2 Percent in 2017, While Unit Shipments Remain Flat». Retrieved 7 December 2017.
- ^ Thurrott, Paul (27 January 2016). «Apple’s active installed base is now over 1 billion strong». Thurrott.com. Retrieved 16 August 2016.
there are three big personal computing platforms. And only one of them is actually declining. We’ll see how Windows 10 fares over the long term, but even if Microsoft hits the 1 billion figure in 1-2 years as promised, it will by then still be the smallest of those three platforms.
- ^ «Gartner Says Worldwide PC Shipments Declined 8.3 Percent in Fourth Quarter of 2015: Holiday Sales Provided Little Cheer to PC Vendors in 2015» (Press release). 12 January 2016. Retrieved 15 March 2016.
- ^ Fuscaldo, Donna (18 July 2016). «Microsoft Backs Away From Windows 10 Goal (MSFT)». investopedia.com. Retrieved 22 March 2017.
- ^ Foley, Mary Jo. «Microsoft: Windows 10 now on 400 million devices». ZDNet.
- ^ Foley, Mary Jo. «Microsoft says Windows 10 is now on more than 800 million devices». ZDNet. Retrieved 11 March 2019.
- ^ «Gartner Says Worldwide PC Shipments Grew 10.7% in Fourth Quarter of 2020 and 4.8% for the Year». Gartner. Retrieved 3 March 2021.
- ^ «Global PC shipments pass 340 million in 2021 and 2022 is set to be even stronger». Catalyst. 12 January 2022. Retrieved 29 July 2023.
- ^ «Gartner Says Worldwide PC Shipments Declined 28.5% in Fourth Quarter of 2022 and 16.2% for the Year». Gartner. Retrieved 29 December 2023.
- ^ «Tablet Users to Surpass 1 Billion Worldwide in 2015 — eMarketer». emarketer.com. Retrieved 22 March 2017.
- ^ «Tablets have banner 2015». 1 January 2016.
- ^ «IDC: Tablet Shipments Decline For Fifth Straight Quarter — Androidheadlines.com». androidheadlines.com. 1 February 2016. Retrieved 22 March 2017.
- ^ Eric Smith (29 July 2022). «Strategy Analytics: Android Tablet Market Share Falls Below 50% for First Time in 10 Years». Strategy Analytics. Retrieved 9 October 2022.
- ^ «Global tablet shipments by OS 2010-2020». Statista. Retrieved 16 November 2020.
- ^ Eric Smith (23 November 2015). «Tablets: Windows fast becoming a premium OS, says Strategy Analytics». Strategy Analytics. Retrieved 31 March 2016.
- ^ a b Lunden, Ingrid (3 March 2014). «Gartner: 195M Tablets Sold In 2013, Android Grabs Top Spot From iPad With 62% Share». Retrieved 21 July 2014.
- ^ «Ultramobiles». Gartner, Inc. Retrieved 9 October 2022.
- ^ «Are there Really More Mobile Phone Owners than Toothbrush Owners?». www.linkedin.com. Retrieved 15 June 2019.
- ^ Turner, Ash (10 July 2018). «1 Billion More Phones Than People In The World! BankMyCell». BankMyCell. Retrieved 15 June 2019.
- ^ «Android is now used by 1.4 billion people». The Verge. 29 September 2015.
- ^ «Google I/O website: Keynote». Archived from the original on 18 June 2015. Retrieved 20 January 2016.
- ^ Protalinski, Emil (17 May 2017). «Android passes 2 billion monthly active devices». VentureBeat. Retrieved 17 May 2017.
- ^ Ng, Alfred (17 May 2017). «Google’s Android now powers more than 2 billion devices». CNET. CBS Interactive. Retrieved 17 May 2017.
- ^ Parrack, Dave (18 August 2016). «Android Is Killing iOS, Uber Launches Self-Driving Cars… [Tech News Digest]». MUO. Retrieved 18 April 2025.
- ^ «Gartner Says Five of Top 10 Worldwide Mobile Phone Vendors Increased Sales in Second Quarter of 2016: Global Sales of Smartphones Grew 4.3 Percent Year on Year» (Press release). Gartner. 19 August 2016.
- ^ Patrick, Seitz (3 November 2016). «Apple iPhone Grabs 104% Of Smartphone Industry Profit In Q3». Investor’s Business Daily.
- ^ Gadgets Now Bureau, «World’s 5 biggest smartphone companies», Gadgets Now, 1 Aug 2018, 02.51 PM IST
- ^ Kirton, David (26 November 2024). «Huawei launches Mate 70 smartphone as new US chip curbs loom». Reuters. Retrieved 9 April 2025.
- ^ Enrico, Jose (12 October 2024). «HarmonyOS Next Could Be the Next iOS, Android OS Replacement: What’s the Difference?». Tech Times. Retrieved 9 April 2025.
- ^ Baloch, Huzefa (22 October 2024). «Huawei launches HarmonyOS NEXT as a complete Android replacement». Notebookcheck. Retrieved 9 April 2025.
- ^ «Global Smartphone Sales Share by Operating System». www.counterpointresearch.com. Retrieved 29 March 2025.
- ^ «Gartner Says Worldwide Sales of Smartphones Returned to Growth in First Quarter of 2018». 28 May 2018. Retrieved 22 September 2022.
- ^ «GGartner Says Worldwide Sales of Smartphones Recorded First Ever Decline During the Fourth Quarter of 2017» (Press release). 22 February 2018. Retrieved 22 September 2022.
- ^ «Gartner Says Worldwide Sales of Smartphones Grew 9 Percent in First Quarter of 2017». Retrieved 2 February 2018.
- ^ «GGartner Says Worldwide Sales of Smartphones Recorded First Ever Decline During the Fourth Quarter of 2017» (Press release). 22 February 2018. Retrieved 22 September 2022.
- ^ «Gartner Says Worldwide Sales of Smartphones Grew 7 Percent in the Fourth Quarter of 2016». Retrieved 2 February 2018.
- ^ «Gartner Says Chinese Smartphone Vendors Were Only Vendors in the Global Top Five to Increase Sales in the Third Quarter of 2016» (Press release). Retrieved 9 December 2016.
- ^ «Gartner Says Five of Top 10 Worldwide Mobile Phone Vendors Increased Sales in the Second Quarter of 2016» (Press release). Retrieved 9 December 2016.
- ^ «Gartner Says Worldwide Smartphone Sales Grew 3.9 Percent in the First Quarter of 2016» (Press release). Retrieved 9 December 2016.
- ^ «Gartner Says Worldwide Smartphone Sales Grew 9.7 Percent in the Fourth Quarter of 2015» (Press release). 18 February 2016. Retrieved 22 September 2022.
- ^ «Gartner Says Worldwide Smartphone Sales Recorded Slowest Growth Rate Since 2013» (Press release). 20 August 2015. Retrieved 22 September 2022.
- ^ «Gartner Says Worldwide Smartphone Sales Grew 9.7 Percent in Fourth Quarter of 2015» (Press release). 18 February 2016. Retrieved 22 September 2022.
- ^ «Android Captures Record 81 Percent Share of Global Smartphone Shipments in Q3 2013». Archived from the original on 1 November 2013. Retrieved 1 November 2013.
- ^ «Gartner Says Worldwide Smartphone Sales Recorded Slowest Growth Rate Since 2013» (Press release). 20 August 2015. Retrieved 22 September 2022.
- ^ «Worldwide Smartphone Sales to End Users by Operating System in 2Q13» (Press release).
- ^ «Worldwide Smartphone Sales to End Users by Operating System in 1Q13» (Press release).
- ^ «Android and iOS Combine for 92.3% of All Smartphone Operating System Shipments in the First Quarter While Windows Phone Leapfrogs BlackBerry, According to IDC». www.businesswire.com. 16 May 2013.
- ^ «Operating System Market Share Worldwide». StatCounter Global Stats. Retrieved 18 November 2024.
- ^ a b «Android overtakes Windows for first time: «Milestone in technology history and end of an era» as Microsoft no longer owns dominant OS» (Press release).
- ^ «StatCounter Global Stats — Browser, OS, Search Engine including Mobile Usage Share». statcounter.com. Retrieved 19 April 2017.
- ^ «Operating System Market Share South America». StatCounter Global Stats. Retrieved 1 October 2020.
- ^ «Operating System Market Share Africa». StatCounter Global Stats. Retrieved 19 June 2022.
- ^ «Operating System Market Share Guam». StatCounter Global Stats. Retrieved 4 December 2019.
- ^ «Operating System Market Share Guam». StatCounter Global Stats. Retrieved 14 July 2019.
- ^ «Operating System Market Share Guam». StatCounter Global Stats. Retrieved 4 December 2019.
- ^ «Operating System Market Share Falkland Islands (malvinas): Q3 2018 — Q2 2019». StatCounter Global Stats. Retrieved 14 July 2019.
- ^ «Operating System Market Share Falkland Islands (malvinas)». StatCounter Global Stats. Retrieved 14 July 2019.
- ^ «Operating System Market Share Sweden». StatCounter Global Stats. Retrieved 14 July 2019.
- ^ «Operating System Market Share Madagascar». StatCounter Global Stats. Retrieved 15 July 2019.
- ^ «Browser Version Market Share Madagascar». StatCounter Global Stats.
- ^ «Browser Market Share Madagascar». StatCounter Global Stats.
- ^ «StatCounter Global Stats — Browser, OS, Search Engine including Mobile Usage Share». statcounter.com. Retrieved 16 October 2019.
- ^ «Top 8 Operating Systems in Asia from July 2014 to September 2019». statcounter.com.
- ^ a b «Operating System Market Share Bangladesh». StatCounter Global Stats. Retrieved 16 October 2019.
- ^ «Top 8 Operating Systems in Africa from July 2014 to Apr 2016». statcounter.com.
- ^ «StatCounter Global Stats — Browser, OS, Search Engine including Mobile Usage Share». statcounter.com. Retrieved 22 March 2017.
- ^ «Global stats». W3 Counter.
- ^ «StatCounter Global Stats — Browser, OS, Search Engine including Mobile Usage Share». statcounter.com. Retrieved 22 March 2017.
- ^ «W3Counter: Global Web Stats — February 2025». www.w3counter.com. Retrieved 29 March 2025.
- ^ «W3Counter: Global Web Stats — October 2022». www.w3counter.com. Retrieved 1 December 2022.
- ^ «W3Counter: Global Web Stats — October 2020». www.w3counter.com. Retrieved 16 November 2020.
- ^ a b «Global stats». W3 Counter.
- ^ «Global stats». W3 Counter.
- ^ a b «StatCounter Stats through Dec 2016». www.statcounter.com. Retrieved 5 December 2016.
- ^ «Worldwide user OS families in Jul 2016».
- ^ a b «Worldwide user OS families in Dec 2015».
- ^ «Wikimedia Traffic Analysis Report — Operating Systems, 28Nov2016-1Jan2017».
- ^ «Desktop Operating System Market Share Worldwide». StatCounter Global Stats.
- ^ «Operating System Market Share United States Of America». StatCounter Global Stats. Retrieved 5 January 2021.
- ^ «Operating System Market Share Worldwide». StatCounter Global Stats. Retrieved 5 January 2021.
- ^ «Desktop Operating System Market Share United States Of America». StatCounter Global Stats. Retrieved 5 January 2021.
- ^ https://gs.statcounter.com/#desktop-os-ww-monthly-201508-201508-bar StatCounter
- ^ «Software Pirates in China Beat Microsoft to the Punch». The New York Times. 19 October 2009.
- ^ «Around 25–35% of Windows XP systems are pirated (calculations included)». Archived from the original on 4 March 2016.
- ^ «Desktop Windows Version Market Share Armenia». StatCounter Global Stats. Retrieved 4 October 2021.
- ^ «StatCounter Global Stats — Browser, OS, Search Engine including Mobile Usage Share». statcounter.com. Retrieved 22 March 2017.
- ^ «StatCounter Global Stats — Browser, OS, Search Engine including Mobile Usage Share». statcounter.com. Retrieved 22 March 2017.
- ^ «Top 7 Desktop OSs in Asia on May 2016». StatCounter. May 2016. Retrieved 9 April 2016.
- ^ «Desktop Operating System Market Share North America». StatCounter Global Stats. Retrieved 13 August 2023.
- ^ «Desktop Operating System Market Share United States Of America». StatCounter Global Stats. Retrieved 13 August 2023.
- ^ «Desktop Operating System Market Share Asia». StatCounter Global Stats. Retrieved 13 August 2023.
- ^ «Desktop vs Mobile vs Tablet vs Console Market Share Worldwide». StatCounter Global Stats. Retrieved 2 October 2021.
- ^ «Desktop vs Mobile vs Tablet vs Console Market Share Worldwide». StatCounter Global Stats. Retrieved 16 November 2020.
- ^ «Desktop vs Mobile vs Tablet vs Console Market Share Worldwide». StatCounter Global Stats. Retrieved 1 October 2020.
- ^ «Desktop vs Mobile vs Tablet vs Console Market Share Oceania». StatCounter Global Stats. Retrieved 4 October 2021.
- ^ «Desktop vs Mobile vs Tablet vs Console Market Share Europe». StatCounter Global Stats. Retrieved 4 October 2021.
- ^ «Desktop vs Mobile vs Tablet vs Console Market Share North America». StatCounter Global Stats. Retrieved 4 October 2021.
- ^ «Desktop vs Mobile vs Tablet vs Console Market Share United States Of America». StatCounter Global Stats. Retrieved 8 April 2023.
- ^ «Desktop vs Mobile vs Tablet vs Console Market Share North America». StatCounter Global Stats. Retrieved 8 April 2023.
- ^ «Desktop vs Mobile vs Tablet vs Console Market Share United States Of America». StatCounter Global Stats. Retrieved 4 October 2021.
- ^ «Desktop vs Mobile vs Tablet vs Console Market Share United States Of America». StatCounter Global Stats. Retrieved 1 July 2019.
- ^ «Desktop vs Mobile vs Tablet vs Console Market Share United States Of America». StatCounter Global Stats. Retrieved 18 October 2021.
- ^ «Desktop vs Mobile vs Tablet vs Console Market Share United States Of America». StatCounter Global Stats. Retrieved 18 October 2021.
- ^ «Desktop vs Mobile vs Tablet vs Console Market Share United States Of America». StatCounter Global Stats. Retrieved 18 October 2021.
- ^ «Desktop vs Mobile vs Tablet vs Console Market Share Worldwide». StatCounter Global Stats. Retrieved 1 July 2019.
- ^ «Desktop vs Mobile vs Tablet vs Console Market Share United States Of America». StatCounter Global Stats. Retrieved 13 December 2021.
- ^ «Desktop vs Mobile vs Tablet vs Console Market Share United States Of America». StatCounter Global Stats. Retrieved 13 December 2021.
- ^ «Stack Overflow 2023 Developer Survey, Operating System». Stack Overflow. Retrieved 13 August 2023.
- ^ «Windows 10 has over 50 percent market share, according to Microsoft — wait, what?». BetaNews. 29 August 2016.
- ^ «Steam Hardware & Software Survey: December 2023». 2 January 2024. Archived from the original on 2 January 2024. Retrieved 6 January 2024.
- ^ a b Steam Hardware & Software Survey: December 2022, archived from the original on 4 January 2023, retrieved 31 January 2023
- ^ Steam Hardware & Software Survey: December 2019, archived from the original on 2 January 2020
- ^ Steam Hardware & Software Survey: January 2019, archived from the original on 11 February 2019
- ^ Steam Hardware & Software Survey: December 2018, archived from the original on 12 February 2018
- ^ Steam Hardware & Software Survey, archived from the original on 12 February 2017
- ^ Steam Hardware & Software Survey, archived from the original on 10 February 2016
- ^ Steam Hardware & Software Survey, archived from the original on 16 February 2015
- ^ Steam Hardware & Software Survey, archived from the original on 15 February 2014
- ^ «Linux gaming is much healthier than Steam’s Hardware Survey implies». pcworld.com. Retrieved 22 March 2017.
- ^ «Gartner Says Worldwide Sales of Smartphones Returned to Growth in First Quarter of 2018». Gartner, Inc. Gartner. 29 May 2018. Archived from the original on 13 June 2018. Retrieved 25 August 2018.
- ^ «Desktop vs Mobile vs Tablet vs Console Market Share Russian Federation | StatCounter Global Stats». StatCounter Global Stats. Retrieved 16 October 2019.
- ^ «Desktop vs Mobile vs Tablet vs Console Market Share Mali | StatCounter Global Stats». StatCounter Global Stats. Retrieved 16 October 2019.
- ^ «Operating System Market Share Mali». StatCounter Global Stats. Retrieved 15 July 2019.
- ^ Bates, Adam. «InsightPortal | Higher GDP per capita corresponds with more Apple devices, stats suggest». www.insightportal.io. Retrieved 18 October 2017.
- ^ «Google Mobile App Marketing Insights: Asia» (PDF). storage.googleapis.com.
- ^ «Mobile Operating System Market Share India». StatCounter Global Stats. Retrieved 23 January 2019.
- ^ «Mobile operating systems’ market share worldwide from 1st quarter 2009 to 4th quarter 2022». Retrieved 1 December 2022.
- ^ «Mobile Operating System Market Share Worldwide». StatCounter Global Stats. Retrieved 8 October 2022.
- ^ «Mobile Operating System Market Share Worldwide». StatCounter Global Stats. Retrieved 16 November 2020.
- ^ a b c «StatCounter Global Stats — Browser, OS, Search Engine including Mobile Usage Share». StatCounter Global Stats.
- ^ «Comscore Reports April 2017 U.S. Smartphone Subscriber Market Share». comScore, Inc. 8 June 2017. Retrieved 8 October 2022.
- ^ «comScore Reports January 2016 U.S. Smartphone Subscriber Market Share». comScore, Inc. Retrieved 9 December 2016.
- ^ «comScore Reports January 2015 U.S. Smartphone Subscriber Market Share». comScore. 4 March 2015. Retrieved 5 May 2015.
- ^ «comScore Reports January 2014 U.S. Smartphone Subscriber Market Share — comScore, Inc». comScore. 7 March 2014. Retrieved 30 March 2014.
- ^ «Comscore Reports February 2012 U.S. Mobile Subscriber Market Share: Android Captures Majority Share of U.S. Smartphone Market». comScore, Inc. 3 April 2012. Retrieved 8 October 2022.
- ^ «comScore Reports December 2010 U.S. Mobile Subscriber Market Share: Number of Smartphone Users Up 60 Percent Versus Year Agoe». comScore, Inc. 7 February 2011. Retrieved 8 October 2022.
- ^ «Tablet Operating System Market Share Worldwide — July 2018». StatCounter. 29 May 2018. Retrieved 25 August 2018.
- ^ «StatCounter Global Stats — Browser, OS, Search Engine including Mobile Usage Share». statcounter.com. Retrieved 22 March 2017.
- ^ «StatCounter Global Stats — Browser, OS, Search Engine including Mobile Usage Share». statcounter.com. Retrieved 20 October 2017.
- ^ «StatCounter Global Stats — Browser, OS, Search Engine including Mobile Usage Share». statcounter.com. Retrieved 20 October 2017.
- ^ «StatCounter Global Stats — Browser, OS, Search Engine including Mobile Usage Share». statcounter.com. Retrieved 22 March 2017.
- ^ «StatCounter Global Stats — Browser, OS, Search Engine including Mobile Usage Share». statcounter.com. Retrieved 22 March 2017.
- ^ «StatCounter Global Stats — Browser, OS, Search Engine including Mobile Usage Share». statcounter.com.
- ^ «StatCounter Global Stats — Browser, OS, Search Engine including Mobile Usage Share». statcounter.com.
- ^ «StatCounter Global Stats — Browser, OS, Search Engine including Mobile Usage Share». statcounter.com.
- ^ «StatCounter Global Stats — Browser, OS, Search Engine including Mobile Usage Share». statcounter.com.
- ^ «StatCounter Global Stats — Browser, OS, Search Engine including Mobile Usage Share». statcounter.com.
- ^ a b «StatCounter Global Stats — Browser, OS, Search Engine including Mobile Usage Share». statcounter.com.
- ^ «Top 7 Tablet OSes in South America from Aug 2012 to Aug 2015». statcounter.com.
- ^ «StatCounter Global Stats — Browser, OS, Search Engine including Mobile Usage Share». statcounter.com.
- ^ «Top 7 Tablet OSes in South America from Aug 2012 to Sep 2015». statcounter.com.
- ^ «StatCounter Global Stats — Browser, OS, Search Engine including Mobile Usage Share». statcounter.com.
- ^ «StatCounter Global Stats — Browser, OS, Search Engine including Mobile Usage Share». statcounter.com.
- ^ «StatCounter Global Stats — Browser, OS, Search Engine including Mobile Usage Share». statcounter.com.
- ^ «Tablet Operating System Market Share Worldwide». StatCounter Global Stats. Retrieved 11 September 2023.
- ^ «Tablet Operating System Market Share Worldwide». StatCounter Global Stats. Retrieved 16 November 2020.
- ^ «Tablet Operating System Market Share Worldwide». StatCounter Global Stats. Retrieved 16 November 2020.
- ^ «Tablet Operating System Market Share Worldwide». StatCounter Global Stats. Retrieved 16 November 2020.
- ^ Global Stats Top 7 Tablet OSs from Jan to Aug 2015. Retrieved 20 September 2015.
- ^ Global Stats Top 7 Tablet OSs from Feb 2015. Retrieved 16 March 2015.
- ^ Global Stats Top 7 Tablet OSs from Oct 2014. Retrieved 7 March 2015.
- ^ «Operating System Market Share United States Of America». StatCounter Global Stats. Retrieved 16 October 2019.
- ^ «Desktop vs mobile vs tablet vs console market share Worldwide — StatCounter Global Stats». StatCounter Global Stats.
- ^ «Operating System Market Share Worldwide | StatCounter Global Stats». StatCounter Global Stats. Retrieved 10 April 2018.
- ^ «Desktop vs mobile vs tablet vs console market share in Europe — StatCounter Global Stats». StatCounter Global Stats.
- ^ «Desktop vs mobile vs tablet vs console market share Worldwide — StatCounter Global Stats». StatCounter Global Stats.
- ^ «Desktop vs Mobile vs Tablet vs Console Market Share Sweden». StatCounter Global Stats. Retrieved 12 July 2019.
- ^ «India amongst world leaders in use of mobile to surf the internet» (Press release). 28 March 2017.
- ^ «Operating system market share in India — StatCounter Global Stats». StatCounter Global Stats.
- ^ «Desktop vs mobile vs tablet vs console market share Worldwide — StatCounter Global Stats». StatCounter Global Stats.
- ^ «Comparison from W34 to W45 2015». StatCounter Global Stats.
- ^ «StatCounter Global Stats — Browser, OS, Search Engine including Mobile Usage Share».
- ^ «Operating system market share in Puerto Rico — StatCounter Global Stats». StatCounter Global Stats.
- ^ «StatCounter Global Stats — Browser, OS, Search Engine including Mobile Usage Share».
- ^ «StatCounter Global Stats — Browser, OS, Search Engine including Mobile Usage Share». statcounter.com. Retrieved 22 March 2017.
- ^ «Mobile and tablet Internet usage exceeds desktop for first time worldwide». StatCounter (Press release).
- ^ «Desktop vs mobile vs tablet vs console market share Worldwide — StatCounter Global Stats». statcounter.com. Retrieved 3 April 2017.
- ^ a b «Desktop vs mobile vs tablet vs console market share Worldwide — StatCounter Global Stats». statcounter.com. Retrieved 22 March 2017.
- ^ «StatCounter Global Stats — Browser, OS, Search Engine including Mobile Usage Share». statcounter.com. Retrieved 22 March 2017.
- ^ «StatCounter Global Stats — Browser, OS, Search Engine including Mobile Usage Share». statcounter.com. Retrieved 22 March 2017.
- ^ «StatCounter Global Stats — Browser, OS, Search Engine including Mobile Usage Share». statcounter.com. Retrieved 22 March 2017.
- ^ «StatCounter Global Stats — Browser, OS, Search Engine including Mobile Usage Share». statcounter.com. Retrieved 22 March 2017.
- ^ «StatCounter Global Stats — Browser, OS, Search Engine including Mobile Usage Share». statcounter.com. Retrieved 22 March 2017.
- ^ «StatCounter Global Stats — Browser, OS, Search Engine including Mobile Usage Share». statcounter.com. Retrieved 22 March 2017.
- ^ «StatCounter Global Stats — Browser, OS, Search Engine including Mobile Usage Share». statcounter.com. Retrieved 22 March 2017.
- ^ «StatCounter Global Stats — Browser, OS, Search Engine including Mobile Usage Share». statcounter.com. Retrieved 22 March 2017.
- ^ «StatCounter Global Stats — Browser, OS, Search Engine including Mobile Usage Share». statcounter.com. Retrieved 22 March 2017.
- ^ «Comparison from W34 to W47 2016». StatCounter Global Stats.
- ^ «StatCounter Global Stats — Browser, OS, Search Engine including Mobile Usage Share». statcounter.com. Retrieved 22 March 2017.
- ^ a b «StatCounter Global Stats — Browser, OS, Search Engine including Mobile Usage Share». statcounter.com. Retrieved 22 March 2017.
- ^ «StatCounter Global Stats — Browser, OS, Search Engine including Mobile Usage Share». statcounter.com. Retrieved 22 March 2017.
- ^ «StatCounter Global Stats — Browser, OS, Search Engine including Mobile Usage Share». statcounter.com. Retrieved 22 March 2017.
- ^ «StatCounter Global Stats — Browser, OS, Search Engine including Mobile Usage Share». statcounter.com. Retrieved 22 March 2017.
- ^ «StatCounter Global Stats — Browser, OS, Search Engine including Mobile Usage Share». statcounter.com. Retrieved 22 March 2017.
- ^ «StatCounter Global Stats — Browser, OS, Search Engine including Mobile Usage Share». statcounter.com. Retrieved 22 March 2017.
- ^ «StatCounter Global Stats — Browser, OS, Search Engine including Mobile Usage Share». statcounter.com. Retrieved 22 March 2017.
- ^ «StatCounter Global Stats — Browser, OS, Search Engine including Mobile Usage Share». statcounter.com. Retrieved 22 March 2017.
- ^ «StatCounter Global Stats — Browser, OS, Search Engine including Mobile Usage Share». statcounter.com. Retrieved 22 March 2017.
- ^ «Mobile and tablet internet usage exceeds desktop for first time worldwide». StatCounter (Press release).
- ^ «StatCounter Global Stats — Browser, OS, Search Engine including Mobile Usage Share». statcounter.com. Retrieved 22 March 2017.
- ^ «StatCounter Global Stats — Browser, OS, Search Engine including Mobile Usage Share». statcounter.com. Retrieved 22 March 2017.
- ^ «StatCounter Global Stats — Browser, OS, Search Engine including Mobile Usage Share». statcounter.com. Retrieved 22 March 2017.
- ^ «StatCounter Global Stats — Browser, OS, Search Engine including Mobile Usage Share». statcounter.com. Retrieved 22 March 2017.
- ^ «StatCounter Global Stats — Browser, OS, Search Engine including Mobile Usage Share». statcounter.com. Retrieved 22 March 2017.
- ^ «StatCounter Global Stats — Browser, OS, Search Engine including Mobile Usage Share». statcounter.com. Retrieved 22 March 2017.
- ^ «StatCounter Global Stats — Browser, OS, Search Engine including Mobile Usage Share». statcounter.com. Retrieved 22 March 2017.
- ^ «StatCounter Global Stats — Browser, OS, Search Engine including Mobile Usage Share». statcounter.com. Retrieved 22 March 2017.
- ^ «StatCounter Global Stats — Browser, OS, Search Engine including Mobile Usage Share». statcounter.com. Retrieved 22 March 2017.
- ^ «StatCounter Global Stats — Browser, OS, Search Engine including Mobile Usage Share». statcounter.com. Retrieved 22 March 2017.
- ^ https://gs.statcounter.com/#all-comparison-ww-daily-20150701-20160724 Comparison from 1 July 2015 to 24 July 2016
- ^ «StatCounter Global Stats — Browser, OS, Search Engine including Mobile Usage Share». statcounter.com. Retrieved 22 March 2017.
- ^ «StatCounter Global Stats — Browser, OS, Search Engine including Mobile Usage Share». statcounter.com. Retrieved 22 March 2017.
- ^ «StatCounter Global Stats — Browser, OS, Search Engine including Mobile Usage Share». statcounter.com. Retrieved 22 March 2017.
- ^ «StatCounter Global Stats — Browser, OS, Search Engine including Mobile Usage Share». statcounter.com. Retrieved 22 March 2017.
- ^ «StatCounter Global Stats — Browser, OS, Search Engine including Mobile Usage Share». statcounter.com. Retrieved 22 March 2017.
- ^ «StatCounter Global Stats — Browser, OS, Search Engine including Mobile Usage Share». statcounter.com.
- ^ «StatCounter Global Stats — Browser, OS, Search Engine including Mobile Usage Share». statcounter.com.
- ^ «StatCounter Global Stats — Browser, OS, Search Engine including Mobile Usage Share». statcounter.com.
- ^ «StatCounter Global Stats — Browser, OS, Search Engine including Mobile Usage Share». statcounter.com.
- ^ «StatCounter Global Stats — Browser, OS, Search Engine including Mobile Usage Share». statcounter.com.
- ^ «StatCounter Global Stats — Browser, OS, Search Engine including Mobile Usage Share». statcounter.com.
- ^ «StatCounter Global Stats — Browser, OS, Search Engine including Mobile Usage Share». statcounter.com.
- ^ «Mobile internet usage soars by 67%» (Press release). Retrieved 21 October 2014.
- ^ «StatCounter Global Stats — Browser, OS, Search Engine including Mobile Usage Share». statcounter.com.
- ^ «StatCounter Global Stats — Browser, OS, Search Engine including Mobile Usage Share». statcounter.com.
- ^ «StatCounter Global Stats — Browser, OS, Search Engine including Mobile Usage Share». statcounter.com.
- ^ «StatCounter Global Stats — Browser, OS, Search Engine including Mobile Usage Share». statcounter.com.
- ^ «StatCounter Global Stats — Browser, OS, Search Engine including Mobile Usage Share». statcounter.com.
- ^ «StatCounter Global Stats — Browser, OS, Search Engine including Mobile Usage Share». statcounter.com. Retrieved 22 March 2017.
- ^ «StatCounter Global Stats — Browser, OS, Search Engine including Mobile Usage Share». statcounter.com.
- ^ «StatCounter Global Stats — Browser, OS, Search Engine including Mobile Usage Share». statcounter.com. Retrieved 22 March 2017.
- ^ «StatCounter Global Stats — Browser, OS, Search Engine including Mobile Usage Share». statcounter.com. Retrieved 22 March 2017.
- ^ «StatCounter Global Stats — Browser, OS, Search Engine including Mobile Usage Share». statcounter.com. Retrieved 22 March 2017.
- ^ «StatCounter Global Stats — Browser, OS, Search Engine including Mobile Usage Share». statcounter.com. Retrieved 22 March 2017.
- ^ a b Number of Mobile-Only Internet Users Now Exceeds Desktop-Only in the U.S.. Retrieved 5 May 2015.
- ^ «StatCounter Global Stats — Browser, OS, Search Engine including Mobile Usage Share». statcounter.com. Retrieved 22 March 2017.
- ^ «Forecast: Mobile App Store Revenue to Exceed $139B in 2021». appannie.com.
- ^ «Worldwide mobile app revenues by region 2020». Statista. Retrieved 16 November 2020.
- ^ «Mail Server Survey». Security Space. August 2011.
- ^ «Usage Statistics and Market Share of Operating Systems for Websites, March 2025». w3techs.com. Retrieved 29 March 2025.
- ^ «Usage of operating systems for websites». W3Techs. Retrieved 14 July 2022.
- ^ «Usage of Unix for websites». W3Techs. Retrieved 14 July 2022.
- ^ «Web Server Survey». Security Space. 1 March 2014.
- ^ «OS/Linux Distributions using Apache». Security Space. 1 March 2014.
- ^ «Web Technologies Statistics and Trends». W3Techs. December 2013.
- ^ «Worldwide Server Market Revenues Decline −3.7% in the Third Quarter as Weak Unix Server Demand Weights on the Market, According to IDC». International Data Corporation. Archived from the original on 8 February 2014. Retrieved 24 February 2014.
- ^ «What is z/OS?». Data Center. Retrieved 15 February 2024.
- ^ «IBM Tightens Stranglehold Over Mainframe Market; Gets Hit with Antitrust Complaint in Europe». Computer & Communications Industry Association. 2 July 2008. Archived from the original on 6 July 2010. Retrieved 27 May 2015.
- ^ a b «Vendor Rating: Novell, 2008». Gartner RAS Core Research Note G00162399. 23 December 2008. Retrieved 23 November 2009.[dead link]
- ^ a b Claybrook, Bill (1 September 2009). «Red Hat bolsters Linux for mainframes, tries to catch Novell». SearchDataCenter.com. Retrieved 23 November 2009.
- ^ Sanger, David E. (5 February 1984). «Bailing Out of the Mainframe Industry». The New York Times. p. Section 3, Page 1. ISSN 0362-4331. Retrieved 2 March 2020.
- ^ Also, Stewart (8 March 1993). «IBM still has brains to be player in client/server platforms». InfoWorld. Retrieved 26 December 2013.
- ^ Cureton, Linda (11 February 2012). The End of the Mainframe Era at NASA. NASA. Retrieved 31 January 2014.
- ^ Lohr, Steve (23 March 2008). «Why Old Technologies Are Still Kicking». The New York Times. Retrieved 25 December 2013.
- ^ Ante, Spencer E. (22 July 2010). «IBM Calculates New Mainframes Into Its Future Sales Growth». The Wall Street Journal. Retrieved 25 December 2013.
- ^ «No. 1 system from November 2000 to November 2001». top500.org. Retrieved 22 May 2019.
- ^ «Linux is Running on Almost all of the Supercomputers». TechFAE. 25 June 2017.
- ^ «Operating system Family — Systems share». Top 500 project.
- ^ «Desktop Operating System Market Share Worldwide». StatCounter Global Stats. Retrieved 16 July 2023.
- ^ «Embedded Markets Study» (PDF). March 2019.
- ^ «Usage Statistics and Market Share of Operating Systems for Websites, September 20212020». W3Techs. Retrieved 8 September 2021.
- ^ «Usage Statistics and Market Share of Linux for Websites, September 2021». W3Techs. Retrieved 8 September 2021.
- ^ «Usage Statistics and Market Share of BSD for Websites, September 2021». W3Techs. Retrieved 8 September 2021.
- ^ «Usage Statistics and Market Share of Darwin for Websites, September 2021». W3Techs. Retrieved 8 September 2021.
- ^ «Usage Statistics and Market Share of HP-UX for Websites, September 2021». W3Techs. Retrieved 8 September 2021.
- ^ «Usage Statistics and Market Share of Solaris for Websites, September 2021». W3Techs. Retrieved 8 September 2021.
- ^ «Usage Statistics and Market Share of Minix for Websites, September 2021». W3Techs. Retrieved 8 September 2021.
- ^ «Usage Statistics and Market Share of Web Servers, September 2021». W3Techs. Retrieved 8 September 2021.
- ^ «StatCounter Global Stats: Top 8 Mobile Operating Systems on April 2020».
- ^ a b «Operating system Family (Linux)». www.top500.org. Retrieved 12 May 2020.
По состоянию на февраль 2024 года операционная система (ОС) Windows от Microsoft доминирует на рынке настольных компьютеров во всем мире, занимая около 72 % рынка. Операционная система Mac от Apple с годами завоевывала все большую долю рынка, и теперь ей принадлежит около пятой части рынка. Linux и Chrome OS от Google в последние годы сохраняют небольшие, но стабильные доли рынка. С момента своего первоначального выпуска в 1985 году Microsoft Windows претерпела бесконечные изменения. Среди известных версий можно отметить Windows 95, Windows XP и Windows 7. Windows 11 — новейшее дополнение к семейству, способное работать на ПК, планшетах и встроенных устройствах. В 2022 году около 65 миллионов ПК были поставлены с установленной операционной системой Windows.
Операционная система Mac компании Apple (macOS, ранее Mac OS X и OS X), имеющая не менее долгую историю, также пережила различные релизы. Самая последняя версия, macOS Ventura, является девятнадцатым выпуском macOS. Более старая версия macOS, Catalina, на данный момент является самой популярной macOS, которая установлена на 87,4 % компьютеров Apple по состоянию на январь 2023 г. macOS работает на компьютерах Mac от Apple, включая MacBook, который является продуктом Apple для портативных ПК, включая MacBook Pro и MacBook Air, и iMac — настольный компьютер Apple.
По подсчетам сервиса веб-аналитики StatCounter, в июне 2023 года доля Linux на мировом рынке настольных ОС достигла 3,07% — впервые за более чем 30 лет существования системы. О других результатах анализа — читайте в материале.
По данным StatCounter, в июне 2018 года Linux занимал 1,69% мирового рынка настольных ОС. С июня 2022 года по июнь 2023 года его доля выросла с 2,42% до 3,07% — и в период с мая по июнь впервые превысила 3%. Если рассматривать Chrome OS как систему Linux, то сложив ее долю в 4,13% с долей Linux, мы получим 7,2%.
Источник: StatCounter Global Stats — Рынок настольных ОС в мире
В этот период заметны и другие тенденции. За год доля Windows снизилась с 76,33% до 68,23%, немного восстановившись после сильного зимне-весеннего падения до 62,06%. Причина может быть в том, что с марта 2022 года Microsoft приостановила продажи в России.
Дело также может быть в категории «неизвестно» (unknown), которая, вероятно, включает очень новые и очень старые версии популярных ОС. Доля «неизвестно» постепенно увеличивается, а затем достигает 13% и остается на этом уровне — как раз во время падения Windows. В сравнении с этой категорией, Linux растет более плавно.
MacOS также растет постепенно, но уверенно — с 14,64% в июне 2022 года до 21,32% спустя год. По данным на июнь 2022 года, Windows и MacOS занимают 89,5% рынка. За третье место с гораздо более низкими показателями борются Chrome, Linux и категория «неизвестно».
В России доля Linux составляет 2,11%, и этот показатель оставался довольно стабильным на протяжении всего года. Доля MacOS выросла с 5,42% до 7,62%. Система Windows лидирует с 84,51% — хотя и испытала небольшое падение с 87,6% годом ранее.
Источник: StatCounter Global Stats — Рынок настольных ОС в России
StatCounter получает данные от кода отслеживания, который установлен на более чем 1,5 млн сайтов по всему миру и фиксирует около 5 млрд просмотров страниц в месяц. Единственные изменения, которые вносятся в данные, — удаление ботов и корректировка под предварительный рендеринг в Google Chrome. Категория «настольные компьютеры» включает и ноутбуки. В статистику могут вноситься исправления в течение 45 дней после публикации.
Источник.
Фото на обложке: Vasin Lee / Shutterstock

TABLE OF CONTENTS
- Introduction
- Editor’s Choice
- General Operating Systems Statistics
- Operating Systems Statistics By Market Share By Region
- Desktop Operating System
- Mobile Operating System Market
- Tablet Operating System Market Share
- Desktop Vs. Mobile Vs. Tablet Market Share
- Operating Systems Statistics By Brand Versions Market Share Worldwide In 2024
- Microsoft Windows Operating System Statistics
- Android Operating System Statistics
- Mac OS X Operating System Statistics
- Apple iOS Operating System Statistics
- Conclusion
Introduction
Operating Systems Statistics: In the dynamic realm of digital infrastructure, operating systems play a pivotal role, serving as the backbone that enables hardware and software to function seamlessly. An operating system (OS) is essential for managing a computer’s resources, and ensuring efficient coordination between hardware and software.
As of February 2024, Microsoft Windows dominates the global desktop OS market with around 72% share, followed by Apple’s macOS at nearly 20%. Smaller players like Linux and Chrome OS maintain stable but minor shares. Mobile devices are led by Android, which holds approximately 70% of the global market, while iOS commands around 29%.
Editor’s Choice
- As of February 2024, Microsoft Windows dominates the global desktop operating system (OS) market with a 72% share.
- Apple’s macOS holds nearly 20% of the global desktop OS market.
- Linux and Chrome OS have small but stable shares in the global desktop OS market.
- Google’s Android leads the global mobile OS market with approximately 70% market share.
- Apple’s iOS commands around 29% of the global mobile OS market.
- In 2023, sales of Android smartphones exceeded 960 million units worldwide.
- Apple shipped around 225 million smartphones in 2023.
- As of the fourth quarter of 2023, Apple’s iOS held a 55% market share in the global tablet OS market.
- In the fourth quarter of 2023, Apple shipped nearly 15 million tablets worldwide.
- Microsoft Windows holds 68% of the global PC operating system market.
- Windows 10 accounts for 68% of all Windows desktop PCs.
- Apple’s macOS holds 15% of the global PC operating system market.
- In September 2023, Apple released macOS Sonoma, the latest version of its operating system.
- In 2022, 65 million PCs were shipped with Windows operating systems installed.
- Up to 30 million Chromebooks are currently being used in classrooms, according to Google estimates.
- As of February 20, 2016, mobile technology adoption in some smaller nations in North America, such as Haiti, reached 72.35%, and by 2023, it had declined to 64.43%.
- In 2023, 25% of Apple’s user population had downloaded the El Capitan operating system.
- As of September 2021, macOS had a 9.54% share of the desktop and laptop operating system market.
- The current Linux desktop market share is estimated to be between 1.74% and 2.18%.
- Windows 10 holds a 43.53% share of the global desktop and laptop OS market.
- macOS High Sierra ranks third globally with a 5.62% market share in the desktop OS segment, according to StatCounter.
- In 2020, Android dominated the smartphone market, powering 84.1% of all smartphones sold that year.
- Around 52% of all tablets shipped globally in the first quarter of 2021 had Android as their operating system.
- In 2021, macOS accounted for 16% of the market share for Apple’s personal and enterprise computers.
- In 2017, the operating system software industry saw a 1.1% revenue growth, signaling a mature market.
- As of 2023, there were 307,391 people employed in the Operating Systems & Productivity Software Publishing industry in the United States, according to IBIS World.
General Operating Systems Statistics
- Operating Systems Statistics show that in 2024, the worldwide OS market is valued at $46.67 billion and is expected to grow at a CAGR of 2.1%, reaching $50.69 billion by 2028.
- Overall, Asia Pacific was the largest market for operating systems in 2023.
- In addition, Asia Pacific is estimated to be the fastest-growing market in the OS segment by 2028.
- Operating Systems Statistics also state that the leading influential factor of the OS market is the rise in demand for computers.
- Around 100% of supercomputers are said to be working on Linux.
- As of 2023, 2.8 billion users were actively using Android OS.
- In 2024, 71.74% of smartphones have Android OS installed.
- Around 93% of Android users are satisfied with the OS and for meeting their requirements.
According to the Operating Systems Statistics 2024, the following numbers show the market share of operating systems currently used in the worldwide market.
Desktop Operating System
Worldwide (2024)
| OS | Market Share |
| Windows | 72.52% |
| OS X | 14.68% |
| Unknown | 6.47% |
| Linux | 4.05% |
| Chrome OS | 2.27% |
| FreeBSD | 0.01% |
Africa
| OS | Market Share |
| Windows | 63.75% |
| Unknown | 28.27% |
| OS X | 4.74% |
| Linux | 2.81% |
| Chrome OS | 0.41% |
| FreeBSD | 0.02% |
Asia
| OS | Market Share |
| Windows | 74.96% |
| Unknown | 9.6% |
| OS X | 9.3% |
| Linux | 5.89% |
| Chrome OS | 0.24% |
| FreeBSD | – |
Americas
| OS | Market Share |
| Windows | 63.75% |
| OS X | 23.36% |
| Chrome OS | 5.87% |
| Linux | 3.61% |
| Unknown | 3.38% |
| FreeBSD | 0.01% |
Australia And Oceania
| OS | Market Share |
| Windows | 65.95% |
| OS X | 28.28% |
| Unknown | 2.37% |
| Chrome OS | 1.73% |
| Linux | 1.67% |
| FreeBSD | 0.01% |
Europe
| OS | Market Share |
| Windows | 76.51% |
| OS X | 14.88% |
| Unknown | 3.42% |
| Linux | 2.76% |
| Chrome OS | 2.43% |
| FreeBSD | 0.01% |
Finding
As of 2024, Windows is the leading operating system in the desktop operating system market segment, with more than 50% of the market share in every region.
Mobile Operating System Market
Worldwide
| OS | Market Share |
| Android | 70.79% |
| iOS | 28.46% |
| Samsung | 0.39% |
| Unknown | 0.17% |
| KaiOS | 0.13% |
| Windows | 0.02% |
Americas
| OS | Market Share |
| iOS | 59.09% |
| Android | 40.56% |
| Samsung | 0.24% |
| Windows | 0.05% |
| Linux | 0.02% |
| KaiOS | 0.01% |
Africa
| OS | Market Share |
| Android | 85.18% |
| iOS | 12.49% |
| Unknown | 1.99% |
| Samsung | 0.11% |
| KaiOS | 0.09% |
| Series 40 | 0.04% |
Asia
| OS | Market Share |
| Android | 78.42% |
| iOS | 20.78% |
| Samsung | 0.45% |
| KaiOS | 0.24% |
| Unknown | 0.07% |
| Nokia Unknown | 0.01% |
Australia And Oceania
| OS | Market Share |
| iOS | 54.29% |
| Android | 44.7% |
| Samsung | 0.09% |
| Windows | 0.06% |
| Unknown | 0.02% |
| BlackBerry os | 0.01% |
Europe
| OS | Market Share |
| Android | 67.41% |
| iOS | 32.08% |
| Samsung | 0.45% |
| Windows | 0.03% |
| Linux | 0.01% |
| Unknown | 0.01% |
Finding
In 2024, both iOS and Android in the mobile OS segment almost equally share the market in all regions.
Worldwide
| OS | Market Share |
| iOS | 52.18% |
| Android | 47.64% |
| Linux | 0.12% |
| Unknown | 0.03% |
| BlackBerry OS | 0.02% |
| Windows | 0.02% |
Americas
| OS | Market Share |
| iOS | 57.32% |
| Android | 42.4% |
| Linux | 0.19% |
| BlackBerry OS | 0.03% |
| Unknown | 0.02% |
| Windows | 0.02% |
Africa
| OS | Market Share |
| Android | 84.41% |
| iOS | 15.3% |
| Unknown | 0.19% |
| Linux | 0.05% |
| Windows | 0.02% |
| BlackBerryOS | 0.02% |
Asia
| OS | Market Share |
| iOS | 57.19% |
| Android | 42.72% |
| Linux | 0.06% |
| Unknown | 0.01% |
| BlackBerry OS | 0.01% |
| Windows | 0.01% |
Australia And Oceania
| OS | Market Share |
| iOS | 79.77% |
| Android | 19.95% |
| Linux | 0.19% |
| BlackBerry OS | 0.05% |
| Windows | 0.03% |
| Unknown | 0.01% |
Europe
| OS | Market Share |
| Android | 52.62% |
| iOS | 47.16% |
| Linux | 0.13% |
| Unknown | 0.04% |
| BlackBerry OS | 0.02% |
| Windows | 0.02% |
Finding
In the Tablet operating system market, iOS is leading in almost all regions, with more than 50% market share compared to the commonly used Android OS.
Worldwide
| OS | Market Share |
| Mobile | 59.91% |
| Desktop | 37.89% |
| Tablet | 2.2% |
Americas
| OS | Market Share |
| Desktop | 50.73% |
| Mobile | 46.47% |
| Tablet | 2.8% |
Africa
| OS | Market Share |
| Mobile | 76.18% |
| Desktop | 22.43% |
| Tablet | 1.39% |
Asia
| OS | Market Share |
| Mobile | 68.63% |
| Desktop | 29.53% |
| Tablet | 1.84% |
Europe
| OS | Market Share |
| Mobile | 51.34% |
| Desktop | 46.23% |
| Tablet | 2.43% |
Australia And Oceania
| OS | Market Share |
| Desktop | 52.41% |
| Mobile | 43.52% |
| Tablet | 4.07% |
Finding
In terms of Desktop, Mobile, and Tablet Market share, all of these will be more or less dominant in all regions in 2024.
Windows
| OS | Market Share |
| Win10 | 69.04% |
| Win11 | 26.72% |
| Win7 | 3.04% |
| Win8.1 | 0.44% |
| WinXP | 0.39% |
| Win8 | 0.29% |
Apple
| OS | Market Share |
| macOS Catalina | 94.24% |
| macOS High Sierra | 1.38% |
| macOS Mojave | 0.98% |
| macOS Sierra | 0.96% |
| OS X EI Capitan | 0.81% |
| OS X 10.10 | 0.57% |
iOS
| OS | Market Share |
| iOS 17.3 | 49.74% |
| iOS 17.4 | 7.1% |
| iOS 16.6 | 5.06% |
| iOS 16.7 | 4.57% |
| iOS 17.2 | 4.05% |
| iOS 15.8 | 3.63% |
Android
| OS | Market Share |
| 13.0 | 26.3% |
| 12.0 | 16.97% |
| 14.0 | 16.22% |
| 11.0 | 16.2% |
| 10.0 | 8.82% |
| 9.0 Pie | 5.66% |
Microsoft Windows Operating System Statistics
- In January 2024, Windows 10 held the largest market share among Microsoft’s versions, accounting for 66.47%.
- As of December 2023, the older Windows XP still retained 0.64% of the market share.
- Microsoft Windows is the leading operating system for desktops and laptops, commanding 73% of the global market.
- 95% of G2 reviewers rated Windows 11 with 4 or 5 stars.
- The highest market share for Microsoft Windows was 89.49% in December 2021. Since then, its market share has decreased to 61.51% in the desktop OS category.
- Microsoft Windows will operate on 1.6 billion active devices globally in 2024.
- Despite the release of Windows 11, searches for Windows 10 have risen in 2024, with an average of 25 more searches per week.
- Microsoft reported sales of USD 143.015 billion in 2020, a 13.65% increase from the previous year.
- 96% of G2 reviewers found Windows 11 easy to use.
Explore More Like This
- Oracle Statistics
- Linux Statistics
- Android Statistics
- MacOS Statistics
- iOS Statistics
Android Operating System Statistics
- Android was developed by a small team of developers led by Andy Rubin, and Google acquired it in 2005 due to its potential.
- Known for its open-source nature, Android allows developers and smartphone brands to modify it, contributing to its dominance in the smartphone OS market.
- In 2023, 41.2% of the global population used the Android operating system.
- There were approximately 3.3 billion Android users worldwide in 2023, with 2.8 billion active consumers.
- As of 2024, 71.74% of mobile phones globally operate on Android.
- In January 2021, Android 10 held its highest market share at 43.13%.
- 97% of G2 reviewers rated Android 4 or 5 stars.
- Samsung remains the largest vendor of Android devices, commanding a 34% market share, followed by Xiaomi at 14%.
- The Google Play Store had 2.67 million apps available as of March 2023.
- 92% of Android users would recommend the operating system to others, and 93% feel that it meets their needs effectively.
Mac OS X Operating System Statistics
- As of December 2023, macOS held a 6.57% market share globally.
- In the United States, macOS’s market share increased from 12.17% in December 2022 to 22.08% in May 2023. However, by December
- 2023, this had decreased to 14.03%.
- Between July 2021 and December 2023, macOS maintained a market share below 1% in India.
- In 2023, 100 million people globally were using macOS.
- 88% of G2 reviewers rated macOS Mountain Lion with four or five stars.
- 66% of macOS users are women, making them the majority of the Mac consumer base.
- The United States accounts for 40% of Apple’s global Mac revenue.
Apple iOS Operating System Statistics
- Apple iOS is the operating system for Apple’s mobile devices, including the iPhone and iPad. The system is regularly updated to enhance security and performance.
- As of December 2023, iOS held 17.71% of the global mobile operating system market share. In the United States, its market share reached 26.67%.
- In India, iOS has maintained a smaller market share, standing at 3.23% as of January 2024, and it has consistently remained under 4% since 2018.
- Temu was the most downloaded free app on the App Store in 2023, with over 100 million active users in the US.
- 97% of G2 reviewers rated Apple iOS with 4 or 5 stars in their reviews.
- 90% of iOS users believe that the operating system is moving in the right direction, according to user feedback.
- Apple iOS held 19.3% of the market share in China in 2020.
- Over 1 billion people currently use iOS on their iPhones worldwide.
- In the United States, iPhones account for 65% of all smartphone sales.
- iOS reached its highest global market share of 26.28% in 2020.
Conclusion
As proven in these Operating Systems Statistics, operating systems are the foundation upon which our digital world is built. They are the invisible conductors, the tireless workhorses, and the ever-evolving guardians of our digital experiences.
As technology continues to advance, operating systems will adapt and innovate, ensuring a smooth and secure journey in the ever-expanding digital landscape.
Sources
Pramod Pawar
Pramod Pawar brings over a decade of SEO expertise to his role as the co-founder of 11Press and Prudour Market Research firm. A B.E. IT graduate from Shivaji University, Pramod has honed his skills in analyzing and writing about statistics pertinent to technology and science. His deep understanding of digital strategies enhances the impactful insights he provides through his work. Outside of his professional endeavors, Pramod enjoys playing cricket and delving into books across various genres, enriching his knowledge and staying inspired. His diverse experiences and interests fuel his innovative approach to statistical research and content creation.
More Posts By Pramod Pawar
2024
Самые популярные ОС в мире
По итогам 2024 года различные версии операционных систем Windows заняли практически три четверти мирового рынка программных платформ для персональных компьютеров. Причем корпорация Microsoft укрепляет позиции в данном сегменте. Об этом говорится в исследовании StatCounter, с результатами которого TAdviser ознакомился в начале февраля 2025 года.
К концу 2024-го, по оценкам, суммарная доля разных ОС Windows в глобальном масштабе достигла 73,38%. Для сравнения, годом ранее этот показатель равнялся 72,72%. На этом фоне сдает позиции платформа macOS, которая применяется на компьютерах Apple: если в 2023 году она занимала 16,38% мирового рынка, то год спустя — 14,16%. Доля операционных систем с ядром Linux в годовом исчислении поднялась с 3,83% до 4,13%. Позиции Chrome OS ослабли с 2,42% до 1,89%. В ходе исследования аналитикам StatCounter не удалось определить тип ОС примерно на 6,43% персональных компьютеров с подключением к интернету. Вместе с тем доля FreeBSD и прочих операционных систем колеблется около нулевой отметки.

Если рассматривать различные версии Windows, то по состоянию на конец 2024 года наибольшей популярностью пользуется Windows 10 с долей 62,7%. Годом ранее показатель был выше — 67,42%. Вместе с тем на фоне грядущего окончания поддержки этой платформы в октябре 2025 года растет популярность Windows 11: ее доля за год увеличилась с 26,54% до 34,12%. Аналитики полагают, что вынужденный переход на Windows 11 может подтолкнуть сотни миллионов пользователей компьютеров по всему миру к обновлению своих устройств. Кроме того, к концу 2024 года в общем объеме Windows-компьютеров примерно 2,41% использовали Windows 7. Операционная система Windows 8.1 инсталлирована на 0,3% таких машин, а на 0,24% применяется Windows XP, выпущенная в 2001 году. Еще 0,23% составляют прочие редакции ОС Microsoft, включая Windows 8.
В России к концу 2024 года операционные системы Windows занимали 87,58% рынка. Для сравнения, годом ранее этот показатель равнялся 87,77%. Таким образом, за год распространенность платформ Microsoft в РФ снизилась незначительно. При этом macOS нарастила долю с 5,29% до 5,61%. Позиции Linux, по данным StatCounter, укрепились с 2,15% до 2,38%. Однако, судя по опубликованной статистике, популярность Linux в России не столь высока, как во всем мире в целом. Вместе с тем использование Chrome OS, FreeBSD и других платформ в российском ПК-сегменте близко к нулю. Еще на 4,41% компьютеров определить тип установленной ОС не удалось.
Как работает институт «цифровых атташе», и в каких странах ждут российских ИТ-экспортёров. Интервью с Владимиром Дождёвым, Минпромторг 7.2 т

Среди различных редакций Windows в России, как и во всем мире, доминирует Windows 10, доля которой по состоянию на конец 2024 года составляла 76,47%. Причем за год этот показатель снизился незначительно: в конце 2023-го он оценивался в 76,97%. Вместе с тем доля Windows 11 в годовом исчислении подскочила с 12,62% до 18,07%. Произошло это за счет ослабления позиций Windows 7, распространенность которой уменьшилась практически в два раза — с 8% до 4,1%. Еще 0,66% пришлось на Windows 8.1, примерно 0,38% — на Windows ХР, 0,25% — на Windows 8.
В целом, данные StatCounter говорят об устойчивой тенденции по переходу ПК-пользователей на Windows 11. Для работы с этой платформой необходим доверенный платформенный модуль (TPM) версии 2.0, а поэтому во многих случаях требуется обновление аппаратной части, что стимулирует продажи персональных компьютеров в глобальном масштабе. Аналитики ожидают, что в 2025 году темпы перехода на Windows 11 ускорятся.[1]
Вышла бесплатная ОС для обучения, творчества и работы Endless OS
В середине июня 2024 года компания Endless OS Foundation объявила о выпуске общедоступной версии бесплатной ОС для обучения, творчества и работы Endless OS. Данная ОС обеспечивает полный набор инструментов для работы прямо с момента установки, включая Endless Key для учебы и исследований, офисный пакет LibreOffice, браузер Chromium, аудиоплеер Decibels, видеоплеер Videos и ряд других специализированных программ. Подробнее здесь.
Доля Linux на мировом рынке ОС впервые перевалила за 4%
По состоянию на февраль 2024 года доля платформ с ядром Linux на мировом рынке операционных систем для персональных компьютеров впервые превысила 4% и составила приблизительно 4,03%. Для сравнения, годом ранее этот показатель равнялся 2,94%. Такие данные в начале марта 2024-го приводит аналитический сервис Statcounter.
Отмечается, что указанные цифры не учитывают долю Chrome OS — программной платформы Google, которая также основана на ядре Linux. В феврале 2024-го Chrome OS занимала 2,27% глобального рынка ОС для ПК. Таким образом, в целом на обычные Linux-системы и Chrome OS пришлось в общей сложности 6,3% рассматриваемого рынка. Одна из причин роста популярности Linux заключается в том, что пользователи по всему миру более охотно переходят на свободное ПО. Кроме того, экосистема этой ОС продолжает постоянно развиваться.

Самой распространенной ОС для персональных компьютеров остается Windows с показателем 72,17% по состоянию на февраль 2024-го. Годом ранее эти платформы удерживали 71,78%. На втором месте находится macOS, доля которой за год снизилась с 16,26% до 15,42%.
Если рассматривать российский рынок, то доля Linux в феврале 2024 года достигла 2,34% против 2,07% годом ранее. В РФ на фоне сложившейся геополитической обстановки идет активное импортозамещение ПО, включая внедрение отечественных платформ с ядром Linux. Вместе с тем наибольшей популярностью продолжает пользоваться Windows с показателем приблизительно 86,82%. Причем, согласно данным Statcounter, в феврале 2023 года это значение равнялось 82,09%. В то же время macOS в России сдает позиции: доля платформы Apple в годовом исчислении снизилась с 7,74% до 5,22%. Распространенность Chrome OS на российском рынке невысока — только 0,02%, причем за год этот показатель не изменился.[2]
2023
Рост объема мирового рынка ОС для интернета вещей до $0,6 млрд
В 2023 году расходы на глобальном рынке операционных систем для интернета вещей (IoT) составили около $0,6 млрд. Потребность в таких платформах устойчиво растет, что объясняется стремительным развитием экосистемы IoT в целом. Отраслевые тенденции рассматриваются в обзоре Market Research Future, опубликованном в начале декабря 2024 года.
Операционные системы IoT — это специализированные программные платформы, предназначенные для управления и контроля огромного количества всевозможных устройств. Эти ОС оптимизированы для масштабируемости и обеспечения производительности при ограниченных вычислительных ресурсах. Такие системы применяются в различных секторах, включая умные дома, промышленную автоматизацию, здравоохранение и транспорт. Например, в смарт-жилищах IoT-системы управляют термостатами и камерами наблюдения, в промышленных условиях — средствами автоматизации и мониторинга.

Распространение подключенных устройств в различных отраслях является основным драйвером рынка операционных систем IoT. По мере того, как такое оборудование становится все более распространенным, спрос на специализированные программные платформы растет экспоненциально. Увеличивающаяся потребность в обработке данных в реальном времени и в периферийных вычислениях является еще одним значимым драйвером отрасли. Операционные системы IoT обеспечивают обработку информации на уровне устройств, сокращая задержку и повышая общую эффективность инфраструктур. Это особенно важно в таких приложениях, как автономные транспортные средства и промышленные системы управления.
Проблемы кибербезопасности также стимулируют рынок. По мере увеличения количества IoT-устройств расширяется потенциальная область для кибератак. На этом фоне разработчики сосредоточены на внедрении новых защитных функций.
Но существуют и сдерживающие факторы. Экосистема IoT сильно фрагментирована: существуют многочисленные протоколы и устройства, работающие на разных платформах. Эта фрагментация может создавать проблемы совместимости и препятствовать бесшовной интеграции. Операционные системы IoT, как отмечается, должны поддерживать широкий спектр аппаратных и коммуникационных стандартов, что усложняет разработку и может ограничивать их эффективность. Такое отсутствие стандартизации приводит к увеличению затрат и замедлению темпов внедрения. Кроме того, многие устройства IoT, особенно те, которые предназначены для маломощных приложений, имеют ограниченные вычислительные ресурсы. Поэтому необходима глубокая оптимизация ОС для обеспечения нужного баланса между функциональностью и требованиями к аппаратной части.
В исследовании сказано, что самой распространенной платформой на рассматриваемом рынке является Windows 10 IoT. С географической точки зрения лидирует Северная Америка благодаря развитой инфраструктуре интернета вещей и присутствию многих крупных ИТ-компаний. Среди значимых игроков отрасли названы:
- Google;
- Apple;
- BlackBerry;
- Arm;
- Wittenstein;
- Mentor Graphics Corporation;
- Green Hills Software;
- Sysgo AG;
- Microsoft;
- Wind River;
- Silicon Labs;
- «Лаборатория Касперского»;
- Canonical.
По итогам 2024 года выручка в сегменте операционных систем для интернета вещей оценивается в $0,74 млрд. Аналитики Market Research Future полагают, что в дальнейшем среднегодовой темп роста в сложных процентах (показатель CAGR) составит 20,55%. В результате, к 2032 году затраты в глобальном масштабе могут увеличиться до $3,3 млрд.[3]
Рост объема мирового рынка серверных ОС на 12% до $17,3 млрд
В 2023 году затраты на глобальном рынке серверных операционных систем составили $17,3 млрд. Для сравнения, годом ранее объем отрасли оценивался в $15,5 млрд. Таким образом, рост зафиксирован на уровне 12%. Сектор демонстрирует устойчивую положительную динамику, о чем говорится в обзоре Market Research Future, опубликованном в начале декабря 2024 года.
Одним из основных драйверов рынка является продолжающееся развитие облачных платформ и инфраструктур центров обработки данных. Облачные провайдеры и операторы дата-центров по всему миру активно наращивают мощности, добавляя серверы и системы хранения данных. При этом требуются надежные и эффективные серверные ОС для управления ресурсами и поддержания различных рабочих нагрузок. Такие программные платформы предлагают специализированные средства для обеспечения оптимальной производительности, масштабируемости и безопасности. Поскольку предприятия и организации продолжают переносить свои операции в облако, растет спрос на современные серверные ОС. Эта тенденция особенно заметна в секторах, где преобладают задачи с интенсивным использованием данных.

Положительное влияние на отрасль оказывает интеграция средств искусственного интеллекта и машинного обучения. Эти технологии позволяют автоматизировать определенные задачи, оптимизировать распределение ресурсов и повышать эффективность обработки данных. Алгоритмы ИИ могут прогнозировать и управлять системными нагрузками, улучшать функции безопасности путем интеллектуального обнаружения угроз и поддерживать аналитику в реальном времени. Серверные операционные системы c инструментами ИИ становятся все более востребованными в различных областях.
Растущее внимание к кибербезопасности является еще одним фактором, стимулирующим рынок серверных ОС. По мере того, как киберугрозы становятся все более сложными, потребность в защищенных платформах усиливается. Современные ОС содержат расширенные функции безопасности для защиты конфиденциальных данных и поддержания целостности системы. Такие инструменты, как улучшенный контроль доступа, шифрование и средства обнаружения вторжений, становятся неотъемлемой частью серверных систем.
По типу ОС рынок сегментирован на Windows, Linux, Unix и другие платформы. По оценкам Market Research Future, различные варианты Linux занимают лидирующее положение. Ведущие игроки отрасли вкладывают значительные средства в исследования и разработки с целью расширения возможностей своих продуктов. Среди значимых представителей рынка названы:
- Microsoft;
- Red Hat;
- IBM;
- Google;
- Amazon Web Services (AWS);
- Fujitsu;
- NEC;
- Apple;
- НРЕ;
- Dell;
- Canonical.
В географическом плане доминирует Северная Америка благодаря развитой инфраструктуре дата-центров и значительным инвестициям в технологический сектор. Кроме того, здесь сосредоточены площадки ведущих облачных провайдеров — Amazon Web Services (AWS), Microsoft Azure и Google Cloud. Азиатско-Тихоокеанский регион, движимый цифровизацией и правительственными инициативами, демонстрирует самые высокие темпы роста. В Европе также наблюдается расширение отрасли, что объясняется цифровой трансформации бизнеса, которая сопровождается переносом рабочих нагрузок в облако, внедрением ИИ-решений и средств аналитики больших данных.
Специалисты Market Research Future полагают, что в дальнейшем среднегодовой темп роста в сложных процентах (CAGR) на мировом рынке серверных операционных систем составит 12,2%. Таким образом, к 2032 году затраты в глобальном масштабе, согласно представленным оценкам, могут достичь $43,6 млрд.[4]
2021: Windows 10 доминирует на компьютерах
Самые популярные операционные системы на компьютерах в мире по годам на видео ниже.
2017
Доля Windows 10 — 33%, Windows 7 — 43%
К концу 2017 года Windows 10 не смогла опередить Windows 7 и стать самой популярной компьютерной операционной системой в мире. Об этом свидетельствуют данные сервиса NetMarketShare, который берет в рассмотрение данные 160 млн уникальных пользователей, просматривающих более 40 тыс. веб-ресурсов по всему миру.
По итогам декабря 2017 года Windows 10 оказалась установлена почти на 33% десктопов и ноутбуков в глобальном масштабе против 23% годом ранее. Доля Windows 7 хотя и сократилась за год — с 47,7% до 43,1%, но все равно осталась выше, чем у более свежей платформы.

Динамика изменения долей компьютерных ОС, данные NetMarketShare
В ноябре 2017 года Microsoft сообщила об использовании Windows 10 на 600 млн устройств. Речь идет об устройствах, которыми активно пользуются люди не менее чем один раз в месяц. К такой электронике относятся компьютеры, планшеты, смартфоны, игровые консоли Xbox One, очки HoloLens и 84-дюймовые моноблоки Surface Hub.
Ранее в Microsoft прогнозировали, что к 2017-2018 годах в мире будет более 1 млрд устройств, которые будут использовать операционную систему Windows 10. Однако впоследствии компания отказалась от этого прогноза.
К концу 2017 года в активе Windows XP значилось 5,2% рынка операционных систем для ПК против 9,3% в 2016-м. Показатель присутствия Windows 8.1 уменьшился с 7,25% до 5,7%.
Все версии Windows к 31 декабря 2017 года установлены на 88,5% персональных компьютеров в мире. Доли macOS и Linux составили лишь 9% и 2,1% соответственно.
Сервис StatCounter, который учитывает более 15 млрд просмотров веб-страниц на 3 млн сайтах, приводит следующую статистику: под управлением Windows к концу декабря 2017 года работало 82,7% компьютеров в мире, на macOS — 13%. Около 89% российских пользователей ПК выбирают Windows, а среди них лидируют владельцы оборудования на Windows 7, доля которых превысила 50%. Второе место по распространению заняла ОС Windows 10 с результатом в 31,5%, третье — Windows 8.1 (8,9%). Далее расположились Windows XP (5,3%) и Windows 8 (2,6%).[5]
Конец эпохи: Windows больше не самая массовая ОС в интернете
Сайт StatCounter, специализирующийся на анализе веб-трафика, обнародовал весной 2017 года данные мирового рейтинга использования операционных систем. Как выяснилось, в марте 2017 г. по статистике использования интернета совокупно на настольных ПК, ноутбуках, планшетах и смартфонах мобильная ОС Android впервые в истории обогнала ОС Windows[6].
По данным исследователей, в марте 2017 г. Andoid занимал 37,93% интернет-рынка, в то время как Windows – 37,91%. Далее в рейтинге следует iOS.
Некие неизвестные аналитикам операционные системы заняли 2,85% рынка (более всего их пользователей находится в африканской Республике Мали и Папуа – Новой Гвинее), а ОС Linux – 0,75%.
В феврале 2017 г., по данным StatCounter, на Windows работали 38,6% интернет-пользователей, а на Android – 37,4%.
На карте, составленной экспертами, также есть данные об использовании ОС жителями территории России. Российские пользователи предпочитают выходить в интернет через Windows (70,28%), Android (13,76%), iOS (7,72%), OS X (5,08%) и «неизвестные операционные системы» — 1,82%.
Аналитики отмечают, что Windows по-прежнему доминирует на мировом рынке операционных настольных систем — ПК и ноутбуков – ОС на этих девайсах использует 84% посетителей интернета. «Windows выиграла войну за декстопы, но поле битвы изменилось», — резюмировал глава StatCounter.
По оценке аналитиков, наиболее крепко ОС Windows держится на рынке Северной Америки, где она сохранила лидерство на всех платформах – ее доля составила 39,5%, далее следует iOS (25,7%) и Android (21,2%).
В Европе Windows практически в два раза обгоняет Android — 51,7% против 23,6%. По уже понятным причинам позиции Android оказались прочнее всего в странах Азии. Здесь мобильная ОС занимает 52,2% в сравнении с 29,2% Windows.
2012
Январь 2012
ОС Windows XP от Microsoft вновь потеряла большую долю рынка в декабре 2011 года, поскольку пользователи продолжали переход с операционной системы десятилетней давности на Windows 7.
Согласно данным компании Net Applications, при среднем арифметическом в 46,5%, Windows XP потеряла 2,4 процентных пункта к концу декабря, что стало очередным минимумом для «пожилой» ОС. Это месячное падение почти полностью соответствует октябрьской отметке в 2,5 пункта. В течение четырёх месяцев, с сентября по декабрь, по состоянию на 1 сентября XP потеряла более 11%, упав почти на шесть процентных пунктов в течение этого периода.
За предыдущие четыре месяца — с мая по август, XP потеряла лишь 3,4 пункта или около 8,5% доли, которой она владела по состоянию на 1 мая. Выгоду от падения доли XP получила Windows 7, именно она была бенефициаром этого снижения, набирая 2,4 процентных пункта в прошлом месяце и достигнув доли в 37%. И в течение тех четырёх месяцев, когда XP потеряла 5,9 баллов, Windows 7 подросла на 6,4 пункта, выбрав на себя люфт не только этой старой ОС, но и Windows Vista.
Если сложившаяся тенденция повторится, в январе Windows XP потеряет ещё большую часть: в 2009 и 2010 годах доля XP падала на 40%-48% больше в январе, в сравнении с предыдущим месяцем. Вероятно, это происходило из-за покупки в конце года новых ПК, укомплектованных Windows 7. Учитывая это, в текущем месяце доля XP может упасть ещё на 3,5 пункта.
Нарастающее количество отказов от использования XP доказывает — пользователи получили сигнал Microsoft о том, что эта операционная система должна быть предана забвению. В июле Microsoft дала понять клиентам: «настало время двигаться дальше», напоминая всем, что поддержка этой ОС будет прекращена в апреле 2014 года. Перед этим команда разработки Internet Explorer, объясняя, почему она не будет запускать IE9 на XP, оценила эту ОС как «наименьший общий знаменатель».
Два месяца назад, Microsoft тихо празднуя 10-летие запуска XP в розницу, для продвижения Windows 7 и свёртывания XP запустила рекламную компанию под девизом: «Кто не идёт вперёд, пятится назад». Из 12,4 процентных пунктов, которые XP потеряла в последние 12 месяцев, почти половина — в последние четыре. Это означает, что поспешное ослабление XP изменит дату потери ею своего ведущего места в экосистеме Microsoft.
Становятся заметными прогнозы на основе данных Net Applications, говорящие о том, что Windows 7 станет самой широко распространённой версией в апреле — на несколько месяцев раньше, в отличие от предыдущих оценок. К тому времени дебютирует Windows 8. По мнению аналитика издания ComputerWorld Грега Кейцера (Gregg Keizer), октябрь кажется наиболее вероятным периодом начала её продаж. Windows 7 уже захватит от 50% до 52% рынка.
В прошедшем месяце доля Windows 8 незначительно выросла — до 0,05% с 0,03% в ноябре или до пяти ПК из каждых 10 тыс. Это операционная система ещё не достигла стадии бета — Microsoft планирует выпуск релиза на конец февраля.

Из графика видно как идут навстречу друг другу доли Windows XP и Windows 7. Последняя, как ожидается, станет №1 в апреле 2012 года. Данные: Net Applications
2011
С сентября по декабрь 2011 года включительно усилился отток пользователей ОС Windows XP по мере их перехода на Windows 7. Доля Windows 8 достигла 0,05%.
Октябрь 2011
На мировом рынке операционных систем продолжается стремительное падение Windows XP: в октябре этого года система с десятилетней историей показала максимальное падение за все время своего существования. По данным компании Net Applications, падение XP во многом обусловлено растущей популярностью Windows 7, которая на данный момент управляет каждым третьим компьютером в мире.
Доля Windows XP в октябре уменьшилась на 2,5% и составила 48%. В то же время доля Windows 7 выросла на 2,2% до 34,6%. XP в последние два месяца показало беспрецедентное снижение на 4,4% и более чем на 7% от своей доли в августе. Скорее всего, ускорило этот процесс заявление Microsoft, что XP, впервые вышедшая в 2001 году, больше не будет поддерживаться корпорацией.
Динамика долей ОС семейства Windows на мировом рынке 2009-2011 годы

Источник: Net Applications, октябрь 2011 года
В июле Microsoft сообщила клиентам, что «пришло время отказаться от XP», напомнив, что поддержка этой ОС окончательно прекратиться через три года. Ранее в этом году топ-менеджеры подразделения, отвечающего за разработку браузера Internet Explorer (браузер) (IE), также сообщили, что на базе XP уже не смогу работать браузеры от версии IE9 и выше.
По словам Майкла Силвера (Michael Silver), аналитика Gartner, этот месседж дошел до большинства компаний. «По нашим оценкам, 10% предприятий уже мигрировали на «семерку», 55% — находятся в процессе миграции, 25% — только начинают ее, а еще 10% пока не собираются переходить на Windows 7», — отметил он. . Дедлайном для отказа от Windows XP является апрель 2014 года: после этой даты корпорация перестанет выпускать патчи для этой версии. «Предприятия просто не смогут использовать ОС, не отвечающую требованиям безопасности», — считает Силвер.
Усложняет процесс падения XP и восхождения 7 еще и то обстоятельство, что Microsoft уже занимается подготовкой новой версии, Windows 8. Как и многие другие аналитики, Силвер не испытывает оптимизма относительно потенциального успеха этой версии на корпоративном рынке, поскольку большинство компаний уже озадачено переходом на «семерку». Он сказал, что предприятия будут испытывать «усталость от обновления», так что выход «восьмерки» вряд ли вызовет большой энтузиазм.
Также в этом отчете уделяется внимание и злополучной Windows Vista, релиз которой состоялся до седьмой версии, в начале 2007 года. По данным Net Applications, доля Vista на мировом рынке ОС в октябре составила всего 8,9%, она снизилась на 1% за последний квартал и в целом на 4,5% за весь последний год. Этой ОС так и не удалось преодолеть барьер в 20% рынка: в октябре 2009 года ее доля достигла 19,1%, но в том же месяце вышла Windows 7.
2010
Январь 2010


Июль 2010
По состоянию на июль 2010 г. операционные системы семейства Windows были установлены на 91,32% действующих в мире компьютеров, тогда как доля Mac OS X составила 5,06% и Linux — 0,93%. Другие платформы заняли 2,69%.

Источник: Net Applications
В июле 2010 г. число компьютеров в мире, на которых установлена операционная система Windows 7, впервые превысило число компьютеров с ее предшественницей. Доля первой достигла 14,46%, тогда как доля Windows Vista в июле составила 14,34%. Месяцем ранее системам принадлежало 13,70% и 14,68% инсталлированной базы, а в начале года — 7,57% и 17,47% соответственно. Таким образом, налицо постепенное распространение Windows 7, которая замещает предыдущую версию платформы, сообщает Net Applications.

Источник: Net Applications
Тем временем выпущенная в 2001 г. операционная система Windows XP по-прежнему продолжает занимать львиную долю мировой инсталлированной базы систем семейства Microsoft Windows, которая составляет 61,87%, более чем в два раза больше по сравнению с Windows 7 и Vista, вместе взятыми. Однако доля XP также сокращается и более стремительными темпами в сравнении с Vista.
В июле 2010 года в Microsoft объявили о том, что к настоящему моменту реализовали 175 млн лицензионных копий Windows 7, вышедшей в продажу в октябре 2009-го.
Доход вендоров на мировом рынке операционных систем в 2010 году составил 30,4 млрд. долл., что на 7,8% выше 2009 года, сообщает Gartner. Серверная Linux и Mac OS были самыми быстро растущими подсегментами среди серверных и клиентских ОС соответственно, и Microsoft сохранила свое лидирующее положение на рынке ОС в целом с общей долей 78,6%.
В сегменте клиентских ОС Mac OS была самым быстро растущим подсегментом в 2010 году ввиду значительного роста поставок настольных компьютеров и ноутбуков Macintosh, хотя и с гораздо более низкой базы. Клиентская Windows продолжала доминировать в сегменте клиентских ОС с ростом выше 5%, в том числе благодаря принятию Windows 7 в свете скорого окончания поддержки XP.
Microsoft имела самую большую долю на мировом рынке ОС в 2010 году — 78,6% с огромным отрывом от соперников. Второе и третье место занимали IBM и HP с долей рынка 7,5% и 3,7% соответственно. Oracle поднялась с восьмого места в 2009 г. до четвертого в 2010-м благодаря покупке Sun Microsystems с ее ОС Solaris в апреле 2009 г.
Клиентская ОС Windows показала более высокий рост (на 9,2%), чем серверная ОС Windows (на 7,5%). Новая волна обновлений ПК после рецессии была главным источником успеха клиентской Windows. Кроме того, Windows 7 была принята рынком как преемник Vista и XP. Ожидаемое окончание срока поддержки XP в начале 2014 года подтолкнуло организации ускорить переход на Windows 7 во второй половине 2010 г.
Среди трех ОС, которыми владеет IBM, AIX показала самый высокий рост (на 9,2%) благодаря популярности линейки Power System. Консолидация платформ System p и System i и стратегия активного продвижения AIX привели к слабому росту System i в 2010 году (на 2,7%).
HP-UX сумела сохранить умеренный рост (на 3,7%). Однако доход HP от проприетарной Unix и других проприетарных ОС продолжал снижаться ввиду прекращения разработки Tru64 и сокращения поставок критически важных для бизнеса систем, таких как NonStop и OpenVMS.
Доход Oracle от Solaris снизился на 3,2% в 2010 году ввиду неуверенности заказчиков в готовности компании продолжать разработку этой ОС, хотя Oracle сделала несколько заявлений, чтобы снять эти опасения. Версия Linux в распоряжении Oracle (известная под названием Unbreakable Linux) показала рост почти на 200% в 2010 году (хотя и с малой базы), что подтвердило стремление Oracle уменьшить свою зависимость от Unix- и Linux-версий других вендоров.
Red Hat доминировала в сегменте коммерческих серверных версий Linux. Доход от серверных лицензий на Red Hat Enterprise Linux (RHEL) в 2010 году вырос на 18,6% до 592 млн. долл., что составляет 58,2% всего рынка серверных версий Linux. По мнению Gartner, это демонстрирует, что рынок принял Linux как жизнеспособную альтернативу Unix и другим проприетарным ОС для критически важных приложений.
Mac OS показала рост дохода в 2010 году на 15,8% до 520 млн. долл. благодаря сильным продажам настольных компьютеров и ноутбуков Macintosh. Позиционирование Mac OS как «самой стильной» клиентской операционной системы привлекло лояльных пользователей на устройства и платформы Apple. Постоянные инновации компании на рынке мобильных устройств, прежде всего смартфонов и планшетов, помогли продажам других устройств Apple и продолжат двигать продажи Mac OS.
Смотрите также
- Читать дальше >>>
- Операционные системы для мобильных платформ (мировой рынок)
- Операционные системы (рынок США)
- Операционные системы (рынок России)
- Операционные системы (архитектура)
Примечания
- ↑ StatCounter
- ↑ Desktop Operating System Market Share Worldwide
- ↑ IoT Operating Systems Market Research Report
- ↑ Server Operating System Market Research Report
- ↑ NetMarketShare: Windows 10 still has quite some way to go to beat Windows 7’s share
- ↑ Конец эпохи: Windows больше не самая массовая ОС в интернете