
Dealing with high memory usage in SQL Server on Windows NT can be a challenge for administrators and database professionals. In its default configuration, SQL Server maximizes its RAM usage, taking as much as the OS is willing to allocate. Consequently, a substantial Memory Usage is expected.
However, the initial focus should be on checking for any Hard Faults in the Resource Monitor to assess potential performance issues. In this article, we will get into the details of this issue, providing insights and solutions to help you optimize memory utilization effectively. Here comes the details.
Why Is SQL Server Consuming All Memory?
When faced with high memory usage in SQL Server on Windows NT, the first step is to identify the root cause. Common factors include inefficient queries, large result sets, or inadequate server configurations.
Inefficient Queries
Memory leaks can occur due to bugs in SQL Server or poorly designed queries that lead to inefficient memory usage. It’s crucial to scrutinize your queries, ensuring they are written in an optimal manner.
-- Example of an inefficient query

SELECT * FROM MyTable WHERE SomeColumn LIKE '%search%';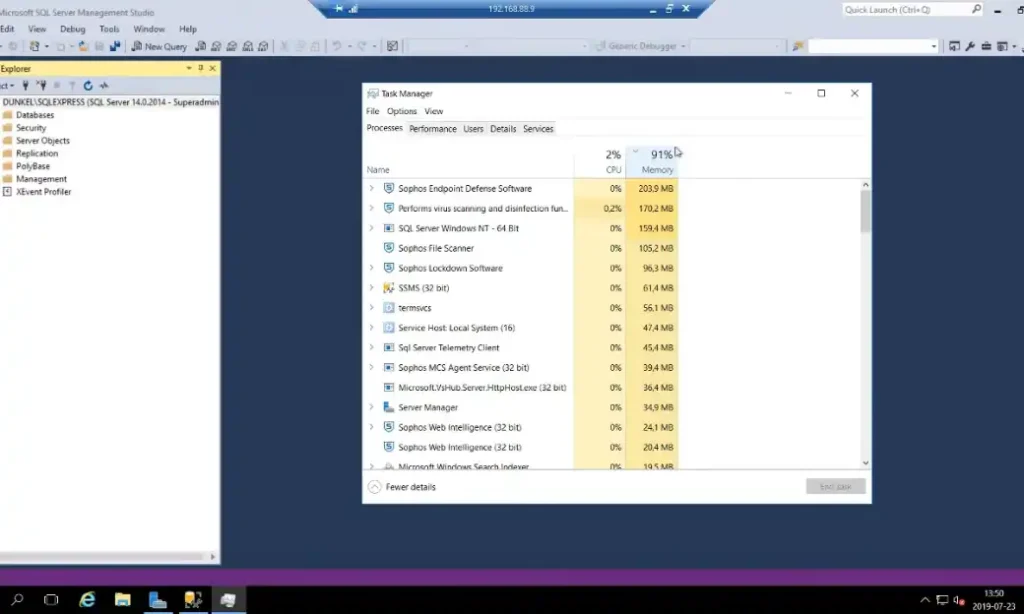
Optimize queries by using indexes, avoiding wildcard characters at the start of ‘LIKE’ clauses, and fetching only the necessary columns. These optimizations can significantly reduce memory consumption.
Large Result Sets
Handling large result sets can strain memory resources. Consider implementing pagination or limiting the number of rows fetched in a single query.
-- Fetching a limited number of rows

SELECT TOP 100 * FROM MyTable;
By fetching a smaller subset of data, you alleviate the burden on memory and enhance overall system performance.
Inadequate Server Configurations
Insufficient memory allocation in your server configuration can also lead to high memory usage. Ensure that your SQL Server instance has adequate memory resources allocated based on the server’s capacity and workload.
-- Checking current memory settings

EXEC sp_configure 'max server memory (MB)';
Adjust the ‘max server memory’ setting accordingly to allocate an optimal amount of memory to SQL Server.
How Do I Fix High Memory Usage in SQL Server?
The below methods should be a good start to fixing the high memory usage issue in SQL Server.
1. Optimize Memory Configuration
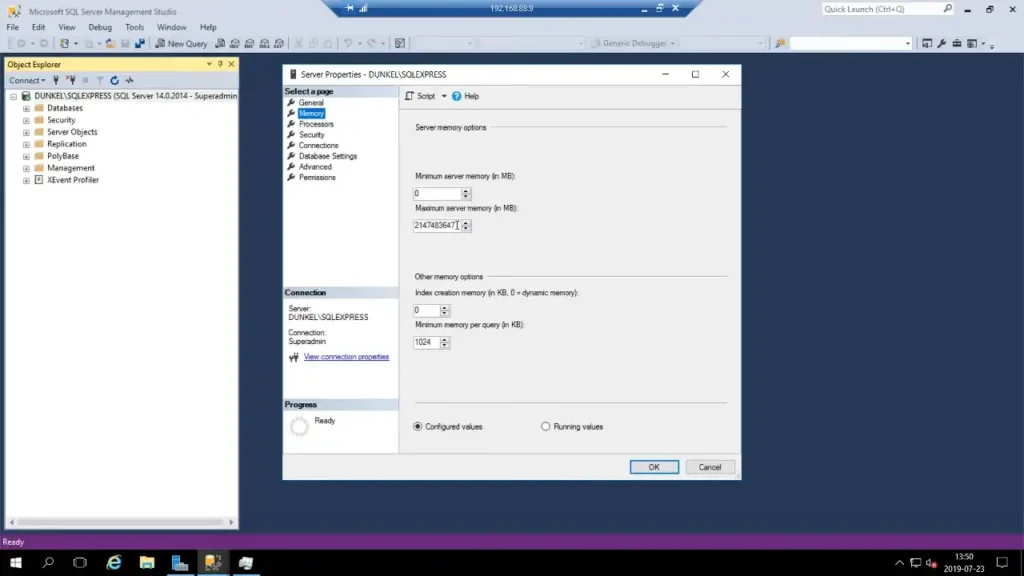
The “max server memory” option determines the maximum amount of memory that SQL Server can use. Ensure that this setting is configured appropriately to prevent SQL Server from consuming all available memory, leaving enough for the operating system and other applications.

Adjust the “max server memory” setting based on your system’s available resources and workload requirements. Strike a balance between allowing SQL Server to use sufficient memory for optimal performance and leaving enough for the operating system and other applications.
sp_configure 'show advanced options', 1;

RECONFIGURE;

sp_configure 'max server memory (MB)', <desired_memory_size>;

RECONFIGURE;
Establishing the maximum memory allocation for SQL Server is a recommended practice. A general guideline is to set it at 8-10% below the total RAM on a dedicated server and to allocate more on a desktop or shared resource server.
2. Implement a Robust Monitoring Strategy
Use tools like SQL Server Management Studio (SSMS), Performance Monitor, or third-party monitoring solutions.
SQL Server, by design, utilizes all the accessible memory it can acquire. If you wish to modify this behavior, you can navigate to SSMS (SQL Server Management Studio), access “Server Properties,” and make adjustments under the “Memory” settings.
3. Utilize Buffer Pool Extensions
Enhance SQL Server memory management with buffer pool extensions. Allocate a portion of SSD storage as an extension of the buffer pool.
ALTER SERVER CONFIGURATION SET BUFFER POOL EXTENSION ON (FILENAME = 'E:\BufferPoolExtension.bpe', SIZE = 10GB);4. Windows NT Tuning for SQL Server
Fine-tuning Windows NT settings can significantly impact how SQL Server utilizes resources. Here’s a few ways it might prove helpful.
Adjusting Page File Size
Configure the page file size based on SQL Server and Windows NT requirements. Ensure the page file is on a dedicated drive separate from the SQL Server data and log files.
Configuring Windows NT Memory Policies
Fine-tune Windows NT memory policies to optimize resource allocation. Adjust settings such as “Virtual Memory” and “System Cache” to align with SQL Server’s needs.
Exploring NUMA Architecture Considerations
For servers with Non-Uniform Memory Access (NUMA) architecture, configure SQL Server to align with NUMA node boundaries. Use max degree of parallelism and affinity mask settings accordingly.
Frequently Asked Questions
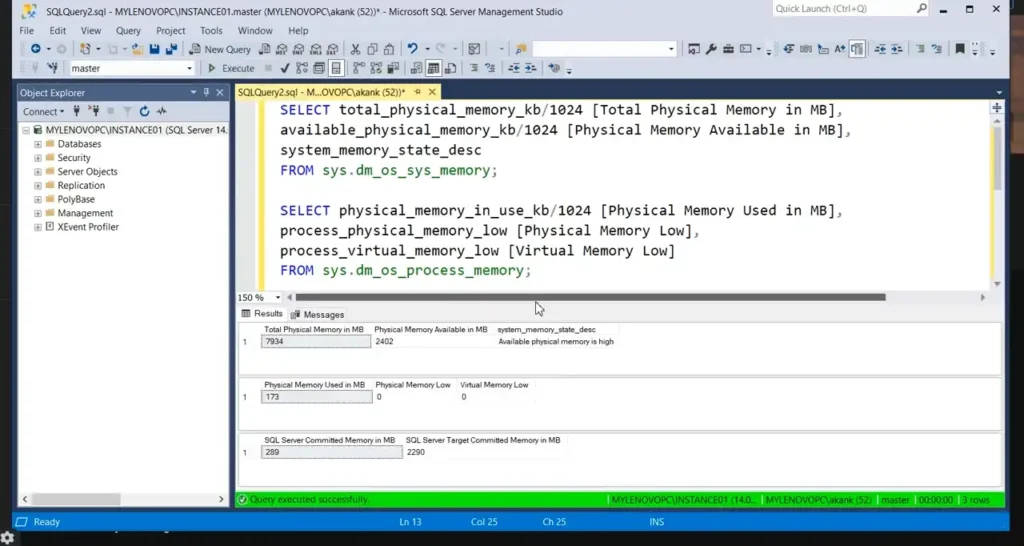
How can I monitor memory usage in SQL Server?
You can use the following query to check current memory usage:
SELECT * FROM sys.dm_os_process_memory;
Can I rely on the default SQL Server memory settings?
No, it’s recommended to customize memory settings based on your server’s specifications and workload.
Is Task Manager enough to monitor SQL Server memory usage?
While Windows Task Manager provides a general overview, it’s advisable to use SQL Server-specific tools like SSMS for detailed analysis of memory and CPU usage.
Conclusion
Optimizing SQL Server memory usage on Windows NT requires a combination of query optimization, result set management, and appropriate server configurations. By addressing these aspects, we hope you can now enhance the performance and stability of your SQL Server instance. We encourage you to share any thoughts, experiences, or questions you might have. Thanks for reading!
When managing databases in SQL Server, one of the most pressing issues that database administrators encounter is high CPU usage associated with Windows NT. This phenomenon can slow down application performance and impact overall system efficiency. Understanding the intricacies of SQL Server’s operation under Windows NT, the potential causes of high CPU usage, the diagnosing methods, and solutions that can mitigate these challenges is vital for maintaining optimal performance in database management.
Understanding SQL Server and Windows NT
SQL Server is a relational database management system (RDBMS) developed by Microsoft that supports a broad spectrum of data management tasks. It is built as a service-oriented platform that includes tools for data storage, retrieval, and analytics. On the other hand, Windows NT is an operating system architecture developed by Microsoft, known for its robust security features and multi-user capabilities, which is foundational for the Windows Server line.
When SQL Server operates on a Windows NT system or any Windows Server version using this architecture, the processes that underpin SQL operations are closely linked with the underlying OS. Misconfigurations or inefficiencies at either level can lead to performance degradation, including excessive CPU usage.
Causes of High CPU Usage
High CPU usage in SQL Server can stem from a multitude of factors. Below are some of the common causes categorized for better understanding:
1. Inefficient Queries
One of the primary contributors to high CPU usage is poorly optimized SQL queries. Queries that do not leverage proper indexing, involve complex joins, or contain suboptimal WHERE clauses can consume inordinate amounts of CPU resources. As SQL Server processes these queries, it requires more CPU cycles to execute.
2. Blocking and Deadlocking
Blocking occurs when one transaction holds locks on a database resource, and a second transaction tries to access them. Deadlocks arise when two or more transactions are waiting for each other to release locks. Both scenarios can lead to increased CPU usage as SQL Server’s lock management mechanisms work overtime to clear the backlog.
3. Improper Configuration
SQL Server’s performance is contingent on how well it is configured. Misconfigurations like insufficient memory settings or inappropriate MAXDOP (Maximum Degree of Parallelism) settings can cause SQL Server to execute processes inefficiently, leading to high CPU consumption.
4. Lack of Indexes or Fragmented Indexes
Indexes are crucial for optimizing data retrieval times. When they are lacking, SQL Server must perform full-table scans, leading to higher CPU usage. Additionally, fragmented indexes can reduce the efficiency of data access as SQL Server spends additional CPU resources on traversing the fragmented structure.
5. Resource Contention
When multiple applications or processes vie for limited CPU resources, contention arises. In a multi-tenant environment, high CPU usage can occur if one application monopolizes resources, degrading performance across the board.
6. Hardware Limitations
In some cases, the underlying hardware may simply not have sufficient resources to handle the demands being placed on it. Factors like limited CPU cores, inadequate memory, or slow disk speeds can hinder SQL performance and lead to high CPU usage.
7. Background Processes and Services
SQL Server runs various background tasks such as statistics updates, replication processes, or maintenance tasks which can occasionally spike CPU usage. Regular tasks, if not managed properly, can lead to CPU overload, especially during peak operational hours.
Diagnosing High CPU Usage
Once the symptoms of high CPU usage arise, the next step involves diagnosing the underlying causes. The following methodologies can be used effectively:
1. Monitoring Tools
Using SQL Server Management Studio (SSMS), administrators can utilize tools like Activity Monitor to review real-time CPU usage. This provides a snapshot of which processes are consuming the most resources.
2. Dynamic Management Views
SQL Server’s dynamic management views (DMVs) are pivotal for gaining insights into system performance. For example, querying sys.dm_exec_query_stats can reveal the most resource-intensive queries running on the server.
3. Execution Plans
Analyzing execution plans can help identify suboptimal queries. Query plans show how SQL Server interprets a query and outlines the steps it would take to execute it. Look for expensive operations such as hash joins or scans, which may indicate where optimizations are needed.
4. Performance Counters
Using Windows Performance Monitor or SQL Server Profiler, administrators can track specific performance counters associated with SQL Server and the operating system. Metrics such as Processor Time, SQL Server User Connections, and Buffer Cache Hit Ratio can indicate performance bottlenecks.
5. SQL Server Error Logs
Investigating SQL Server error logs can provide insights into abnormal behaviors such as frequent timeouts or deadlocks, which often correlate with high CPU usage.
Mitigating High CPU Usage
Once potential causes have been identified, administrators can adopt several strategies to alleviate high CPU issues.
1. Query Optimization
Reviewing and optimizing SQL queries can lead to significant improvements in performance. Use the following tips for optimization:
- Examine Execution Plans: Look for any operations that can be optimized.
- Indexing Strategy: Create appropriate indexes for columns that are queried frequently.
- Reduce Complexity: Simplify queries where possible, breaking them into smaller, more manageable parts.
- Use JOINs Wisely: Ensure that joins use indexed columns and avoid unnecessary data retrieval.
2. Index Management
Regularly maintaining indexes is crucial. This includes:
- Rebuilding Fragmented Indexes: SQL Server offers commands to rebuild indexes on a periodic basis.
- Removing Unused Indexes: Conversely, drop indexes that are seldom utilized to streamline query execution.
3. Configuration Tuning
Optimizing SQL Server settings can have a profound effect. Consider adjustments to:
- MAXDOP: Fine-tune the maximum degree of parallelism to optimize CPU usage during query execution.
- Memory Settings: Verify and allocate adequate memory limits for SQL Server operations.
4. Review Locking and Blocking
Implement isolation levels that minimize locking where possible, and consider techniques such as using snapshot isolation to reduce blocking instances.
5. Hardware Considerations
In some circumstances, the hardware may indeed be the bottleneck. Review the server’s specifications:
- Increase CPU Cores: More cores can help distribute workload effectively.
- Upgrade RAM: More memory allows SQL Server to cache data, minimizing reads from disk.
- SSD Upgrades: Transitioning to Solid State Drives can vastly improve I/O performance compared to traditional HDDs.
6. Scheduled Maintenance
Utilize SQL Server Agent jobs to schedule maintenance during off-peak hours, ensuring performance-hungry tasks like backups and index maintenance do not coincide with peak database usage.
7. Application Performance Monitoring
In environments with multiple applications accessing the database, utilize Application Performance Monitoring (APM) tools to discern the specific applications causing high CPU spikes and to address them accordingly.
Best Practices for Maintaining Optimal CPU Usage
To establish a robust database system, implementing best practices can preemptively mitigate high CPU issues. These include:
1. Regular Monitoring and Maintenance
Establish a routine to monitor CPU performance and server health metrics. Utilize automated scripts or tools to alert administrators of unusual increases in resource consumption.
2. Conducting Regular Audits
Perform regular audits of SQL Server configurations, query performance, and index management processes to ensure that procedures remain optimal.
3. Training and Documentation
Ensure personnel are trained in best practices for SQL query optimization, database management, and performance troubleshooting methodologically. Regularly update documentation and knowledge resources.
4. Resource Allocation
In multi-instance or multi-tenant environments, ensure fair resource allocation strategies are in place, possibly through the use of resource governor configurations to prevent one process from monopolizing CPU resources.
5. Raising Awareness of Development Changes
Developers should be aware of the performance implications of their code. Encourage practices that favor performance from the design phase, including routine use of query analysis tools.
Conclusion
In conclusion, managing high CPU usage in SQL Server running on Windows NT is a multifaceted challenge that requires a systematic approach. Understanding the contributions to high CPU resource consumption, coupled with efficient monitoring practices and proactive management, guarantees a more stable and performant SQL Server environment.
Addressing performance issues is not merely a matter of immediate fixes; it requires a continuous process of analysis, optimization, and adaptation to keep the database system running smoothly. By fostering a culture of performance awareness and adhering to best practices, organizations can ensure that their SQL Server environments remain robust, efficient, and capable of supporting the demands of their applications.
That’s the Windows Internal Database. Used by multiple parts of Windows Server including Active Directory and Windows Server Update Services. It’s based on SQL Server but has limits on the amount of memory it can use.
Can I end SQL Server Windows NT?
In SQL Server Configuration Manager, expand Services, and then click SQL Server. In the results pane, right-click the named instance of SQL Server, and then click Stop.
What is SQL Server Windows NT process?
SQL Server Windows NT -64 Bit is known as sqlservr.exe process, it is normal that SQL Server consumes as much memory as possible since SQL Server likes to cache data in memory to speed up access. You might have long running queries on SQL Server.
How do I stop Microsoft SQL Server?
To start, stop, or restart an instance of the SQL Server Agent In Object Explorer, connect to the instance of the Database Engine, right-click SQL Server Agent, and then click Start, Stop, or Restart. If the User Account Control dialog box appears, click Yes. When prompted if you want to act, click Yes.
How do I uninstall SQL Server 64 bit nt?
Answers Click the Windows Start Button, look for Control Panel. Click Control Panel. Click Uninstall a program. Look for SQL Server Windows NT in the list of available programs. Click Uninstall.
What happens if CPU utilization is high in SQL Server?
You can use the following steps to troubleshoot high-CPU-usage issues in SQL Server. Step 1: Verify that SQL Server is causing high CPU. Step 2: Identify queries contributing to CPU usage. Step 3: Update statistics. Step 4: Add potentially missing indexes. Step 5: Investigate parameter-sensitive issues.
How do I turn off SQL?
In SQL Server Configuration Manager, in the left pane, click SQL Server Services. In the results pane, right-click SQL Server (MSSQLServer) or a named instance, and then click Start, Stop, Pause, Resume, or Restart. Click OK to close SQL Server Configuration Manager.
How do I stop SQL Server running in the background process?
Use the Background Processes window to stop SQL statement execution or database object and web page retrieval. Select View | Background Processes from the menu (ALT+V+A). Click in the Background Processes toolbar to stop all processes. Click to the right of the running process to stop that process.
Can’t Stop SQL Server service?
Solution Ensure SQL server and SQL Server Agent services are running. Launch SQL server management studio and connect to localhost. Expand localhost node and right click on “SQL Server Agent” node and select “Properties” Uncheck the check boxes – a. Auto restart SQL server if it stops unexpectedly. b. Click OK.
Why is Sqlservr exe using so much memory?
By default, SQL Server can change its memory requirements dynamically based on available system resources. So it is normal that Memory Usage is huge. If less memory is free, SQL Server releases memory to the OS. If more memory is free, SQL Server may allocate more memory.
What is SQL Server EXE?
sqlservr.exe is the main process for Microsoft SQL Server. This server application provides industry standard and flexible SQL server services.
How do I limit SQL Server memory usage?
Setting a Maximum Memory Limit for a SQL Server Instance. In Enterprise Manager, right-click on the desired SQL Server instance and click Properties. In the properties dialog box, click the Memory tab. Under the Maximum (MB) slider option, move the slider to the desired maximum value. Click OK to save your changes.
Why SQL Server services stopped automatically?
This can happen for several reasons. Windows Updates will sometimes stop this Service. Whatever the reason, usually the problem can be very simply resolved by right-clicking SQL Server (SIXBITDBSERVER) in the Services list and re-setting its status to Started and Automatic.
How do I stop a SQL Server service from a cluster?
Proper Shutdown of SQL Servers in a Cluster Open Failover Cluster Manager. Right-click on the cluster name, select ‘More Actions’, then “Shut Down Cluster…” When prompted if you are sure you want to shut down the cluster, click “Yes” Shutdown both Nodes. Do Disk Maintenance. Power on both Nodes.
How do I check if SQL services are running?
To check the status of the SQL Server Agent: Log on to the Database Server computer with an Administrator account. Start Microsoft SQL Server Management Studio. In the left pane, verify the SQL Server Agent is running. If the SQL Server Agent is not running, right-click SQL Server Agent, and then click Start. Click Yes.
Do I need SQL Server on my PC?
No. Microsoft SQL Server is a SQL database. It doesn’t do anything by itself. You need to have some type of program or application to run against it.
How do I completely Uninstall SQL Server 2008?
Open the Programs and Features item in Control Panel.To do this, click Start, type appwiz. cplin the Start Search box, and then click appwiz. cpl in the Programs list. Select the SQL Server component to uninstall, and then click Change/Remove.
How do I completely Uninstall SQL Server 2014?
To uninstall SQL Server instance, go to Control Panel and then Programs and Features. Select and right-click on Microsoft SQL Server 2014 and select Uninstall/remove. Click on remove.
Why is SQL Server taking so much CPU?
There are several known patterns which can cause high CPU for processes running in SQL Server, including: Query executing causing high CPU. System tasks are consuming CPU. Excessive Compilation and Recompilation of queries.
How do I monitor CPU utilization in SQL Server?
SQL Server Management Studio Once you connect to your SQL Server or Azure SQL instance, you can select Reports > Performance Dashboard and see the current and historical values of CPU usage. Here you can find the query texts of the top resource consumers and identify the queries that are causing the CPU issues.
How do I find the top CPU consuming queries in SQL Server?
If you want to find the top ‘n’ queries that are currently in the cache, which are consuming more CPU, then you are at the right place. sys. dm_exec_query_stats DMV contains all the information about the resource (CPU, Memory, I/O) consuming queries that are currently in the cache.
SQL Server Windows NT High CPU Usage: Understanding and Troubleshooting the Causes
SQL Server is one of the most widely used relational database management systems across various industries. While it is robust and efficient, users sometimes experience high CPU usage, particularly in Windows NT environments. High CPU utilization can lead to performance degradation, impacting application responses and ultimately the end-user experience. Understanding the causes of high CPU usage in SQL Server is crucial for database administrators, developers, and IT professionals. This article delves into the various reasons for elevated CPU usage in SQL Server, best practices for monitoring, diagnosing issues, and potential solutions to optimize performance.
Understanding SQL Server Architecture
Before diving into the intricacies of high CPU usage, it’s essential to grasp the architecture of SQL Server. SQL Server operates primarily on a client-server model. The SQL Server Database Engine manages data storage, processing, and retrieval, while the SQL Server Management Studio (SSMS) provides an interface for users to interact with the database engine.
The SQL Server Database Engine also manages multiple components, including:
- Buffer Management: This is responsible for caching data pages in memory.
- Query Processing: This component interprets SQL commands, creates execution plans, and optimizes queries for performance.
- Concurrency Control: SQL Server allows multiple users to access the database simultaneously through locking mechanisms.
Components like query processor and buffer manager play a vital role in CPU usage. Understanding these elements will help identify why CPU consumption may spike during specific operations.
Causes of High CPU Usage
High CPU usage in SQL Server can be attributed to several factors. Below are the primary reasons:
1. Inefficient Queries
Queries that are not optimized consume excessive CPU resources. Some reasons include:
- Missing Indexes: Queries that involve scanning large tables can be demanding on CPU when indexes are missing. Without indexes, SQL Server scans the entire table row by row, leading to significant CPU consumption.
- Poorly Written Joins: Queries that join multiple tables without proper indexing may result in Cartesian products or excessive data processing.
- Suboptimal Execution Plans: SQL Server generates an execution plan unique to each query. If the logic used to retrieve data is flawed, it may lead to increased CPU activity.
2. Resource Contention
Multiple processes competing for CPU resources can lead to high usage, particularly in multitasking environments. High demands on CPU may arise from:
- Concurrent Queries: When numerous queries are run simultaneously, CPU resources may become primarily occupied, leading to high usage.
- Blocking Issues: If one process blocks another, waiting for a lock, it can cause cascading CPU usage as other processes wait for their turn to execute.
3. Data Growth
As a database grows, the demands on the SQL Server increase. Typically, high CPU usage can result from:
- Increased Data Size: Larger datasets can mean more CPU cycles required for processing. Index maintenance and data retrieval become more complex with growth.
- Retrieving Historical Data: Complex queries extracting historical data absorb significant resources, especially if not indexed effectively.
4. Hardware Limitations
SQL Server performance directly correlates with the hardware it runs on. Limitations can involve:
- Insufficient CPU Cores: If SQL Server is deployed on a server with fewer cores, it may struggle to handle concurrent requests efficiently.
- Memory Bottlenecks: SQL Server uses RAM to optimize query execution. If memory is low or inadequately configured, SQL Server may perform poorly, resulting in higher CPU usage.
5. Background Processes
SQL Server runs various background services and maintenance tasks like:
- SQL Server Agent Jobs: Jobs can consume a lot of resources, particularly if running large data imports or backups.
- Auto Growth Events: If the database is configured to auto-grow and experiences frequent growth events, the overhead can increase CPU usage.
Monitoring SQL Server CPU Usage
Monitoring CPU usage in SQL Server requires systematic approaches and tools. Here are some methodologies:
1. SQL Server Management Studio (SSMS)
- Activity Monitor: Within SSMS, Activity Monitor provides a real-time overview of processes and resource usage, including CPU utilization.
- Dynamic Management Views (DMVs): Leveraging DMVs such as
sys.dm_exec_query_statsorsys.dm_exec_requestshelps determine which queries are consuming the most CPU resources.
2. Performance Monitor (PerfMon)
PerfMon, a Windows tool, allows for tracking of various counters including:
- SQL Server: Buffer Manager under SQL Server objects to evaluate buffer sizes and memory utilization.
- Processor: % Processor Time to identify overall CPU utilization at the system level.
3. SQL Server Profiler
SQL Server Profiler is an essential tool for tracing SQL Server events. By capturing data like execution times and CPU usage per query, admins can identify bottlenecks.
4. Third-Party Monitoring Tools
Tools like SolarWinds Database Performance Analyzer, Redgate SQL Monitor, and Quest Foglight provide extensive options for monitoring SQL Server performance, including customized alerts and graphical representations of CPU load over time.
Diagnosing High CPU Usage
Once high CPU usage is detected, diagnosing the underlying causes is paramount. Here are steps to consider:
1. Identify the Processes Consuming CPU
To pinpoint the offending queries, execute the following T-SQL command:
SELECT TOP 10
    r.session_id,
    r.start_time,
    r.status,
    r.cpu_time,
    r.total_elapsed_time,
    r.reads,
    r.logical_reads,
    r.writes,
    q.text
FROM sys.dm_exec_requests r
CROSS APPLY sys.dm_exec_sql_text(r.sql_handle) q
ORDER BY r.cpu_time DESC;
This statement retrieves sessions consuming the most CPU, allowing DBAs to focus on the top offenders.
2. Review Execution Plans
When problematic SQL queries are identified, examining their execution plans is crucial. Execution plans outline how SQL Server accessed data, revealing inefficiencies such as unnecessary scans or joins. Use:
SET STATISTICS IO ON;
SET STATISTICS TIME ON;

-- Your Query Here
SELECT * FROM YourTable;
The above statements provide insights on IO operations and timing, revealing potential issues.
3. Analyze Wait States
High CPU usage could be due to underlying wait states indicating resource bottlenecks. Monitor wait statistics using:
SELECT wait_type, wait_time_ms, waiting_tasks_count
FROM sys.dm_os_wait_stats
ORDER BY wait_time_ms DESC;
Understanding these statistics can reveal if CPU resources are hindered by waits like I/O operations or locks.
4. Check Index Usage
To analyze the efficiency of current indexes, use:
SELECT
    object_name(i.object_id) as TableName,
    i.name as IndexName,
    (user_seeks + user_scans) as TotalAccesses,
    user_updates
FROM sys.dm_db_index_usage_stats ius
JOIN sys.indexes i on i.index_id = ius.index_id
WHERE object_id = OBJECT_ID('YourDatabase.YourTable')
ORDER BY TotalAccesses DESC;
This query uncovers indexes not being used efficiently, prompting index optimization or creation.
Solutions to Optimize CPU Usage
After diagnosing the cause of high CPU utilization, implementing optimizations is essential. Solutions may encompass a range of strategies:
1. Query Optimization
Optimizing SQL queries is the first line of defense:
- Refactor Queries: Rewrite poorly performing queries by using CTEs (Common Table Expressions) or avoiding nested queries where applicable.
- Use Appropriate Indexes: Index your tables intelligently. Create indexes for columns frequently used in WHERE clauses, JOIN operations, and ORDER BY statements.
2. Update Statistics
Out-of-date statistics can lead to inefficient execution plans. Regularly update statistics using:
EXEC sp_updatestats;Automate this process as part of routine maintenance to enhance performance.
3. Optimize Indexes
Rebuild or reorganize indexes regularly to reduce fragmentation. Use:
ALTER INDEX ALL ON YourTable REBUILD;Moving forward, consider implementing an index maintenance plan to ensure optimal performance over time.
4. Configure SQL Server Settings
Review configurations like:
- Max Degree of Parallelism (MAXDOP): Configure the MAXDOP setting that determines how many processors should be used for parallel plan execution. A lower value might help if excessive CPU utilization occurs due to parallelism.
- Memory Allocation: Ensure SQL Server has enough memory allocated, allowing it to cache more data and reduce CPU cycles.
5. Schedule Jobs Wisely
To prevent demanding jobs from causing spikes in CPU usage, schedule them during off-peak hours. This can involve delaying backups and index maintenance during peak operational hours.
Implementing Best Practices
Beyond immediate optimizations, instituting best practices paves the way for long-term performance stability:
- Conduct Regular Health Checks: Regularly analyze workloads and performance metrics to identify evolving issues on a routine basis.
- Follow a Maintenance Plan: Maintain a comprehensive plan including backups, statistics updating, index management, and integrity checks.
- Training and Best Practices for Developers: Ensuring developers understand how to write efficient SQL code is key. Regularly educate teams on optimization techniques and query performance.
Conclusion
High CPU usage in SQL Server, especially within Windows NT environments, can significantly affect application performance and user experience. Identifying the root causes requires monitoring, diagnosing, and implementing solutions that enhance performance. By empowering database administrators with the right strategies for query optimization, resource management, and regular maintenance, organizations can attain a balanced, efficiently functioning SQL Server.
Final Thoughts
The journey to managing SQL Server performance is ongoing. With adept monitoring and adherence to best practices, organizations can successfully manage and minimize CPU usage. Ultimately, optimizing SQL Server ensures applications run smoothly, providing an experience that aligns with users’ growing demands. As SQL Server continues to evolve, remaining educated on its practices will enable your organization to fully harness its capabilities.
when I update Power BI with database, it locks the database and can no longer access the database with other applications. I always have to stop the task «PowerBI Desktop — SQL Server Windows NT 64 Bit», in the Task Manager, then it works again. The problem is the same the other way around.
All other applications can access the database at the same time without any problem, the problem occurs only with Power BI.
Error message:
Microsoft SQL: A network-related or instance-specific error occurred while establishing a connection to SQL Server. The server was not found or was not accessible. Verify that the instance name is correct and that SQL Server is configured to allow remote connections. (provider: SQL Network Interfaces, error: 50 — Local Database Runtime error occurred.