
Ранее я уже писал о работе и настройке системного монитора Windows (Performance Monitor). В данной статье продолжим знакомиться с этим замечательным инструментом. В частности, поговорим о том как создавать сборщики данных загруженности оборудования системы, а затем просматривать и анализировать полученную информацию в системном мониторе.
0. Оглавление
- Запуск системного монитора
- Добавление группы сборщиков данных
- Запуск сборщика данных по расписанию
- Автоматический перезапуск сборщика данных
- Работа с группами сборщиков данных из командной строки
1. Запуск системного монитора
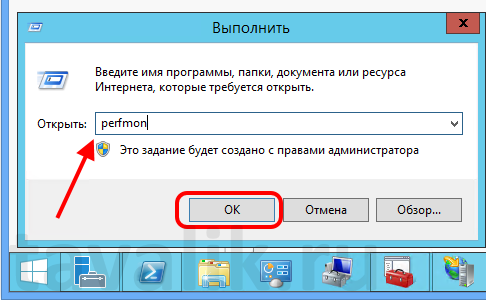
Итак, запускаем Системный монитор Windows (Windows Performance Monitor). Во всех версиях Windows Server сделать это проще всего выполнив команду perfmon (Win+R — «perfmon» — «ОК»)
2. Добавление группы сборщиков данных
Теперь добавим новую группу сборщиков данных.
Но прежде всего, необходимо убедиться, что пользователь, под которым вы работаете, является членом группы «Пользователи журналов производительности» (Performance Log Users) или группы «Администраторы» (Administrators) (или аналогичной).
Для добавления новой группы сборщиков данных, в запустившемся Системном мониторе Windows в дереве консоли слева раскрываем вкладку «Группы сборщиков данных» (Data Collector Set), кликнем правой кнопкой мыши по группе «Особые» (User Defined) и в контекстном меню выберем пункт «Создать» (New) — «Группа сборщиков данных» (Data Collector Set).

Запуститься мастер создания группы сборщиков данных. На первой странице мастера вводим имя группы сборщиков, выбираем пункт «Создать вручную (для опытных)» (Create manually (Advenced)) и нажимаем «Далее» (Next).

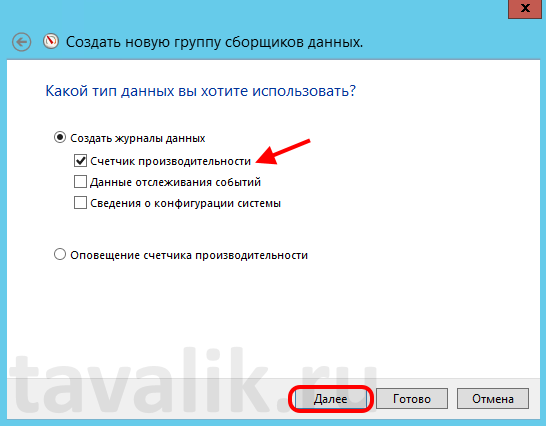
Выбираем тип данных «Создать журналы данных» (Create data logs), ставим флаг «Счетчик производительности» (Performance counter) и снова жмем «Далее» (Next).
На следующей странице мастера, необходимо выбрать счетчики производительности по которым будет идти запись в журнал. Нажимаем кнопку «Добавить» (Add), после чего откроется знакомое по предыдущей статье окно добавления счетчиков. Счетчиков очень много. Для удобства все счетчики сгруппированы по типу оборудования или ПО. Обратите внимание, что можно добавлять как счетчики текущего компьютера, так и компьютеров сети (при наличии соответствующих прав).
Для некоторых счетчиков возможно выбрать конкретный экземпляр объекта. Например, при добавлении счетчика «Средняя длина очереди диска» (Avg. Disk Queue Length) можно выбрать диск, для которого будет собираться статистика.
Выбрав необходимый счетчик (или конкретный экземпляр объекта для счетчика) следует перенести его в таблицу «Добавленные счетчики» (Added Counters) с помощью кнопки «Добавить» (Add). Добавив все необходимые счетчики, нажимаем «ОК».

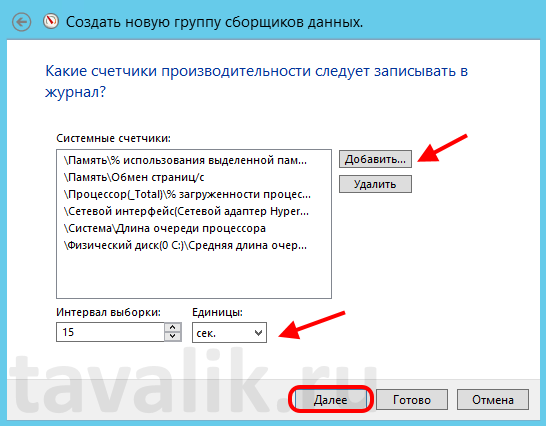
После чего все выбранные счетчики перенесутся в список счетчиков создаваемой группы сборщиков данных. Устанавливаем интервал сбора данных (Sample interval) (рекомендуется 15 сек.) и нажимаем «Далее» (Next).
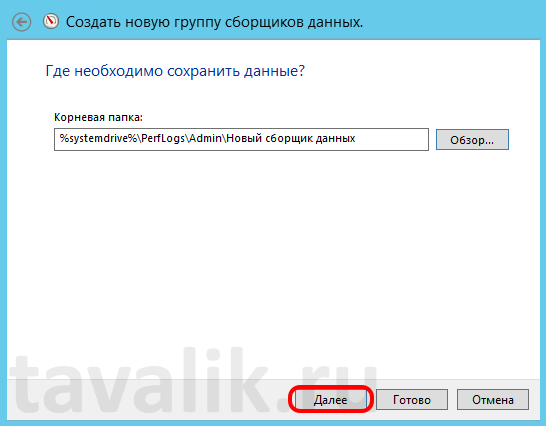
Теперь необходимо указать каталог, в котором будет храниться журнал системного монитора. По умолчанию это каталог
%sistemdrive%\PerfLogs\Admin\<Имя группы сборщиков данных>
Однако если вы не Администратор, вам, скорее всего, не хватит прав на каталог C:\PerfLogs. И в этом случае, следует выбрать папку для логов там, куда гарантированно есть право на запись.
Определившись с корневой папкой для хранения файлов журнала, жмем «Далее» (Next).
На последней странице мастера также можно выбрать пользователя Windows из под которого будет вестись замер производительности. Сменив пользователя (или оставив значение по умолчанию) устанавливаем переключатель, отвечающий за последующие действия программы в значение «Сохранить и закрыть» (Save and close) и нажимаем «Готово» (Finish) для завершения работы мастера.

После чего в дереве консоли в группе «Особые» (User defined) увидим нашу только что созданную группу сборщиков данных. Для того, чтобы сборщик данных начал запись в показателей счетчиков в журнал, необходимо кликнуть по нему правой кнопкой мыши и в контекстном меню выбрать пункт «Пуск» (Start) или нажать соответствующую кнопку на панели задач оснастки.

Если все настроено правильно, и сборщик начал запись в журнал, иконка группы сборщика данных сменится на иконку со значком «Play». Даже если завершить сеанс пользователя, сборщик все равно продолжит свою работу.

При текущих настройках сборщик будет работать до тех пор, пока не произойдет перезагрузка сервера, или его не остановят вручную. Для этого достаточно в контекстном меню группы сборщиков данных выбрать пункт «Стоп» (Stop) или нажать соответствующую кнопку на панели задач.

В соответствии с выбранными настройками, в указанном раннее каталоге можно найти файл журнала текущего замера производительности. Каждый перезапуск сборщика начинает новый файл.

Просматривать данный журнал производительности можно в системном мониторе, выбрав нужный файл в качестве источника в свойствах системного монитора как показано на рисунке ниже (можно добавить сразу несколько файлов, в этом случае данные из всех замеров будут выведены на одном графике).

Но намного удобнее это делать, найдя нужный журнал в дереве консоли, развернув вкладки «Отчеты» (Reports) — «Особые» (User Defined). Здесь для каждой созданной группы сборщиков данных хранятся сведения о файлах журналов замера производительности. Чтобы просмотреть данные журнала достаточно просто выбрать его в дереве.

Просматривать файлы журнала можно на любом компьютере, где установлен Системный монитор. Таким образом данные счетчиков можно собирать на нескольких компьютерах, а просматривать на одном, их можно отправлять по электронной почте и т. д.
3. Запуск сборщика данных по расписанию
Также есть возможность настроить запуск сборщика данных по расписанию. Для этого следует кликнуть правой кнопкой мыши по группе сборщиков данных, для которой необходимо настроить расписание, и в контекстном меню выбрать пункт «Свойства» (Properties).

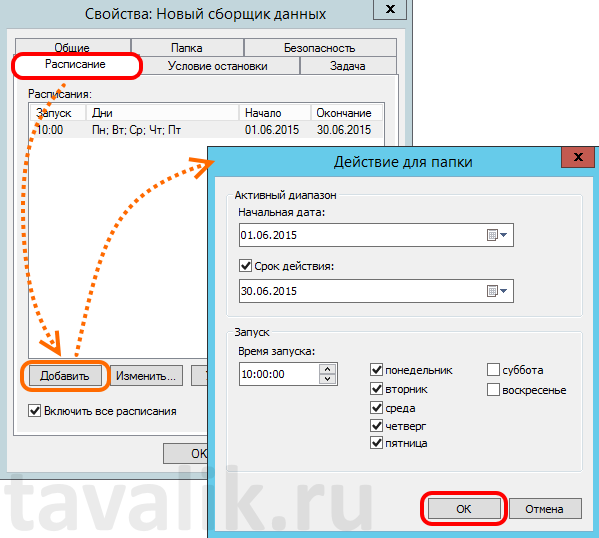
В открывшемся окне свойств сборщика данных доступно для изменения множество параметров сборщика. В частности, на вкладке «Расписание» (Schedile) можно настроить несколько триггеров, по которым будет запускать замер производительности. Например, на картинке ниже, установлено расписание, при котором сборщик данных будет запускаться каждый будний день в 10:00 в течении всего Июня 2015 года.
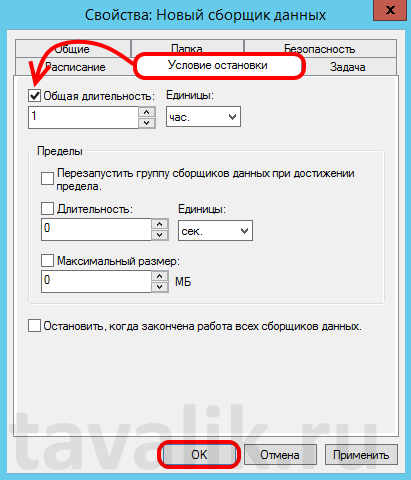
Осталось только определить время остановки записи работы счетчиков. Сделать это можно на вкладке «Условие остановки» (Stop Condition). На приведенном ниже рисунке сборщик будет работать в течении одного часа.
Дожидаемся назначенного времени и видим, что файл журнала успешно сформировался и доступен для анализа в дереве консоли оснастки «Производительность» (Performance).

4. Автоматический перезапуск сборщика данных
Когда сборщик данных ведет запись показателей счетчиков, сам файл журнала недоступен для просмотра. Это не совсем удобно, т. к. иногда требуется и производить запись и просматривать данные замера производительности. В этом случае можно настроить автоматический перезапуск сборщика данных, например через каждый час. При новом запуске, сборщик начнет новый файл журнала, остальные же файлы мы сможем сразу просматривать в системном мониторе.
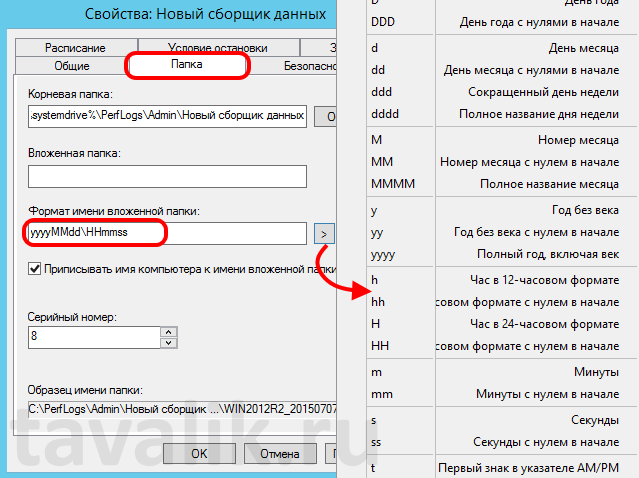
Прежде всего, для удобства хранения фалов журнала, поменяем формат имени папки (Subdirectory name format), в которой будет храниться файл с данными замера производительности. Сделать этом можно вызвав окно свойств текущего сборщика данных и перейдя на вкладку «Папка» (Directiry). Здесь с помощью встроенной подсказки можно установить шаблон создаваемых папок. Установим имя, соответствующее полному времени начала работы группы сборщика данных, т. е. в формате «yyyyMMdd\HHmmss».
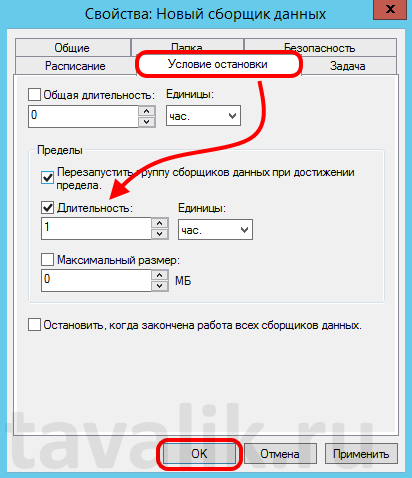
Затем на вкладке «Условие остановки» (Stop Condition) установим флаг «Перезапускать группу сборщиков данных при достижении предела.» (Restart the data collector set at limits) и установим длительность (Duration) работы счетчика, например 1 час, после чего сохраняем изменения с помощью кнопки «ОК».
Запускаем сборщик данных для начала замера производительности и видим, что в соответствии с установленными параметрами каждый час создается новый файл журнала системного монитора, а предыдущие файлы доступны для анализа.

5. Работа с группами сборщиков данных из командной строки
Работать с группами сборщиков данных можно как и из оснастки «Производительность» (Performance), так и из командной строки с помощью программы logman.exe. Синтаксис и примеры работы данного оператора можно получить выполнив команду
logman /?

В ситуации, когда приходится постоянно настраивать сбор данных монитора производительности у разных клиентов на разных серверах, удобно один раз написать bat-файл, который будет создавать новую группу сборщиков данных с определенным набором счетчиков производительности.
Например, bat-файл, создающий группу сборщиков данных аналогичную описанной в данной статье выше, будет содержать код (bat-файлы удобно писать с помощью программы Notepad++):
@ECHO OFF
ECHO Adding counter "New_counter"...

rem Создаем новую группу сборщиков данных
logman create counter New_counter -f bincirc -c ^
	"\Processor(_Total)\%% Processor Time" ^
	"\Memory(_Total)\Page/sec" ^
	"\Memory(_Total)\%% Uncommited Bytes In Use" ^
	"\Memory(_Total)\Available Bytes" ^
	"\System(_Total)\Processor Queue Length" ^
	"\PhysicalDisk(_Total)\Avg. Disk Queue Lenghth" ^
	"\PhysicalDisk(*)\Avg. Disk Queue Lenghth" ^
	"\Network Interface(*)\Bytes Total/sec" ^
	-si 15 -v mmddhhmm

rem Запускаем монитор производительности
C:\Windows\System32\Perfmon.exe

ECHO done
(Скачать bat-файл)
Названия счетчиков заключаются в кавычки и разделяются пробелом. Имена счетчиков можно писать как в англоязычном варианте, так и на русском языке (но тогда bat-файл будет работать только в русскоязычных версиях Windows). Если в названии счетчика встречается знак %, его необходимо заменить знаками %% (двойной процент).
Выполнив данный файл, сразу попадем в монитор производительности, где увидим только что созданную группу сборщиков данных с именем New_counter.

Описанных счетчиков, как правило, хватает для общей оценки загруженности системы. Другие счетчики используются для детального расследования проблем, если установлено, что имеет место недостаточная производительность оборудования.
Windows Reliability and Performance Monitor
I will let you into a secret, the Reliability and Performance Monitor is a techie’s dream. This GUI is pure fun to explore, you are certain to find something new and interesting.
Review of Windows Reliability and Performance Monitor
- Why Investigate the Reliability and Performance Monitor?
- Getting Started with the Reliability and Performance Monitor
- Performance Monitor Logs
- What’s New in Windows Performance
Why Investigate the Reliability and Performance Monitor?
The Resource Monitor will give you instant appreciation of which processes are hogging the CPU, Memory, Disk and Network. When you need a longer history of how processes and applications consume server resources, then investigate the Data Collector Sets. Begin by using the preset templates, then experiment by modifying the templates and saving your own settings.
If you need to justify the time in ‘playing’ with this tool; I suggest that the biggest advantage of learning about the Reliability and Performance Monitor is that you will have a sound grasp of the basics when it comes to solving a Windows Server 2008 problem.
Getting Started with the Reliability and Performance Monitor
My favourite way to launch the GUI is to click on the Start (button), type ‘perfmon’ in the ‘Start Search’ box. When the application launches, I look at the top left of the screen and click on the Reliability and Performance Monitor. I notice my friend ‘Barking Eddie’ uses a different route, he clicks Start, then selects Administrative Tools.
Another management tactic that I like is creating an MMC, the benefits are that the console remembers your settings, and you can create a whole family of related snap-ins. If you like this technique then inside the Reliability and Performance Monitor go to the File menu and choose ‘Save as’.
Once you start exploring the GUI, you soon appreciate that the Reliability and Performance Monitor is really 3 utilities in one; the only minor trap is that when you want to work with the Resource Overview you must select ‘Reliability and Performance’ in the left-hand tree.
In a nutshell, this is monitor is intuitive ‘Windows’ at its best; just keep clicking the window pane to see more detail. At last, an application that lives up to the hype of ‘Easy to use’. One tip, look out for the up and down arrows circled in the screenshot below.
Rough and Ready Performance Monitor Troubleshooting
When you want to trace the root cause of a computer running slowly it helps if you ask yourself, and the server, a series of branching questions. Start with: ‘Is this a hardware or software problem?’ Then follow up with questions such as, ‘Can we rule out a disk failure, a loose SIMM chip or a broken network connection?’
OK, so it’s not a hardware problem. What you need now is a pincer movement. To locate the problem ask yourself these two related questions: ‘Which resource is the bottleneck?’ And, ‘Which program is consuming most of the resource?’ To help identify the program consuming most of the resource I click on the up arrow on the appropriate column, for example, Average CPU, or Commit(KB) in the Memory window.
Here are detailed instruction on how to get started with Performance Monitor
- Begin by clicking high, high, high on precisely Reliability Monitor. (See blue band above).
- Develop a theory – which PROCESS is responsible. For a quick test, in turn, sort each column with numeric data. If you are wrong, then what’s your next guess?
- Memory is the most likely bottleneck. Check that % Used Physical Memory is less than 90%.
- Disk problems could indicate that a disk is about to fail. Sort on both ‘Read’ and ‘Write’.
- CPU bottlenecks, % continuously over 80%, may indicate this is old server due for replacement.
- Network bottlenecks may need a third-party utility to confirm. Performance Monitor underplays network problems because it only shows you data from the one machine and not the whole network.
Brutal Advice for Newbies
If a quick check of the Resource Overview does not reveal the source of your problem, AND YOU ARE NEWBIE, then I am sorry but I must be brutal – there is no easy solution. My best advice is call for an expert, it will be cheaper and less frustrating in the long-run. OK, so you have no money, but you are willing to spend time trying to isolate the problem. Internet research is likely to reveal lots people sitting on the fence, the problem is that every setup is different, it’s only experience that tells you if latency is due to an anti-virus program trying to update their image files, and not a SQL database that is suddenly having to service more user queries.
Guy Recommends: A Free Trial of the Network Performance Monitor (NPM) v12
SolarWinds’ Network Performance Monitor will help you discover what’s happening on your network. This utility will also guide you through troubleshooting; the dashboard will indicate whether the root cause is a broken link, faulty equipment or resource overload.
Perhaps the NPM’s best feature is the way it suggests solutions to network problems. Its second best feature is the ability to monitor the health of individual VMware virtual machines. If you are interested in troubleshooting, and creating network maps, then I recommend that you give this Network Performance Monitor a try.
Download your free trial of SolarWinds Network Performance Monitor.
What’s New in Windows Performance Monitor Compared with Previous Versions of Perfmon
Your old perfmon is still there, but it’s surrounded by useful gadgets for general or level-one troubleshooting, for example, Data Collector Sets. There are 3 tools which make up the Windows Reliability And Performance Monitor: Resource View, Reliability Monitor, and Performance Monitor (perfmon). The result is a broader utility which really is more friendly for solving common problems. Also the System Stability Chart helps you to investigate minor faults before they escalate into a full-scale crisis.
Performance Monitor Logs
The key to understanding the logs is to realize that when you launch the Reliability and Performance Monitor it is set to record live data. To CREATE logs head for the Data Collector Sets. To replay logs that made earlier then click on the ‘View Log Data’ icon. See the two screenshots below.
Data Collector Sets and Templates
If the overview in the Reliability and Performance Monitor does not reveal the root cause the problem, then maybe logging would help. The Data Collector Sets make stage two of performance monitoring easier, look out for the useful templates with predefined settings, which you can use to generate performance logs.
The difficulty is that you could be drowned with data. Through guidance from the Data Collector Sets folder you may be able to record some meaningful data. However, my guess is that it will take 3 goes to collect data that confirms or denies your theory as to the root cause of your problem. Whereas the Monitor, really does live up to the hype of easy to use. All I will say about the Data Collector Templates is that they are EASIER to capture meaningful data than the old perfmon.
Case Studies for Performance Monitoring
Many people believe that you are not supposed to have fun while you learn, but to me, having fun is the ONLY way I learn. Thus making a game of finding the bottleneck is one of the most effective ways of improving a server’s performance. Here are possible sources of bottlenecks which cause your server to respond slower than you would expect from its specification.
- A program monopolizes a particular resource. E.g. Malware hogs the CPU.
- Insufficient resources are available. E.g. a database consumes all the memory.
- A program, device, or service fails. E.g. Terminal service times-out.
- Software is incorrectly installed or configured. E.g. missing, or wrong version of DLL.
- The system is incorrectly configured for the workload. E.g. not enough memory.
Solutions to Performance Problems
It helps problem solving if you review the range of solution at regular stages. At one extreme you could buy new faster hardware, or complete system. Yet at the other extreme, a cost nothing solution such as load balancing could fix the problem at least temporarily.
If you say to yourself, OK, I’ll splash out and by a new system. Your brain may say, ‘but there is nothing wrong with the disk subsystem’, followed by, ‘Hang on, those quad-processors are already overkill’. Then a better solution emerges, ‘How about if I just add more memory?’.
However, an alternative thought process could be, ‘Let’s just by new memory, hmmm… than means that single processor will be the bottleneck. And 80GB disks looked big 5 years ago, but they are full and these days we can get much bigger disks for the price we paid. Also, isn’t that fan a bit noisy? Conclusion, why don’t we buy a balanced system with new components.’
Specific Advice
- Add more resource, e.g. add an extra memory SIMM / DIMM.
- Load-balancing, move some of the processes, or users files, to another disk or even to another server.
- Upgrade, buy a faster disk system.
- Baselines, creating baselines separates the professionals from the amateurs. It’s just so much easier to solve a problem that arose this week if you know what ‘Normal’ looked like. When you have baselines from last week, last month and last weekend, then the patterns provide the clues for a speedy resolution.
Summary of Using Performance Monitor
Nothing changes with performance monitoring. The secret of success remains the same. Concentrate on which processes are using the big 4 resources: memory, cpu, disk and network. Look for ‘cost nothing’ solutions, e.g. move the paging file to another disk, perform regular defrags. Employ the Windows System Resource Manger to meter out resources, and put limits on any users or applications that are bullying the CPU. If all else fails ask, ‘will installing more RAM speed up a lethargic server?’
Guy Recommends : SolarWinds’ Free VM Monitor
The best feature of this new this new version of SolarWinds VM Monitor is that it checks Windows Hyper-V. Naturally, it still works with virtual machines on VMware ESX Servers. VM Monitor is a clever desktop tool that not only tests that your server is online, but also displays the CPU and memory utilization for each node.
It’s easy to install and to configure this virtual machine monitor, all you need the host server’s IP address or hostname and the logon info. Give this virtual machine monitor a try – it’s free.
Download your free copy of SolarWinds VM Monitor.
Reliability Monitor
Vista was the first place that I saw this reliability monitor, at the time I thought, ‘This tool would be even more useful on my servers’. Well here it as a snap-in for Windows Server 2008.
The Reliability Monitor is an intelligent filter that trawls the Event Logs and pulls out significant events which it then displays a chart. Microsoft describe the Reliability Monitor as an intelligent agent for Performance Monitor’s Alerts.
The Reliability snap-in records system stability as a mark out of 10. Look behind the bare SSI (System Stability Index) number, and research events on the chart to see when software changed, or the services froze. Observe that the main chart has data lines which record Application, Hardware, Windows (Operating System) failures. In particular the Reliability Monitor places red crosses on dates when failures occurred. For any given event, note the detailed description underneath the chart.
Servers can often continue working, albeit slower, even thought there are errors, what this monitor does is show you significant event so that you can decide what corrective action to take. Replace hardware that’s on the blink, research better drivers, or even consider managing CPU usage with a separate snap-in called the System Resource Monitor.
What you also get is troubleshooters to identify here and now what is preventing the server operating as designed, for example network unavailable, dodgy drivers, loose memory chip.
When calculating the SSI, recent failures are weighted more heavily than past failures, thus once you resolve a problem you should soon see the index rise.
Tip: To review all your available data, click on the drop-down date menu and select: ‘Select all’.
Remember the other servers in your organization. As with previous versions of Perfmon, you can collect data from other servers, for example, right-click on ‘Reliability and Performance’ and select: Connect to to another machine. You really need to select a Windows Server 2008, or a Vista machine, because XP and Windows Server 2003 don’t have the correct agents.
»
Summary
If you are prepared to put in the time, then using the Reliability and Performance Monitor will reward you with detailed understanding of your Windows Server 2008. Your explorations will be a labour of love, and the justification of investing time is that you will have the experience and a base-line to make future troubleshooting more successful.
If you like this page then please share it with your friends
Microsoft Windows Server 2008 Topics:
• Server 2008 Home •Network Monitor • Free Syslog Analyser
• AD DC • Roles • Features • Hyper-V • UAC • IPv6 • GP Preferences
• SolarWinds Network Performance Monitor •Performance Monitor
Introduction
Monitoring system performance is an essential task for server administrators to ensure efficient operation and avoid resource bottlenecks. Windows Server 2008 includes a built-in tool called Resource Monitor, which allows administrators to track resource usage in real-time across the CPU, hard disk, network, and memory.
This tool is highly beneficial for diagnosing performance issues, identifying processes consuming excessive resources, and optimizing the overall health of the server. With an intuitive interface, the Resource Monitor simplifies performance monitoring, helping administrators manage resources effectively without requiring third-party software. This guide will provide step-by-step instructions on how to access and use the Resource Monitor.
Prerequisites
Before proceeding, ensure the following prerequisites are met:
- Access to a Windows Server 2008 machine with administrative privileges.
- Familiarity with basic system management tasks, such as opening the Task Manager.
Step-by-Step Guide
Step 1: Open Task Manager
- Right-click on the Taskbar at the bottom of the Windows Server 2008 desktop.
- Select Task Manager from the menu.

This will open the Task Manager, which gives an overview of running processes and performance.
Step 2: Navigate to the Performance Tab
Once the Task Manager is open:
- Click on the Performance tab at the top of the window.
This tab provides a high-level view of the system’s resource usage, including CPU and memory.

Step 3: Access the Resource Monitor
Within the Performance tab:
- Click on the Resource Monitor button, located at the bottom of the Performance window.This will open the Resource Monitor, giving you more detailed information on resource usage..

Step 4: Review the Resource Monitor Interface
The Resource Monitor interface provides detailed tracking of four major system resources:
- CPU: Shows the current processor usage and the processes consuming CPU resources.
- Disk: Displays hard disk usage by processes.
- Network: Monitors network activity and bandwidth consumption.
- Memory: Shows memory usage and which processes are utilizing it.
Each section can be expanded to view more detailed statistics about the resources.

Step 5: View Detailed Resource Usage
To view specific details on resource consumption:
- Click the arrow next to any of the resource categories (e.g., CPU) to expand the details.
- This will display a list of active processes and their respective usage of the selected resource.
For instance, in the CPU tab, you can view all processes consuming CPU resources, making it easy to identify any process that may be slowing down the server.

Conclusion
The Resource Monitor in Windows Server 2008 is a valuable tool for server administrators to track real-time usage of CPU, disk, network, and memory resources. By using this tool, administrators can identify resource-heavy processes, troubleshoot performance bottlenecks, and optimize the overall server performance. Regularly monitoring these metrics ensures that your server remains stable and responsive, minimizing the risk of downtime.
For further assistance or any inquiries, please contact our support team at support@ipserverone.com.
As a Windows administrator, it is critical that you
understand how to properly monitor your Windows servers for errors and
warnings that may indicate problems. Additionally, you need to
understand how to ensure that your Windows servers are performing
optimally. You also need to know how to use the various tools available
to troubleshoot problems with the operating system and applications.
Performance Monitoring
As a Windows administrator, it is
important that you monitor the performance of your servers. Performance
monitoring should be done proactively and used to create baseline
performance statistics for your servers. By establishing baselines for
“normal” performance, you can locate performance issues more quickly by
looking for deviations from the baselines established over time. Some
performance statistics do have best practice results that have been
established by Microsoft product groups; however, this does not negate
the need for you to establish your own baselines.
Understanding Performance Monitor
Windows Server 2008 R2
includes the Performance Monitor utility to help administrators easily
gather and analyze performance data. Using Performance Monitor, you can
monitor and capture data from various counters provided by the operating
system. Before using Performance Monitor, you should understand the
following terms:
-
Performance counters —Counters
are the various components and objects that can be monitored using
Performance Monitor. These are installed either as part of the operating
system or by an application running on the server. Counters are also
added when new roles are added. Examples of counters include % of
Processor Time, Memory—Available Bytes, Logical Disk—% Free Disk Space.
-
Instances
—Instances allow you to view data more granularly from a specific
counter. For example, you may want to use the Processor “% of Processor
Time” counter to view processor utilization. You can use the instances
option to limit viewing the utilization of processors 1 and 3 only or of
all the processors in the server.
In the following exercise,
we will go through the process of using Performance Monitor to view
performance data in real time and start collecting data to establish a
baseline for some key performance indicators.
Performance Monitor is located under the Diagnostics node in Server Manager. To open Performance Monitor, perform the following:
1.
Open Server Manager.
2.
Expand the node Diagnostics | Performance | Monitoring Tools.
3.
Select the node Performance Monitor (see Figure 1).
Figure 1. Windows Performance Monitor.

To monitor performance of a specific Windows component, you simply need
to add it to the Performance Monitor main window. This is done by
clicking the Add button at the top of the Performance Monitor window. This button is represented by a green plus sign as seen in Figure 2.
Figure 2. Add Performance counters.

important that you monitor the performance of your servers. Performance
monitoring should be done proactively and used to create baseline
performance statistics for your servers. By establishing baselines for
“normal” performance, you can locate performance issues more quickly by
looking for deviations from the baselines established over time. Some
performance statistics do have best practice results that have been
established by Microsoft product groups; however, this does not negate
the need for you to establish your own baselines.
includes the Performance Monitor utility to help administrators easily
gather and analyze performance data. Using Performance Monitor, you can
monitor and capture data from various counters provided by the operating
system. Before using Performance Monitor, you should understand the
following terms:
Performance counters —Counters
are the various components and objects that can be monitored using
Performance Monitor. These are installed either as part of the operating
system or by an application running on the server. Counters are also
added when new roles are added. Examples of counters include % of
Processor Time, Memory—Available Bytes, Logical Disk—% Free Disk Space.
Instances
—Instances allow you to view data more granularly from a specific
counter. For example, you may want to use the Processor “% of Processor
Time” counter to view processor utilization. You can use the instances
option to limit viewing the utilization of processors 1 and 3 only or of
all the processors in the server.
we will go through the process of using Performance Monitor to view
performance data in real time and start collecting data to establish a
baseline for some key performance indicators.
1.
Open Server Manager.
2.
Expand the node Diagnostics | Performance | Monitoring Tools.
3.
Select the node Performance Monitor (see Figure 1).
Figure 1. Windows Performance Monitor.

to add it to the Performance Monitor main window. This is done by
clicking the Add button at the top of the Performance Monitor window. This button is represented by a green plus sign as seen in Figure 2.

After clicking the Add button, the Add Counters window will appear (see Figure 3).
Figure 3. Add Performance counters.

In this window, you can select the counters and instances you want to
monitor. If you need a brief description of a counter, you can select
the Show Description option. Table 1 lists some of the common objects and a brief description of what each object’s counters captures:
Table 1. Common Performance Objects
| Object | Description |
|---|---|
| Logical disk | Logical disk counters gather performance data related to logical disk drives (C:, D:, etc). These counters include % of Free Space, % Disk Read Time, % Disk Write Time, Average Disk Queue Length, and Free Megabytes. You will especially want to establish thresholds for free disk space counters to ensure you don’t run out of free space on your server disk drives. |
| Memory | Memory counters allow you to monitor everything from available free megabytes to number or pages per second. Memory is often the number one bottleneck on servers so you should pay special attention to these counters. Since Windows servers page certain memory information to disk, you will want to ensure that excessive paging does not occur by monitoring Pages Per Second. You additionally will want to monitor available megabytes and committed bytes. |
| Processor | The processor performance counters monitor various aspects of processor performance. Though modern day processors are very fast, some processor intense applications such as SQL Server, can still see bottlenecks caused by poor processor performance. You will specifically want to monitor % of Processor Time. If you see a processor flat lined at 100% utilization, you know your server is very unresponsive and need to action immediately. |
| Physical Disk | Physical disk counters are used to measure the performance of the physical disk drive. Common counters include % Disk Read Time, % Disk Write Time, and Average Disk Queue Length. |
| Network Interface | Network Interface counters allow you to measure the performance of server network adapters including bytes sent or received per second, Current bandwidth, Packet Outbound Errors, and Packet Receive Errors. These counters can be helpful in monitoring utilization of the network adapter and troubleshooting adapter connectivity issues. |
Performance Monitoring management server
Performance Monitor can not
only monitor the local server, but also has the ability to connect to
remote servers and workstations to collect performance information from
them as well. You may find it beneficial to set up a management server
to centrally collect performance data from a set of servers opposed to
running Performance Monitor on each system individually.
Now
that you have an understanding of Performance Monitor, let us take a
look at adding counters to be display performance information:
|
1. |
Within the Performance Monitor window, click the Add button to open the Add Counters window. |
|
2. |
Select Figure 4. Select counter to view.

|
|
3. |
Click OK. You will see a line graph with lines representing the percentage of utilization for each processor in the system (see Figure 5). Figure 5. Processor utilization performance graph.

|
You can optionally change how you view the graph, using the change graph button (see Figure 6). You can choose between a line, histogram bar, or a table displaying values.
Figure 6. Change performances graph type.

Later in this chapter, we will explore using Data Collector Sets to capture performance data over a period of time.
Where is the reliability monitor?
You may remember that
Windows Server 2008 R1 included the Reliability Monitor that
continuously monitored your system for reliability. This included
critical system errors and configuration changes such as installing new
applications. You will notice that the Reliability Monitor is no longer
available in Server Manager in Windows Server 2008 R2. The monitor still
exists and is disabled by default. To enable the reliability monitor,
you will need to change the registry key
HKEY_LOCAL_MACHINE\SOFTWRE\Microsoft\Reliability Analysis\WMI. Set
WMIEnable equal to “1.” You will then need to ensure that the RacTask
scheduled task is set to run. You can then access the reliability
monitor from the Windows Action Center.
В этой статье мы рассмотрим особенности использования встроенных счетчиков производительности Performance Monitor для мониторинга состояния Windows Server. Счетчики PerfMon можно использовать для отслеживания изменений определенных параметров производительности сервера (алертов) и оповещать администратора в случае возникновения высокой загрузки или других нештатных состояниях.
Чаще всего для мониторинга работоспособности, доступности, загруженности серверов используются сторонние продукты. Если вам нужно получать информацию о производительности приложений либо железа только с одного-двух Windows-серверов, либо когда это нужно на непостоянной основе, либо возник более сложный случай, требующий глубокого траблшутинга производительности, то можно воспользоваться встроенным функционалом Windows Performance Monitor.
Performance Monitor имеет огромное количество счётчиков для получения информации о железе, операционной системе, установленном ПО в виде конкретных цифр. Performance Monitor может вести наблюдение за показателями производительности сервера в реальном времени или записывать историю.
Основные возможности Performance Monitor, которые можно использовать отдельно или совместно с другими сторонними системами мониторинга (типа Zabbix, Nagios, Cacti и другие):
- cистема мониторинга при выводе информации о производительности сначала обращается к Performance Monitor;
- главной задачей системы мониторинга является оповещение о наступлении тревожного момента, аварии, а у Performance Monitor – собрать и предоставить диагностические данные.
Текущие значения производительности Windows можно получить из Task Manager, но Performance Monitor умеет несколько больше:
- Task Manager работает только в реальном времени и только на конкретном (локальном) хосте;
- в Performance Monitor можно подключать счётчики с разных серверов, вести наблюдение длительное время и собранную информацию сохранять в файл;
- в Task Manager очень мало показателей производительности.
Мониторинг производительности процессора с Perfomance Monitor
Для снятия данных о производительности процессора воспользуемся несколькими основными счётчиками:
- \Processor\% Processor Time — определяет уровень загрузки ЦП, и отслеживает время, которое ЦП затрачивает на работу процесса. Уровень загрузки ЦП в диапазоне в пределах 80-90 % может указывать на необходимость добавления процессорной мощности.
- \Processor\%Privileged Time — соответствует проценту процессорного времени, затраченного на выполнение команд ядра операционной системы Windows, таких как обработка запросов ввода-вывода SQL Server. Если значение этого счетчика постоянно высокое, и счетчики для объекта Физический диск также имеют высокие значения, то необходимо рассмотреть вопрос об установке более быстрой и более эффективной дисковой подсистемы (см. более подробную статью об анализе производительности дисков с помощью PerfMon).
- \Processor\%User Time — соответствует проценту времени работы CPU, которое он затрачивает на выполнение пользовательских приложений.
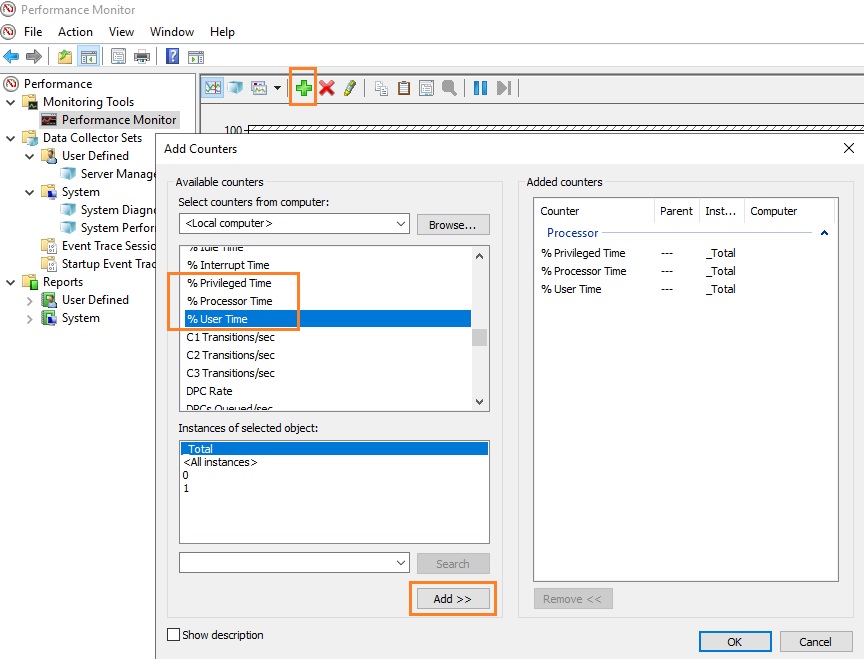
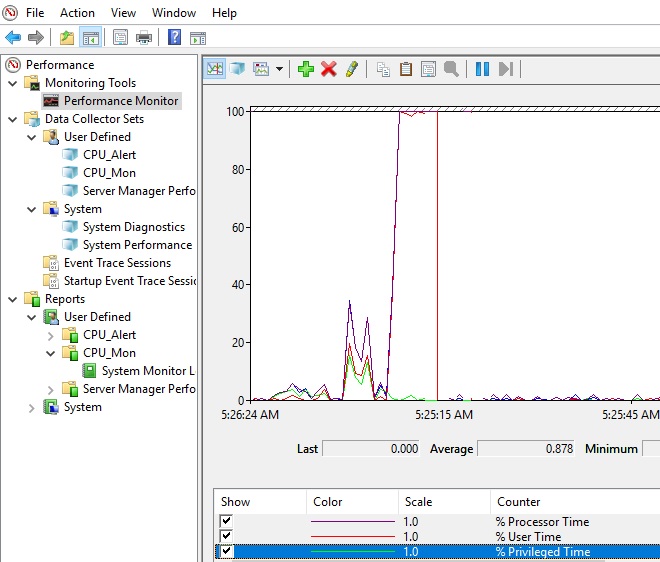
Запустите Performance Monitor с помощью команды perfmon. В разделе Performance Monitor отображается загрузкой CPU в реальном времени с помощью графика (параметр Line), с помощью цифр (параметр Report), с помощью столбчатой гистограммы (параметр Histogram bar) (вид выбирается в панели инструментов). Чтобы добавить счетчики, нажмите кнопку “+” (Add Counters).
Слева направо двигается линия в реальном времени и отображает график загрузки процессора, на котором можно увидеть, как всплески, так и постоянную нагрузку.
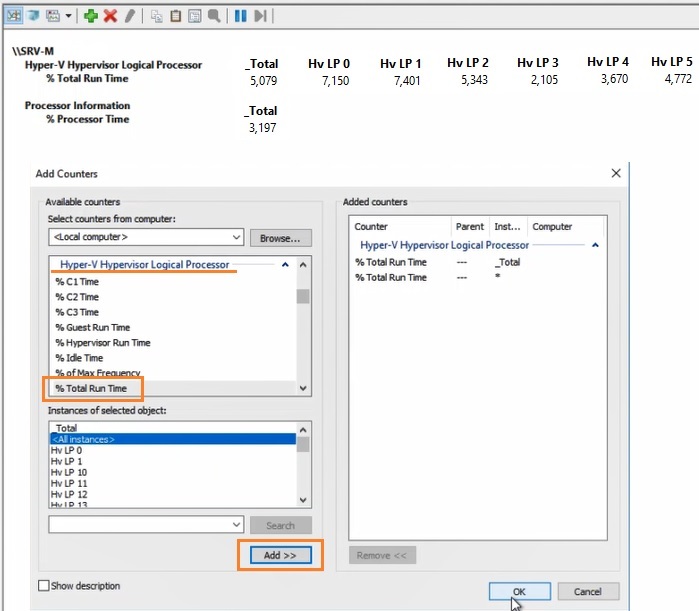
Например, вам нужно посмотреть загрузку процессора виртуальными машинами и самим Hyper-V. Выберите группу счетчиков Hyper-V Hypervisor Logical Processor, выберите счетчик % Total Run Time. Вы можете показывать нагрузку по всем ядрам CPU (Total), либо по конкретным (HV LP №), либо всё сразу (All Instances). Выберем Total и All Instances.
Группы сборщиков данных в PerfMon
Чтобы не сидеть целый за наблюдением движения линии, создаются группы сбор данных (Data Collector Set), задаются для них параметры и периодически просматриваются.
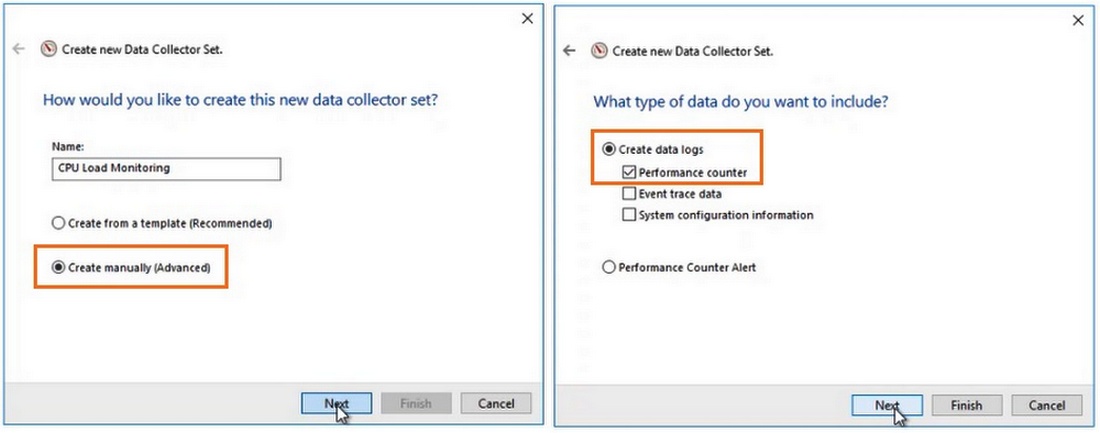
Чтобы создать группу сбора данных, нужно нажать на разделе User Defined правой кнопкой мыши, в меню выбрать New -> Data Collector Set. Выберите Create manually (Advanced) -> Create Data Logs и включите опцию Performance Counter. Нажмите Add и добавите счётчики. В нашем примере % Total Run Time из группы Hyper-V Hypervisor Logical Processor и Available MBytes из Memory. Установите интервал опроса счётчиков в 3 секунды.
Далее вручную запустите созданный Data Collector Set, нажав на нём правой кнопкой мыши и выбрав в меню пункт Start.
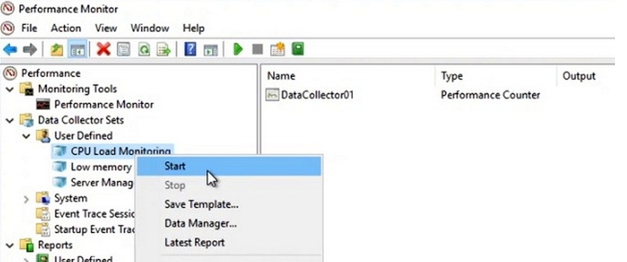
Через некоторое время можно просмотреть отчёт. Для этого в контекстном меню группы сбора данных нужно выбрать пункт Latest Report. Вы можете посмотреть и проанализировать отчёт производительности в виде графика. Отчёт можно скопировать и переслать. Он хранится в C:\PerfLogs\Admin\CPU_Mon и имеет расширение .blg.
Если нужно на другом сервере запустить такой же набор счётчиков, как на первом, то их можно переносить экспортом. Для этого в контекстном меню группы сбора данных выберите пункт Save Template, укажите имя файла (расширение .xml). Скопируйте xml файл на другой сервер, создайте новую группу сбора данных, выберите пункт Create from a template и укажите готовый шаблон.
Создание Alert для мониторинга загрузки CPU
В определённый критический момент в Performance Monitor могут срабатывать алерты, которые помогают ИТ-специалисту прояснить суть проблемы. В первом случае алерт может отправить оповещение, а во втором – запустить другую группу сбора данных.
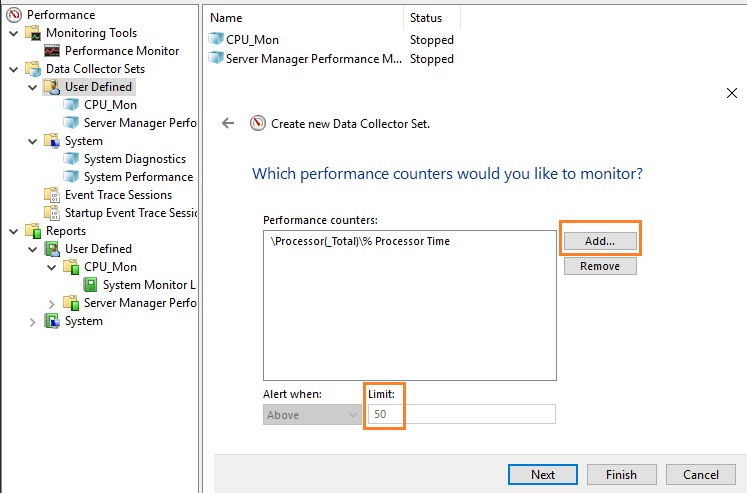
Чтобы создать алерт в PerfMon, нужно создать ещё один Data Collector Set. Укажите его имя CPU_Alert, выберите опцию Create manually (Advanced), а затем — Performance Counter Alert. Добавьте счётчик % Total Run Time из Hyper-V Hypervisor Logical Processor, укажите границу загрузки 50 %, при превышении которой будет срабатывать алерт, установите интервал опроса счётчика в 3 секунды.
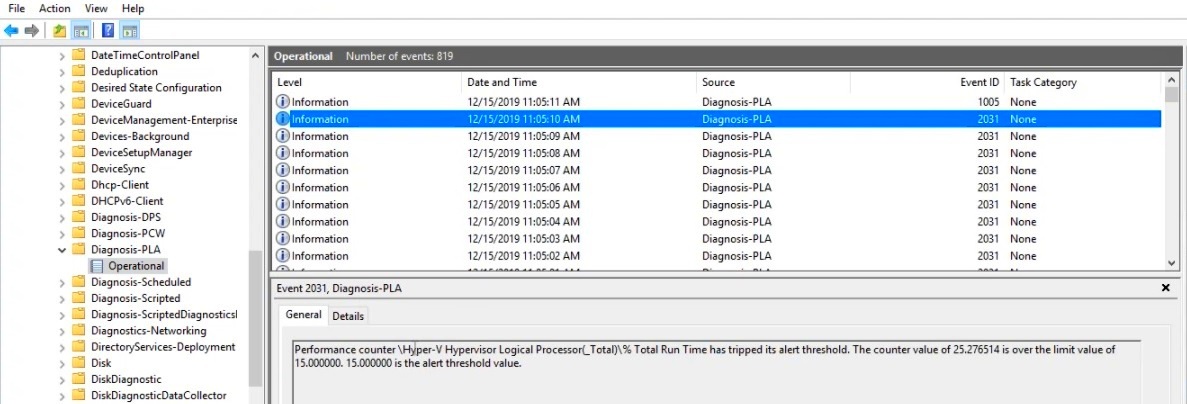
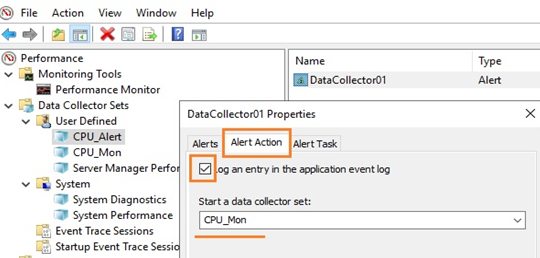
Далее нужно зайти в свойства данной группы сбора информации, перейти на вкладку Alert Action, включить опцию Log an entry in the application event log и запустить группу сбора данных. Когда сработает алерт, в журнале (в консоли Event Viewer в разделе Applications and Services Logs\Microsoft\Windows\Diagnosis-PLA\Operational) появится запись:
“Performance counter \Processor(_Total)\% Processor Time has tripped its alert threshold. The counter value of 100.000000 is over the limit value of 50.000000. 50.000000 is the alert threshold value”.
Здесь же рассмотрим и второй случай, когда нужно запустить другую группу сбора данных. Например, алерт срабатывает при достижении высокой загрузки CPU, делает запись в лог, но вы хотите включить сбор данных с других счётчиков для получения дополнительной информации. Для этого необходимо в свойствах алерта в меню Alert Action в выпадающем списке Start a data collector set выбрать ранее созданную группу сбора, например, CPU_Mon. Рядом находится вкладка Alert Task, в которой можно указать разные аргументы либо подключить готовую задачу из консоли Task Scheduler, указав её имя в поле Run this task when an alert is triggered. Будем использовать второй вариант.
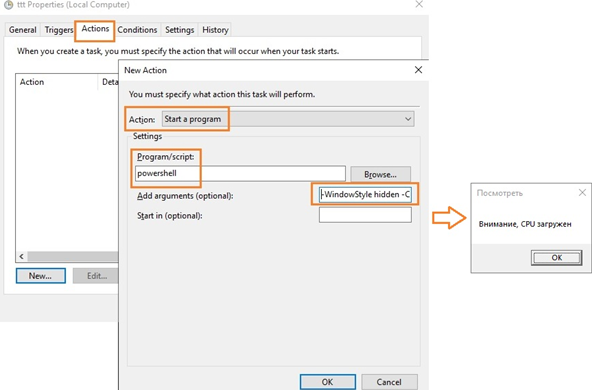
С помощью Task Scheduler можно выполнить какие-то действия: выполнить команду, отправить письмо или вывести сообщение на экран (сейчас последниед ве функции не поддерживаются, считаются устаревшими (deprecated)). Для вывода на уведомления на экран можно использовать скриптом PowerShell. Для этого в консоли Task Scheduler создайте новую задачу, на вкладке Triggers выберите One time, на вкладке Actions в выпадающем поле Action выбирите параметр Start a program, в поле Program/Script укажите powershell.exe, а в поле Add arguments (optional) следующий код:
-WindowStyle hidden -Command "& {[System.Reflection.Assembly]::LoadWithPartialName('System.Windows.Forms'); [System.Windows.Forms.MessageBox]::Show('Внимание, CPU загружен', 'Посмотреть')}"
Для отправки письма вы можете воспользоваться командлетом PowerShell Send-MailMessage или стороннюю утилиту mailsend.exe.. Для этого создайте аналогичное задание в Task Scheduler, в поле Program/Script укажите полный путь к утилите (у нас C:\Scripts\Mail\mailsend.exe), а в поле Add arguments (optional) через параметры нужно передать значения: электронный адрес, адрес и номер порта SMTP-сервера, текст письма и заголовка, пароль:
-to [email protected] -from [email protected] -ssl -port 465 -auth -smtp smtp.ddd.com -sub Alarm -v -user [email protected] +cc +bc -M "Alarm, CPU, Alarm" -pass "it12345"
где +cc означает не запрашивать копию письма, +bc — не запрашивать скрытую копию письма.