
Приветствую, друзья! Сегодня берусь за дело dumpchk.exe — должен узнать что за процесс/программа. Постараюсь найти максимум информации, напишу вам все простыми словами. Поехали!
Официальная информация
Нашел сайт Майкрософт, где пишется что dumpchk.exe — сервисная консольная утилита проверки корректности создания файла дампа пмяти. Также сказано — программа не требует доступа к символам, что это значит — к сожалению непонятно. Случайно узнал — файлы символов оказывается находятся здесь:
C:\WINDOWS\Symbols
Скорее всего dumpchk.exe — команда консоли. Однако у меня стоит десятка — запустил командную строку, хотел вызвать справку по команде — ошибка, мол не является внутренней или внешней командой:

Я поспешил — на сайте Майкрософт сказано — dumpchk.exe находится на компакт-диске Win XP, на сегодняшний день это устаревшая система. Вроде бы даже если установить XP — dumpchk.exe будет отсутствовать, чтобы появился, необходимо установить средства поддержки из папки Support\Tools установочного диска XP. По умолчанию программа установится в эту папку:
C:\Program Files\Support Tools
На заметку — компонент также входит в состав Debugging Tools for Windows (как понимаю это инструменты для отладки). Также вроде бы dumpchk.exe присутствует в Windows Automated Installation Kit (WAIK).
Важно: при помощи команды можно вытащить код ошибки. Возможно имеется ввиду ситуация когда внезапно появляется так называемый синий экран (BSOD), и потом можно узнать при помощи команды что за ошибка была — получить ее код.
При успешной установки команда станет доступной из консоли. Для вызова консоли (cmd):
- Зажмите Win + R
- Введите cmd.exe
- Нажмите ОК.
После всех шагов появится черное окно — это командная строка/консоль (Command line).
Какие параметры существуют?
Параметры указываются после указания самой команды, через пробел. На сайте Майкрософт не совсем понятно написано как работать с параметрами. Поэтому пришлось еще поискать информации — нашел. Итак, смотрите:
Вы открываете консоль. Как — написал выше.
Далее нужно прописать dumpchk.exe. Если установили Debugging Tools for Windows (DTW) — указывайте в таком виде:
C:\Program Files\Debugging Tools for Windows (x86)\dumpchk.exe
Нужно прописывать полный путь. Если установили средства поддержки — возможно команда будет в папке:
C:\Windows\System32
Кстати, возможно Debugging Tools for Windows и есть средства поддержки.
Далее нужны файлы символов, мы выяснили, они находятся здесь:
C:\WINDOWS\Symbols
Аварийный файл находится как правило здесь (название файла приведено для примера):
C:\WINDOWS\Minidump\Mini010609-01.dmp
В итоге чтобы запустить команду поиска символов для анализа дампа (возможно неправильно написал, заранее прошу прощение) необходимо написать:
"C:\Program Files\Debugging Tools for Windows (x86)\dumpchk.exe" -y C:\WINDOWS\Symbols C:\WINDOWS\Minidump\Mini010609-01.dmp
Буква -y в строке — параметр, необходим как раз для поиска символов. Кроме него есть другие:
- -? — показывает справку по команде.
- -p — печатает только заголовок, не совсем понятно что имеется ввиду.
- -v — режим подробного вывода.
- -c — проверка файла дампа.
- -x — дополнительная проверка.
- -e — анализ дампа.
- -q — быстрая проверка (не применима в XP).
Также с dumpchk.exe может быть ошибка (Application Error):

В принципе ошибка скорее некритичная, однако если будет сбой BSOD, то могут быть проблемы при анализ дампа.
Как открыть настройки файла дампа?
На заметку. В Виндовс 10 чтобы открыть настройки файла дампа (файлы идут с расширением dmp, стандартное название — MEMORY.DMP):
- Необходимо открыть Свойства системы — в панели управления значок Система:

- Нажать Дополнительные параметры:
- На вкладке Дополнительно внизу будет раздел Загрузка и восстановление, нажать Параметры:
- Появится окно Загрузка и восстановление, где и будут сами настройки:


Важно: без необходимости настройки не менять!
Заключение
dumpchk.exe — компонент по работе с файлом дампа памяти, устанавливается как понимаю вручную. Файл создается при возникновении сбоя системы — может помочь выявить проблему.
Данная команда, как понимаю, работает в XP. Возможно в семерке, десятке присутствует альтернатива.
Выяснил еще — dumpchk.exe содержится и в дистрибутиве Win2k Server.
Настоятельно рекомендую посетить официальный сайт Майкрософт, где сказано об этой команде.
На этом все. Удачи.
На главную!
01.01.2019
Here I have provided detailed information about DumpChk, what is it, its uses, and how to fix it. Different types of executable files are responsible for running different programs and one among them is the Dumpchk.exe file. Developed by Microsoft, it’s one of the components of the Windows debugging tools that runs a quick scan on a crash dump file.
The full form of DumpChk is Dump Checker that is commonly known as the Microsoft Crash Dump File Checker tool.
Quick Overivew
What is a Dumpchk.exe?
When a program or software crashes then it automatically generates a dump file on the system. This dump file allows the System Administrator to check why the particular program crashes. Now here the DumpChk tool comes into the picture. If the Dump file crashes or not able to open then this DumpChk allows to check the dump files and reveal the information that might be helpful for the system administrator.
Is it a Virus or Safe?
To spot a virus you must check the location of the .exe file, for instance, a genuine dumpchk.exe file is usually found in the location below:
C:\Program Files\Microsoft Corporation\Debugging Tools for Windows®\dumpchk.exe
To confirm its exact path, follow the below process:
- Right-click on Taskbar and select Task Manager from the menu.
- Click on the Details tab
- Now, right-click over dumpchk.exe and choose Open file location
This will add a column (Image pathname) under the Details tab which will display the location of each file.
Alternatively, you can also use Process Explorer by Microsoft to check if a process is genuine or a virus. Download the widget from here. It does not need o to be installed. Now, follow the process as below:
- Run the Process Explorer from the zip file and go to the Options
- Select the Verify Image Signatures option and this will add a column to the Explorer.
You can now check the Verify Image Signature column if the process is valid or not. A valid process will show “Verified Signer” status, while a suspicious process may show “Unable to Verify” status. However, it is to note, that some valid Windows processes also may show the status as “Unable to Verify”, so double-check the process before you take any action.
Can I Delete the Dumpchck.exe File?
Even if you feel that a process is unsafe, or Dumpchck consuming high disk space or CPU, it’s suggested to cross-check the file location before you delete any executable that’s crucial for Windows processes. It’s not recommended to remove this file from the system.
To avoid such issues, you must run a virus scan on your system at regular intervals using a trusted 3rd party anti-virus tool, and also keep your software and drivers updated at all times.
But, if you still want to delete the dumpchk.exe file, you can remove the Debugging Tools for Windows® using the below process:
- Press the Windows logo on the Keyboard
- Type Control Panel and click on it
- On the top-right-side corner, besides view by choosing Category
- Now click on Uninstall a program
- Locate Debugging Tools for Windows®.
- Right-click and choose Uninstall
- Now, follow the on-screen instructions to complete the uninstallation process and delete the dumpchk.exe file completely.
Once done then you can download the latest copy of Debugging Tools (dumpchk.exe) from the Microsoft official website.
Example of Dumpchk Command in Command Prompt
Let’s see an example:
- Go to Start, right-click on it and click on the Run
- In the Run command window, type cmd and press the Ctrl + Shift + Enter shortcut keys.
- In the console, run the below command:
C:\Debuggers>dumpchkc:\mydir\dumpfile2.dmp
*Note – replace the highlighted part with the location of your dump file.
- If it returns a message – Finished dump check, then it’s a success.
- But if it returns the message – DebugClient cannot open DumpFile then it means that the dumpchk file is corrupt.
Learn how to fix Windows Update Error 0x8024200d
How to Fix the Corrupt Dumpchk.exe?
There are a few simple and easy methods that can be used to fix the damaged Dumpchk.exe files.
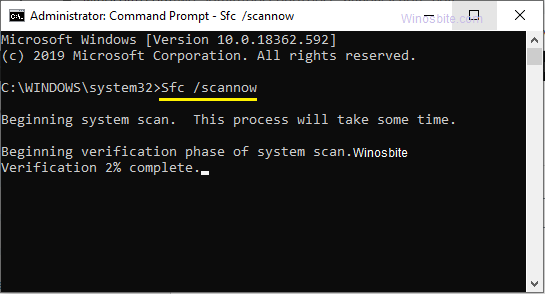
Run SFC/Scannow
Windows OS has an inbuilt repair command tool that can execute with admin access, here are the steps:
- Open Command Promot with Admin access
- Type sfc /scannow and hit the Enter button

- Wait for the command tool to finish the process
- Once done then restart the system
So that was all about Dumpchk.exe file. If you still have any queries then feel free to leave your comment below.
Как вариант — BlueScreenView
Попробуем…
Он ничего не выдаёт во время работы, а после его закрытия появляется файл и вот его содержимое:
[General]
ShowGridLines=1
SaveFilterIndex=0
ShowInfoTip=1
ShowTimeInGMT=1
VerSplitLoc=16383
LowerPaneMode=1
MarkDriversInStack=1
AddExportHeaderLine=0
ComputersFile=
LoadFrom=1
DumpChkCommand=»»%programfiles%\Debugging Tools for Windows\DumpChk.exe» «%1″»
WinPos=2C 00 00 00 00 00 00 00 01 00 00 00 FF FF FF FF FF FF FF FF FF FF FF FF FF FF FF FF 5E 01 00 00 BC 00 00 00 DE 03 00 00 9C 02 00 00
Columns=B4 00 00 00 78 00 01 00 96 00 02 00 6E 00 03 00 6E 00 04 00 6E 00 05 00 6E 00 06 00 6E 00 07 00 96 00 08 00 78 00 09 00 8C 00 0A 00 82 00 0B 00 78 00 0C 00 78 00 0D 00 50 00 0E 00 50 00 0F 00 50 00 10 00 5A 00 11 00 5A 00 12 00 5A 00 13 00
Sort=4097
ModulesColumns=B4 00 00 00 78 00 01 00 78 00 02 00 78 00 03 00 78 00 04 00 78 00 05 00 78 00 06 00 78 00 07 00 78 00 08 00 78 00 09 00 78 00 0A 00 78 00 0B 00
ModulesSort=1
Изменено пользователем Никита Помазанов
Provide feedback
Saved searches
Use saved searches to filter your results more quickly
Sign up
Appearance settings
Although minidump is often used, in reality, this refers to a Windows crash dump file. A crash dump file is created when Windows runs into a critical error and halts execution. A blue screen comes up in most cases that shows the stop error code and an error message. Solving a system crash means knowing how to analyze Windows minidump files. There are a few methods that you can use.
The Windows crash dump files can be minidump files (or small memory dump files) or full memory dump files. Which type is created can be configured. Depending on the type of memory dump file created, various tools are available to open the crash dump file and analyze it.
Using the Microsoft Dump Check Utility
The Microsoft Dump Check utility (or DumpChk.exe) is part of the Debugging Tools for Windows. Although the utility is part of the Windows Driver Kit (WDK) and the Software Development Kit (SDK), it is not necessary to install those completely. It is possible to only install the Debugging Tools for Windows. Here is how.
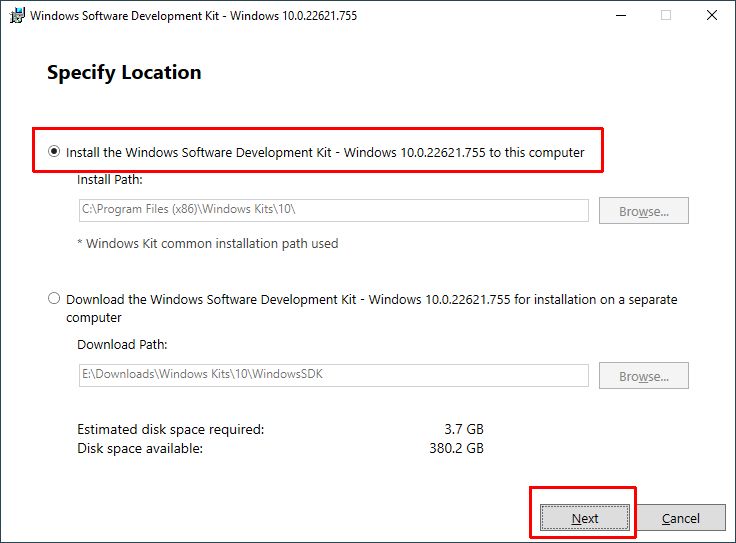
- Download the Windows SDK (use the Download the installer option, not the .iso option).
- Execute the downloaded SDK setup program (winsdksetup.exe).
- Select the default option to install the SDK on the computer the installer is being executed on.

- Click Next.
- Select the Windows Kit Privacy option and click Next.
- Accept the License Agreement.
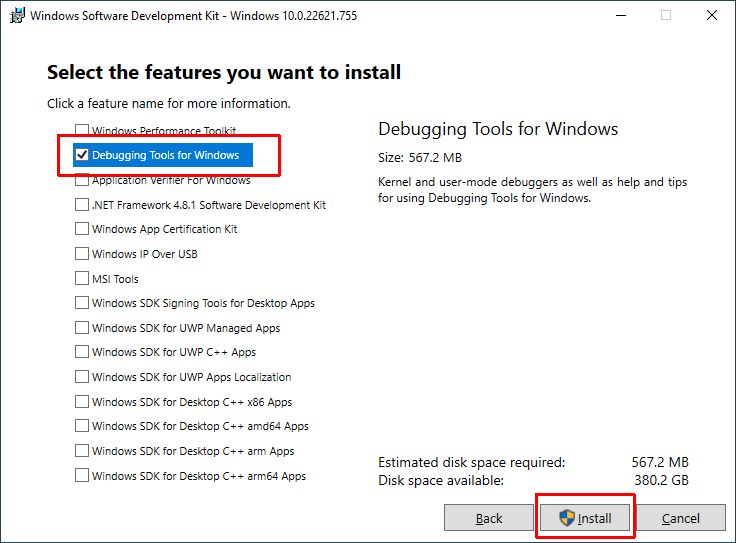
- Now deselect all options except for the Debugging Tools for Windows and click Install.
- Now wait for the installation of the SDK to complete and click the Close button to finish the installation.
After this, the DumpChk utility is available from the command prompt. Simply open a command prompt and execute the command dumpchk.exe <minidump file>
If the path to the dumpchk utility is not found, include it in the command, or make that folder the current folder. That is what is done in the example below. The parameter to the minidump includes the full path to the actual minidump.
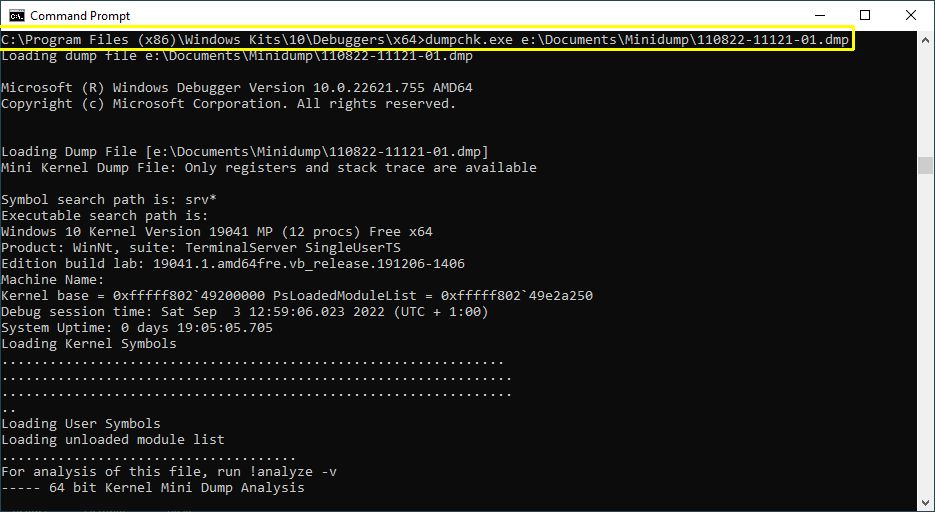
After pressing the Enter key, the utility will analyze the minidump file and show the results on the screen.
Wait for the command to finish, which will be visible from the text “Finished dump check” being shown and the command prompt returning.
You can now check the output of the command by scrolling back up to see the stop code details and the driver names.
Tip: to save the output of the DumpChk command to a text file, simply redirect the output using the > symbol. E.g. “c:\Program Files (x86)\Windows Kits\10\Debuggers\x64\dumpchk.exe" minidump.dmp > dumpoutput.txt“
After this, you can use a text editor to view and analyze the minidump output from the DumpChk command instead of scrolling in the command prompt window.
Using the Windows Debugger to Analyze Windows Minidump Files
To Windows debugger is also part of the Windows Debugging Tools for Windows. So, follow the steps in Microsoft Dump Check Utility to install that part of the SDK.
Use the WinDbgPreview App
An alternative way is to use the WinDbg Preview app from the Microsoft App Store. Visit the Microsoft download page and click the Get in Store app button.
After installing the Windows Debugger, you can analyze the minidump files with the WinDbg Preview app.
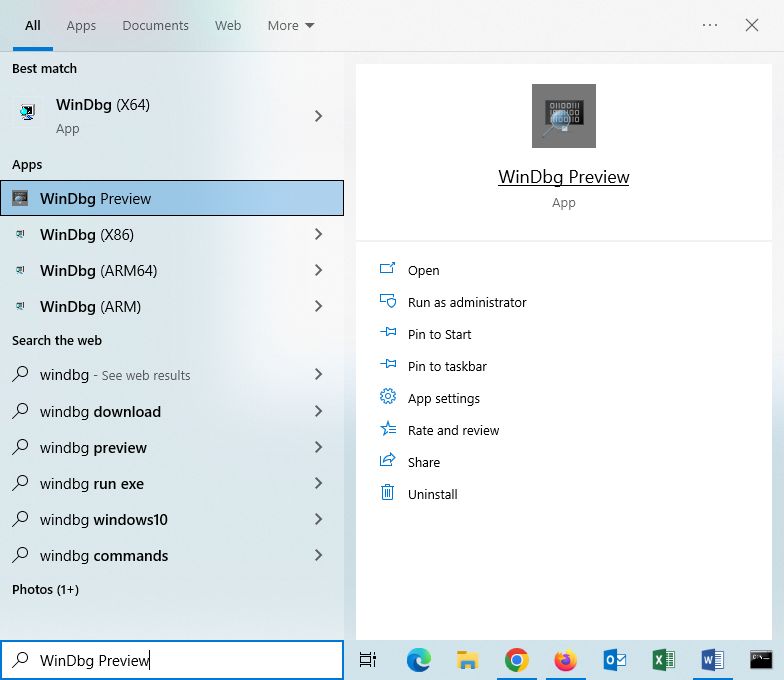
- Search for “windbg” in the Start menu search, and click the WinDbg Preview App.

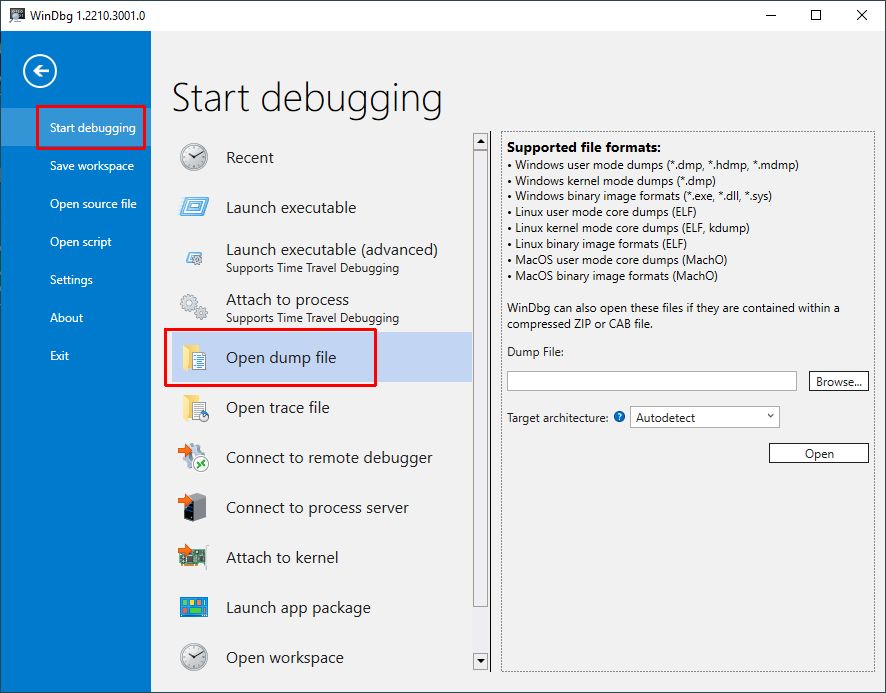
- In the WinDbg app window, click the File menu.
- Make sure Start debugging is selected in the left-hand pane.
- Click the Open dump file option.

- Next, click the Browse button in the right-hand pane.
- Navigate to and select the minidump file and click Open.
- In the WinDbg window, click the Open button to load the minidump file into the debugger.
- Once the file is loaded and processed, type “
!analyze -v” to let WinDbg analyze the contents of the minidump.
The cursor will show BUSY and the BugCheck Analysis is executed. Once complete, you can scroll through and review the output to find the cause of the problem.
The output will include the stop error (text and code), exception details, and module and image name, all of which are useful to find the offending module (very often a driver).
Use the WinDbg executable from the SDK
If you installed the debugging tools using the SDK installer, running the WinDbg is almost the same but it looks a little different.
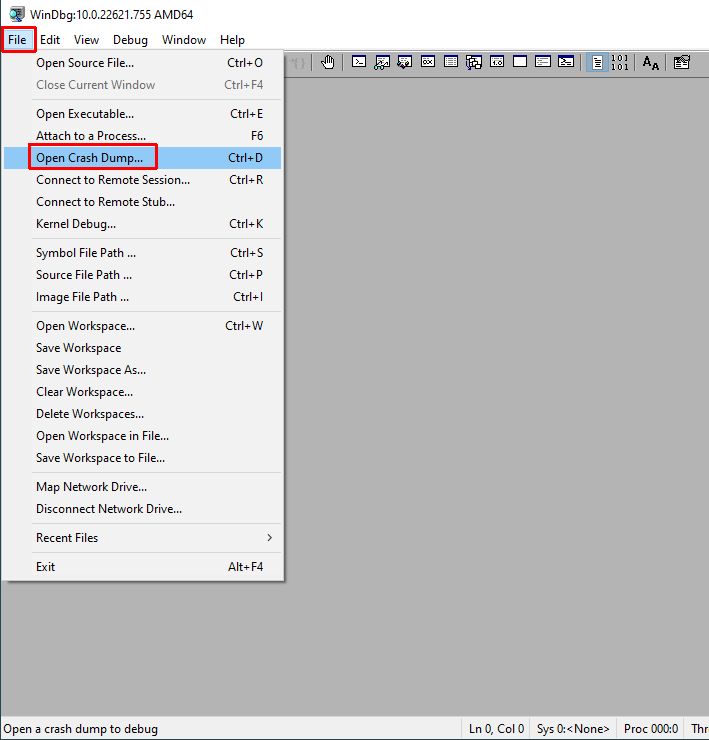
- Search for “windbg” in the Start menu search, and click the “WinDbg (x64)” option. Or “(WinDbg (x86)” for 32-bit systems.
- In the WinDbg program window, select File and then click Open Crash Dump.

- Navigate to and select the minidump file and click Open.
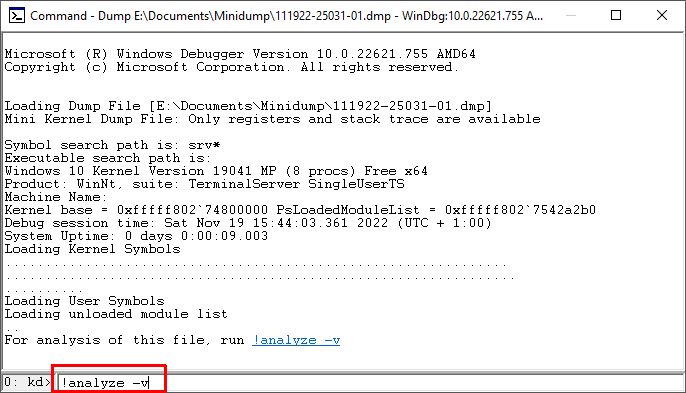
- Once the file is loaded, again type the “
!analyze -v” command followed by the Enter key to run the bugcheck analysis.
- The output is the same as in the WinDbg Preview App.
For more details on how to use the Windows debugger, also check the command reference. The debugger can be a great tool for finding the cause of blue screen errors, but using it can get technical and complicated fast. A first step beyond the basic usage is to use the symbol files as they help make the output easier to read.
Using BlueScreenView to Analyze Windows Minidump Files
The BlueScreenView program is a third-party application that can be downloaded from the NirSoft website. You can download it as a ZIP file or as an installer. If you choose the installer, make sure to pick the right version (32-bit or 64-bit). Even though the program is a little older (last updated in 2015), it can still be very useful to quickly check the details of a minidump.
The program hardly takes any space on disk, which cannot be said for the Microsoft SDK tools. And since it is freeware, there is no reason not to give it a try.
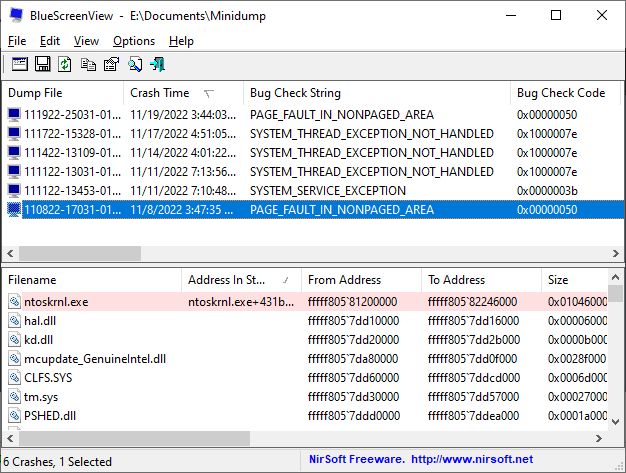
When the program is executed, it will automatically load and show the details of the minidumps present on the system. If you do not see anything, there either are no minidump files available, or a different path is used.
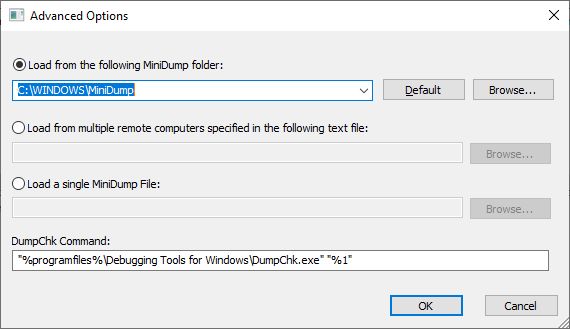
To specify the location of the minidump files on the system, use the Options menu and select Advanced Options. In the window that comes up, the folder for the minidumps can be selected.
For each minidump file, the program shows the details related to the computer status. This includes the drivers that were loaded during the crash.
More details can be found on the program website. There are details on usage as well as interpretation of the information shown in the program.