
PostgreSQL Server Exporter
Prometheus exporter for PostgreSQL server metrics.
CI Tested PostgreSQL versions: 11, 12, 13, 14, 15, 16, 17.
Quick Start
This package is available for Docker:
# Start an example database
docker run --net=host -it --rm -e POSTGRES_PASSWORD=password postgres
# Connect to it
docker run \
  --net=host \
  -e DATA_SOURCE_URI="localhost:5432/postgres?sslmode=disable" \
  -e DATA_SOURCE_USER=postgres \
  -e DATA_SOURCE_PASS=password \
  quay.io/prometheuscommunity/postgres-exporter
Test with:
curl "http://localhost:9187/metrics"
Example Prometheus config:
scrape_configs:
  - job_name: postgres
    static_configs:
      - targets: ["127.0.0.1:9187"] # Replace IP with the hostname of the docker container if you're running the container in a separate network
Now use the DATA_SOURCE_PASS_FILE with a mounted file containing the password to prevent having the password in an environment variable.
The container process runs with uid/gid 65534 (important for file permissions).
Multi-Target Support (BETA)
This Feature is in beta and may require changes in future releases. Feedback is welcome.
This exporter supports the multi-target pattern. This allows running a single instance of this exporter for multiple postgres targets. Using the multi-target functionality of this exporter is optional and meant for cases where it is impossible to install the exporter as a sidecar, for example SaaS-managed services.
To use the multi-target functionality, send an http request to the endpoint /probe?target=foo:5432 where target is set to the DSN of the postgres instance to scrape metrics from.
To avoid putting sensitive information like username and password in the URL, preconfigured auth modules are supported via the auth_modules section of the config file. auth_modules for DSNs can be used with the /probe endpoint by specifying the ?auth_module=foo http parameter.
Example Prometheus config:
scrape_configs:
  - job_name: 'postgres'
    static_configs:
      - targets:
        - server1:5432
        - server2:5432
    metrics_path: /probe
    params:
      auth_module: [foo]
    relabel_configs:
      - source_labels: [__address__]
        target_label: __param_target
      - source_labels: [__param_target]
        target_label: instance
      - target_label: __address__
        replacement: 127.0.0.1:9116  # The postgres exporter's real hostname:port.
Configuration File
The configuration file controls the behavior of the exporter. It can be set using the --config.file command line flag and defaults to postgres_exporter.yml.
auth_modules
This section defines preset authentication and connection parameters for use in the multi-target endpoint. auth_modules is a map of modules with the key being the identifier which can be used in the /probe endpoint.
Currently only the userpass type is supported.
Example:
auth_modules:
  foo1: # Set this to any name you want
    type: userpass
    userpass:
      username: first
      password: firstpass
    options:
      # options become key=value parameters of the DSN
      sslmode: disable
Building and running
git clone https://github.com/prometheus-community/postgres_exporter.git
cd postgres_exporter
make build
./postgres_exporter <flags>
To build the Docker image:
make promu
promu crossbuild -p linux/amd64 -p linux/armv7 -p linux/arm64 -p linux/ppc64le
make docker
This will build the docker image as prometheuscommunity/postgres_exporter:${branch}.
Flags
-
help
Show context-sensitive help (also try —help-long and —help-man). -
[no-]collector.database
Enable thedatabasecollector (default: enabled). -
[no-]collector.database_wraparound
Enable thedatabase_wraparoundcollector (default: disabled). -
[no-]collector.locks
Enable thelockscollector (default: enabled). -
[no-]collector.long_running_transactions
Enable thelong_running_transactionscollector (default: disabled). -
[no-]collector.postmaster
Enable thepostmastercollector (default: disabled). -
[no-]collector.process_idle
Enable theprocess_idlecollector (default: disabled). -
[no-]collector.replication
Enable thereplicationcollector (default: enabled). -
[no-]collector.replication_slot
Enable thereplication_slotcollector (default: enabled). -
[no-]collector.stat_activity_autovacuum
Enable thestat_activity_autovacuumcollector (default: disabled). -
[no-]collector.stat_bgwriter
Enable thestat_bgwritercollector (default: enabled). -
[no-]collector.stat_database
Enable thestat_databasecollector (default: enabled). -
[no-]collector.stat_progress_vacuum
Enable thestat_progress_vacuumcollector (default: enabled). -
[no-]collector.stat_statements
Enable thestat_statementscollector (default: disabled). -
[no-]collector.stat_user_tables
Enable thestat_user_tablescollector (default: enabled). -
[no-]collector.stat_wal_receiver
Enable thestat_wal_receivercollector (default: disabled). -
[no-]collector.statio_user_indexes
Enable thestatio_user_indexescollector (default: disabled). -
[no-]collector.statio_user_tables
Enable thestatio_user_tablescollector (default: enabled). -
[no-]collector.wal
Enable thewalcollector (default: enabled). -
[no-]collector.xlog_location
Enable thexlog_locationcollector (default: disabled). -
config.file
Set the config file path. Default ispostgres_exporter.yml -
web.systemd-socket
Use systemd socket activation listeners instead of port listeners (Linux only). Default isfalse -
web.listen-address
Address to listen on for web interface and telemetry. Default is:9187. -
web.config.file
Configuration file to use TLS and/or basic authentication. The format of the
file is described in the exporter-toolkit repository. -
web.telemetry-path
Path under which to expose metrics. Default is/metrics. -
disable-default-metrics
Use only metrics supplied fromqueries.yamlvia--extend.query-path. Default isfalse. -
disable-settings-metrics
Use the flag if you don’t want to scrapepg_settings. Default isfalse. -
auto-discover-databases(DEPRECATED)
Whether to discover the databases on a server dynamically. Default isfalse. -
extend.query-path(DEPRECATED)
Path to a YAML file containing custom queries to run. Check outqueries.yaml
for examples of the format. -
dumpmaps
Do not run — print the internal representation of the metric maps. Useful when debugging a custom
queries file. -
constantLabels(DEPRECATED)
Labels to set in all metrics. A list oflabel=valuepairs, separated by commas. -
version
Show application version. -
exclude-databases(DEPRECATED)
A list of databases to remove when autoDiscoverDatabases is enabled. -
include-databases(DEPRECATED)
A list of databases to only include when autoDiscoverDatabases is enabled. -
log.level
Set logging level: one ofdebug,info,warn,error. -
log.format
Set the log format: one oflogfmt,json.
Environment Variables
The following environment variables configure the exporter:
-
DATA_SOURCE_NAME
the default legacy format. Accepts URI form and key=value form arguments. The
URI may contain the username and password to connect with. -
DATA_SOURCE_URI
an alternative toDATA_SOURCE_NAMEwhich exclusively accepts the hostname
without a username and password component. For example,my_pg_hostnameor
my_pg_hostname:5432/postgres?sslmode=disable. -
DATA_SOURCE_URI_FILE
The same as above but reads the URI from a file. -
DATA_SOURCE_USER
When usingDATA_SOURCE_URI, this environment variable is used to specify
the username. -
DATA_SOURCE_USER_FILE
The same, but reads the username from a file. -
DATA_SOURCE_PASS
When usingDATA_SOURCE_URI, this environment variable is used to specify
the password to connect with. -
DATA_SOURCE_PASS_FILE
The same as above but reads the password from a file. -
PG_EXPORTER_WEB_TELEMETRY_PATH
Path under which to expose metrics. Default is/metrics. -
PG_EXPORTER_DISABLE_DEFAULT_METRICS
Use only metrics supplied fromqueries.yaml. Value can betrueorfalse. Default isfalse. -
PG_EXPORTER_DISABLE_SETTINGS_METRICS
Use the flag if you don’t want to scrapepg_settings. Value can betrueorfalse. Default isfalse. -
PG_EXPORTER_AUTO_DISCOVER_DATABASES(DEPRECATED)
Whether to discover the databases on a server dynamically. Value can betrueorfalse. Default isfalse. -
PG_EXPORTER_EXTEND_QUERY_PATH
Path to a YAML file containing custom queries to run. Check outqueries.yaml
for examples of the format. -
PG_EXPORTER_CONSTANT_LABELS(DEPRECATED)
Labels to set in all metrics. A list oflabel=valuepairs, separated by commas. -
PG_EXPORTER_EXCLUDE_DATABASES(DEPRECATED)
A comma-separated list of databases to remove when autoDiscoverDatabases is enabled. Default is empty string. -
PG_EXPORTER_INCLUDE_DATABASES(DEPRECATED)
A comma-separated list of databases to only include when autoDiscoverDatabases is enabled. Default is empty string,
means allow all. -
PG_EXPORTER_METRIC_PREFIX
A prefix to use for each of the default metrics exported by postgres-exporter. Default ispg
Settings set by environment variables starting with PG_ will be overwritten by the corresponding CLI flag if given.
Setting the Postgres server’s data source name
The PostgreSQL server’s data source name
must be set via the DATA_SOURCE_NAME environment variable.
For running it locally on a default Debian/Ubuntu install, this will work (transpose to init script as appropriate):
sudo -u postgres DATA_SOURCE_NAME="user=postgres host=/var/run/postgresql/ sslmode=disable" postgres_exporter
Also, you can set a list of sources to scrape different instances from the one exporter setup. Just define a comma separated string.
sudo -u postgres DATA_SOURCE_NAME="port=5432,port=6432" postgres_exporter
See the github.com/lib/pq module for other ways to format the connection string.
Adding new metrics
The exporter will attempt to dynamically export additional metrics if they are added in the
future, but they will be marked as «untyped». Additional metric maps can be easily created
from Postgres documentation by copying the tables and using the following Python snippet:
x = """tab separated raw text of a documentation table"""
for l in StringIO(x):
    column, ctype, description = l.split('\t')
    print """"{0}" : {{ prometheus.CounterValue, prometheus.NewDesc("pg_stat_database_{0}", "{2}", nil, nil) }}, """.format(column.strip(), ctype, description.strip())
Adjust the value of the resultant prometheus value type appropriately. This helps build
rich self-documenting metrics for the exporter.
Adding new metrics via a config file (DEPRECATED)
This feature is deprecated in favor of built-in collector functions. For generic SQL database monitoring see the sql_exporter.
The -extend.query-path command-line argument specifies a YAML file containing additional queries to run.
Some examples are provided in queries.yaml.
Disabling default metrics
To work with non-officially-supported postgres versions (e.g. 8.2.15),
or variants of postgres (e.g. Greenplum), you can disable the default metrics with the --disable-default-metrics
flag. This removes all built-in metrics, and uses only metrics defined by queries in the queries.yaml file you supply
(so you must supply one, otherwise the exporter will return nothing but internal statuses and not your database).
Automatically discover databases (DEPRECATED)
To scrape metrics from all databases on a database server, the database DSN’s can be dynamically discovered via the
--auto-discover-databases flag. When true, SELECT datname FROM pg_database WHERE datallowconn = true AND datistemplate = false and datname != current_database() is run for all configured DSN’s. From the
result a new set of DSN’s is created for which the metrics are scraped.
In addition, the option --exclude-databases adds the possibily to filter the result from the auto discovery to discard databases you do not need.
If you want to include only subset of databases, you can use option --include-databases. Exporter still makes request to
pg_database table, but do scrape from only if database is in include list.
Running as non-superuser
To be able to collect metrics from pg_stat* views as non-superuser in PostgreSQL
server versions >= 10 you can grant the pg_monitor or pg_read_all_stats built-in roles to the user. If
you need to monitor older PostgreSQL servers, you will have to create functions
and views as a superuser, and assign permissions separately to those.
-- To use IF statements, hence to be able to check if the user exists before
-- attempting creation, we need to switch to procedural SQL (PL/pgSQL)
-- instead of standard SQL.
-- More: https://www.postgresql.org/docs/9.3/plpgsql-overview.html
-- To preserve compatibility with <9.0, DO blocks are not used; instead,
-- a function is created and dropped.
CREATE OR REPLACE FUNCTION __tmp_create_user() returns void as $$
BEGIN
  IF NOT EXISTS (
          SELECT                       -- SELECT list can stay empty for this
          FROM   pg_catalog.pg_user
          WHERE  usename = 'postgres_exporter') THEN
    CREATE USER postgres_exporter;
  END IF;
END;
$$ language plpgsql;

SELECT __tmp_create_user();
DROP FUNCTION __tmp_create_user();

ALTER USER postgres_exporter WITH PASSWORD 'password';
ALTER USER postgres_exporter SET SEARCH_PATH TO postgres_exporter,pg_catalog;

-- If deploying as non-superuser (for example in AWS RDS), uncomment the GRANT
-- line below and replace <MASTER_USER> with your root user.
-- GRANT postgres_exporter TO <MASTER_USER>;

GRANT CONNECT ON DATABASE postgres TO postgres_exporter;
Run following command if you use PostgreSQL versions >= 10
GRANT pg_monitor to postgres_exporter;
Run following SQL commands only if you use PostgreSQL versions older than 10.
In PostgreSQL, views run with the permissions of the user that created them so
they can act as security barriers. Functions need to be created to share this
data with the non-superuser. Only creating the views will leave out the most
important bits of data.
CREATE SCHEMA IF NOT EXISTS postgres_exporter;
GRANT USAGE ON SCHEMA postgres_exporter TO postgres_exporter;

CREATE OR REPLACE FUNCTION get_pg_stat_activity() RETURNS SETOF pg_stat_activity AS
$$ SELECT * FROM pg_catalog.pg_stat_activity; $$
LANGUAGE sql
VOLATILE
SECURITY DEFINER;

CREATE OR REPLACE VIEW postgres_exporter.pg_stat_activity
AS
  SELECT * from get_pg_stat_activity();

GRANT SELECT ON postgres_exporter.pg_stat_activity TO postgres_exporter;

CREATE OR REPLACE FUNCTION get_pg_stat_replication() RETURNS SETOF pg_stat_replication AS
$$ SELECT * FROM pg_catalog.pg_stat_replication; $$
LANGUAGE sql
VOLATILE
SECURITY DEFINER;

CREATE OR REPLACE VIEW postgres_exporter.pg_stat_replication
AS
  SELECT * FROM get_pg_stat_replication();

GRANT SELECT ON postgres_exporter.pg_stat_replication TO postgres_exporter;

CREATE EXTENSION IF NOT EXISTS pg_stat_statements;
CREATE OR REPLACE FUNCTION get_pg_stat_statements() RETURNS SETOF pg_stat_statements AS
$$ SELECT * FROM public.pg_stat_statements; $$
LANGUAGE sql
VOLATILE
SECURITY DEFINER;

CREATE OR REPLACE VIEW postgres_exporter.pg_stat_statements
AS
  SELECT * FROM get_pg_stat_statements();

GRANT SELECT ON postgres_exporter.pg_stat_statements TO postgres_exporter;
NOTE
Remember to usepostgresdatabase name in the connection string:DATA_SOURCE_NAME=postgresql://postgres_exporter:password@localhost:5432/postgres?sslmode=disable
Running the tests
# Run the unit tests
make test
# Start the test database with docker
docker run -p 5432:5432 -e POSTGRES_DB=circle_test -e POSTGRES_USER=postgres -e POSTGRES_PASSWORD=test -d postgres
# Run the integration tests
DATA_SOURCE_NAME='postgresql://postgres:test@localhost:5432/circle_test?sslmode=disable' GOOPTS='-v -tags integration' make test
взято с https://mcs.mail.ru/docs/
Конфигурация оборудования
Чтобы выполнить данный сценарий мониторинга, установите и настройте серверы с использованием следующего оборудования:
- Prometheus 2.13 на ОС Ubuntu 18.04 LTS x86_64.
- Grafana 6.4.2 на ОС Ubuntu 18.04 LTS x86_64.
- PostgreSQL 10 на ОС Ubuntu 18.04 LTS x86_64.
Внимание
При использовании серверов и оборудования других версий некоторые шаги сценария могут отличаться, от описанных ниже.
Схема работы
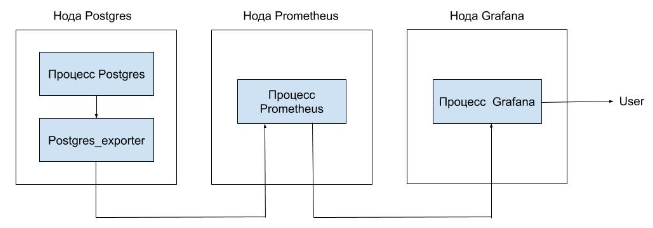
Для мониторинга параметров PostreSQL и сбора метрик в Prometheus используется экспортер, который опрашивает сервер PostgreSQL и передает данные серверу Prometheus. Данные можно визуализировать в Grafana с помощью Dashboard.
Установка postgres_exporter
- Выполните логин на сервере PostgreSQL с правами суперпользователя.
- Укажите актуальную версию экспортера:
export VERSION="<версия>"
- Скачайте архив postgres_exporter и распакуйте его в папку /tmp:
wget https://github.com/wrouesnel/postgres_exporter/releases/download/v$VERSION/postgres_exporter_v$VERSION_linux-amd64.tar.gz -O - | tar -xzv -C /tmp
- Скопируйте содержимое распакованного архива в папку /usr/local/bin:
cp /tmp/postgres_exporter_v$VERSION_linux-amd64/postgres_exporter /usr/local/bin
- Удалите содержимое распакованного архива из папки /tmp:
rm -rf /tmp/postgres_exporter_v$VERSION_linux-amd64
- Измените владельца postgres_exporter на postgres:
chown -R postgres:postgres /usr/local/bin/postgres_exporter
- Создайте сценарий запуска systemd сервиса postgres_exporter. Для этого создайте файл /etc/systemd/system/postgres_exporter.service со следующим содержимым:
[Unit]
Description=Prometheus PostgreSQL Exporter
After=network.target

[Service]
Type=simple
Restart=always
User=postgres
Group=postgres
Environment=DATA_SOURCE_NAME="user=postgres host=/var/run/postgresql/ sslmode=disable"
ExecStart=/usr/local/bin/postgres_exporter
[Install]
WantedBy=multi-user.target
Примечание
Параметр Environment описывает передаваемые параметры доступа к серверу PostgreSQL. Если вы используете нестандартную инсталляцию PostgreSQL либо сервер и exporter расположены на разных нодах, настройте этот параметр.
- Запустите postgres_exporter:
systemctl daemon-reload
systemctl start postgres_exporter.service
systemctl enable postgres_exporter.service
Created symlink /etc/systemd/system/multi-user.target.wants/postgres_exporter.service → /etc/systemd/system/postgres_exporter.service.
- Убедитесь, что сервис запустился:
systemctl status postgres_exporter.service
● postgres_exporter.service - Prometheus PostgreSQL Exporter
   Loaded: loaded (/etc/systemd/system/postgres_exporter.service; disabled; vendor preset: enabled)
   Active: active (running) since Mon 2019-10-07 09:01:26 MSK; 6min ago
 Main PID: 4144 (postgres_export)
    Tasks: 4 (limit: 2359)
   Memory: 4.4M
   CGroup: /system.slice/postgres_exporter.service
           └─4144 /usr/local/bin/postgres_exporter

Oct 07 09:01:26 postgresql systemd[1]: Started Prometheus PostgreSQL Exporter.
Oct 07 09:01:26 postgresql postgres_exporter[4144]: time="2019-10-07T09:01:26+03:00" level=info msg="Established new database connection to \"/var/run/postgresql/:5432\"." source="postgres_exporter.go:777"
Oct 07 09:01:26 postgresql postgres_exporter[4144]: time="2019-10-07T09:01:26+03:00" level=info msg="Semantic Version Changed on \"/var/run/postgresql/:5432\": 0.0.0 -> 11.5.0" source="postgres_exporter.go:1229
Oct 07 09:01:26 postgresql postgres_exporter[4144]: time="2019-10-07T09:01:26+03:00" level=info msg="Starting Server: :9187" source="postgres_exporter.go:1437"
Внимание
По умолчанию postgres_exporter запускается на порту 9187, который должен быть доступен серверу Prometheus. При необходимости настройте межсетевой экран соответствующим образом.
Настройка Prometheus для получения данных postgres_exporter
- На ноде Prometheus выполните логин.
- В файле prometheus.yml для работы с postgres_exporter:
- В scrape_configs добавьте следующую секцию:
scrape_configs:
  - job_name: postgresql
    static_configs:
      - targets: ['10.0.0.4:9187']
        labels:
          alias: postgres
Примечание: если Prometheus запускается как контейнер изменения надо вносить в отдельный файл yml и указывать его при запуске контейнера, например docker run -d -p 9090:9090 -v .../prometheus.yml:/etc/prometheus/prometheus.yml prom/prometheus
- В секции targets впишите IP-адрес сервера postgres_exporter.
- Перезапустите сервис Prometheus:
systemctl reload prometheus.service
Настройка Grafana
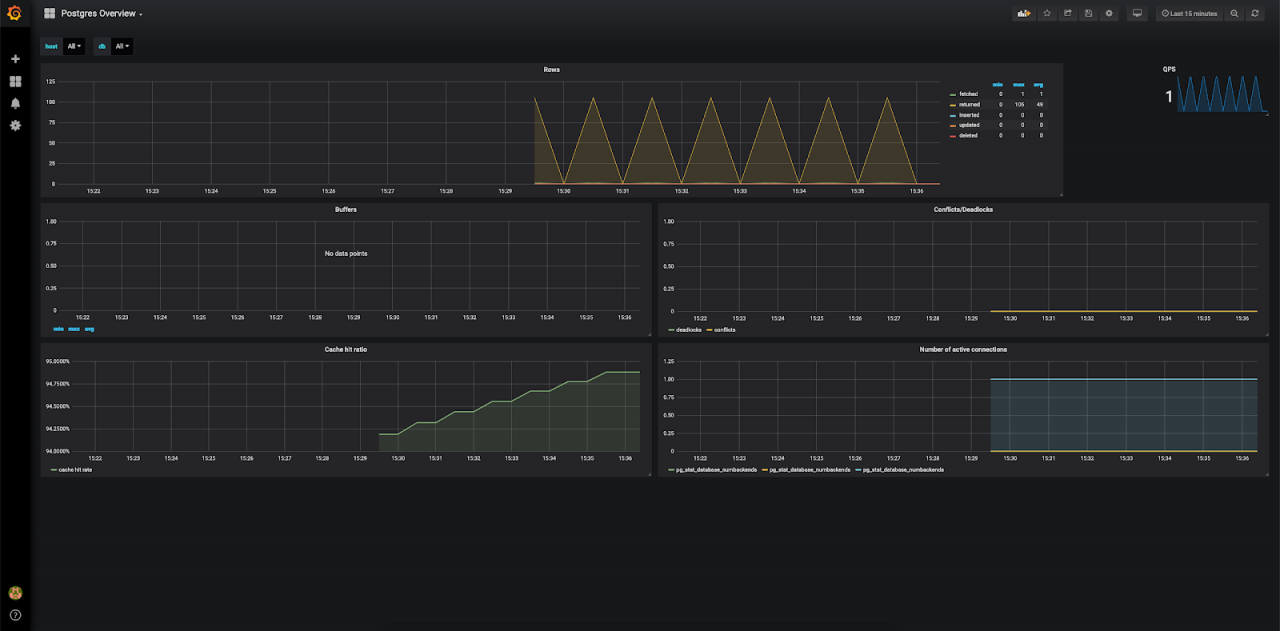
Для визуализации полученных данных установите соответствующий Dashboard (например, Dashboard 1 или Dashboard 2 ).
После установки и настройки получения данных с сервера Prometheus отобразится примерно следующее при использовании Dashboard 1:
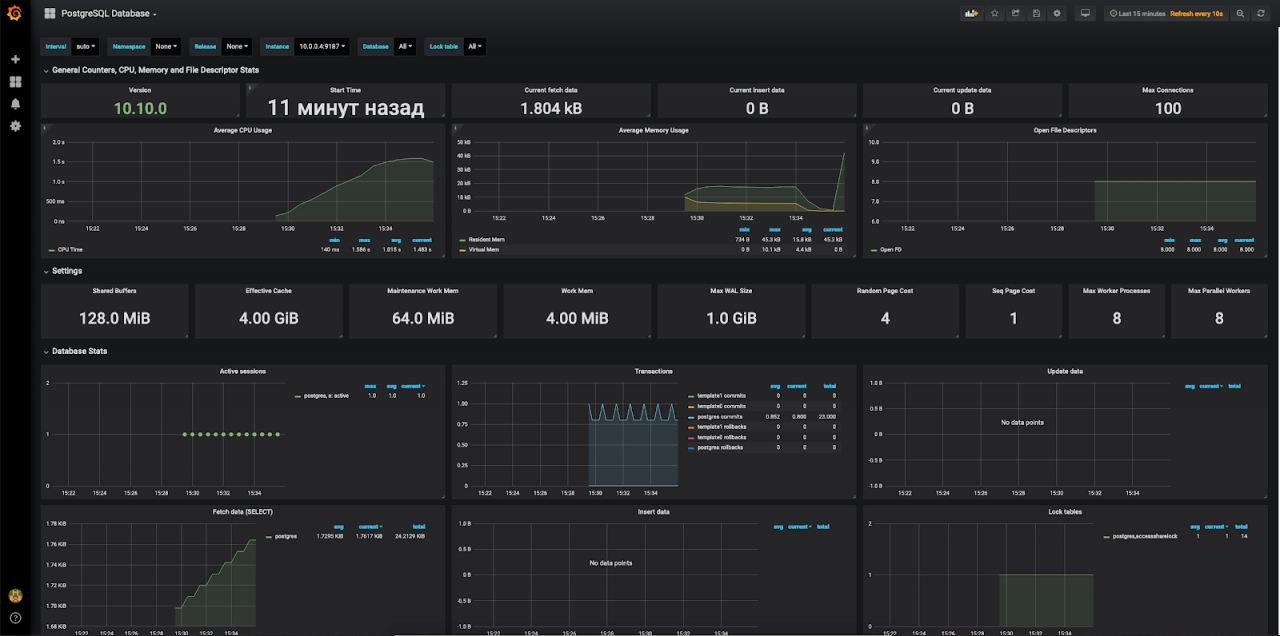
И примерно следующее при использовании Dashboard 2:
Создание тестовой нагрузки
Чтобы посмотреть, как изменятся графики при нагрузке на сервер PostgreSQL, воспользуйтесь утилитой pgbench, которая обычно входит в состав дистрибутива PostgreSQL (примеры использования см. тут и тут) .
Для этого:
- На сервере PostgreSQL запустите утилиту pgbench от имени пользователя postgres и создайте тестовое окружение:
postgres@postgresql:~pgbench -i -s 100
dropping old tables...
creating tables...
generating data...
100000 of 10000000 tuples (1%) done (elapsed 0.29 s, remaining 28.50 s)
200000 of 10000000 tuples (2%) done (elapsed 0.77 s, remaining 37.91 s)
300000 of 10000000 tuples (3%) done (elapsed 1.13 s, remaining 36.45 s)
...
10000000 of 10000000 tuples (100%) done (elapsed 44.51 s, remaining 0.00 s)
vacuuming...
creating primary keys...
done.
- Запустите тест:
latency average = 1146.629 ms
latency stddev = 788.623 ms
tps = 43.459191 (including connections establishing)
tps = 43.460132 (excluding connections establishing)postgres@postgresql:~pgbench -c 50 -j 2 -P 60 -T 600
starting vacuum...end.
progress: 60.0 s, 66.9 tps, lat 738.050 ms stddev 486.979
progress: 120.0 s, 51.2 tps, lat 967.935 ms stddev 543.852
progress: 180.0 s, 45.5 tps, lat 1110.148 ms stddev 694.265
progress: 240.0 s, 36.4 tps, lat 1367.563 ms stddev 880.951
progress: 300.0 s, 31.3 tps, lat 1556.174 ms stddev 958.462
progress: 360.0 s, 40.6 tps, lat 1254.119 ms stddev 865.300
progress: 420.0 s, 33.7 tps, lat 1500.918 ms stddev 816.979
progress: 480.0 s, 47.4 tps, lat 1057.629 ms stddev 789.382
progress: 540.0 s, 49.4 tps, lat 1009.890 ms stddev 703.514
progress: 600.0 s, 33.2 tps, lat 1500.623 ms stddev 847.839
transaction type: <builtin: TPC-B (sort of)>
scaling factor: 100
query mode: simple
number of clients: 50
number of threads: 2
duration: 600 s
number of transactions actually processed: 26183
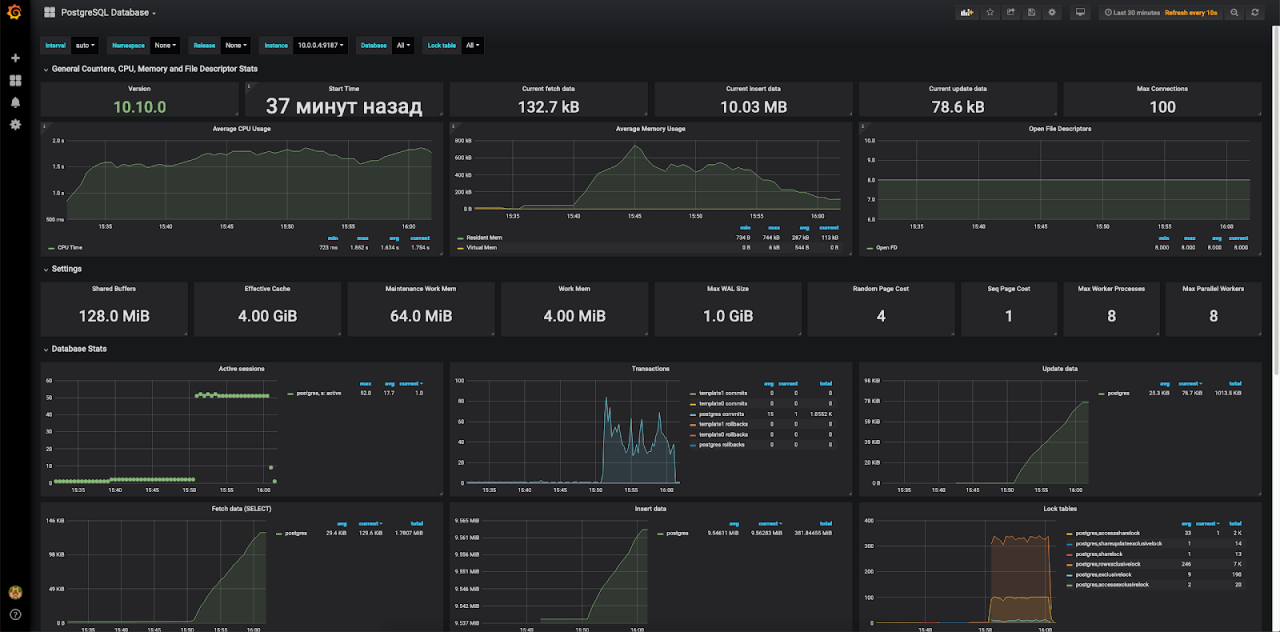
В результате тестовой нагрузки графики в Grafana изменяться:
Удаление postgres_exporter
Чтобы удалить postgres_exporter:
- Удалите Dashboard из Grafana.
- Из конфигурационного файла prometheus удалите секцию — job_name: postgresql.
- На сервере с postgres_exporter выполните команды:
root@postgresql:~# systemctl stop postgres_exporter.service
root@postgresql:~# systemctl disable postgres_exporter.service
Removed /etc/systemd/system/multi-user.target.wants/postgres_exporter.service.
root@postgresql:~# rm /etc/systemd/system/postgres_exporter.service
root@postgresql:~# systemctl daemon-reload
root@postgresql:~# rm -f /usr/local/bin/postgres_exporterДобрый день, читатели habr!
В первой заметке о posgres_exporter, я рассмотрел достаточно частный случай, при работе с новой, на тот момент фитчей, а именно возможностью мониторинга одним экспортером набора экземпляров и/или баз данных. И описал тот «букет» проблем с которыми при этом столкнулся и какие обходные решения применял, что бы это всё заработало.
И вот, 25 ноября, вышел очередной релиз postgres_exporter 0.8.0. В нём были решены проблемы описанные в предыдущей заметке, а также, что особо приятно, добавлен новый функционал.
Прошу под кат…
Для начала хотелось бы более подробно познакомить Вас с postgre_exporter и написать, своего рода, короткое руководство по быстрому старту. Пройдемся по основным пунктам:
- Переменные окружения и параметры запуска
- Что такое «метрики по-умолчанию»
- Как добавлять собственные метрики
Описание
postgres_exporter — утилита сбора метрик с экземпляров кластера СУБД PostgreSQL в формате доступном Prometheus, написанная на языке Go, имеет открытый исходный код и распространяется бесплатно.
Переменные окружения и аргументы командной строки
У postgres_exporter, как таковой, отсутствует конфигурационный файл и все параметры передаются в экспортер либо через переменные окружения, либо через аргументы командной строки. При этом, параметры подключения к СУБД возможно передать только через переменные окружения.
Переменные окружения
Как говорилось выше, переменные окружения можно разделить на две группы. Первые передают строку подключения, вторые — дублируют аргументы командной строки.
Начнем с первой группы. Эти переменные начинаются с префикса DATA_SOURCE_:
-
DATA_SOURCE_NAME — используется по-умолчанию. Позволяет записывать строку подключения как в формате
ключ=значение, так и в виде URI и может содержать логин и пароль подключения.
Допустимые варианты задания подключения к PostgreSQL:postgresql://rolename@dbhost:dbport/datname?sslmode=disable;postgresql://rolename:rolpass@dbhost:dbport?sslmode=disable&db=datname;postgresql://rolename:rolpass@?sslmode=disable&dbname=database&host=dbhost&port=dbport;postgresql://rolename:rolpass@?sslmode=disable&dbname=database&host=/tmp(подключение через UNIX-сокет, берется из unix_socket_directories экземпляра PostgreSQL);host=dbhost port=dbport dbname=database user=rolename sslmode=disable;
Если нужно подключаться к нескольким экземплярам (не допускается использование пробела после запятой):
postgresql://rolename@dbhost:dbport/datname?sslmode=disable,postgresql://rolename@dbhost:dbport/datname?sslmode=disable;sslmode=disable dbname=postgres host=127.0.0.1 port=5434 user=postgres,sslmode=disable dbname=postgres port=5432 user=postgres.
- DATA_SOURCE_URI — альтернативна DATA_SOURCE_NAME. Это вариант подойдет, только в случае, если предполагается подключение к одному экземпляру PostgreSQL).
В переменной DATA_SOURCE_URI задается часть URI без логина и пароля, в виде «dbhost:dbport/dbname?key=value». Логин и пароль берутся из переменных окружения DATA_SOURCE_USER и DATA_SOURCE_PASS, либо из файлов DATA_SOURCE_USER_FILE DATA_SOURCE_PASS_FILE.
Когда логин и пароль хранятся в файлах, их содержимое извлекается и пере присваивается переменным DATA_SOURCE_USER и DATA_SOURCE_PASS. Далее, в коде, все это собирается в полноценный URI вида:"postgresql://" + DATA_SOURCE_USER + ":" + DATA_SOURCE_PASS + "@" + DATA_SOURCE_URI - DATA_SOURCE_URI_FILE — тоже самое что и DATA_SOURCE_URI, только читается из файла;
- DATA_SOURCE_USER — при использовании DATA_SOURCE_URI, задаёт имя пользователя для подключения к СУБД;
- DATA_SOURCE_USER_FILE — тоже самое что и DATA_SOURCE_USER, только читается из файла;
- DATA_SOURCE_PASS — при использовании DATA_SOURCE_URI, задаёт пароль пользователя для подключения к СУБД;
- DATA_SOURCE_PASS_FILE — тоже самое что и DATA_SOURCE_PASS, только читается из файла;.
Во вторую группу входят переменные дублирующие аргументы. Т.е. при запуске у вас есть выбор, задать параметры работы приложения в виде переменных окружения, либо передать в качестве аргументов при запуске. Начинаются с префикса PG_EXPORTER_:
- PG_EXPORTER_WEB_LISTEN_ADDRESS — задаёт адрес и порт, через который экспортер будет принимать запросы от Prometheus. По-умолчанию
:9187; - PG_EXPORTER_WEB_TELEMETRY_PATH — путь по которому отдаются метрики. По-умолчанию
/metrics; - PG_EXPORTER_DISABLE_DEFAULT_METRICS — отключает сбор метрики по-умолчанию. О том что это за метрики, будет ниже. Принимает значения только true или false. По-умолчанию false (сбор метрик разрешен);
- PG_EXPORTER_DISABLE_SETTINGS_METRICS — отключает сбор метрик из представления pg_settings. О том что это за метрики, будет ниже. Принимает значения только true или false. По-умолчанию false (сбор метрик разрешен);
- PG_EXPORTER_AUTO_DISCOVER_DATABASES — обнаруживает все БД экземпляра кластера для сбора их метрик. Принимает значения только true или false. По-умолчанию false (сбор метрик производится только в той БД которая была указана в парраметрах подключения);
- PG_EXPORTER_EXCLUDE_DATABASES — исключает БД из списка баз по которым собираются метрики, если
PG_EXPORTER_AUTO_DISCOVER_DATABASES=true. Представляет список имен БД разделенных запятой. По-умолчанию — пустая строка. ВАЖНО:- шаблоны template0 и template1 — не требуется исключать, так они отсекаются на стадии получения списка баз данных из pg_databases;
- невозможно исключить базу данных указанную в URI.
- PG_EXPORTER_EXTEND_QUERY_PATH — Путь к YAML-файлу, который содержит пользовательские запросы. Файл queries.yaml содержит примеры;
- PG_EXPORTER_CONSTANT_LABELS — Метка (константа) добавляемая во все метрики. Записывается в виде списка пар
метка=значение, разделенных запятой.
Аргументы командной строки
- web.listen-address — тоже самое, что PG_EXPORTER_WEB_LISTEN_ADDRESS;
- web.telemetry-path — тоже самое, что PG_EXPORTER_WEB_TELEMETRY_PATH;
- disable-default-metrics — тоже самое, что PG_EXPORTER_DISABLE_DEFAULT_METRICS;
- disable-settings-metrics — тоже самое, что PG_EXPORTER_DISABLE_SETTINGS_METRICS;
- auto-discover-databases — тоже самое, что PG_EXPORTER_AUTO_DISCOVER_DATABASES;
- exclude-databases — тоже самое, что PG_EXPORTER_EXCLUDE_DATABASES;
- extend.query-path — тоже самое, что PG_EXPORTER_EXTEND_QUERY_PATH;
- constantLabels — тоже самое, что PG_EXPORTER_CONSTANT_LABELS;
- dumpmaps — Показывает внутреннее содержание карты метрик. Используется для отладки пользовательских запросов. Не приводит к запуску приложения;
- log.level — задает один из возможных уровней логирования:
debug,info,warn,error,fatal; - log.format — задает способ и формат вывода журнала. Например:
logger:syslog?appname=bob&local=7илиlogger:stdout?json=true. По-умолчаниюlogger:stderr.
Метрики по-умолчанию
Метрики по-умолчанию — это некоторый набор метрик для мониторинга, сбор которых заложен непосредственно в коде. Сбор метрик по-умолчанию, можно отключить задав параметры командной строки —disable-default-metrics и/или —disable-settings-metrics или определив соответствующие переменные окружения.
Замечу, что в текущей версии была решена проблема использования метрик при включенном autoDiscovery, из-за которого, происходило дублирование метрик, что приводило к ошибкам.
По-умолчанию в мониторинг передаются метрики из следующих представлений:
- pg_stat_bgwriter;
- pg_stat_database;
- pg_stat_database_conflicts;
- pg_locks;
- pg_stat_replication;
- pg_stat_activity;
- pg_settings.
Из того, на что стоит обратить внимание это pg_stat_replication и pg_stat_activity, так как набор возвращаемых полей зависит от версии PostgreSQL. Для этого, в экспортере производится проверка версии СУБД и выбирается соответствующий запрос. Указывать версию в пользовательских запросах, нельзя. Предполагается, что администратор заранее знает, какой версии, экземпляр будет мониторится. Так же могут возникнуть проблемы, если пытаться собирать метрики одним экспортером с экземпляров различных версий.
С метриками настроек экземпляра (pg_settings) всё несколько проще, они формируются запросом:
SELECT name, setting, COALESCE(unit, ''), short_desc, vartype
    FROM pg_settings
    WHERE vartype IN ('bool', 'integer', 'real');
Таким образом, по-умолчанию, формируется набор метрик только из численных значений.
Далее, рассмотрим вывод экспортера и в том числе разберёмся в том, почему захордкоженные метрики имеют своё право на существование. Для примера возьмем две метрики: shared_buffers и wal_sender_timeout. В выводе экспортера, на каждую метрику мы получаем три строки.
Первая строка — представляет подсказку и состоит из имени метрики в postgres_exporter, описания (колонка short_desc представления pg_settings) и если происходило приведение к базовому типу, указывается к какому именно (значение в квадратных скобках).
Во второй строке, указывается тип значения, в терминах Prometheus. И третья строка, метрика с набором меток и присвоенным значением.
Возвращаемые значения для shared_buffers.
# HELP pg_settings_shared_buffers_bytes Sets the number of shared memory buffers used by the server. [Units converted to bytes.]
# TYPE pg_settings_shared_buffers_bytes gauge
pg_settings_shared_buffers_bytes{server="127.0.0.1:5432"} 1.34217728e+08
pg_settings_shared_buffers_bytes — имя метрики. Оно, по правилам хорошего тона, составляется из имени таблицы, имени метрики и единицы измерения. Далее идет, короткое описание из таблицы pg_settings. И последнее, указание на то, что значении метрики было приведено к единице измерения байт (Units converted to bytes). Почему на последнее стоит обратить внимание, потому что непосредственно в базе значение выглядит несколько иначе, а именно:
      name      | setting | unit |                          short_desc
----------------+---------+------+--------------------------------------------------------------
 shared_buffers | 16384   | 8kB  | Sets the number of shared memory buffers used by the server.
Тип метрики у нас GAUGE, это значит она может принимать произвольные значения, в течении времени. В нашем случае количество буферов, при подстройке, может меняется в обе стороны.
О типах метрик и их отличиях, можно подробнее узнать в документации Prometheus.
Следующая метрика wal_sender_timeout. Информационные поля собираются по тому же принципу, что описан выше. Только в этом случае значение метрики приводится к секундам, а в базе хранится в миллисекундах. С этой особенностью нужно быть внимательными и учитывать при построении графиков.
# HELP pg_settings_wal_sender_timeout_seconds Sets the maximum time to wait for WAL replication. [Units converted to seconds.]
# TYPE pg_settings_wal_sender_timeout_seconds gauge
pg_settings_wal_sender_timeout_seconds{server="127.0.0.1:5432"} 60
Значение хранимое в базе данных:
demo=# SELECT name, setting, COALESCE(unit, ''), short_desc, vartype FROM pg_settings WHERE  name='wal_sender_timeout';
        name        | setting | coalesce |                     short_desc                     | vartype
--------------------+---------+----------+----------------------------------------------------+---------
 wal_sender_timeout | 60000   | ms       | Sets the maximum time to wait for WAL replication. | integer
Все значения имеющие единицы измерения приводятся к двум типам: метрики объема к байтам; метрики времени к секундам.
Пользовательский набор метрик
В дополнение или взамен метрик по-умолчанию, можно использовать собственные. Для этого достаточно задать путь к файлу, с пользовательскими запросами, через аргумент —extend.query-path=query.yaml или через переменную окружения PG_EXPORTER_EXTEND_QUERY_PATH.
В репозитории проекта имеется YAML-файл с примерами: queries.yaml
Отмечу, что по сравнению с предыдущей версией, в 0.8.0 добавились новые ключи master и cache_seconds. На примере ниже разберем формат записи и назначение полей.
Пример содержимого файла queries.yaml
pg_database:
  query: "SELECT pg_database.datname, pg_database_size(pg_database.datname) as size_bytes FROM pg_database"
  master: true
  cache_seconds: 30
  metrics:
    - datname:
        usage: "LABEL"
        description: "Name of the database"
    - size_bytes:
        usage: "GAUGE"
        description: "Disk space used by the database"
Ключи и значения из примера выше:
pg_database— произвольный префикс метрик возвращаемых запросом (Обязательный);query— содержит SQL-запрос (Обязательный);master— выполнять запрос только в базе данных, указанной при подключении в URI (мастер-БД). Необходим при запуске экспортера с флагом —auto-discover-databases. Принимает значения true или false. По-умолчанию false. (Не обязательное);cache_seconds— время, в течении которого будут возвращаться данные кэша. Задаётся в секундах;metrics— содержит список меток и метрик;datname,size_bytes— элемент списка. Имя элемента списка должно совпадать с именем колонки в запросе;usage— тип значения. Принимает COUNTER, GAUGE, LABLE (подробнее в документации Prometheus)description— Произвольное описание метрики
Пример возвращаемых метрик:
# HELP pg_database_size_bytes Disk space used by the database
# TYPE pg_database_size_bytes gauge
pg_database_size_bytes{datname="dbtest1",server="localhost:5432"} 1.0105503e+07
pg_database_size_bytes{datname="demo",server="localhost:5432"} 2.813719199e+09
pg_database_size_bytes{datname="postgres",server="localhost:5432"} 4.735491e+06
pg_database_size_bytes{datname="template0",server="localhost:5432"} 7.758339e+06
pg_database_size_bytes{datname="template1",server="localhost:5432"} 7.758339e+06
Резюме
Ну и резюмируем, все что мы имеем в последней версии postgres_exporter 0.8.0. В основном, все улучшения касаются работы мониторинга нескольких экземпляров и/или нескольких БД в экземпляре.
- Аргумент exclude-databases (появился в 0.6.0) позволяет исключать базы данных из списка БД по которым будет производится сбор метрик. Но нельзя исключить БД которая указана в URI-подключения, так как она является мастер-базой;
- Появилась возможность использовать пользовательские запросы к глобальным представления (pg_stat_activity, pg_stat_database и т.п.) вместе с аргументом auto-discover-databases. Для этого, было добавлено дополнительное поле master, указывающее на то, что запрос должен выполняться только в мастер-базе;
- Появилась возможность использовать метрики по-умолчанию совместно с аргументом auto-discover-databases;
- Для пользовательских запросов, было добавлено поле cache_seconds, позволяет задавать время (в секундах) на которое будет за кэширован ответ сервера на соответствующий запрос.
Источники
- Prometheus [1] — это приложение с открытым исходным кодом, используемое для мониторинга событий и оповещения о них. Он записывает метрики в реальном времени в базу данных временных рядов, построенную с использованием модели HTTP-запроса, с гибкими запросами и оповещениями в режиме реального времени.
- postgres_exporter — это экспортер метрик PostgreSQL для Prometheus.
Версия, на момент написания заметки, v 0.5.1. Поддерживаемые версии PostgreSQL 9.4+ (но как показала практика, работает и на 9.3).
POWA-like мониторинг PostgreSQL с помощью Prometheus
Предыстория
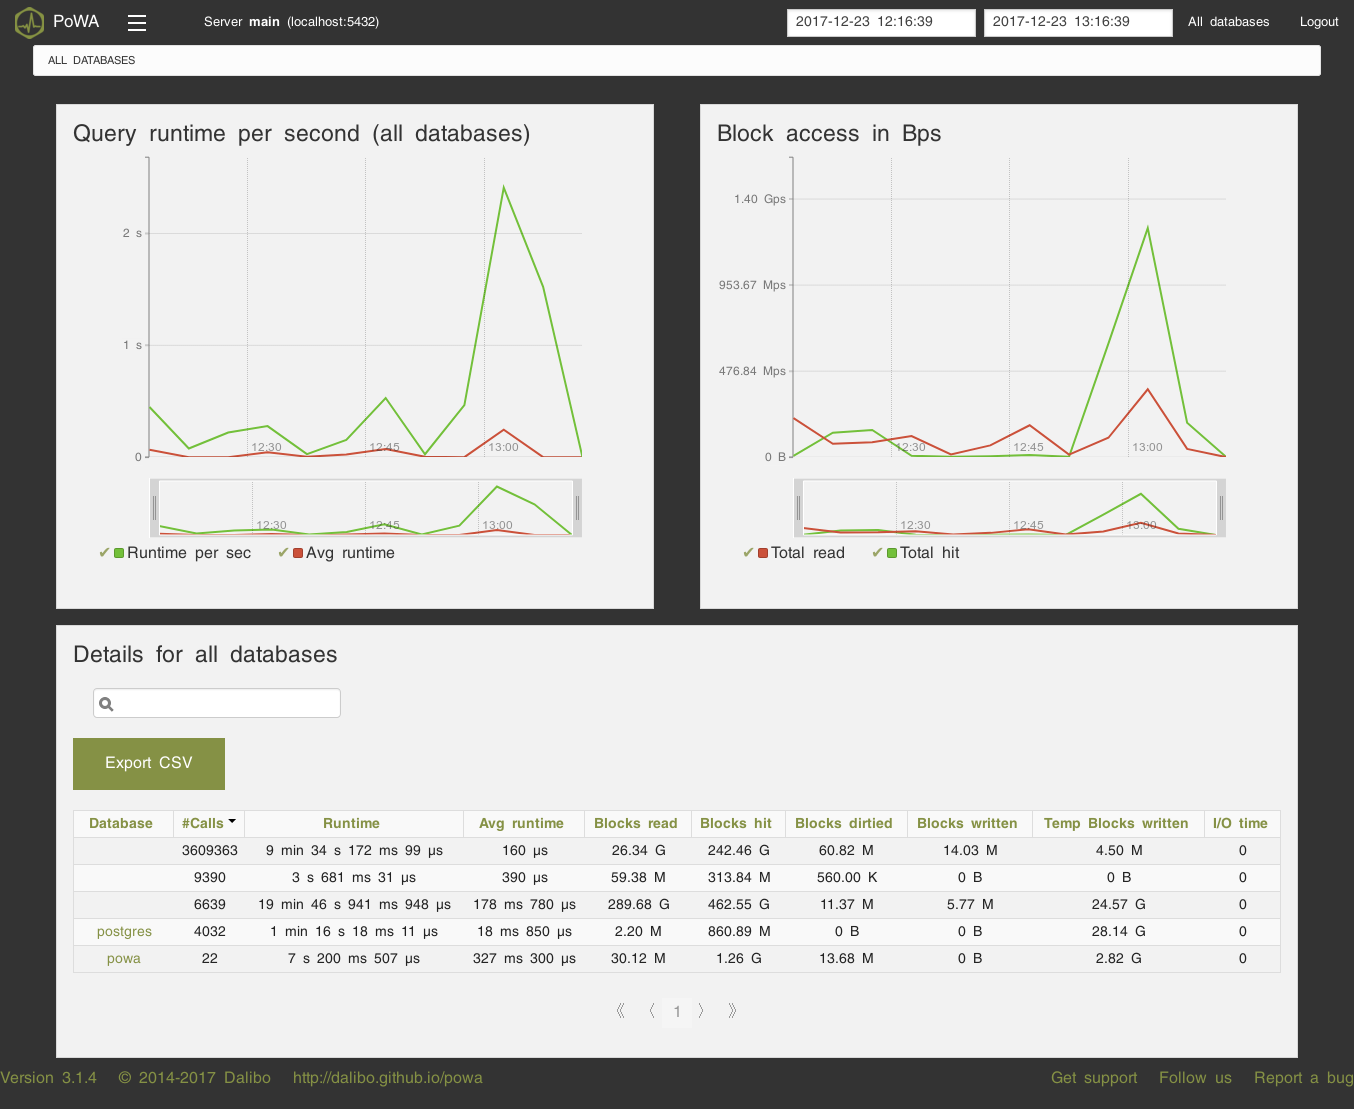
Для сбора и удобного просмотра данных о том, как работает PostgreSQL (общая производительность сервера, самые медленные запросы, самые частые запросы) мы долгое время использовали отличную утилиту POWA. Однако, это решение было далеко не идеальным и нам удалось найти более удачный вариант, к тому же полностью интегрированный с нашей основной системой мониторинга.
POWA минимально удовлетворяла большинству наших нужд:
- Простая в установке и эксплуатации (установи расширение для Postgres, установи веб-морду, пользуйся);
- Имеет веб-интерфейс (разработчики у нас не имеют доступа на продакшн сервера, а смотреть, как ведет себя база, хочется);
- Собирает необходимый для нас минимум метрик.
Однако, были и неприятные минусы:
- Неудобно смотреть данные с нескольких серверов;
- Интерфейс никак не кастомизируется;
- Нет возможности прикрутить (без боли) централизованную авторизацию;
- Нет возможности добавить свои метрики;
- Нет интеграции с нашей системой мониторинга (мы используем Prometheus для сбора метрик и Grafana для их виуализации).
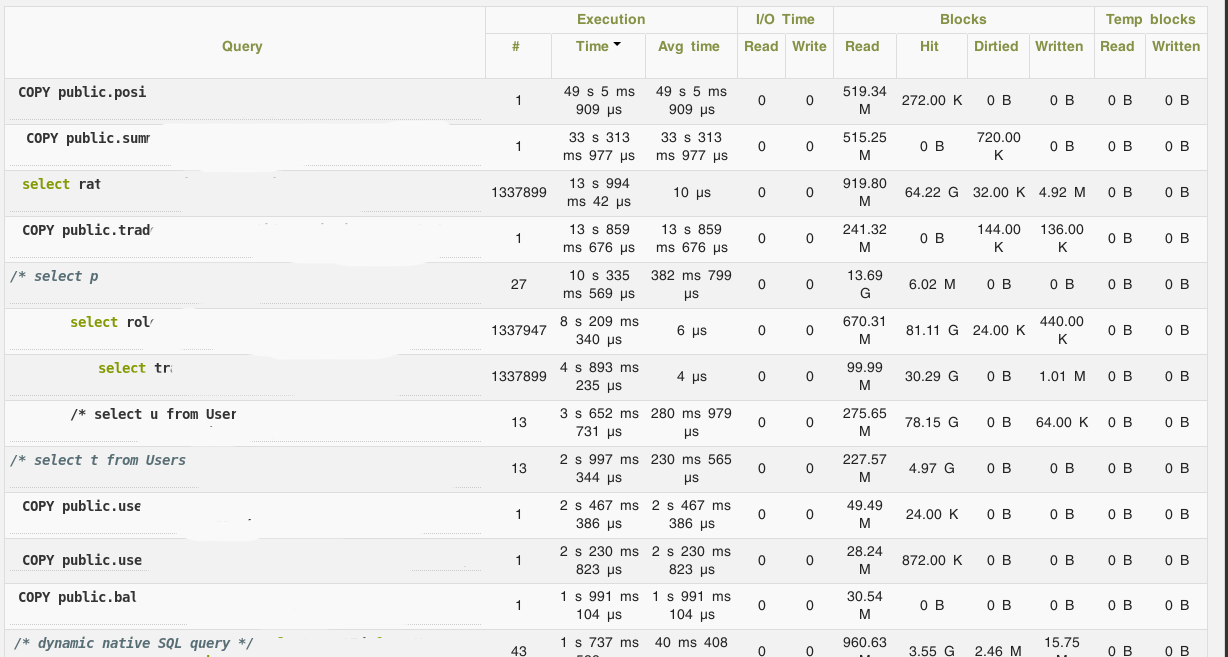
Пара скриншотов POWA для примера:
В связи с этим, было решено попробовать собирать метрики с PostgreSQL с помощью postgres_exporter для Prometheus.
Установка
TL;DR: вот роль для Ansible, писалась под CentOS 7, но после минимальных правок (замена firewalld на iptables) должна работать на любой системе с systemd — https://github.com/UnitedTraders/ansible-postgresql-exporter
Архитектура решения
Я не буду подробно рассказывать про сам Prometheus, материалов про него достаточно, но пройдусь по общей архитектуре и экспортеру.
Prometheus использует pull модель сбора метрик: у него есть список экспортеров и он опрашивает их по HTTP, собирая с них список метрик и кладя их к себе в хранилище.
Экспортер — это агент, который занимается сбором метрик непосредственно с сущности (сервера в целом, или конкретного приложения), которую надо мониторить. У Prometheus богатые возможности для инструментации, поэтому экспортеры есть для большинства популярных приложений, и написать свой в случае надобности не представляет особого труда.
postgres_exporter работает следующим образом: он подключается к PostgreSQL, выполняет запросы к служебным таблицам и выставляет результаты в специальном формате с помощью внутреннего HTTP-сервера для забора их Prometheus’ом. Важный момент: помимо большого набора дефолтных запросов, можно определить свои и собирать любые данные, которые можно получить с помощью SQL, включая какие-нибудь бизнес-метрики.
Таким образом, настройка postgres_exporter’а сводится к трем действиям:
- Установить postgres_exporter на сервер, который мы хотим мониторить;
- Написать запросы (если нужно) для мониторинга своих параметров;
- Показать серверу Prometheus, откуда забирать метрики.
Установка экспортера
Экспортер написан на Go, так что все банально:
- Качаем нужный бинарник из https://github.com/wrouesnel/postgres_exporter/releases
- Определяем переменную окружения в env-файле DATA_SOURCE_NAME=»postgresql://postgres@localhost:5432/?sslmode=disable»
- Создаем systemd юнит, типа такого:
- Создаем файл с кастомными запросами для своих метрик (см. ниже);
- Запускаем сервис.
Настройка своих метрик
По умолчанию, postgres_exporter не умеет собирать данные по запросам. Но в PostgreSQL есть очень полезное расширение pg_stat_statements , которое именно этим и занимается. Установка pg_stat_statements сводится к трем простым шагам:
- Установить contrib-модули для PostgreSQL;
- Добавить в postgresql.conf параметр shared_preload_libraries = ‘pg_stat_statements’ ;
- Создать расширение в самом постгресе: CREATE EXTENSION pg_stat_statements .
Т.к. нам важно было собирать в первую очередь время выполнения запросов, то файл с метриками получился вот такой:
Тут есть один подводный камень: записи из pg_stat_statements необходимо агрегировать, т.к. в этой таблице может существовать несколько записей с одинаковым сочетанием query id, database id и query. Наличие таких записей приводит к падению postgres_exporter, т.к. он формирует названия метрик, исходя из этих данных, а они должны быть уникальными.
Для упрощения, я не стал добавлять метрики по чтению/записи (shared_blks_written и т.д., добавляются они по аналогии). Также, повторюсь, подобные запросы можно делать к любой таблице, а не только к pg_stat_statements.
Примеры запросов в Prometheus
С вышеуказанным конфигом, экспортер будет генерировать значительное количество метрик — по 5 штук на каждый вид запроса. Агрегировать мы их будем на стороне Prometheus.
Примеры запросов (сразу с графановскими переменными для templating):
«$server»>[1m])) by (instance) — среднее время запроса за последнюю минуту по всему серверу
sum(rate(pg_stat_statements_mean_time
«$database»>[1m])) by (datname) — среднее время запроса за последнюю минуту по выбранной базе
sum(increase(pg_stat_statements_calls
«$database»>[1m])) by (datname) — количество запросов за минуту к базе
topk(20, increase(pg_stat_statements_calls
«$database»>[10m])) — top-20 самых частых запросов к базе за последние 10 минут
topk(20, pg_stat_statements_mean_time
«$database»>) — top-20 самых продолжительных запросов к базе
В графане это выглядит примерно вот так (ссылка на json):
Источник
swarmstack/postgresql-exporters
Use Git or checkout with SVN using the web URL.
Work fast with our official CLI. Learn more.
Launching GitHub Desktop
If nothing happens, download GitHub Desktop and try again.
Launching GitHub Desktop
If nothing happens, download GitHub Desktop and try again.
Launching Xcode
If nothing happens, download Xcode and try again.
Launching Visual Studio Code
Your codespace will open once ready.
There was a problem preparing your codespace, please try again.
Latest commit
Git stats
Files
Failed to load latest commit information.
README.md
Docker compose file for wrouesnel/postgres_exporter, Prometheus configuration example, and Grafana Dashboard for PostgreSQL servers
swarmstack users should use docker-compose-swarmstack.yml above instead.
In the prometheus/ directory in this repo, you’ll find example Prometheus configurations to scrape the exporters once per 5 minutes as to not induce extra load on your servers. If your PG servers aren’t heavily loaded, you can scrape them at whatever interval you like.
In the grafana/ directory you’ll find a Grafana 6.0+ dashboard that uses metrics from postgres_exporter as well as node exporter to give you a full view of your PostgreSQL hosts.
About
postgres_exporter configurations for Docker, Grafana and Prometheus
Источник
Vonng/pg_exporter
Use Git or checkout with SVN using the web URL.
Work fast with our official CLI. Learn more.
Launching GitHub Desktop
If nothing happens, download GitHub Desktop and try again.
Launching GitHub Desktop
If nothing happens, download GitHub Desktop and try again.
Launching Xcode
If nothing happens, download Xcode and try again.
Launching Visual Studio Code
Your codespace will open once ready.
There was a problem preparing your codespace, please try again.
Latest commit
Git stats
Files
Failed to load latest commit information.
README.md
Prometheus exporter for PostgreSQL metrics. Bring ultimate observability to your favorite PostgreSQL!
PG Exporter is the core component for Pigsty, Which is the battery-included open-source distribution for PostgreSQL with HA deployment & ultimate observability. Check Demo for details.
Latest binaries & rpms can be found on release page. Supported pg version: PostgreSQL 9.4+ & Pgbouncer 1.8+. Default collectors definition is compatible with PostgreSQL 10,11,12,13,14.
The latest stable pg_exporter version is 0.5.0 .
Note that default metrics are overhauled on 0.4 You can still use an old version of pg_exporter.yml to keep metrics consistency.
- Support Pigsty, the battery-include PostgreSQL distribution with ultimate observability.
- Support both Postgres & Pgbouncer (Pgbouncer is detected when target dbname is pgbouncer )
- Flexible: Almost all metrics are defined in customizable conf files with SQL collector.
- Schedule: Fine-grained execution control: Timeout, Cache, Skip, Fatality, etc.
- Dynamic Planning: Define multiple branches for a collector. Install specific branch when server & exporter meet certain conditions.
- Rich self-monitoring metrics about pg_exporter itself.
- Auto-discovery multiple databases, and run database level collectors
- Tested and verified in a real-world production environment for several years (10K+ cores)
- Metrics Overwhelming!
To run this exporter, you will need two things:
- Where to scrape: A Postgres or pgbouncer URL given via PG_EXPORTER_URL or —url .
- What to scrape: A path to config file or directory, by default ./pg_exporter.yml or /etc/pg_exporter.yml
pg_exporter only built-in with 3 metrics: pg_up , pg_version , and pg_in_recovery . All other metrics are defined in configuration files . You could use the pre-defined configuration file: pg_exporter.yml or use separated metric query in conf dir.
Wanna see what pg_exporter can do?
Check this out, It’s an entire monitoring system based on pg_exporter!
Parameters could be given via command-line args or environment variables.
- —url or PG_EXPORTER_URL defines where to scrape, it should be a valid DSN or URL. (note that sslmode=disable must be specifed explicitly for database that does not using SSL)
- —config or PG_EXPORTER_CONFIG defines how to scrape. It could be a single YAML file or a directory containing a series of separated YAML configs, which config will be loaded in alphabetic order.
- —label or PG_EXPORTER_LABEL defines constant labels that are added to all metrics. It should be a comma-separated list of label=value pairs.
- —tag or PG_EXPORTER_TAG will mark this exporter with given tags. Tags are a comma-separated-value list of strings. which could be used for query filtering and execution control.
- —disable-cache or PG_EXPORTER_DISABLE_CACHE will disable metric cache.
- —auto-discovery or PG_EXPORTER_AUTO_DISCOVERY will automatically spawn peripheral servers for other databases in the target PostgreSQL server. except for those listed in —exclude-database . (Not implemented yet)
- —exclude-database or PG_EXPORTER_EXCLUDE_DATABASE is a comma-separated list of the database name. Which are not scrapped when —auto-discovery is enabled
- —namespace or PG_EXPORTER_NAMESPACE defined internal metrics prefix, by default pg|pgbouncer .
- —fail-fast or PG_EXPORTER_FAIL_FAST is a flag. During start-up, pg_exporter will wait if the target is down. with —fail-fast=true , pg_exporter will fail instead of waiting on the start-up procedure if the target is down
- —listen-address or PG_EXPORTER_LISTEN_ADDRESS is the endpoint that exposes metrics
- —metric-path or PG_EXPORTER_TELEMETRY_PATH` is the URL path under which to expose metrics.
- —connect-timeout or PG_EXPORTER_CONNECT_TIMEOUT is the timeout for connecting to the target.
- —dry-run will print configuration files
- —explain will actually connect to the target server and plan queries for it. Then explain which queries are installed.
Here are pg_exporter REST APIs
Build on your local machine:
To build a static stand-alone binary for docker scratch
To build a docker image, use:
Or download the latest prebuilt binaries from release pages.
A Redhat 7 / CentOS 7 rpm is shipped on release page. Includes:
Configs lie in the core of pg_exporter . Actually, this project contains more lines of YAML than go.
- A monolith battery-included config file: pg_exporter.yml
- Separated metrics definition in config/collector
- Example of how to write a config file: doc.yml
Current pg_exporter is shipped with the following metrics collector definition files
Supported version: PostgreSQL 10, 11, 12, 13, 14
But you can still get PostgreSQL 9.4, 9.5, 9.6 support by switching to the older version collector definition
pg_exporter will generate approximately 200
300 metrics for a completely new database cluster. For a real-world database with 10
100 tables, it may generate several 1k
10k metrics. You may need to modify or disable some database-level metrics on a database with several thousand or more tables in order to complete the scrape in time.
Config files are using YAML format, there are lots of examples in the conf dir. and here is a sample config.
You could visualize these metrics via fancy grafana dashboards. There are lots of dashboards available based on pg_exporter , Check Pigsty for detail.
Источник
systemfabrikken/prometheus-postgres-exporter
Use Git or checkout with SVN using the web URL.
Work fast with our official CLI. Learn more.
Launching GitHub Desktop
If nothing happens, download GitHub Desktop and try again.
Launching GitHub Desktop
If nothing happens, download GitHub Desktop and try again.
Launching Xcode
If nothing happens, download Xcode and try again.
Launching Visual Studio Code
Your codespace will open once ready.
There was a problem preparing your codespace, please try again.
This branch is 7 commits ahead of prometheus-community:master.
Open a pull request to contribute your changes upstream.
Latest commit
Git stats
Files
Failed to load latest commit information.
README.md
PostgresSQL Server Exporter
Prometheus exporter for PostgresSQL server metrics. Supported Postgres versions: 9.1 and up.
Building and running
On a mac: bash -c ‘GO_ENABLED=0 GOOS=linux go build .’ Or using build container: docker run —rm -v «$PWD»:/usr/src/prometheus-postgres-exporter -w /usr/src/prometheus-postgres-exporter golang:1.7.3 bash -c ‘go get -d; go build -v -o build/prometheus-postgres-exporter’
See the github.com/lib/pq module for other ways to format the connection string.
| Name | Description |
|---|---|
| web.listen-address | Address to listen on for web interface and telemetry. |
| web.telemetry-path | Path under which to expose metrics. |
Setting the Postgres server’s data source name
The PostgresSQL server’s data source name must be set via the DATA_SOURCE_NAME environment variable.
For running it locally on a default Debian/Ubuntu install, this will work (transpose to init script as appropriate):
Adding new metrics
The exporter will attempt to dynamically export additional metrics if they are added in the future, but they will be marked as «untyped». Additional metric maps can be easily created from Postgres documentation by copying the tables and using the following Python snippet:
Adjust the value of the resultant prometheus value type appropriately. This helps build rich self-documenting metrics for the exporter.
About
A PostgresSQL metric exporter for Prometheus
Источник

Rayan Slim
Posted on
• Edited on
A Prometheus exporter is a tool that collects metrics from a specific system and exposes them in a format that Prometheus can scrape. The PostgreSQL Prometheus Exporter specifically collects metrics from PostgreSQL databases.

In this article, you will deploy PostgreSQL alongside the PostgreSQL Prometheus Exporter to scrape metrics from your database. You’ll then visualize these metrics using a Grafana dashboard.
Table of Contents
- Clone the Repository
- Deploy PostgreSQL Resources
- Install PostgreSQL Exporter
- Verify Metrics
- Deploy Grafana Dashboard
- Access Grafana
- Cleaning Up Resources
Prerequisites
This guide assumes you have already installed Helm and set up Prometheus in your Kubernetes cluster. If you haven’t done this yet, please check out this article on setting up Prometheus with Kubernetes before continuing with this guide.
Clone the Repository
First, clone the repository containing the necessary PostgreSQL resources, exporter configuration, and dashboard:
git clone https://github.com/rslim087a/postgres-prometheus-sample

cd postgres-prometheus-sample
Enter fullscreen mode
Exit fullscreen mode
Deploy PostgreSQL Resources
Create the namespace database-monitoring:
kubectl create namespace database-monitoring
Enter fullscreen mode
Exit fullscreen mode
Deploy the PostgreSQL resources (Secret, Service, and StatefulSet) using the following command:
kubectl apply -f postgres/
Enter fullscreen mode
Exit fullscreen mode
This command applies all the Kubernetes manifests in the postgres/ directory, setting up your PostgreSQL instance.
Install PostgreSQL Exporter
Add the Prometheus Community Helm repository and update it:
helm repo add prometheus-community https://prometheus-community.github.io/helm-charts
helm repo update
Enter fullscreen mode
Exit fullscreen mode
Now, install the PostgreSQL Exporter using the custom values file:
helm install postgres-exporter prometheus-community/prometheus-postgres-exporter \
  -f postgres-exporter/postgresql-exporter-values.yaml \
  -n database-monitoring
Enter fullscreen mode
Exit fullscreen mode
Let’s examine the custom values in postgresql-exporter-values.yaml:
# PostgreSQL Exporter Helm Values

# Image configuration
image:
  tag: "v0.12.0"

# Datasource configuration
config:
  datasource:
    host: "postgresql.database-monitoring.svc.cluster.local"
    user: "postgres"
    pass: "password123"
    port: "5432"
    database: "postgres"
    sslmode: "disable"

  # Metrics collectors configuration
  exporter:
    default_metrics:
      enabled: true

serviceMonitor:
  enabled: true
  interval: 30s
  scrapeTimeout: 10s
  labels:
    release: prometheus

# Explicitly set the DATA_SOURCE_NAME environment variable
extraEnvs:
  - name: DATA_SOURCE_NAME
    value: "postgresql://postgres:password123@postgresql.database-monitoring.svc.cluster.local:5432/postgres?sslmode=disable"
Enter fullscreen mode
Exit fullscreen mode
Explanation of key fields:
-
config.datasource: Specifies the PostgreSQL connection details.
-
host: The Kubernetes service name for PostgreSQL. -
userandpass: Database credentials. -
port: Default PostgreSQL port. -
database: The database to connect to. -
sslmode: SSL mode for the connection.
-
-
serviceMonitor: Configuration for Prometheus to automatically discover and scrape metrics from the PostgreSQL exporter.
-
enabled: true: Activates the creation of a ServiceMonitor resource. -
interval: 30s: Sets how often Prometheus should scrape metrics. -
scrapeTimeout: 10s: Defines the maximum time Prometheus should wait for a response. -
labels: Ensures that the correct Prometheus instance picks up this ServiceMonitor.
-
-
extraEnvs: Explicitly sets the
DATA_SOURCE_NAMEenvironment variable, which is used by the exporter to connect to PostgreSQL.
Verify Metrics
Port-forward the PostgreSQL Exporter service and check the metrics:
kubectl port-forward svc/postgres-exporter-prometheus-postgres-exporter 9187:80 -n database-monitoring &

curl http://localhost:9187/metrics
Enter fullscreen mode
Exit fullscreen mode
After verifying, stop the port-forward:
kill %1
Enter fullscreen mode
Exit fullscreen mode
Deploy Grafana Dashboard
Apply the Grafana dashboard ConfigMap:
kubectl apply -f grafana -n monitoring
Enter fullscreen mode
Exit fullscreen mode
This creates a ConfigMap with the grafana_dashboard: "1" label, which Grafana will automatically detect and import.
Access Grafana
Port-forward the Grafana service:
kubectl port-forward svc/prometheus-grafana 3000:80 -n monitoring &
Enter fullscreen mode
Exit fullscreen mode
Access Grafana at http://localhost:3000 using the default credentials (usually admin/prom-operator).
The PostgreSQL dashboard should now be available in your Grafana instance. To find it, follow these steps:
- Log into Grafana
- Click on the «Dashboards» icon in the left sidebar
- Select «Browse»
- Look for a dashboard named «PostgreSQL Dashboard» or similar

This dashboard will provide detailed insights into your PostgreSQL performance and health, including metrics on connections, transactions, database sizes, and more.
Cleaning Up Resources
If you’ve deployed this setup for testing or learning purposes, you may want to clean up the resources afterwards to avoid unnecessary costs or cluster clutter.
Here are the steps to remove the deployed resources:
Delete the PostgreSQL Exporter:
helm uninstall postgres-exporter -n database-monitoring
Enter fullscreen mode
Exit fullscreen mode
If you deployed PostgreSQL as part of this guide:
kubectl delete -f postgres/ -n database-monitoring
Enter fullscreen mode
Exit fullscreen mode
Remove the Grafana dashboard:
kubectl delete -f grafana -n monitoring
Enter fullscreen mode
Exit fullscreen mode
If you no longer need the Prometheus Community Helm repository:
helm repo remove prometheus-community
Enter fullscreen mode
Exit fullscreen mode
Finally, delete the namespace
kubectl delete namespace database-monitoring
Enter fullscreen mode
Exit fullscreen mode
Kubernetes Training
If you found this guide helpful, check out our Kubernetes Training course