Температура процессора — один из ключевых показателей, влияющих на производительность и долговечность вашего компьютера. Перегрев может привести к снижению скорости работы, неожиданным перезагрузкам и даже к поломке компонентов.
Зачем знать
Какой должна быть
Как узнать
На Linux
На macOS
Как снизить
Чек-лист
Зачем знать
Какой должна быть
Как узнать
На Linux
На macOS
Как снизить
Чек-лист
В этом руководстве мы расскажем, как посмотреть температуру процессора на ноутбуке или ПК с операционными системами Windows 7, 10, 11, Linux или macOS. Вы узнаете, как проверить температуру процессора с помощью специализированных программ, через командную строку или BIOS.
Зачем знать температуру процессора

Контроль температуры процессора важен по нескольким причинам:
- Предотвращение перегрева и поломок. Высокая температура может привести к перегреву процессора, что в свою очередь может вызвать аварийное отключение компьютера или его зависание. Постоянный перегрев также ускоряет износ компонентов.
- Оптимизация производительности. При перегреве процессор может автоматически снижать свою тактовую частоту, чтобы уменьшить выделение тепла. Это явление называется троттлингом и приводит к снижению производительности системы.
- Удлинение срока службы компонентов. Поддержание оптимальной температуры помогает продлить срок службы процессора и других компонентов компьютера. Высокие температуры могут повредить не только процессор, но и другие важные элементы системы.
Какой должна быть температура процессора

Температура процессора является важным показателем его работоспособности и долговечности. В целом, в норме температура процессора должна быть в пределах 30−40°C в состоянии простоя и до 70−80 °C под нагрузкой. Однако эти значения могут варьироваться в зависимости от модели процессора и условий эксплуатации.
- В состоянии простоя, когда компьютер не выполняет интенсивные задачи, температура процессора обычно находится в диапазоне от 30 до 45 . Это нормальный уровень, который не вызывает беспокойства и не требует дополнительных мер по охлаждению.
- При выполнении ресурсоемких задач, таких, как игры, рендеринг видео или работа с большими объемами данных, температура процессора может повышаться до 70−80 °C. Это допустимый уровень, но важно следить за тем, чтобы температура не превышала эти значения, так как это может привести к перегреву и снижению производительности.
- Максимальная допустимая температура для большинства современных процессоров составляет около 90−100 °C. При достижении этих значений процессор может автоматически снижать свою тактовую частоту (троттлинг) или даже отключаться, чтобы предотвратить повреждение.
Способы узнать температуру процессора на ПК с Windows
Существует несколько способов узнать температуру процессора на ПК с Windows. Одни предполагают использование специализированного софта, другие позволяют обойтись и без них. Рассмотрим все способы подробнее.
Без программ
Для того, чтобы посмотреть текущую температуру ЦП, необязательно даже устанавливать специальные утилиты. Достаточно воспользоваться командной строкой или зайти в BIOS.
Через командную строку
- Нажмите комбинацию клавиш Win+R, введите cmd и нажмите Enter.
- Введите следующую команду и нажмите Enter:
wmic /namespace:\\root\wmi PATH MSAcpi_ThermalZoneTemperature get CurrentTemperature
Температура будет отображена в градусах Кельвина. Для перевода в Цельсий используйте формулу: t°C = t°K — 273,15
Через UEFI (BIOS)
- Сразу после включения компьютера нажмите клавишу для входа в UEFI (обычно это Del, F2, Esc или F10).
- В UEFI найдите раздел Hardware Monitor или System Health, где будет отображена температура процессора в реальном времени.
С помощью программ
Среди утилит для мониторинга состояния «железа» наиболее популярны три: AIDA 64, MSI Afterburner и SpeedFan.
AIDA64
- Скачайте программу с официального сайта и установите ее.
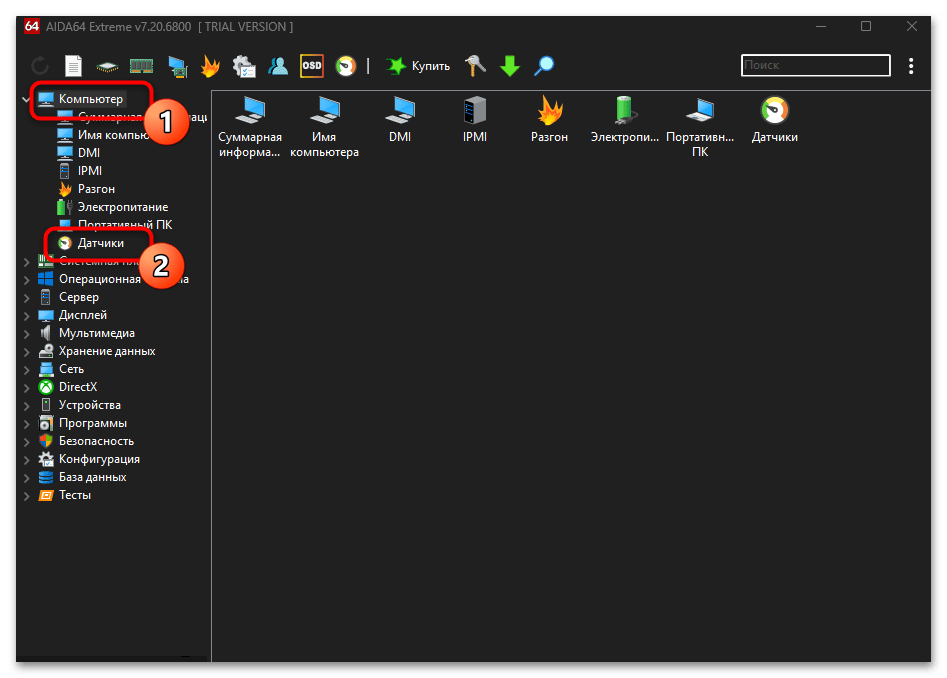
- Перейдите в раздел «Компьютер» > «Датчики».
- В разделе датчиков будет указана температура процессора и других компонентов в реальном времени.
MSI Afterburner
- Скачайте программу с официального сайта и установите ее.
- В настройках программы включите отображение температуры процессора.
- Температура будет отображена на панели задач.
SpeedFan
- Скачайте программу с официального сайта и установите ее.
- Перейдите в раздел «Температуры».
- В разделе температур будет указана температура процессора и других компонентов.
Методы проверки температуры процессора на Linux

На Linux существует несколько способов проверки температуры процессора, включая использование командной строки и графических приложений. Рассмотрим их подробнее.
Использование командной строки
- Откройте терминал и введите команду для установки необходимых пакетов: sudo apt install lm-sensors hddtemp.
- Запустите сканирование датчиков. Введите команду: sudo sensors-detect.
- Ответьте Yes на все запросы для завершения сканирования.
Чтобы посмотреть температуру, введите команду sensors. Эта команда отобразит текущую температуру процессора и других компонентов.
Для постоянного мониторинга используйте команду watch sensors. Эта команда будет обновлять данные каждые две секунды.
Использование Psensor
- Введите команду для установки приложения: sudo apt install psensor.
- После установки запустите приложение Psensor.
В настройках Psensor можно включить отображение температуры процессора в панели задач.
Как посмотреть температуру процессора на macOS

На macOS существует несколько способов проверки температуры процессора, включая использование встроенных инструментов и сторонних приложений. Рассмотрим их подробнее.
Использование Terminal
- Найдите Terminal через Spotlight или в папке «Программы» > «Утилиты».
- Введите следующую команду и нажмите Enter: sudo powermetrics —samplers smc |grep -i «CPU die temperature».
- Введите пароль администратора, когда будет запрошено.
Температура процессора будет отображена в списке значений.
Использование приложения Hot
- Скачайте приложение Hot с сайта разработчика iMazing.
- Запустите приложение Hot, и его иконка появится в меню.
Температура процессора будет отображена рядом с иконкой в меню. Вы также можете настроить отображение температуры в градусах Цельсия или Фаренгейта.
Как можно снизить температуру процессора

Снижение температуры процессора важно для поддержания его производительности и долговечности. Рассмотрим несколько эффективных методов.
1. Очистка системы охлаждения
Регулярная очистка вентиляторов и радиаторов от пыли помогает улучшить охлаждение. Пыль может замедлять вращение вентиляторов и снижать эффективность охлаждения. Используйте баллончик со сжатым воздухом для очистки вентиляторов и радиаторов.
2. Замена термопасты
Термопаста помогает улучшить теплопередачу между процессором и радиатором. Со временем она может высыхать и терять свои свойства. Рекомендуется менять термопасту каждые пару лет.
3. Улучшение вентиляции корпуса
Обеспечьте хорошую циркуляцию воздуха внутри корпуса. Убедитесь, что кабели не препятствуют продуваемости, и установите дополнительные вентиляторы, если это необходимо. Также важно, чтобы корпус компьютера находился в хорошо вентилируемом месте.
4. Оптимизация настроек питания
Снижение максимальной мощности процессора может помочь уменьшить его температуру. В Windows это можно сделать через настройки питания:
- Откройте «Панель управления» и выберите «Электропитание».
- Измените план питания на «Сбалансированный».
- Если это не поможет, то выберите план «Экономия энергии».
5. Использование качественного кулера
Инвестиции в качественный процессорный кулер могут значительно снизить температуру процессора. Существуют различные модели кулеров, которые обеспечивают более эффективное охлаждение по сравнению со стандартными. В первую очередь стоит присмотреться к башенным разновидностям.
Чек-лист: как посмотреть температуру процессора
Для удобства и быстроты проверки температуры процессора, следуйте следующему чек-листу:
- Используйте приложение SpeedFan для Windows, Psensor для Linux или Hot для macOS.
- Чтобы перевести температуру в кельвинах в градусы Цельсия, используйте формулу t°C = t°K — 273,15.
- В общем случае нормальной считается температура ЦП в пределах 30−40 °C в состоянии простоя и до 70−80 °C под нагрузкой.
- Если температура вашего процессора превышает вышеназванные пределы, то, скорее всего, есть проблемы с охлаждением.
- Чтобы снизить температуру процессора, замените кулер и улучшите вентиляцию корпуса.
Как узнать температуру процессора
В этой инструкции — несколько простых способов узнать температуру процессора в Windows 10, 8 и Windows 7 (а также способ, не зависящий от ОС) как с помощью бесплатных программ, так и без их использования. В конце статьи также будет приведена общая информация о том, какая нормальная температура процессора компьютера или ноутбука должна быть.
Причиной, по которой пользователю может потребоваться посмотреть температуру CPU — подозрения на то, что он выключается из-за перегрева или другие основания полагать, что она не является нормальной. На эту тему может также оказаться полезным: Как узнать температуру видеокарты (впрочем, многие программы, представленные ниже, также показывают температуру GPU).
Просмотр температуры процессора без программ
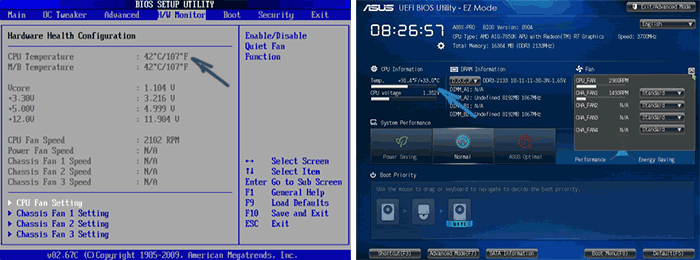
Первый из способов узнать температуру процессора без использования стороннего ПО — посмотреть её в BIOS (UEFI) вашего компьютера или ноутбука. Почти на любом устройстве такая информация там присутствует (за исключением некоторых ноутбуков).
Все что вам потребуется, это зайти в БИОС или UEFI, после чего найти нужную информацию (CPU Temperature, CPU Temp), которая может располагаться в следующих разделах, в зависимости от вашей материнской платы
- PC Health Status (или просто Status)
- Hardware Monitor (H/W Monitor, просто Monitor)
- Power
- На многих материнских платах с UEFI и графическим интерфейсом информация о температуре процессора имеется прямо на первом экране настроек.
Недостаток такого способа — вы не можете получить информации о том, какая температура процессора при нагрузках и работе системы (так как пока вы в BIOS процессор простаивает), отображаемая информация говорит о температуре без нагрузки.
Примечание: существует также способ посмотреть сведения о температуре с помощью Windows PowerShell или командной строки, т.е. также без сторонних программ, будет рассмотрен в конце руководства (так как мало на каком оборудовании правильно работает).
Core Temp
Core Temp — простая бесплатная программа на русском языке для получения информации о температуре процессора, работает во всех последних версиях ОС, включая Windows 7 и Windows 10.
В программе отдельно отображаются температуры всех ядер процессора, также эта информация по умолчанию выводится на панели задач Windows (вы можете поставить программу в автозагрузку, чтобы эта информация всегда была в панели задач).
Помимо этого, Core Temp отображает базовую информацию о вашем процессоре и может использоваться как поставщик данных о температуре процессора для популярного гаджета рабочего стола All CPU Meter (будет упомянут далее в статье).
Есть и собственный гаджет рабочего стола Windows 7 Core Temp Gadget. Еще одно полезное дополнение к программе, доступное на официальном сайте — Core Temp Grapher, для отображения графиков загрузки и температуры процессора.
Скачать Core Temp можно с официального сайта http://www.alcpu.com/CoreTemp/ (там же, в разделе Add Ons находятся дополнения к программе).
Информация о температуре процессора в CPUID HWMonitor
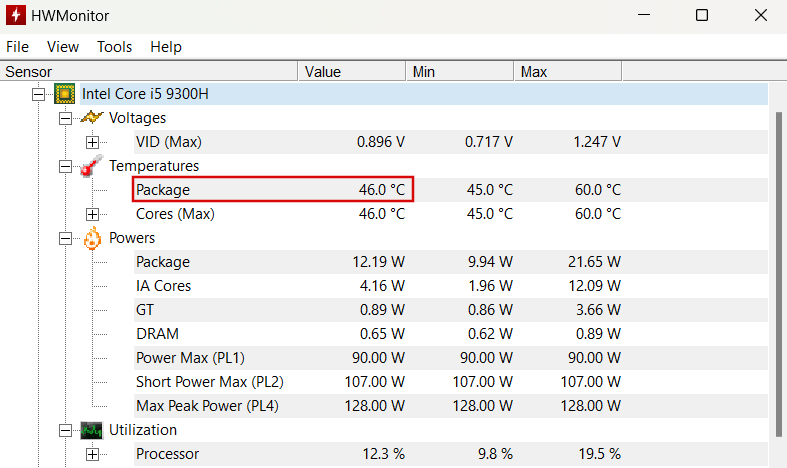
CPUID HWMonitor — одна из самых популярных бесплатных просмотра данных о статусе аппаратных компонентов компьютера или ноутбука, отображающая, в том числе, и подробную информацию о температуре процессора (Package) и для каждого ядра отдельно. Если у вас также будет присутствовать пункт CPU в списке, в нем отображается информация о температуре сокета (актуальные на текущий момент времени данные отображаются в столбце Value).

Дополнительно, HWMonitor позволяет узнать:
- Температуру видеокарты, дисков, материнской платы.
- Скорость вращения вентиляторов.
- Информацию о напряжении на компонентах и нагрузке на ядра процессора.
Официальный сайт HWMonitor — http://www.cpuid.com/softwares/hwmonitor.html
Speccy
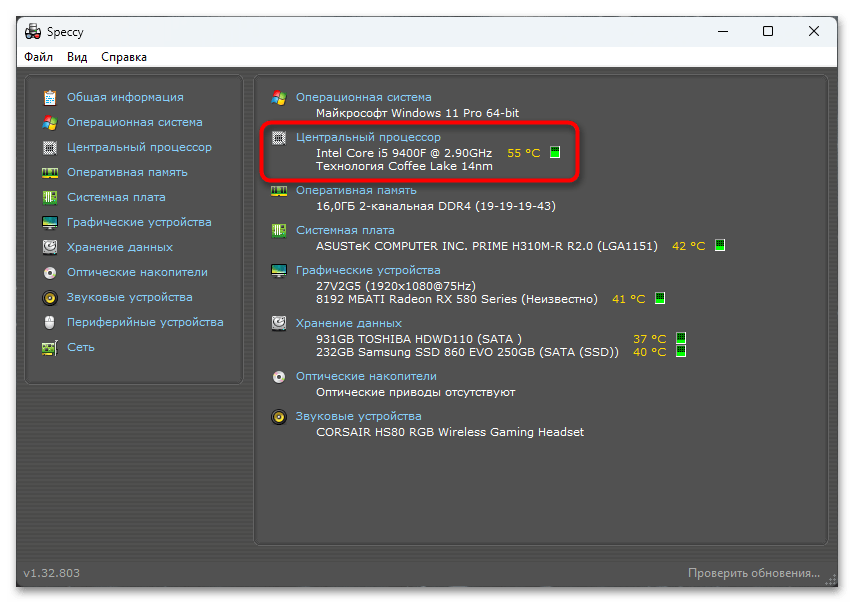
Для начинающих пользователей самым простым способом посмотреть температуру процессора, возможно, окажется программа Speccy (на русском), предназначенная для получения информации о характеристиках компьютера.
Помимо разнообразной информации о вашей системе, Speccy показывает и все самые важные температуры с датчиков вашего ПК или ноутбука, температуру процессора вы сможете увидеть в разделе CPU.

Также в программе показываются температуры видеокарты, материнской платы и дисков HDD и SSD (при наличии соответствующих датчиков).
Подробнее о программе и где ее скачать в отдельном обзоре Программы, чтобы узнать характеристики компьютера.
SpeedFan
Программа SpeedFan обычно используется для контроля скорости вращения вентиляторов системы охлаждения компьютера или ноутбука. Но, одновременно с этим, она же отлично отображает информацию о температурах всех важных компонентов: процессора, ядер, видеокарты, жесткого диска.

При этом SpeedFan регулярно обновляется и поддерживает почти все современные материнские платы и адекватно работает в Windows 10, 8 (8.1) и Windows 7 (правда в теории может вызывать проблемы при использовании функций регулировки вращения кулера — будьте осторожнее).
Среди дополнительных возможностей — встроенное построение графиков изменения температуры, которое может оказаться полезным чтобы, например, понять, какая температура процессора вашего компьютера во время игры.
Официальная страница программы http://www.almico.com/speedfan.php
HWInfo
Бесплатная утилита HWInfo, предназначенная для получения сведений о характеристиках компьютера и состоянии аппаратных компонентов также является удобным средством для того, чтобы посмотреть информацию с датчиков температуры.
Для того, чтобы увидеть эту информацию, просто нажмите кнопку «Sensors» в главном окне программы, нужные сведения о температуре процессора будут представлены в разделе CPU. Там же вы найдете информацию о температуре видеочипа при необходимости.

Скачать HWInfo32 и HWInfo64 можно с официального сайта http://www.hwinfo.com/ (при этом версия HWInfo32 работает также и в 64-разрядных системах).
Другие утилиты для просмотра температуры процессора компьютера или ноутбука
Если тех программ, которые были описаны, оказалось мало, вот еще несколько отличных инструментов, считывающих температуры с датчиков процессора, видеокарты, SSD или жесткого диска, материнской платы:
- Open Hardware Monitor — простая утилита с открытым исходным кодом, позволяющая посмотреть информацию об основных аппаратных компонентах. Пока в бета-версии, но работает исправно.

- All CPU Meter — гаджет рабочего стола Windows 7, который, при наличии на компьютере программы Core Temp умеет показывать данные о температуре процессора. Можно установить этот гаджет температуры процессора и в Windows См. Гаджеты рабочего стола Windows 10.
- OCCT — программа нагрузочного тестирования на русском языке, которая также отображает информацию о температурах CPU и GPU в виде графика. По умолчанию данные берутся из встроенного в OCCT модуля HWMonitor, но могут использоваться данные Core Temp, Aida 64, SpeedFan (меняется в настройках). Описывалась в статье Как узнать температуру компьютера.

- AIDA64 — платная программа (есть бесплатная версия на 30 дней) для получения информации о системе (как аппаратных, так и программных компонентах). Мощная утилита, недостаток для рядового пользователя — необходимость покупки лицензии.


Узнаем температуру процессора с помощью Windows PowerShell или командной строки
И еще один способ, который работает только на некоторых системах и позволяет посмотреть температуру процессора встроенными средствами Windows, а именно с помощью PowerShell (есть реализация этого способа с помощью командной строки и wmic.exe).
Открываем PowerShell от имени администратора и вводим команду:
get-wmiobject msacpi_thermalzonetemperature -namespace "root/wmi"
В командной строке (также запущенной от имени администратора) команда будет выглядеть так:
wmic /namespace:\\root\wmi PATH MSAcpi_ThermalZoneTemperature get CurrentTemperature
В результате выполнения команды вы получите одну или несколько температур в полях CurrentTemperature (для способа с PowerShell), являющуюся температурой процессора (или ядер) в Кельвинах, умноженных на 10. Чтобы перевести в градусы по Цельсию, делим значение CurrentTemperature на 10 и отнимаем от него 273.15.
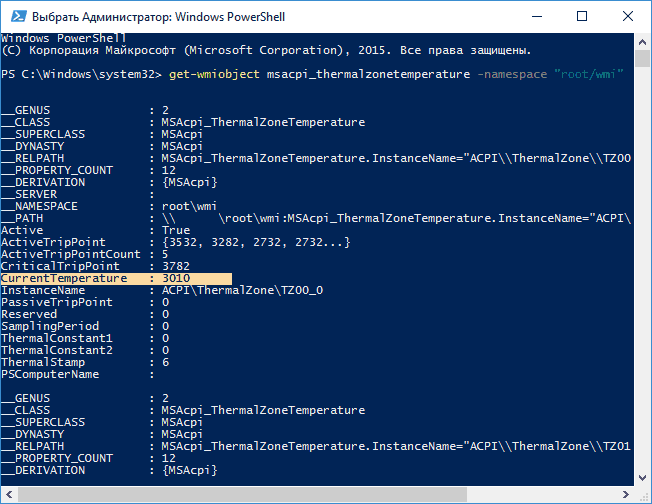
Если при выполнении команды на вашем компьютере значение CurrentTemperature всегда одно и то же — значит этот способ у вас не работает.
Нормальная температура процессора
А теперь по вопросу, который чаще всего задают начинающие пользователи — а какая температура процессора нормальная для работы на компьютере, ноутбуке, процессоров Intel или AMD.
Границы нормальных температур для процессоров Intel Core i3, i5 и i7 Skylake, Haswell, Ivy Bridge и Sandy Bridge выглядят следующим образом (значения усреднены):
- 28 – 38 (30-41) градусов по Цельсию — в режиме простоя (запущен рабочий стол Windows, фоновые операции обслуживания не выполняются). В скобках даны температуры для процессоров с индексом K.
- 40 – 62 (50-65, до 70 для i7-6700K) — в режиме нагрузки, во время игры, рендеринга, виртуализации, задач архивирования и т.п.
- 67 – 72 — максимальная температура, рекомендуемая Intel.
Нормальные температуры для процессоров AMD почти не отличаются, разве что для некоторых из них, таких как FX-4300, FX-6300, FX-8350 (Piledriver), а также FX-8150 (Bulldozer) максимальной рекомендуемой температурой является 61 градус по Цельсию.
При температурах 95-105 градусов по Цельсию большинство процессоров включают троттлинг (пропуск тактов), при дальнейшем повышении температуры — выключаются.
При этом стоит учитывать, что с большой вероятностью, температура в режиме нагрузки у вас с большой вероятностью будет выше, чем указано выше, особенно если это не только что приобретенный компьютер или ноутбук. Незначительные отклонения — не страшно.
В завершение, немного дополнительной информации:
- Повышение окружающей температуры (в комнате) на 1 градус Цельсия ведет к повышению температуры процессора примерно на полтора градуса.
- Количество свободного пространства в корпусе компьютера может оказывать влияние на температуру процессора в пределах 5-15 градусов по Цельсию. То же самое (только числа могут быть выше) касается помещения корпуса ПК в отделение «компьютерного стола», когда близко к боковым стенкам ПК находятся деревянные стенки стола, а задняя панель компьютера «смотрит» в стену, а иногда и в радиатор отопления (батарею). Ну и не забываем про пыль — одну из главных помех отводу тепла.
- Один из самых частых вопросов, который мне доводится встречать на тему перегрева компьютера: я почистил ПК от пыли, заменил термопасту, и он стал греться еще больше или вообще перестал включаться. Если вы решили выполнить эти вещи самостоятельно, не делайте их по единственному ролику в YouTube или одной инструкции. Внимательно изучите побольше материала, обращая внимание на нюансы.
На этом завершаю материал и надеюсь, для кого-то из читателей он окажется полезным.
Все способы:
- Вариант 1: Просмотр температуры в простое
- Способ 1: Speccy
- Способ 2: AIDA64
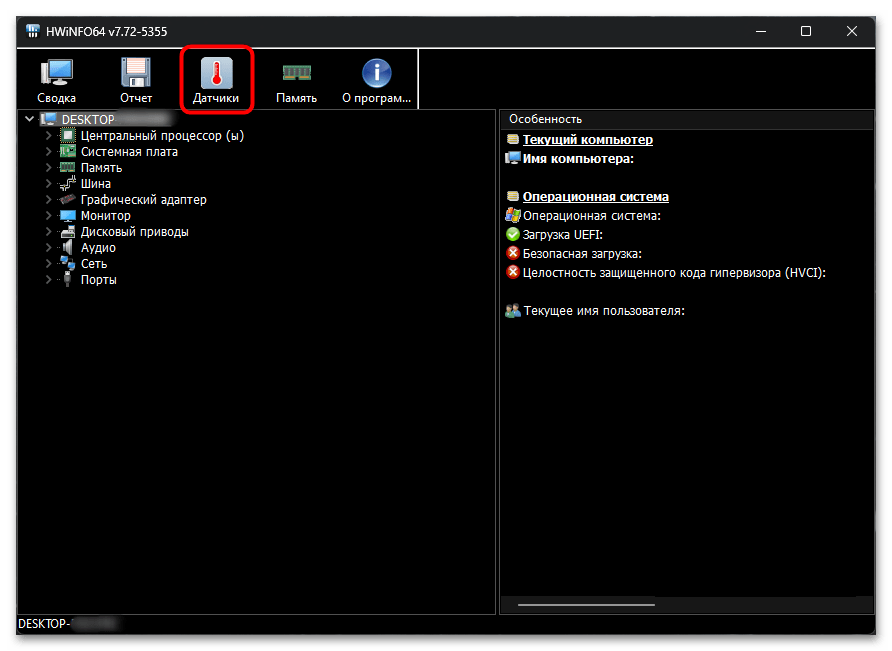
- Способ 3: HWiNFO
- Вариант 2: Мониторинг температуры при нагрузках
- Способ 1: MSI Afterburner
- Способ 2: FPS Monitor
- Вопросы и ответы: 0
Вариант 1: Просмотр температуры в простое
Существует ряд программ, которые предлагают просмотреть текущую температуру процессора в Windows 10, но выводят информацию исключительно в рамках своего окна, не предоставляя доступа к мониторингу во время игры. Поэтому мы бы рекомендовали использовать такой софт исключительно в тех случаях, когда нужно посмотреть стандартную температуру процессора во время простоя или обычного рабочего процесса. Конечно, можно быстро сворачивать игру и переключаться к софту для оценки текущих показателей, но погрешность бывает значительной из-за сильной работы кулеров и резко прекратившейся нагрузки, что приводит к моментальному снижению температуры ЦП вплоть на 10-20 градусов.
Способ 1: Speccy
Бесплатная программа Speccy предназначена для отображения общей информации об установленном в компьютере оборудовании и комплектующих. Ее обычно используют для определения моделей устройств или их характеристик, однако в софте есть и функции, отображающие в режиме реального времени текущую температуру железа, включая и процессор. Единственное замечание — при использовании некоторых процессоров от Intel информация отображается не в полном виде, что бывает связано с несовместимым драйвером или невозможностью Speccy считать показатели из BIOS.
Скачать Speccy
При запуске Speccy достаточно будет дождаться загрузки показателей из блока «Общая информация», который открывается по умолчанию. Именно в нем можно найти пункт «Центральный процессор». Справа от названия должен отобразиться оранжевый показатель, уведомляющий о текущей температуре. Датчик обновляется раз в несколько секунд, поэтому попереключайтесь между окнами, чтобы попытаться поймать точный показатель.
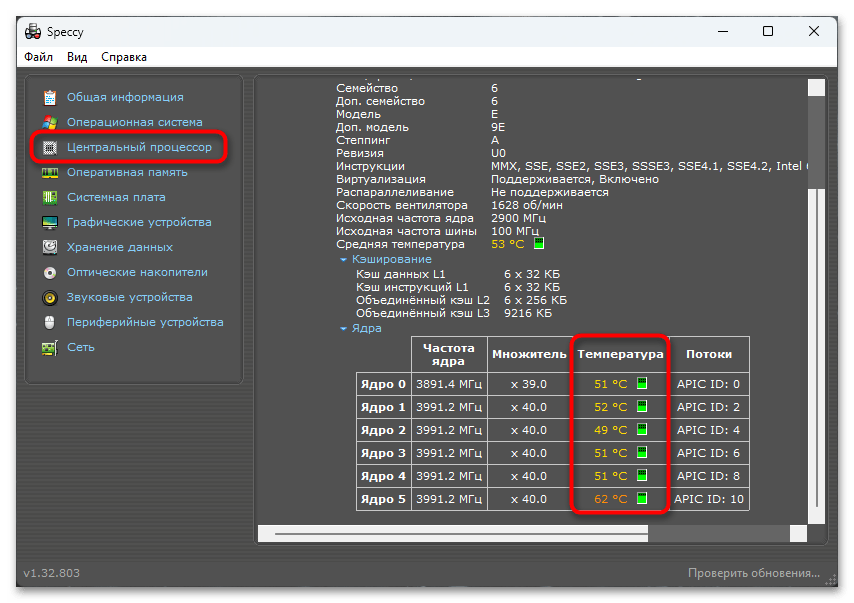
Дополнительно отметим, что вы можете переключиться на вкладку «Центральный процессор», где есть сведения исключительно о процессоре. Там вы увидите расширенную таблицу с температурами по каждому ядру, что бывает актуально при более детальном ознакомлении с температурами, например когда речь заходит о разгоне.
Способ 2: AIDA64
Того же самого результата можно добиться и через программу AIDA64, однако у нее есть свои особенности, которые стоит отметить. Хотя не все функции доступны в бесплатной версии, в них все же включено отображение температуры процессора. Для оценки показателей необходимо будет только подержать AIDA64 открытой какое-то время, затем посмотреть сведения в соответствующем разделе.
Скачать AIDA64
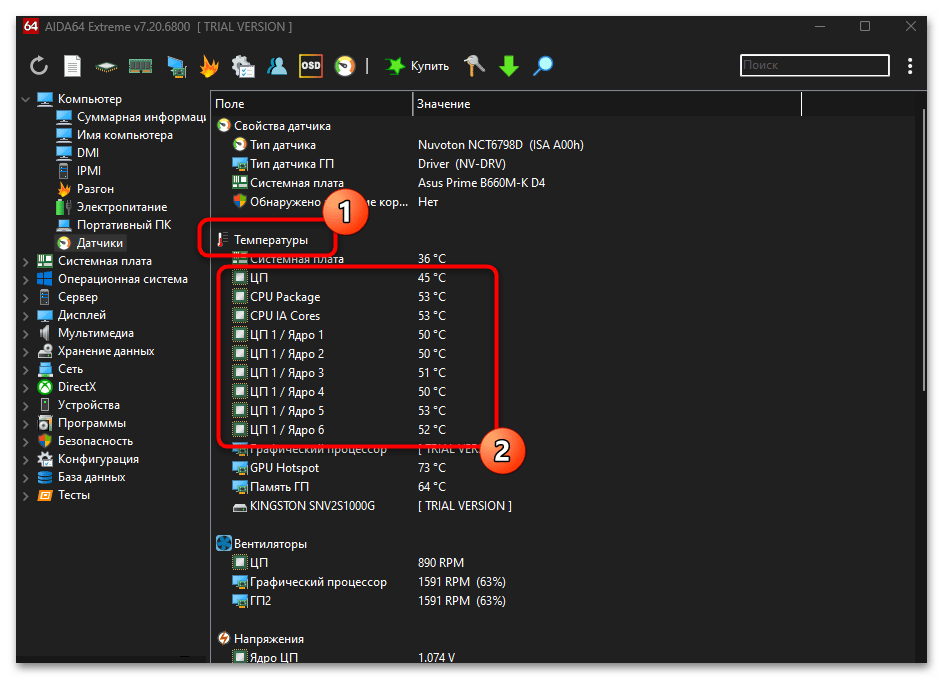
- Обычную информацию с показателями датчика вы найдете в разделе «Компьютер», нажав по пункту «Датчики».
- В центральной части отобразится раздел «Температуры», где и предстоит посмотреть на среднюю температуру ЦП или оценить ее для каждого ядра. Прямо над температурой процессора будет и показатель для материнской платы, что тоже бывает важно при подобном мониторинге.
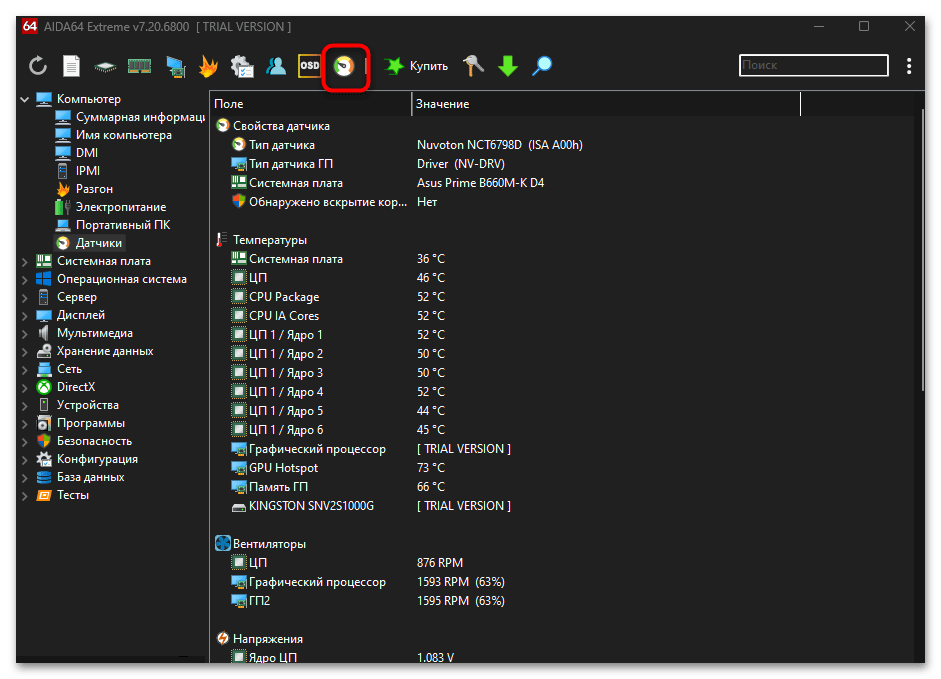
- AIDA64 позволяет вывести датчики в отдельном окне, чтобы мониторинг шел в режиме реального времени. Для этого понадобится нажать по соответствующей кнопке на верхней панели.
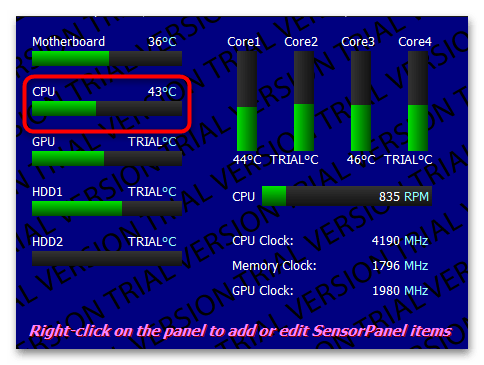
- На следующем изображении вы как раз видите, как выглядит данная панель. На ней отображается текущая температура CPU в сочетании с другими датчиками. Панель можно расположить в любом месте на рабочем столе, и она всегда будет поверх других окон.
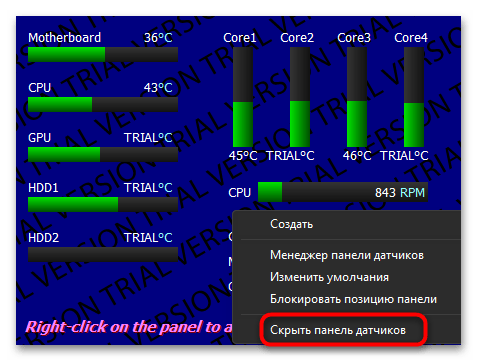
- Если нужно будет скрыть данную панель, кликните по ней правой кнопкой мыши и выберите пункт «Скрыть панель датчиков». Для повторного открытия используйте ту же кнопку в главном меню, о которой уже говорилось выше.
Способ 3: HWiNFO
Преимущество HWiNFO перед другими программами заключается в том, что она считывает температуру с разных датчиков, отображая несколько средних значений. Это позволяет более точно отслеживать температурные колебания процессора при настройке охлаждения или во время разгона. Да, такая необходимость возникает не так часто, но лучше знать о наличии функций в программе, которые могут оказаться полезными в тот момент, когда подобная информация понадобилась.
- Для отображения мониторинга ресурсов в HWiNFO понадобится на верхней панели нажать кнопку «Датчики». Тогда на экране отобразится отдельное окно со всеми требуемыми сведениями.
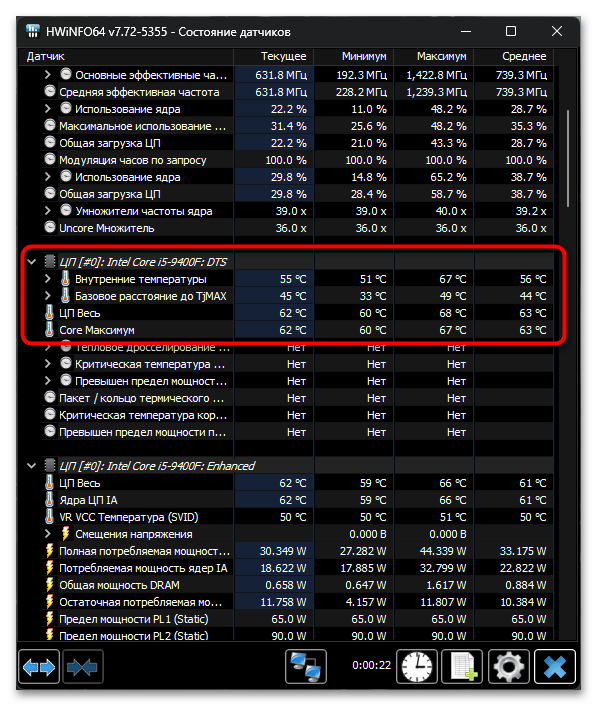
- В первом блоке касательно «ЦП» идет информация о температуре процессора с цифровых датчиков «DTS» (Digital Thermal Sensors). Это значение идет напрямую с минимальной задержкой, поэтому его используют в большинстве случаев для мгновенного считывания показателей.
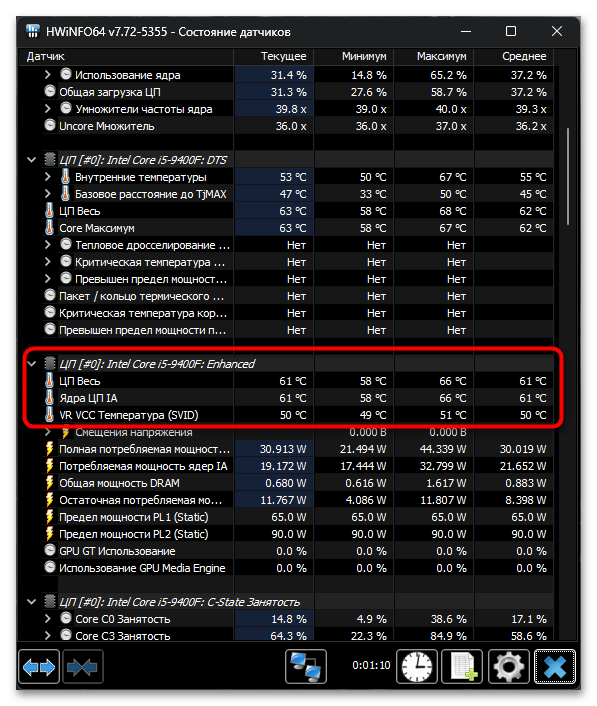
- Блок «Enhanced» представляет собой сборку усредненного значения из всех температурных датчиков, поэтому на него стоит обратить внимание в тех случаях, когда интересует примерная среднестатистическая температура процессора во время простоя или выполнения офисных задач.
Вариант 2: Мониторинг температуры при нагрузках
Чаще всего проверить температуру процессора в Windows 10 нужно как раз в ситуациях пиковой нагрузки. В большинстве случаев ее вызывают игры, потребляя всю доступную мощность. Соответственно, выделение тепла процессором во время подобных нагрузок всегда крайне большое, а охлаждение происходит за счет термопасты и установленных кулеров. Узнать, насколько оно хорошо справляется со своей задачей, помогут следующие программы.
Способ 1: MSI Afterburner
В кругах тестеров производительности в играх программа MSI Afterburner считается каноном благодаря бесплатному распространению и наличию множества настраиваемых датчиков, которые можно удобно расположить на экране и обеспечить постоянный мониторинг температур в играх. В следующей инструкции не будем затрагивать абсолютно все параметры, поскольку их очень много, а разберемся исключительно с включением самого оверлея и добавлением на него датчика отображения температуры центрального процессора.
Скачать MSI Afterburner
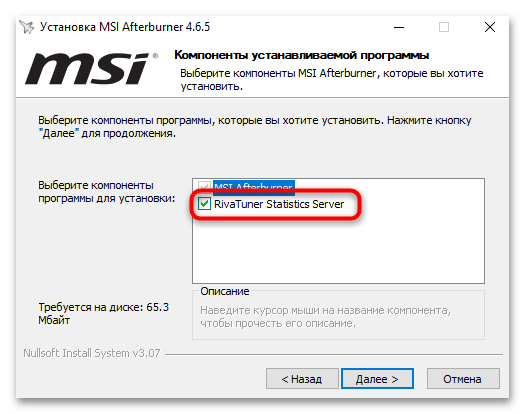
- Во время установки обязательно не снимайте галочку с пункта «RivaTuner Statistics Server», поскольку это дополнительное программное обеспечение как раз и нужно для того, чтобы считывать информацию с датчиков и выводить их на экран в виде мониторинга в режиме реального времени.
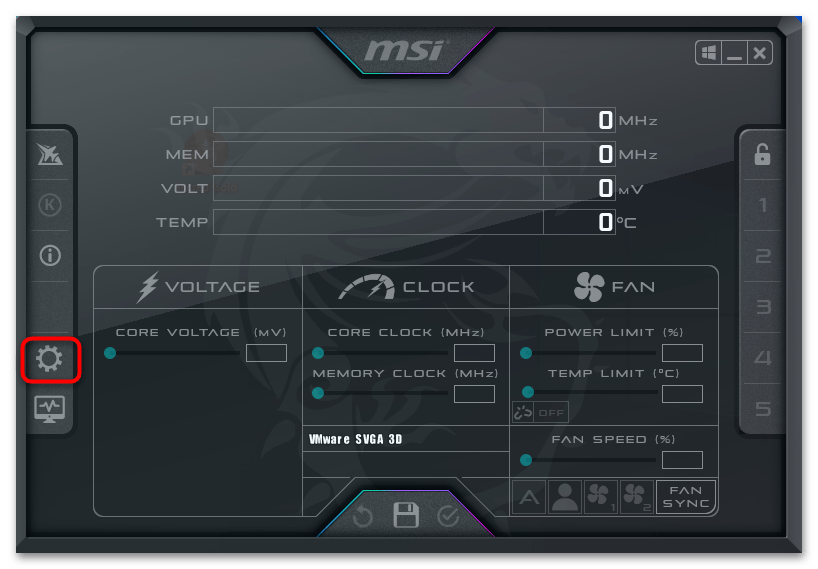
- После запуска нажмите кнопку с шестеренкой слева для перехода в настройки программы.
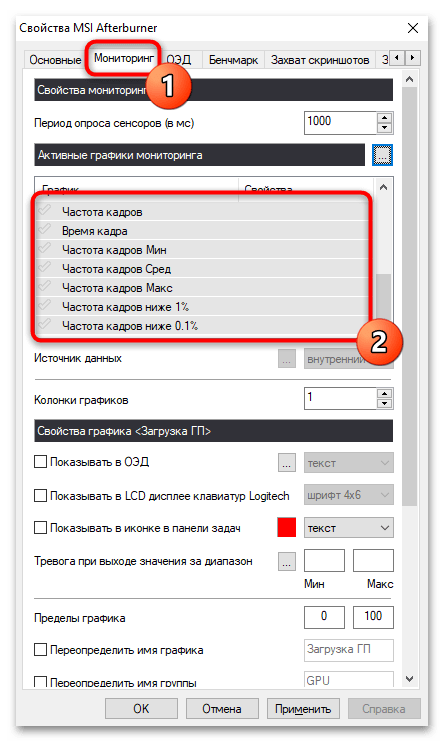
- Выберите вкладку «Мониторинг» и поставьте галочку возле тех графиков, которые вы хотите видеть в оверлее.
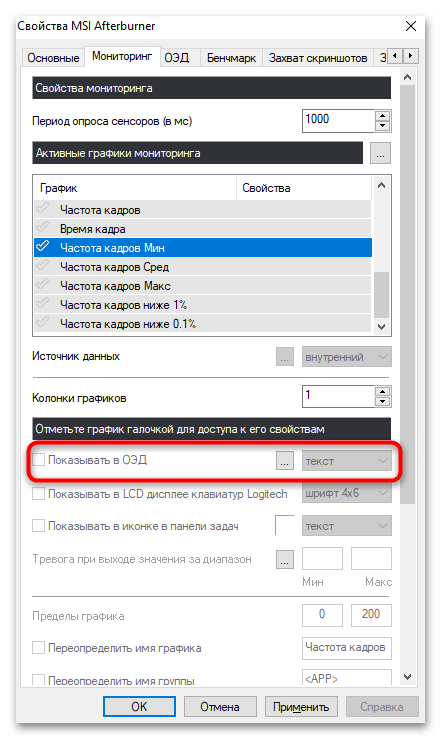
- Дополнительно, активировав каждый из графиков, под всеми ними внизу нужно поставить галочку «Показывать в ОЭД». ОЭД — это Оверлейный Экранный Дисплей, то есть тот график, который вы будете видеть в играх.
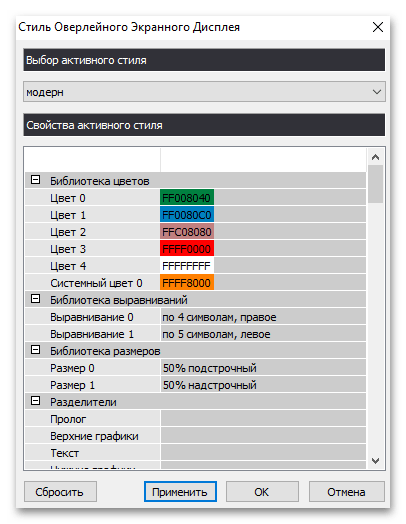
- Нажав по кнопке с тремя точками возле упомянутого выше пункта, вы перейдете в настройки этого самого оверлея. Через них можно установить цвет, выровнять график или разделить его с другими. Перед выходом не забудьте применить изменения, а также должным образом настройте остальные графики.
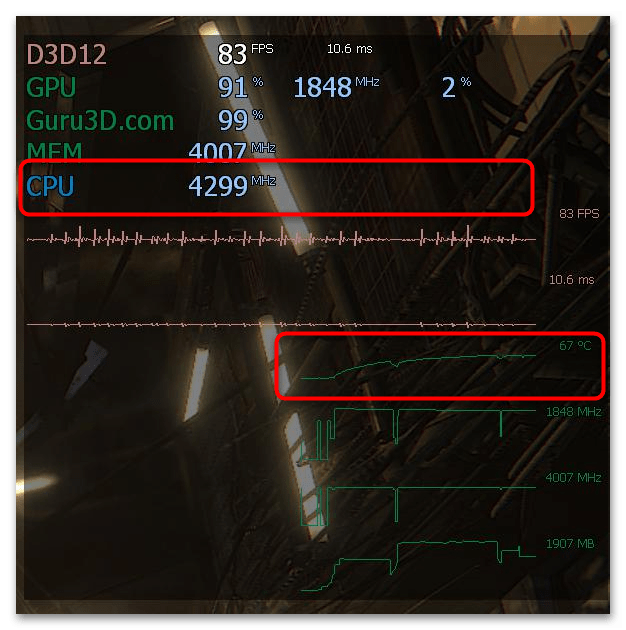
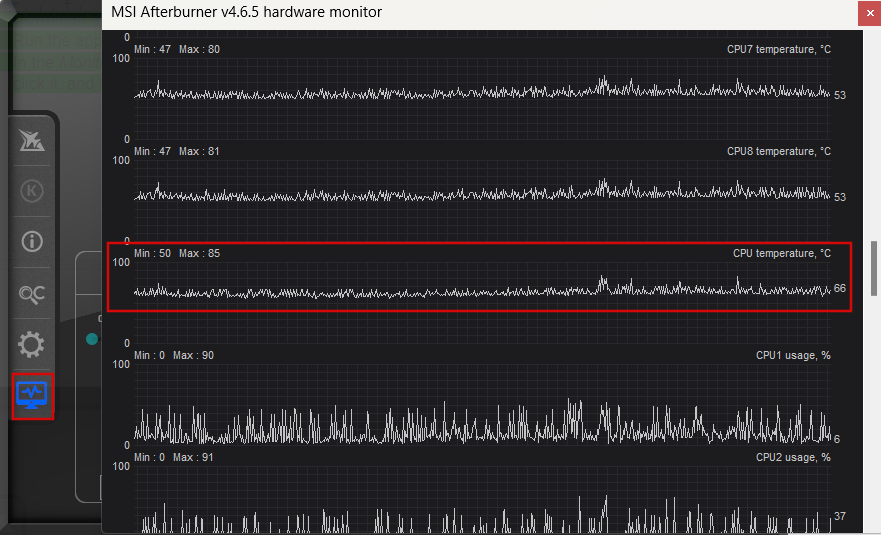
- Если все выполнено правильно, при запуске игры с включенным MSI Afterburner вы должны увидеть датчик процессора с его показателями. Температура может отображаться как в виде обычного счетчика, так и графиком ниже.
Способ 2: FPS Monitor
Если настройки в предыдущей программе кажутся слишком сложными или не устраивает ее общая функциональность, советуем обратить внимание на FPS Monitor. В этом софте тоже можно настроить разнообразные датчики, включая отображение температуры процессора. Далее монитор будет выведен в игре и покажет состояние ЦП в режиме реального времени.
Скачать FPS Monitor
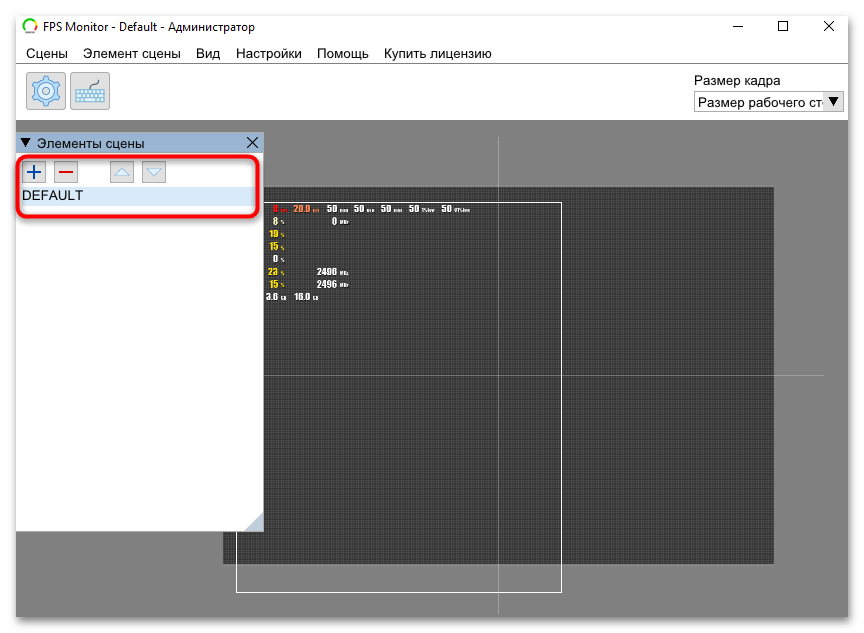
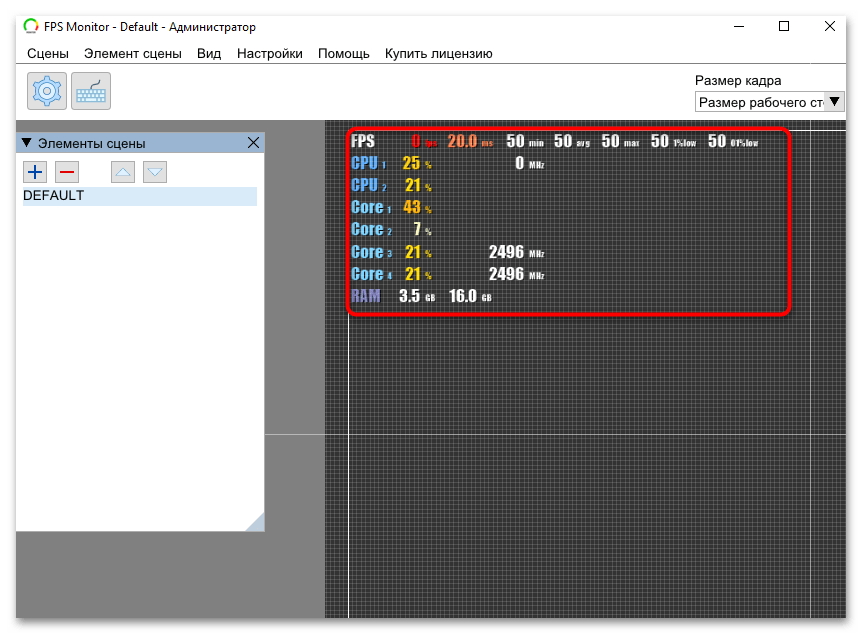
- По умолчанию уже будет добавлена готовая сцена с базовыми датчиками, но при необходимости всегда можно дополнить ее элементами, используя кнопки на левой панели.
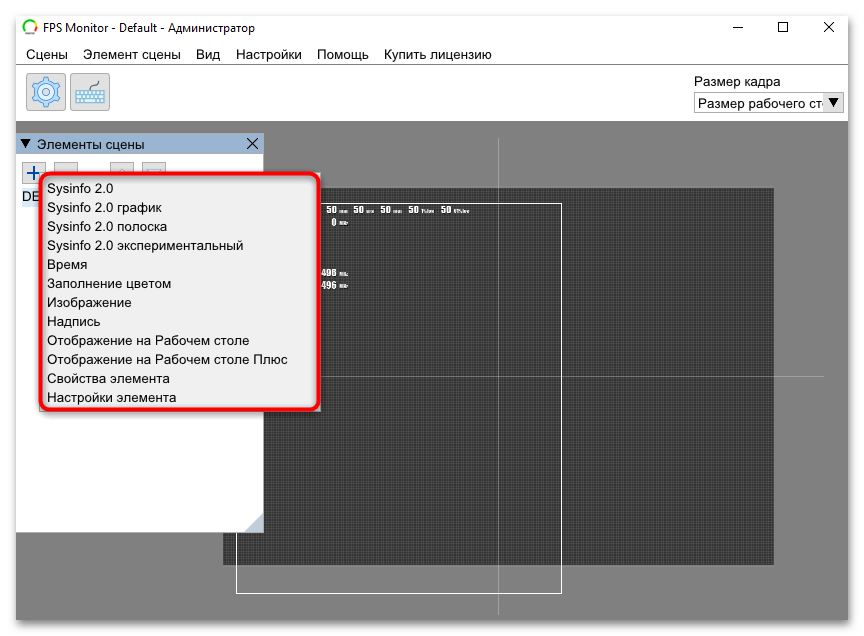
- Элементов присутствует несколько, но вас интересуют только те, которые находятся в группе «Sysinfo 2.0». Именно они отвечают за вывод датчиков в мониторе, а все остальные нужны только для дополнительных элементов.
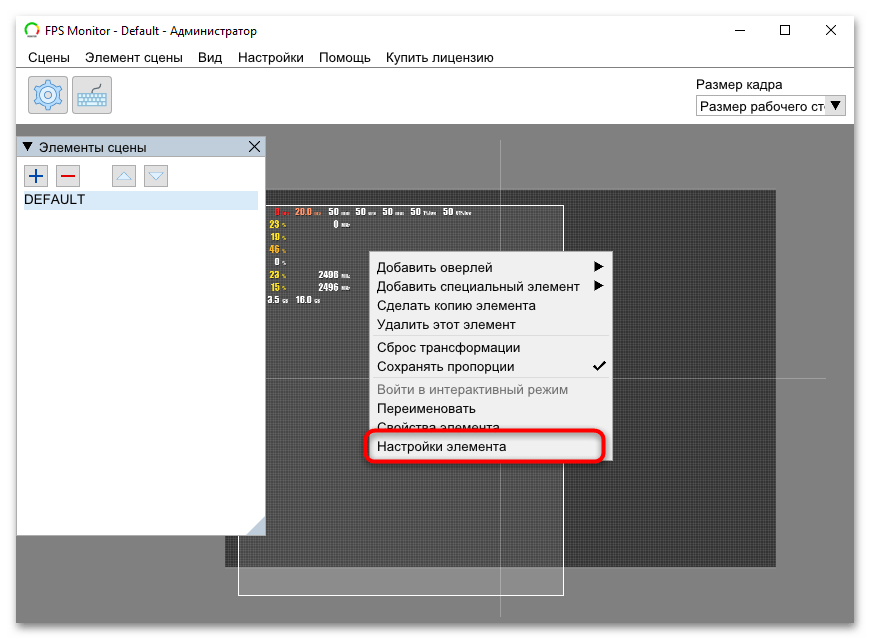
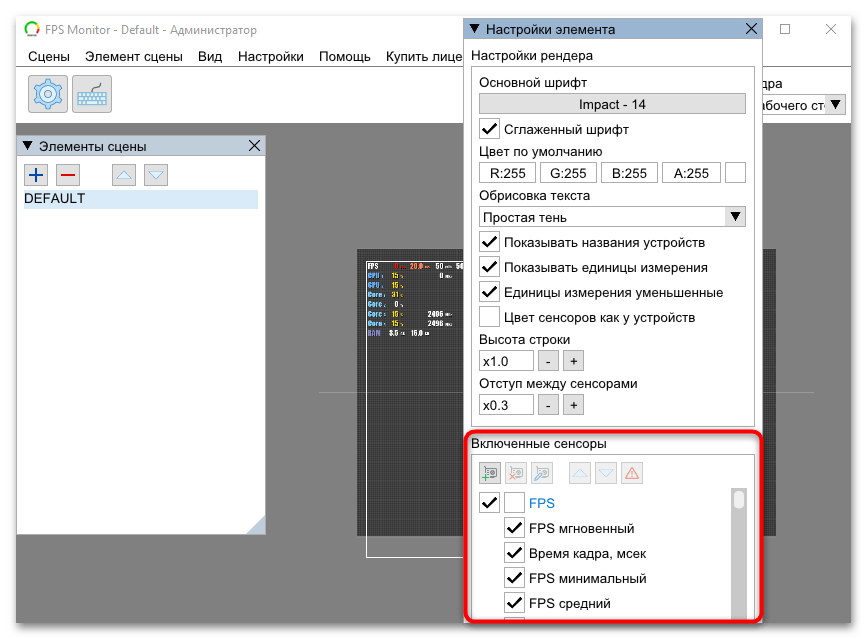
- Определившись со сценой, нажмите по элементу правой кнопкой мыши и выберите из появившегося контекстного меню пункт «Настройки элемента».
- В списке «Включенные сенсоры» отыщите все необходимые датчики, которые хотите включить.
- Поставьте галочки возле «CPU», а также возле сенсоров, отвечающих за его температуру.
- После применения всех настроек изменения сразу же отображаются в окне с элементом сцены. Именно в таком виде вы увидите монитор после того, как запустите игру. Важно, чтобы FPS Monitor был включен еще до открытия самой игры, иначе сенсоры могут не появиться.
Наша группа в TelegramПолезные советы и помощь
Table of contents
- Signs That Your PC’s CPU Is Overheating
- What Is a Normal CPU Temperature?
- Before Anything Else
- How to Check the CPU Temperature in the BIOS
- How to Check and Monitor the Temperature of the CPU Using First-party Apps
- Intel XTU
- AMD Ryzen Master
- AMD Software: Adrenalin Edition
- How to Check and Monitor the Temperature of the CPU Using Third-party Applications
- MSI Afterburner
- NZXT CAM
- Core Temp
- AIDA64 Extreme
- HWiNFO
- HWMonitor
- CPU Temperature Monitoring Apps: Comparison
- What to Do if Your PC Is Overheating?
- How to Check and Monitor the CPU Temperature on Your Windows 10/11 PC: Explained
- FAQ
Modern CPUs, or central processing units, perform billions of operations per second. Combine this with our growing love for multitasking (who doesn’t like to run a YouTube video in the background while browsing) and PC games becoming more and more demanding , and it’s no wonder why they still tend to overheat. While CPUs operate within safe temperature ranges most of the time, prolonged exposure to high temperatures can lead to system instability and , in most extreme cases, even physical damage. That’s why it’s also important to know how to monitor the CPU temperature in real time —to know your system better and be able to take timely measures to prevent overheating. In this guide, I’ll show you how to check the temperature of your CPU , talk about the reasons that can lead to your CPU running hot, and compare the CPU temperature monitoring tools so that you can choose one that fits your needs. And trust me, it’s not that hard.
Signs That Your PC’s CPU Is Overheating
Before anything else ,how do you tell if your CPU is operating outside its normal temperature? Here are a few common symptoms of an overheating computer :
- Lags and performance issues: If you notice a sudden decrease in your system’s performance, frequent lags, or delays in executing tasks, it could be a sign of CPU overheating.
- Unexpected shutdowns: Overheating may trigger your PC to shut down unexpectedly as a protective measure to prevent damage. If your computer regularly powers off without warning, overheating could be the cause.
- Loud fan noises: When the CPU temperature rises, cooling fans start working harder to dissipate heat. Unusually loud or continuous fan noises may indicate that your system is struggling to maintain a safe temperature.
While some of those may as well be signs of malware , chances are that your processor needs help . Ok, that’s clear, but what is considered a normal CPU temp? We’re about to find out.
Download Auslogics Anti-Malware
Detects malware, spyware and viruses, then safely removes them from your PC to help keep it as secure as possible. The program is made to complement your main antivirus.
What Is a Normal CPU Temperature?
Well, it depends on the processor model and the tasks you’re throwing at it . A safe, optimal CPU temperature range for most Intel and AMD processors is between 40°C (104°F) and 70°C (158°F) under normal workloads. However, more intensive tasks, like gaming or video rendering, may push this range to 70°C–80°C (158°F–176°F) .
Not sure what CPU you have? Check out this guide:How to Check What CPU Do I Have on My Windows PC?
When under load, Intel processors tend to run hotter, as they are known for pushing higher clock speeds and consuming more power. Their maximum operating temperatures (Tjmax) can reach up to 100°C (212°F). AMD processors , designed for better power efficiency, typically run cooler, with temperatures generally peaking at around 95°C (203°F). These figures can vary based on specific models and cooling setups, so monitoring your CPU temperature is key. What is a good CPU temp by processor family?
| Processor family | Normal operating temp (idle/load) | Tjmax (max operating temp) |
|---|---|---|
| Intel Core (i3-i9) | 30°C–80°C (86°F–176°F) | 100°C (212°F) |
| Intel Xeon | 30°C–70°C (86°F–158°F) | 85°C (185°F) |
| AMD Ryzen (Ryzen 3-Ryzen 9) | 30°C–80°C (86°F–176°F) | 95°C (203°F) |
Upon reaching and passing Tjmax, CPU throttling occurs, reducing the voltage on your processor to lower the temperature and prevent overheating. Also remember that prolonged operation at temperatures over 80°C–85°C (176°F–185°F) can affect your CPU lifespan, degrade performance, and lead to system instability.
What is a normal CPU temperature during gaming?
While the exact figures can vary depending on factors like the specific processor model, cooling solution, and the intensity of the game being played, generally, a CPU temperature range between 65°C (149 °F ) and 85°C (185 °F ) during games is considered safe.
High-end gaming setups with robust cooling solutions may keep temperatures towards the lower end of this range, while less powerful systems or those in demanding gaming scenarios may experience temperatures closer to the upper limit.
That said, you shouldn’t neglect monitoring your CPU temperature while playing, and remember that sustained temperatures above the safe range could lead to long-term damage.
Before Anything Else
The CPU is the powerhouse behind your computer’s operations. Even if you’re not mining crypto or making it perform endless AI-related calculations per second, there are still a number of more conventional ways to warm up your processor; one of them is gaming.
Although modern games generally rely more heavily on the GPU than the CPU, there are a few, such as Star Citizen, Total War: Warhammer 2, and Cyberpunk 2077 , which, along with video editing and decoding software, are among the most CPU-intensive tasks for your PC.
Additionally, as a PC or laptop ages , the thermal paste wears out and its components start producing more heat, meaning the older it gets, the harder it is to cool the processor.
With that in mind, it’s important to know how to check the temperature of your CPU when running resource-demanding operations or hearing loud fan noises and monitor it to ensure your processor performs well and stays within safe temperature ranges.
But before anything else, it’s worth checking if high CPU temperature is caused by increased processor workload in Task Manager.
It’s quite easy; simply follow these steps:
- Right-click anywhere on the taskbar and select Task Manager .
- Go to the Performance tab and select CPU.
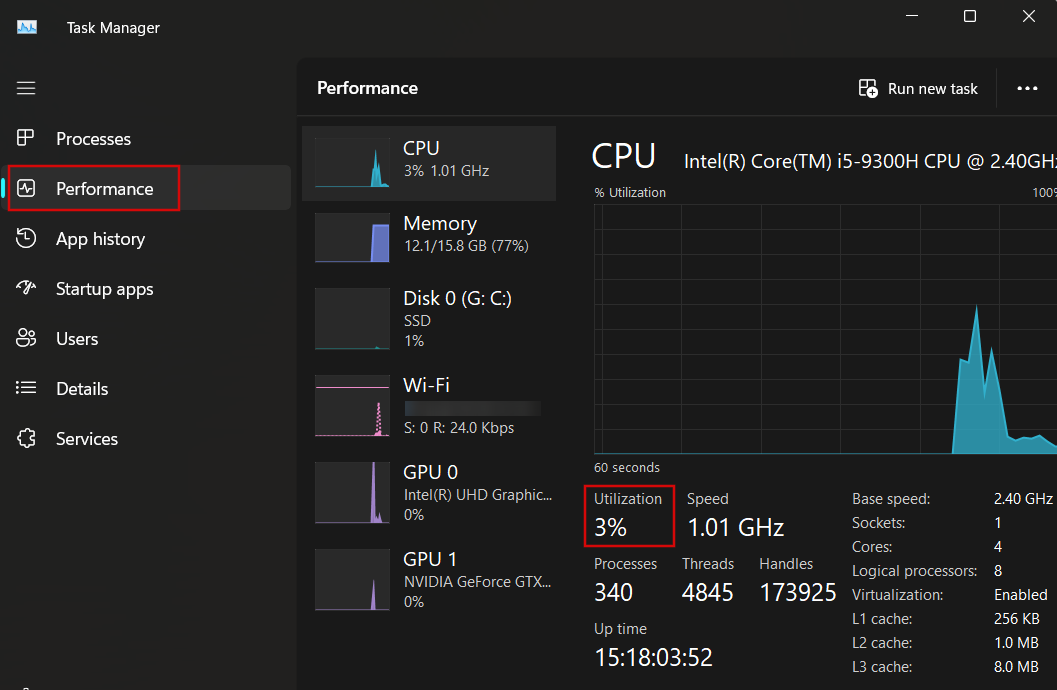
Now, look at the figures under the graph. If you notice sustained CPU utilization of 90% and higher , it could well be the reason for increased heat generation . Consider stopping unnecessary apps from running in the background to reduce the load on your processor.
Now, let’s explore how to check your PC temperature using the BIOS and how to monitor it using more feature-rich solutions.
How to Check the CPU Temperature in the BIOS
If you want to see the CPU temp in Windows 11 or 10 without installing any apps, you can do that in the BIOS. Here’s how:
- Save any ongoing work and restart your computer.
- During the boot-up process, press the designated key to enter the BIOS . Depending on your computer’s manufacturer, it would commonly be
F2, F10, F12, ESC,orDEL. - Once inside the BIOS interface, navigate to the section that contains hardware information. This is often labeled as Hardware Monitor , PC Health , or similar, depending on your motherboard manufacturer .
- Look for the CPU temperature reading labeled as CPU Temperature or something similar.
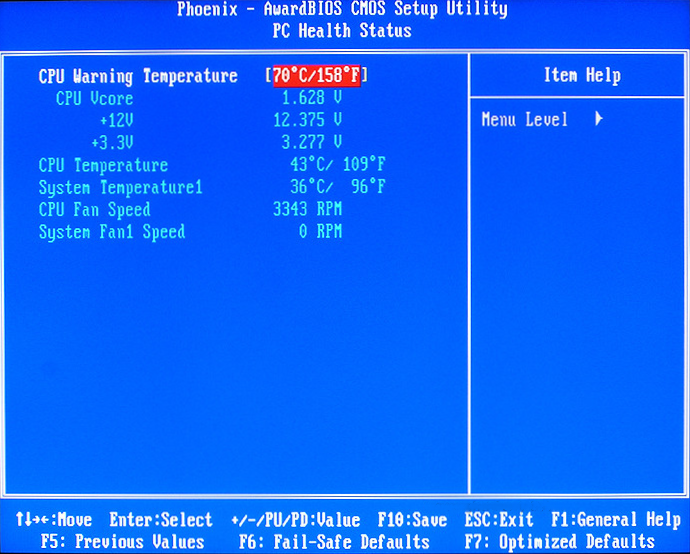
Image source: superuser.com
The BIOS interface doesn’t provide real-time temperature data like specialized apps, but only a snapshot of the current CPU temperature.
How to Check and Monitor the Temperature of the CPU Using First-party Apps
Unlike the BIOS, specialized applications allow you to not only check the current temperature of your CPU but to keep track of it in real-time. Some of them offer additional metrics , such as fan speed, GPU temperature, and system voltages. For starters, two major CPU manufacturers, Intel and AMD, have their own software tools that allow for checking and monitoring CPU temperature . So let’s first see what both companies have to offer. First of all, you need to identify your processor manufacturer . Here’s how to do it:
- Type
aboutin the taskbar search box and select About your PC.
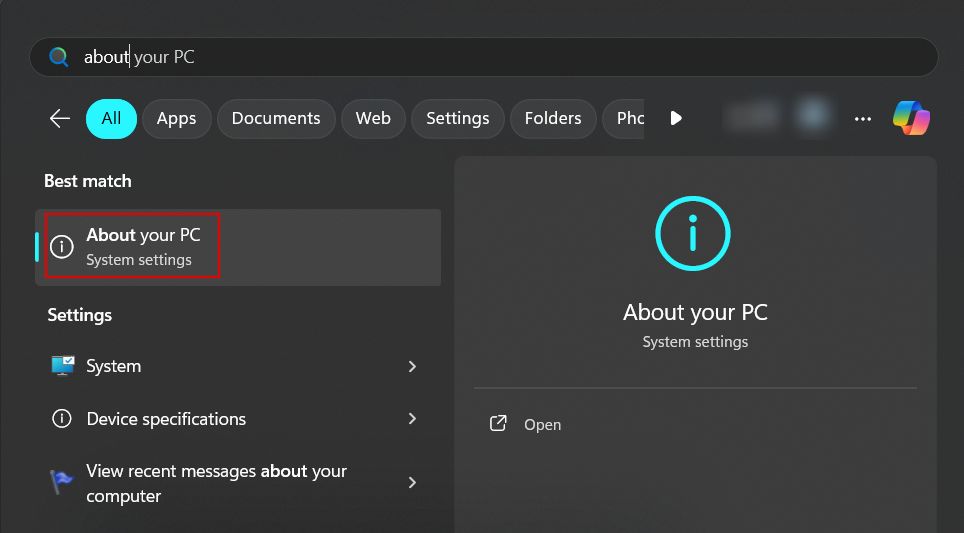
- Look for Processor under Device specifications on the right side to identify your CPU model.
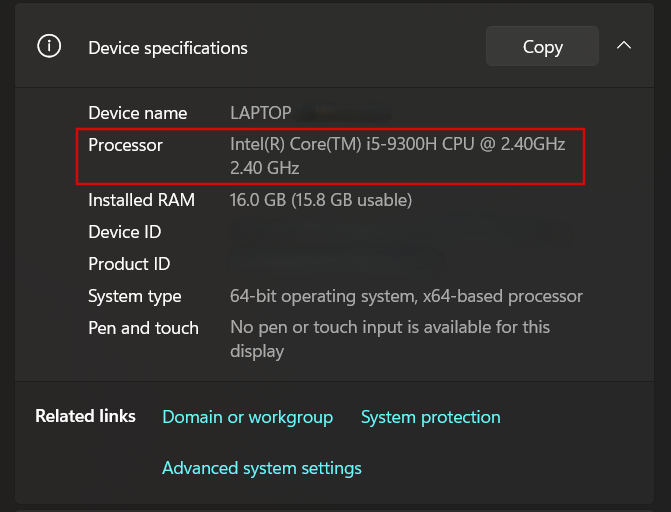
If it’s Intel, like mine, you need to use Intel Extreme Tuning Utility (or Intel XTU). If it’s AMD, then your choice is Ryzen Master or AMD Software: Adrenalin Edition that has an overlay feature.
Now, let’s take a closer look at how you can check and monitor the CPU temperature using these apps, and then check out the third-party solutions.
Intel XTU
Intel XTU not only allows you to check and monitor CPU temperature but also provides advanced options , such as tuning core ratios and adjusting voltages, if you’re in for overclocking or CPU undervolting .
How to use:
- Download and install Intel XTU , and open the app.
- The interface will provide you with various options for tuning, benchmarking, and monitoring your Intel processor.
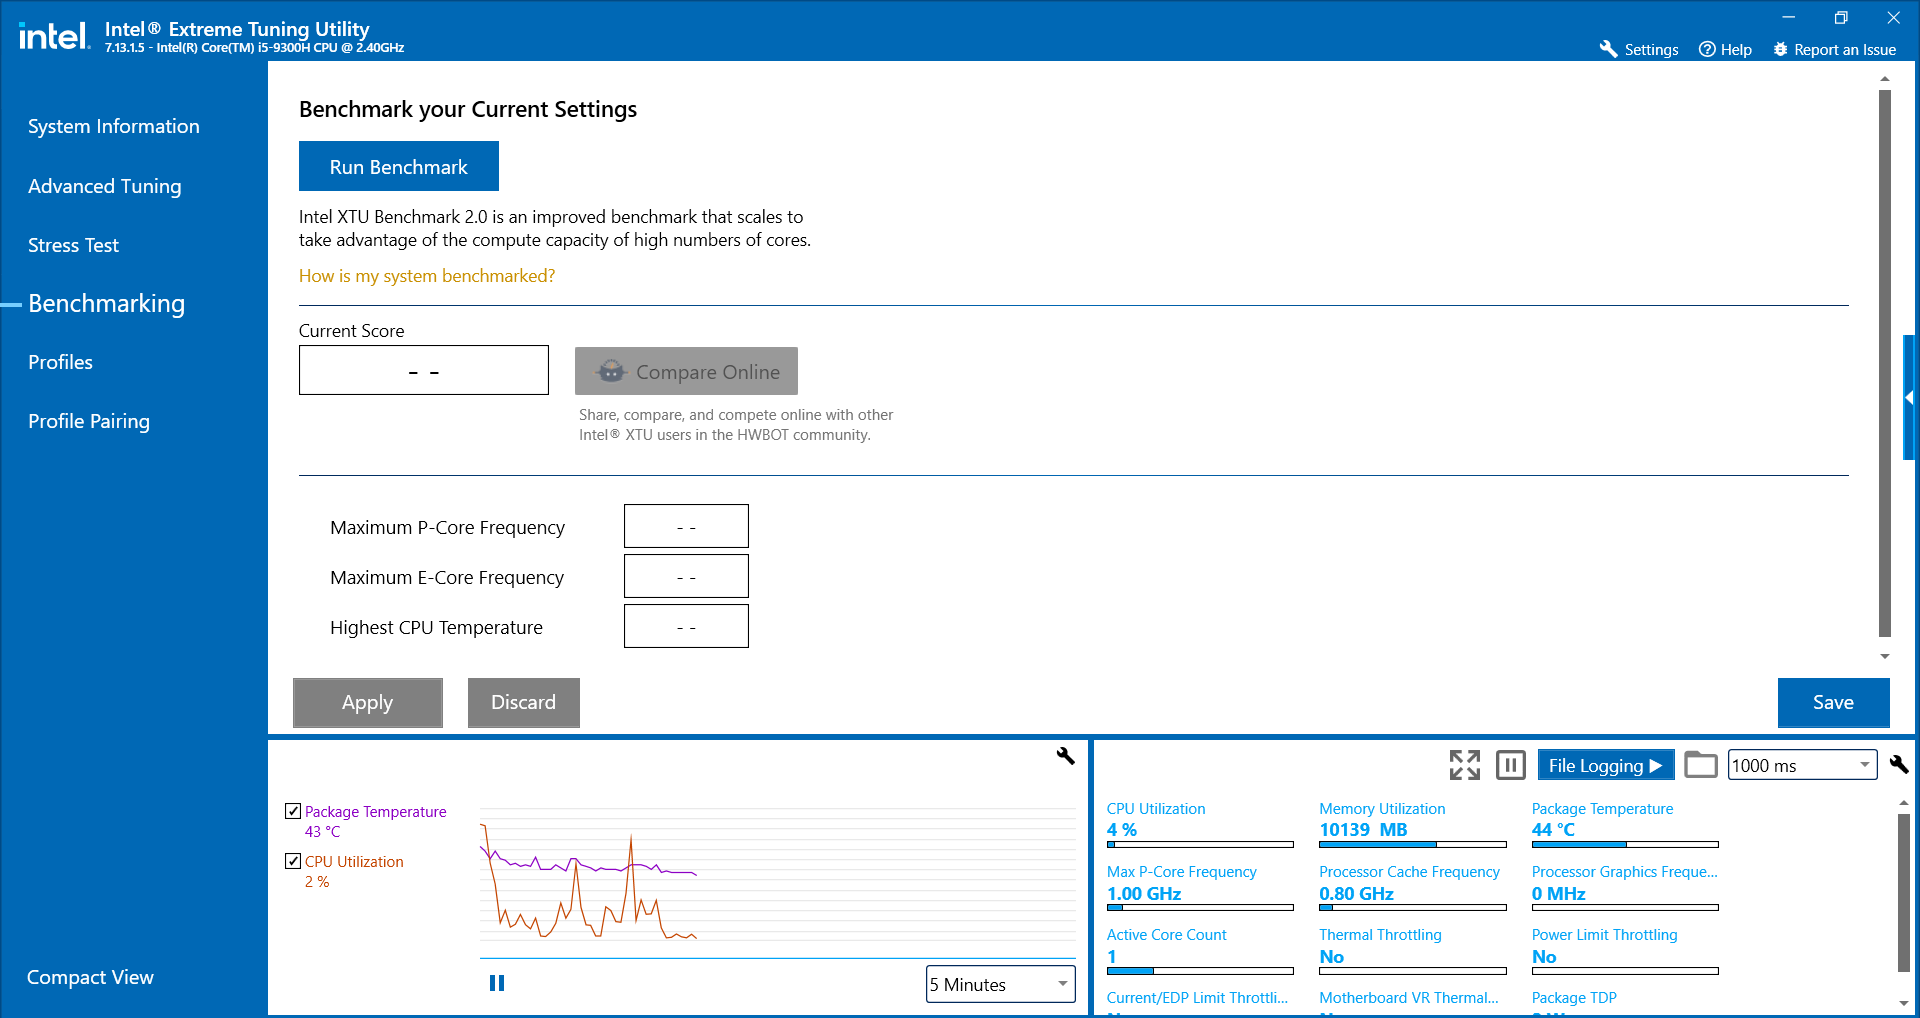
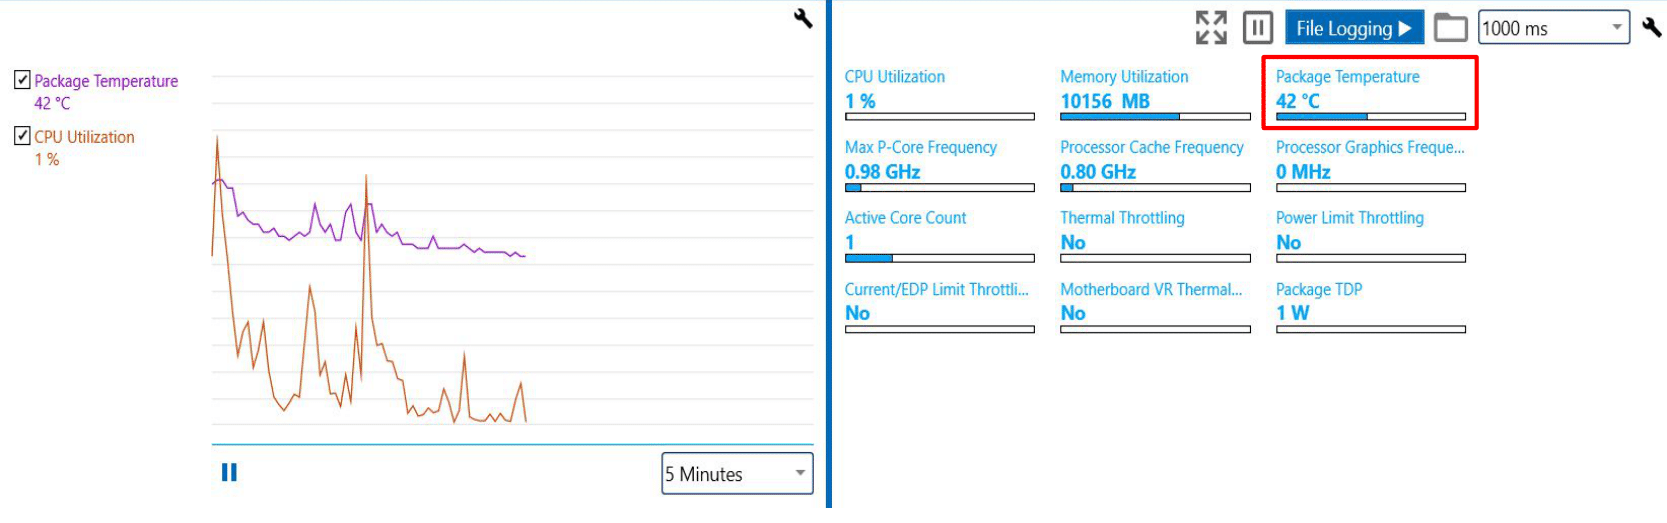
- While Intel XTU is primarily designed for overclocking and performance tuning, it allows you to monitor the CPU temperature in real time , among other performance indicators in the lower bar (shown as Package Temperature ).
Pros:
- Simple, easy-to-use interface
- Includes overclocking tools
Cons:
- Only works with Intel CPUs
- No overlay feature
Suitable for gaming:
No, Intel XTU doesn’t have an overlay feature to view your real-time CPU temperature. The only option is to run the app in the background in a separate window, but that’s not quite convenient.
What users say:
Users praise Intel XTU for its ease of use and overclocking capabilities but are quite skeptical about its benchmark tool .
AMD Ryzen Master
Ryzen Master’s interface, just like Intel’s, also offers additional metrics like CPU clock speed, voltage, and more, allowing for overclocking and undervolting.
How to use:
- Download and install Ryzen Master , and open the app .
- Look for Temperature on the left side of the app’s interface to see the current CPU temperature displayed in real time. Under the current temperature, you can see the maximum temperature for your processor.
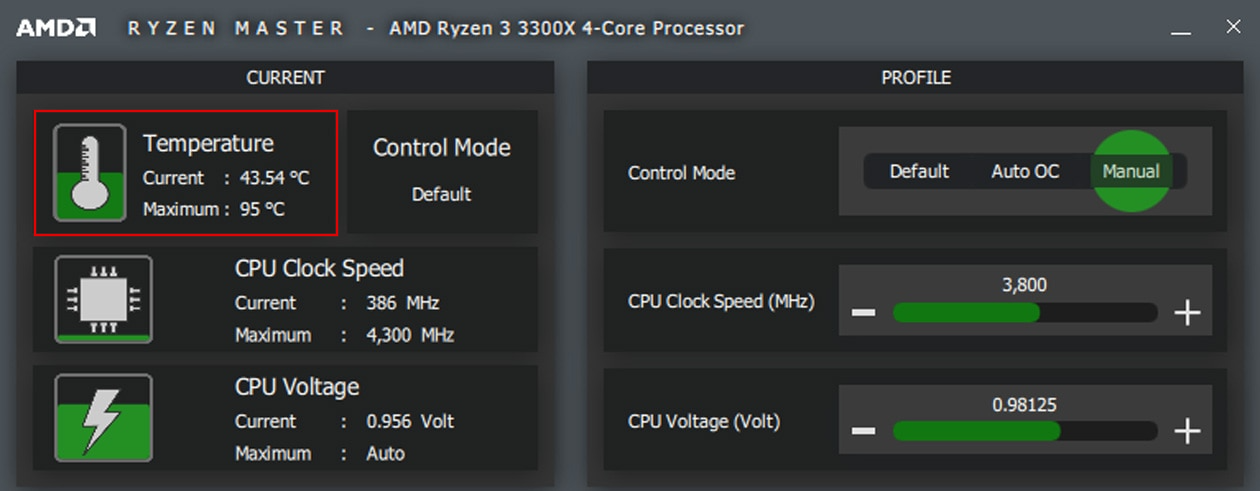
Image source: amd.com
Pros:
- Detailed monitoring and overclocking features
- User-friendly interface
Cons:
- Only supports Ryzen CPUs
- No overlay feature
Suitable for gaming:
No, just like Intel XTU, it doesn’t have an overlay feature to monitor the CPU temperature in real time.
What users say:
Most users on Reddit agree that AMD Ryzen Master is better used for monitoring and testing rather than overclocking. Plus, the app is reported to glitch from time to time, which can make it feel unreliable.
AMD offers different versions for Ryzen 3000 series CPUs and newer and Ryzen 2000 series and older. Make sure to download the right version for your processor.
Also read: How to Update AMD Drivers
Both apps allow you to check and monitor the CPU temperature to ensure it stays within safe operating limits and prevent overheating . But while you can keep them running in the background during gaming to monitor your CPU temperature and other metrics, none of them offers a convenient overlay.
Important!
With all the good stuff you can get from both Intel XTU and AMD Ryzen Master, it’s important to remember that they are primarily designed for overclocking and use them responsibly, avoiding extreme settings that could lead to overheating or instability.
AMD Software: Adrenalin Edition
AMD Software: Adrenalin Edition offers a user-friendly interface for monitoring AMD hardware, including the CPU and GPU. It provides real-time monitoring with an in-game overlay and additional features, such as fan speed control , built in.
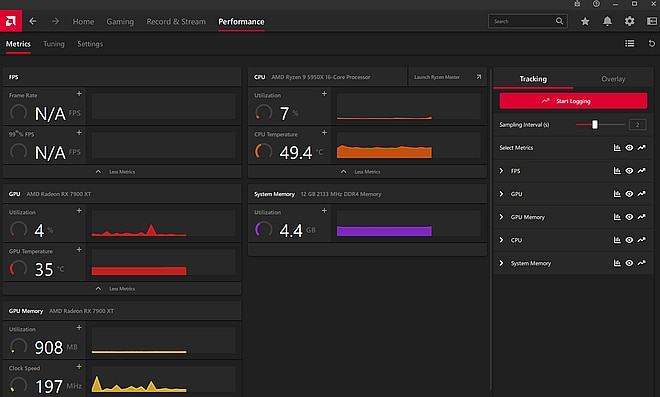
Image source: amd.com
How to use:
- Download and install AMD Software: Adrenalin Edition . On that page, you will need to select your graphics card from the list first to be able to download the app.
- Launch the app, and on the home screen, click on the Performance tab.
- Here, you can view CPU and GPU temperatures, fan speeds, and other performance data in real time.
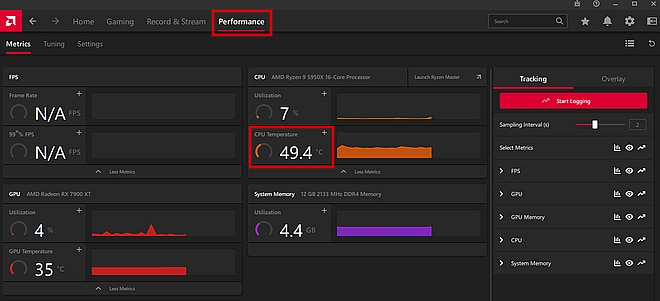
Image source: amd.com
- To launch the overlay feature, click on Overlay in the right-side pane, enable the CPU Temp metric gauge, and toggle the Show Metrics Overlay option.
Images source: amd.com
Pros:
- Simple and intuitive interface
- Built-in optimization tools for both CPU and GPU
- In-game overlay for real-time CPU temperature monitoring
Cons:
- Only available for AMD hardware
- Limited customization compared to other tools
Suitable for gaming:
Yes, with the in-game overlay feature, AMD Software: Adrenalin Edition allows you to monitor CPU temperature and other key metrics while gaming.
What users say:
Users appreciate the app’s ease of use and integration with AMD hardware, but some mention that its overlay function is negatively affecting FPS , which is not good for gaming.
Also read: How to Check and Increase FPS on a Windows PC
AMD Software: Adrenalin Edition is compatible with AMD Ryzen processors with Radeon graphics, AMD Ryzen PRO processors, AMD Athlon processors with Radeon graphics, and AMD Athlon PRO processors.
Just like the previous two apps, AMD Software: Adrenalin Edition is mostly designed for overclocking, but its overlay feature makes it more suitable for keeping tabs on your processor’s current temperature during various tasks.
In the next section, I’ll be showing you how to check and monitor the computer temperature using third-party monitoring tools .
How to Check and Monitor the Temperature of the CPU Using Third-party Applications
Now that we know that processor manufacturers offer specialized tools that are quite “heavy” for simple CPU temperature monitoring and more suited for overclocking, let’s go over some third-party apps that may make this process easier.
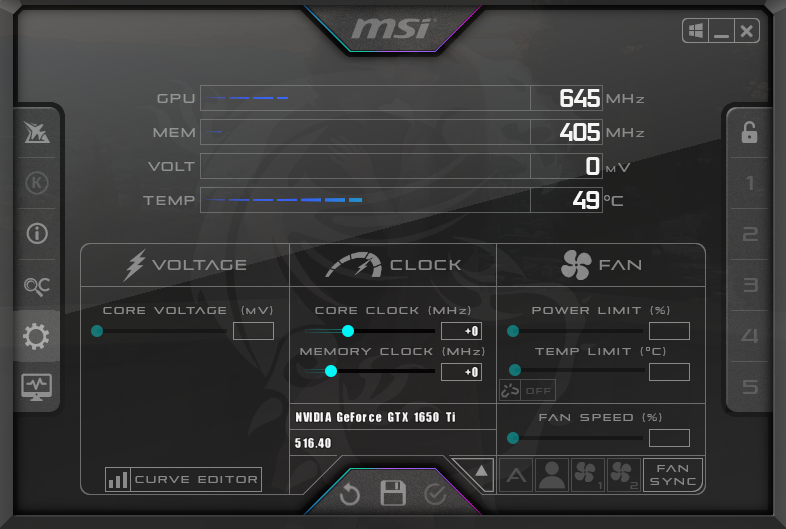
MSI Afterburner
This highly customizable tool is perfect if you want real-time temperature monitoring for both CPU and GPU. However, its complex interface can be challenging for beginners.
How to use:
- Download and install MSI Afterburner . During the installation, you will be prompted to install RivaTuner as well. Do that, otherwise you won’t be able to run the overlay with real-time CPU temperature data.
- Run the app and click the button that looks like a monitor on the left side of the app window. This will launch the hardware monitor, where you can track all sorts of metrics, including the CPU temperature, in real time.
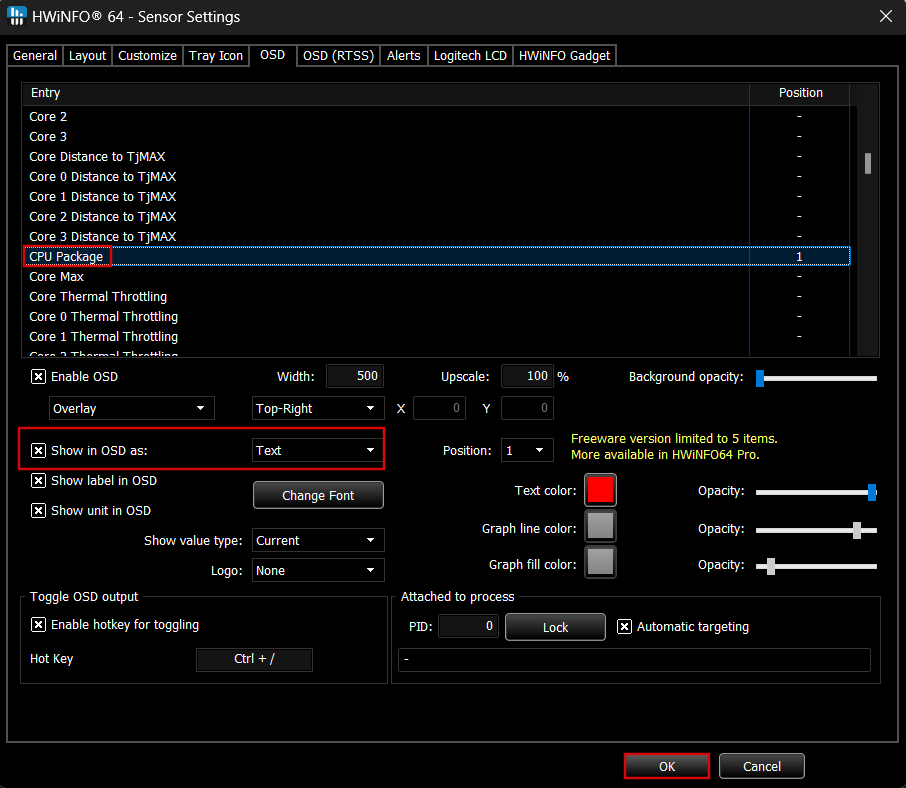
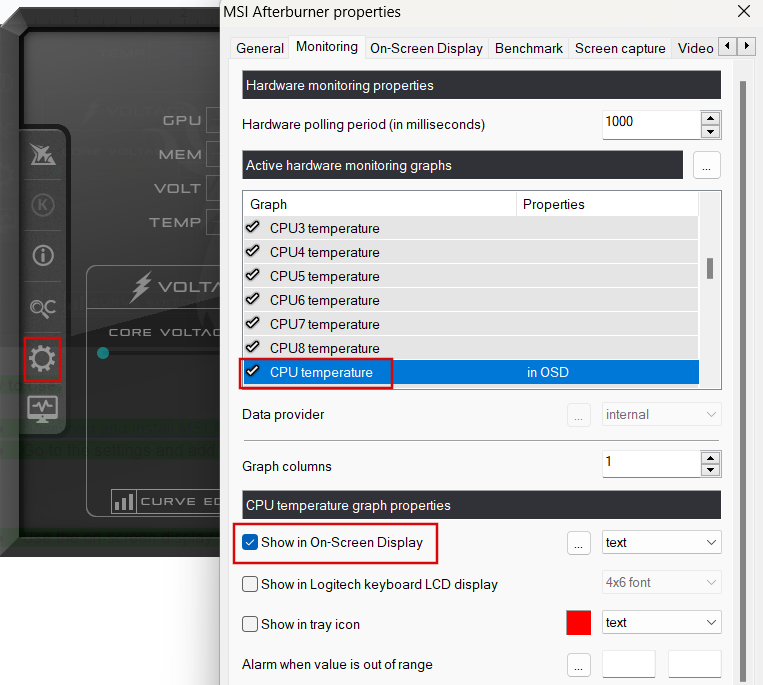
- To launch the overlay and monitor the CPU temperature during gaming or while using certain apps, click on the gear-shaped button in the main window and go to the Monitoring tab.
- Locate CPU temperature under Active hardware monitoring graphs, click it, and then check the Show in On-Screen Display box.
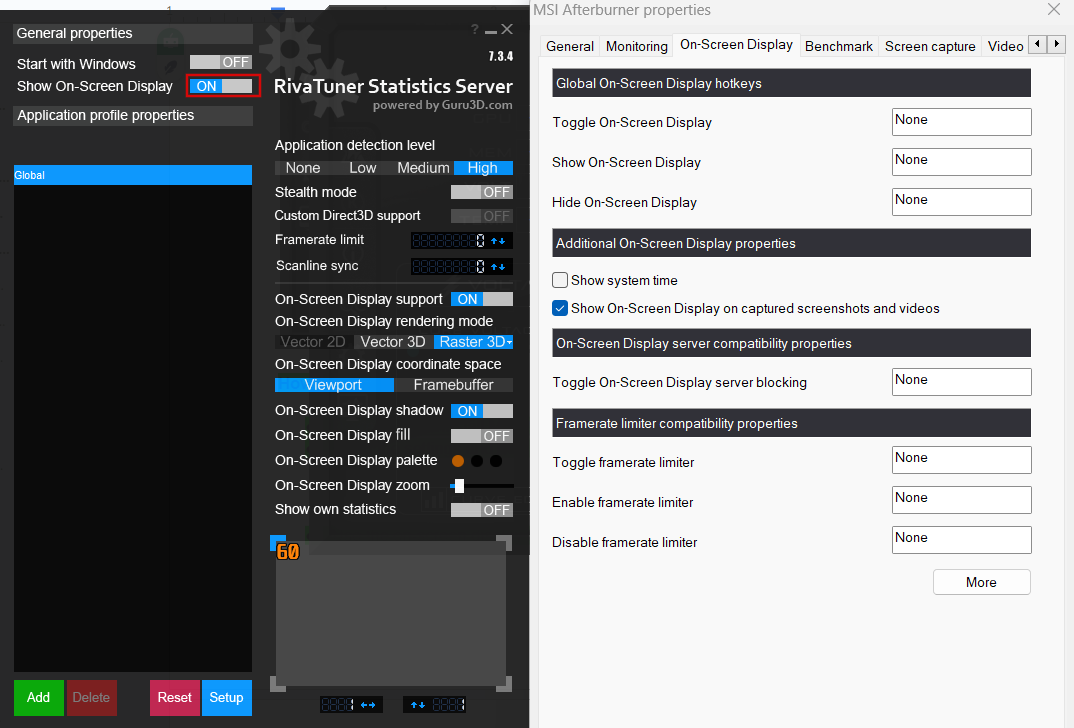
- Then, go to the On-Screen Display tab, click More in the bottom of the window, and make sure the Show On-Screen Display button under General properties is switched on. You can also customize the looks of this on-screen display here.
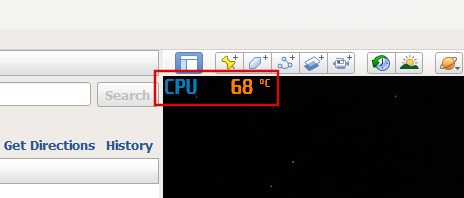
- You can now monitor the CPU temperature in games and apps in real time. It will be displayed in the upper left corner of the game or app window.
Pros:
- Highly customizable
- Supports both GPU and CPU monitoring
- Features the on-screen display for real-time tracking
Cons:
- Can be overwhelming for beginners due to its complex interface
Suitable for gaming:
Yes, MSI Afterburner is great for gaming as it offers an in-game overlay that shows real-time temperature monitoring for both CPU and GPU.
What users say:
Generally, MSI Afterburner gets positive reviews on Reddit and is recommended by users as a reliable and trustworthy solution to monitor the CPU temperature with a convenient overlay feature.
NZXT CAM
NZXT CAM nicely balances simplicity and functionality. The app features all the necessary tools for CPU monitoring, such as temperature, clock speed, and load. And it looks cool, too!
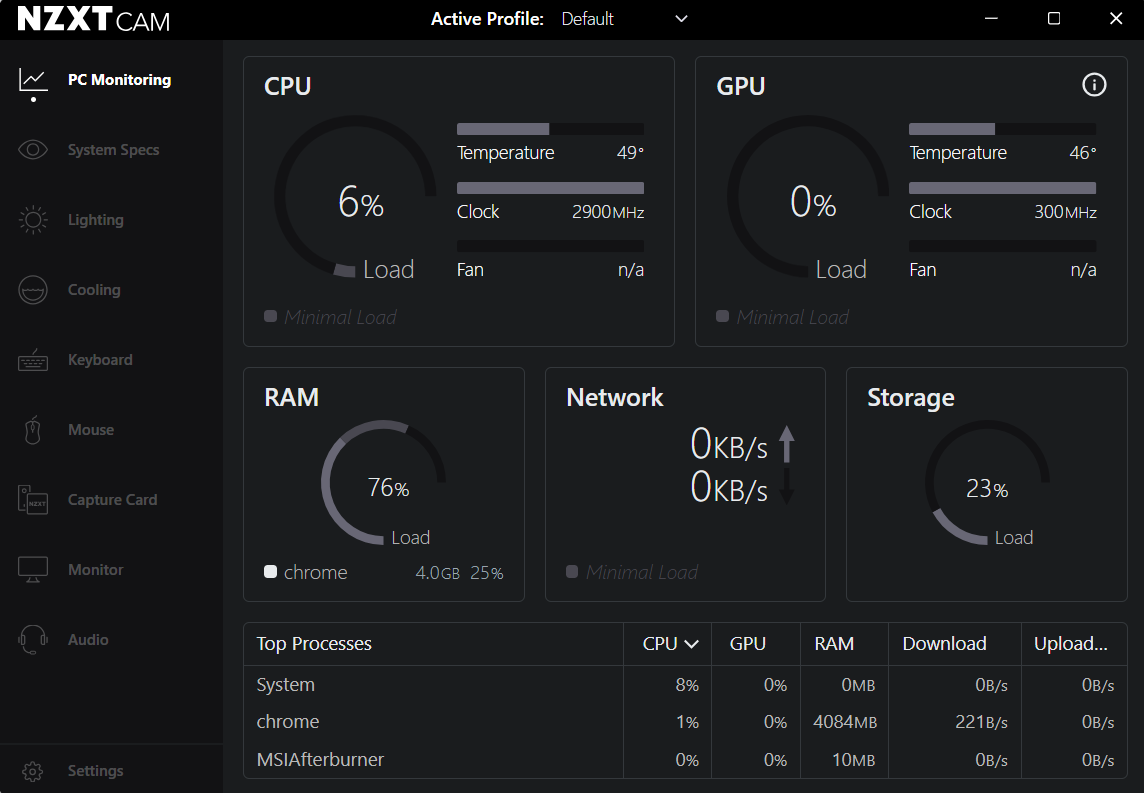
How to use:
- Download and install NZXT CAM .
- Launch the app and monitor CPU temps right from the dashboard or click on the CPU window to open the CPU Details window and get more info on your processor.
- To launch the overlay and monitor the CPU temperature during gaming, go to Settings > Mini Mode . Scroll down and make sure the CPU Temperature box is checked under Panels .
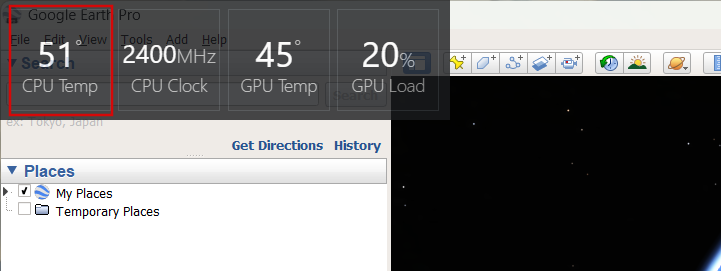
- Scroll back up and click Launch Mini Mode in the upper right corner of the window.
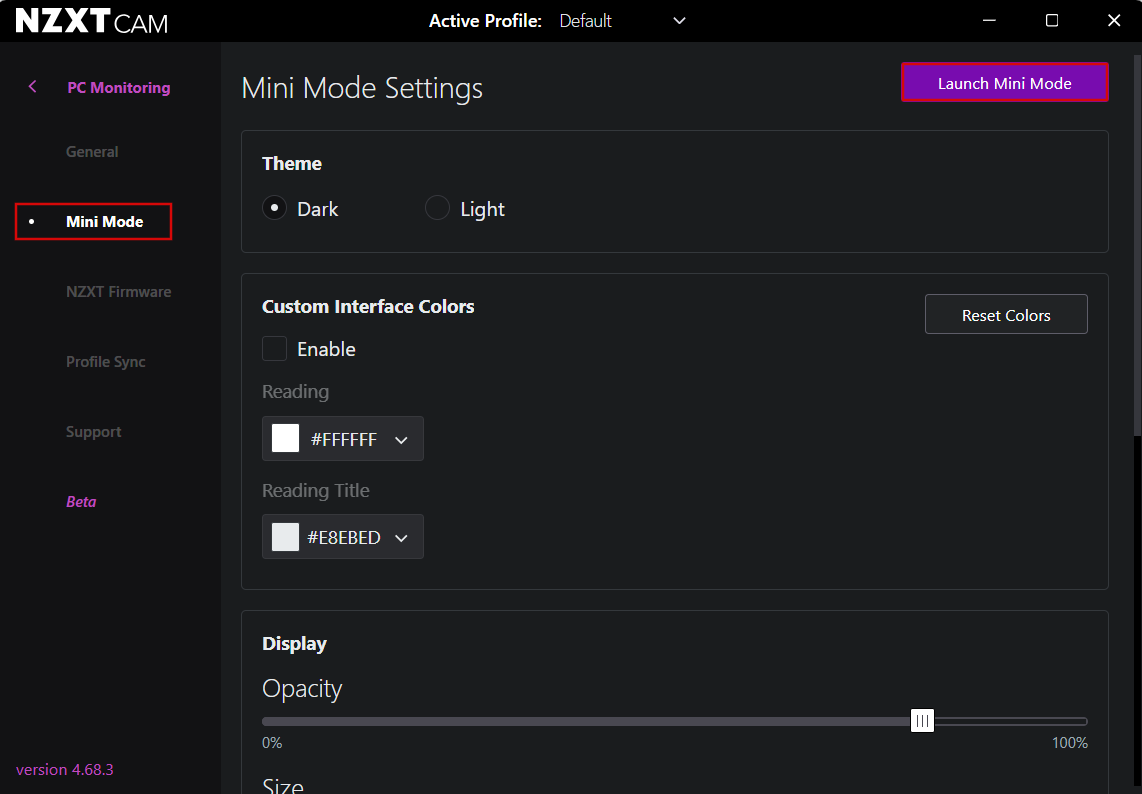
- The CPU temperature will be displayed in a transparent window in the upper left corner of the screen.
Pros:
- Sleek, intuitive interface
- Multi-hardware support (CPU, GPU, etc.)
- Game overlay feature
Cons:
- Large size (over 450MB)
- Some users report inaccurate readings
Suitable for gaming:
Yes, the Mini Mode feature that shows the CPU temperature and other metrics during gameplay makes NZXT CAM a decent pick for gamers.
What users say:
Despite NZXT CAM’s nice-looking design and ease of use, user reviews on Trustpilot are far from complimenting. In general, people are quite unhappy with the app’s performance and the customer support.
Core Temp
Core Temp is a lightweight, no-frills app that displays your CPU temperatures instantly, making it a solid choice for basic monitoring. While it’s simple and efficient, it lacks advanced features like overlays.
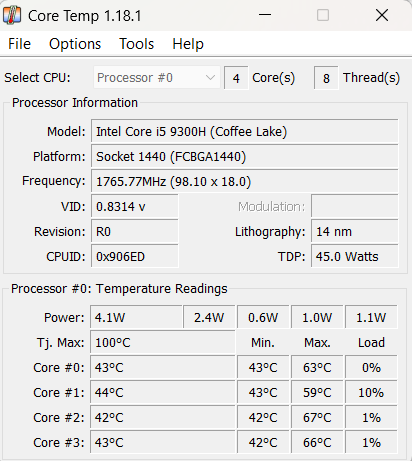
How to use:
- Download and install Core Temp .
- Open the app to view CPU temperatures instantly in the app or in the system tray (click Show hidden items), which will show the temperature of each CPU core.
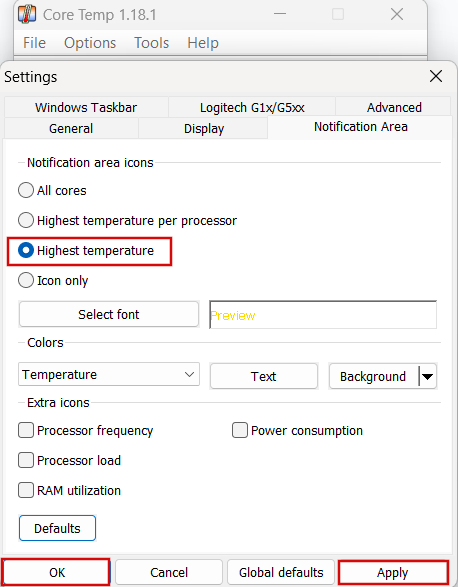
If you don’t need to view all cores, you can instruct the app to display only the hottest one. Simply go to Options > Settings > Notification Area and click on the Highest temperature radio button under Notification area icons . Don’t forget to click on Apply and OK to save changes.
Pros:
- Lightweight and resource-efficient
- Simple and straightforward to use
Cons:
- Lacks overlays
- Basic functionality without additional performance stats
Suitable for gaming:
No, Core Temp does not have in-game monitoring features, so you cannot track temperatures while gaming.
What users say:
Generally, Core Temp has positive references from the users and is praised for its reliability and ease of use.
AIDA64 Extreme
Known for its in-depth hardware analysis, AIDA64 Extreme is ideal for advanced users who not only require detailed CPU temperature data but also for benchmarking and overclocking. The free version has its limitations, but it’s still a reliable option for serious hardware enthusiasts.
How to use:
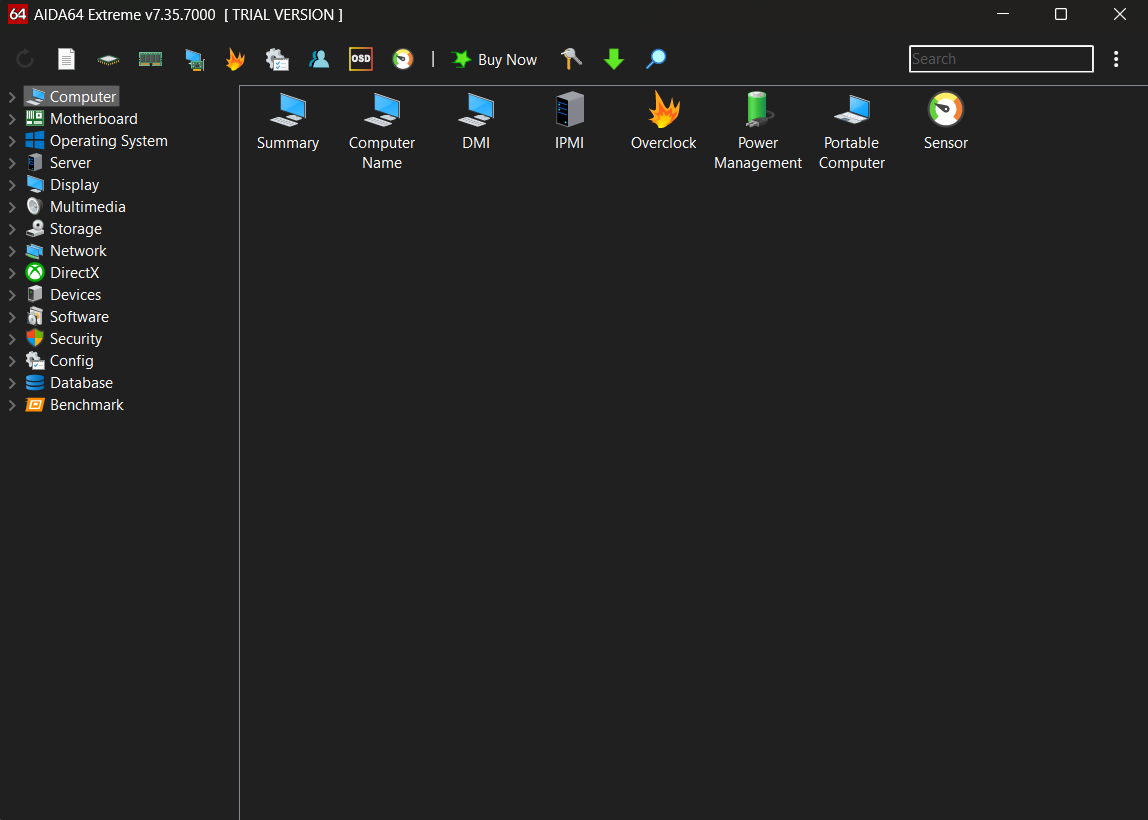
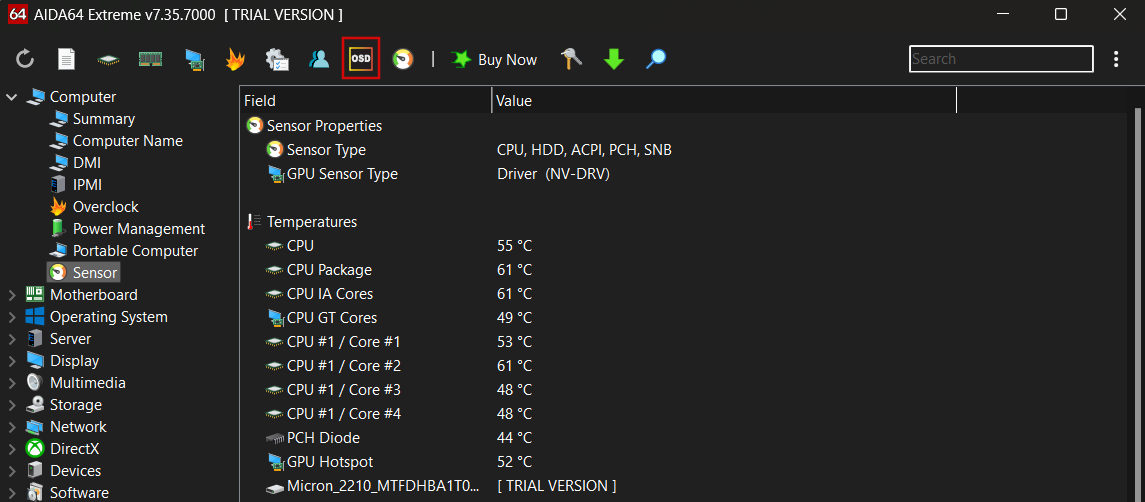
- Download and install AIDA64 .
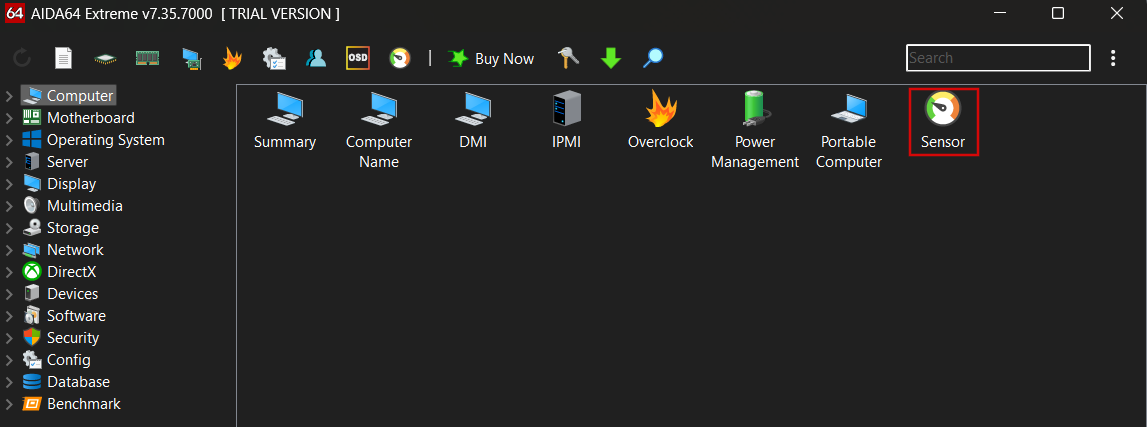
- Open the app and click Sensor.
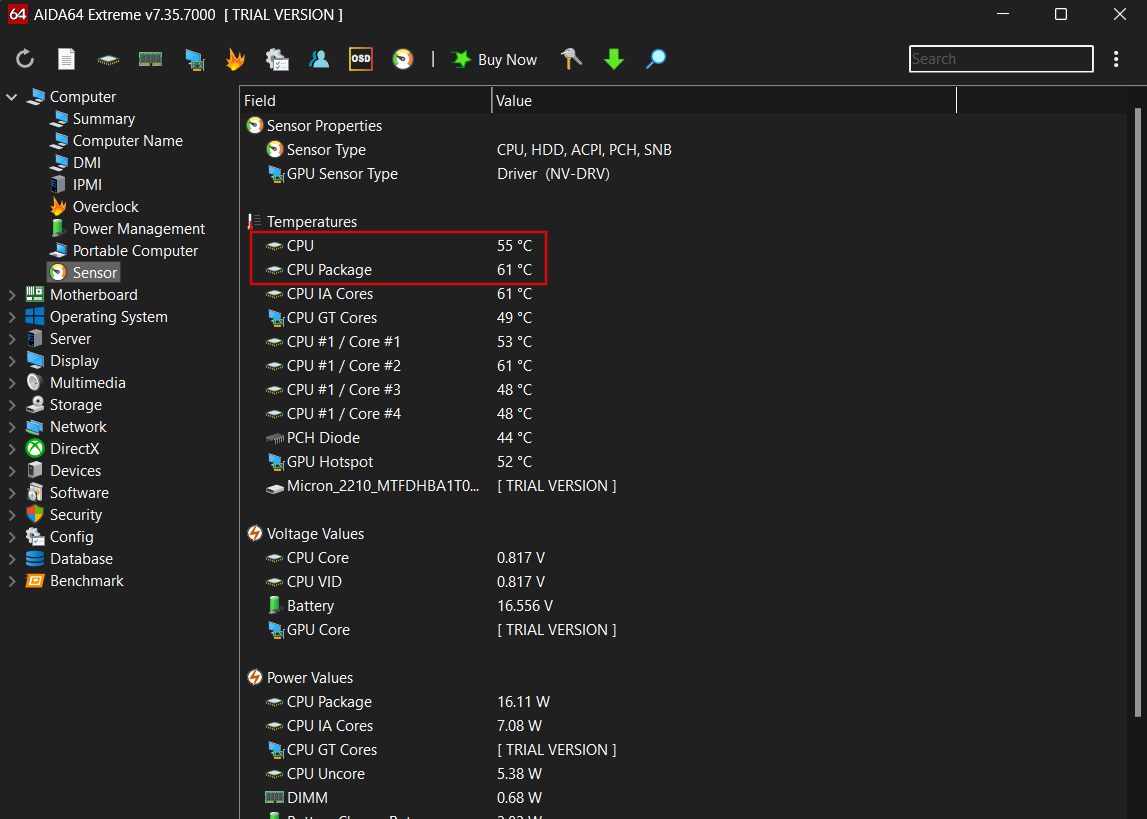
- The CPU temperature will be displayed under Temperatures , along with other readings.
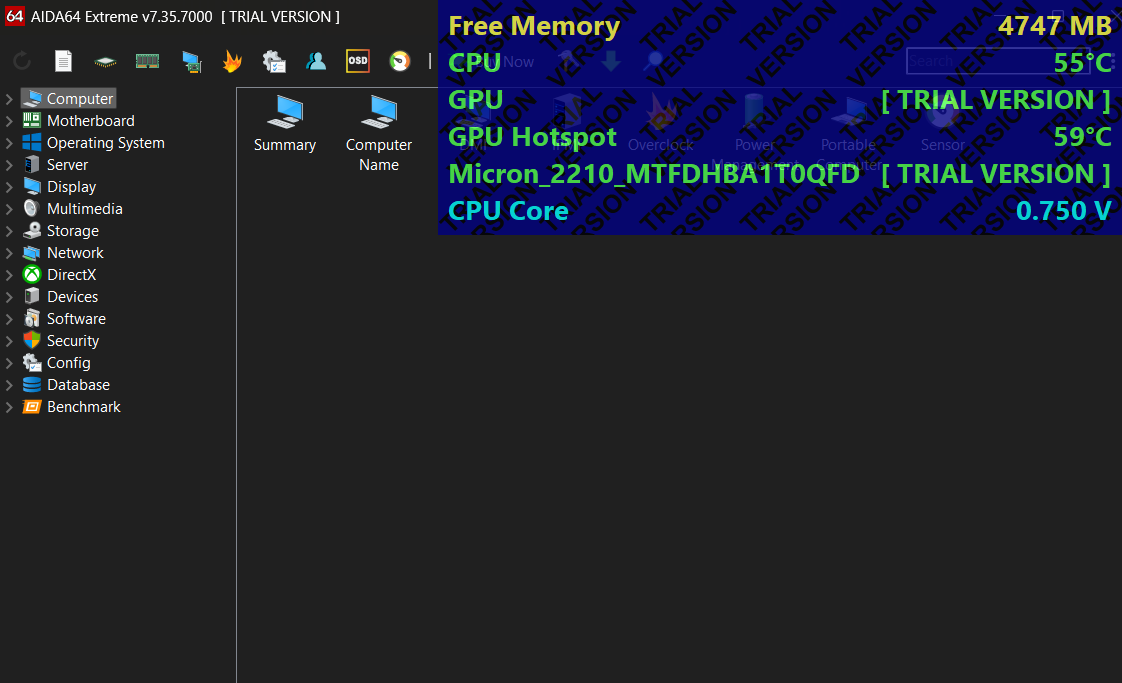
- To launch the overlay, click on the OSD icon in the upper menu.
- You can now play and monitor your CPU temperature and other metrics in real time.
Pros:
- Provides extensive hardware details
- Ideal for advanced users needing in-depth analysis
Cons:
- Can be too much for simple CPU temperature monitoring
- Free version limited to 30 days
Suitable for gaming:
Yes, AIDA64 Extreme offers temperature monitoring that can be used during gaming.
What users say:
AIDA64 Extreme gets high marks and good references from users for its usefulness and customization options, even despite a learning curve that might be a bit steep for less experienced users.
HWiNFO
HWiNFO delivers incredibly detailed monitoring; however, its detailed interface can be a bit overwhelming if you’re only looking for CPU temperature metrics.
How to use:
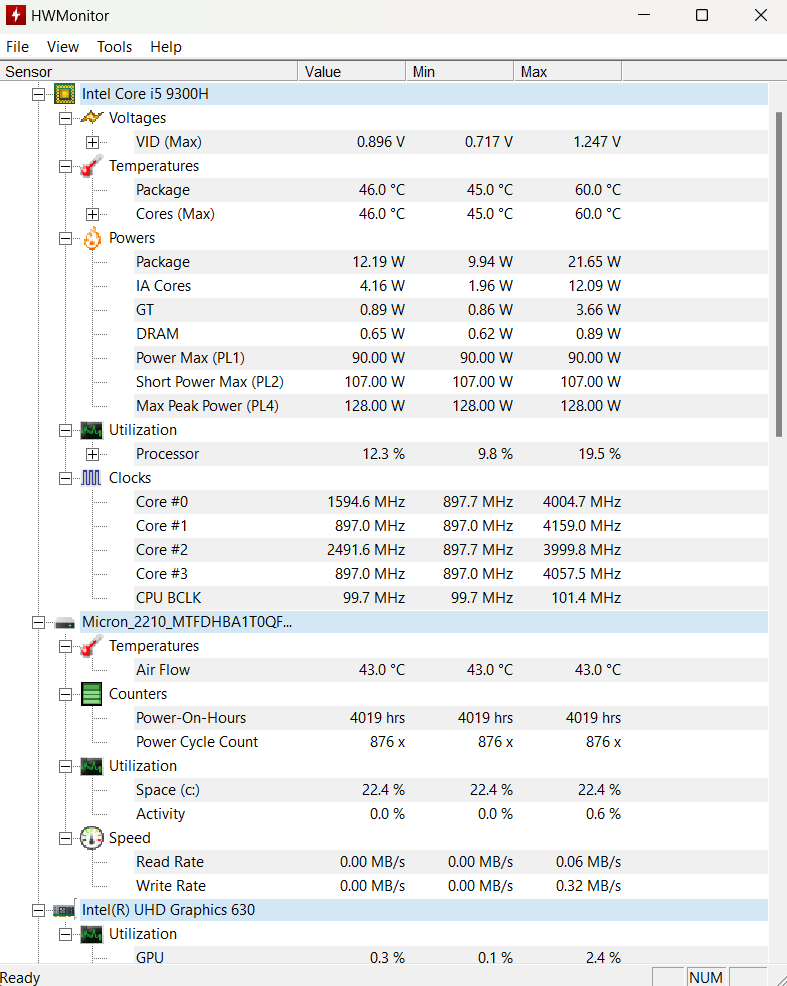
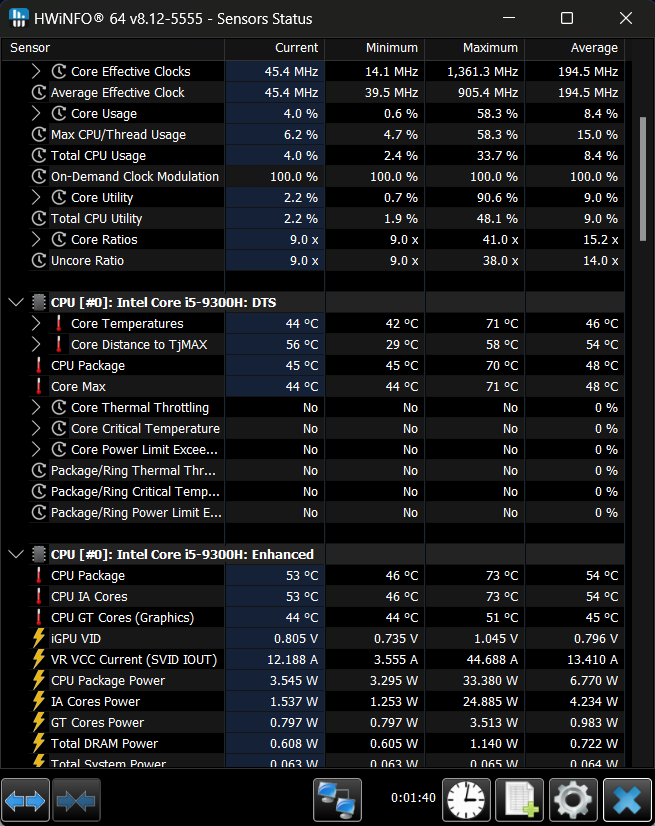
- Download and install HWiNFO .
- Open the app, tick the Sensors-only box, and click Start.
- Scroll down to your CPU and locate CPU Package . This is the CPU temperature to monitor.