
При запуске новых сервисов в Windows, вы можете обнаружить что нужный порт уже занят (слушается) другой программой (процессом). Разберемся, как определить какая программ прослушивает определенный TCP или UDP порт в Windows.
Например, вы не можете запустить сайт IIS на стандартном 80 порту в Windows, т.к. этот порт сейчас занят (при запуске нескольких сайтов в IIS вы можете запускать их на одном или на разных портах). Как найти службу или процесс, который занял этот порт и завершить его?
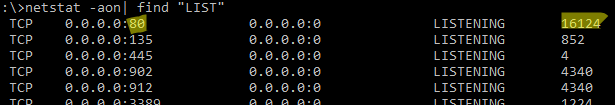
Чтобы вывести полный список TCP и UDP портов, которые прослушиваются вашим компьютером, выполните команду:
netstat -aon| find "LIST"
Или вы можете сразу указать искомый номер порта:
netstat -aon | findstr ":80" | findstr "LISTENING"
Используемые параметры команды netstat:
- a – показывать сетевые подключения и открытые порты
- o – выводить идентфикатор професса (PID) для каждого подключения
- n – показывать адреса и номера портов в числовом форматер
По выводу данной команды вы можете определить, что 80 порт TCP прослушивается (статус
LISTENING
) процессом с PID 16124.
Вы можете определить исполняемый exe файл процесса с этим PID с помощью Task Manager или с помощью команды:
tasklist /FI "PID eq 16124"
Можно заменить все указанные выше команды одной:
for /f "tokens=5" %a in ('netstat -aon ^| findstr :80') do tasklist /FI "PID eq %a"
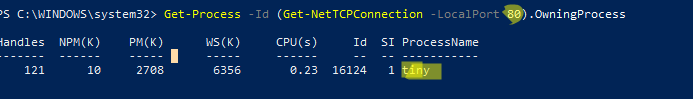
С помощью однострочной PowerShell команды можно сразу получить имя процесса, который прослушивает:
- TCP порт:
Get-Process -Id (Get-NetTCPConnection -LocalPort 80).OwningProcess - UDP порт:
Get-Process -Id (Get-NetUDPEndpoint -LocalPort 53).OwningProcess
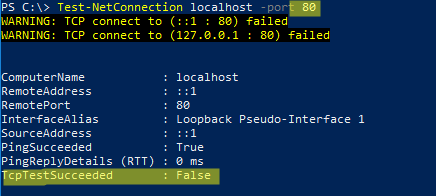
Можно сразу завершить этот процесс, отправив результаты через pipe в командлет Stop-Process:
Get-Process -Id (Get-NetTCPConnection -LocalPort 80).OwningProcess| Stop-Process
Проверьте, что порт 80 теперь свободен:
Test-NetConnection localhost -port 80
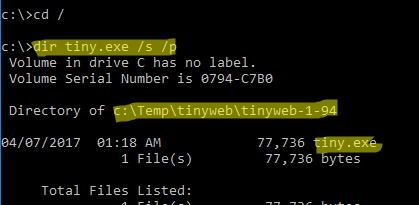
Чтобы быстрой найти путь к исполняемому файлу процесса в Windows, используйте команды:
cd /
dir tiny.exe /s /p
Или можно для поиска файла использовать встроенную команду where :
where /R C:\ tiny
В нашем случае мы нашли, что исполняемый файл
tiny.exe
(легкий HTTP сервер), который слушает 80 порт, находится в каталоге c:\Temp\tinyweb\tinyweb-1-94
Содержание статьи:
- Типовые задачи и их решение
- Вариант 1: смотрим список прослушиваемых портов + приложение (общий случай)
- Вариант 2: а если наоборот — по названию приложения узнать порт
- Вариант 3: исп-ем спец. приложения (более информативнее и быстрее)
- Вопросы и ответы: 0
Доброго времени!
При запуске некоторого ПО/сервисов можно столкнуться с тем, что определенный порт в системе уже занят… какой-нибудь другой программой (скажем, настраиваете вы апач — и возникает конфликт порта 80. Например, на нем может «висеть/слушать» Skype…). Незадача…?
Собственно, в заметке приведу неск. способов, как можно относительно быстро узнать «кем» и «чем» заняты определенные порты — а это позволит быстро изменить их настройки и разрешить вопрос! (разумеется, приводить советы посмотреть описание установленного софта, в котором разработчики указывают порты — я не буду: ибо это долго, и не всегда продуктивно… 🙂).
*
Примечание:
- заметка носит информативный характер, и не явл. инструкцией в последней инстанции. Дело в том, что нередко встречаются не офиц. резервируемые порты… и, разумеется, точности здесь никакой быть не может;
- если у вас не получается подключиться к сетевым играм, есть проблемы с раздачей/загрузкой торрентов и пр. — ознакомьтесь с заметкой про проброс портов на роутере (это немного не по теме, но когда речь заходит об этом — очень часто приходится ссылаться на сию заметку).
*
Типовые задачи и их решение
Вариант 1: смотрим список прослушиваемых портов + приложение (общий случай)
По умолчанию в Windows есть консольная утилита netstat. Она позволяет посмотреть активные соединения протокола TCP/IP (в т.ч. там есть и порты).
*
Чтобы вывести полный список портов (TCP, UDP) нужно:
1) Запустить 📌командную строку от имени администратора.
2) Ввести команду Netstat –ao и нажать Enter.
(можно ее слегка изменить и использовать такую: netstat -aon| find «LISTENING»)
Примечание:
- «-a» – см. все соединения и порты.
- «-o» – см. числовые идентификаторы процесса, отвечающего за конкретное соединение (Process ID, сокращенно: PID).
- «-n» – см. номера портов в числовом формате»;
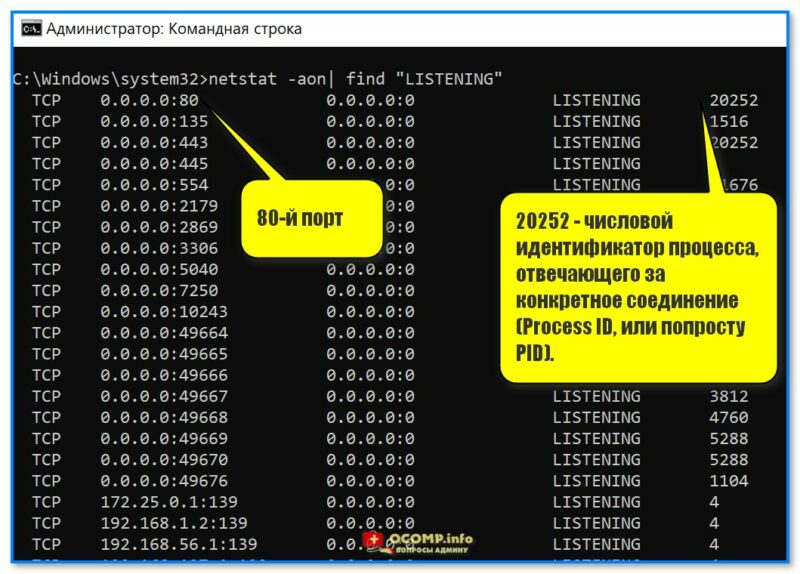
Где тут порт и идентификатор, см. скрин, я выделил // пример работы с командной строкой, команда netstat
📌 Для справки!
В списке, который предоставит нам команда Netstat, есть строки с аббревиатурами: «ESTABLISHED» и «LISTENING». В чем разница:
- «ESTABLISHED» — означает, что в данный момент установлено соединение;
- «LISTENING» — означает, что сокет ожидает соединения (в режиме прослушивания).
Причем, и тот и другой порты открыты, но один ожидает соединения, а другой уже установил соединение!
Например, протокол HTTP (это порт 80-й) находится в режиме прослушивания («LISTENING») до тех пор, пока кто-нибудь не зайдет на сервер. В тот момент, когда кто-нибудь будет загружать страницу — режим поменяется на «ESTABLISHED».
3) Например, понадобилось нам узнать какой процесс занял порт с идентификатором (PID) «5288» — вводим в командной строке tasklist | find «5288» и нажимаем Enter;
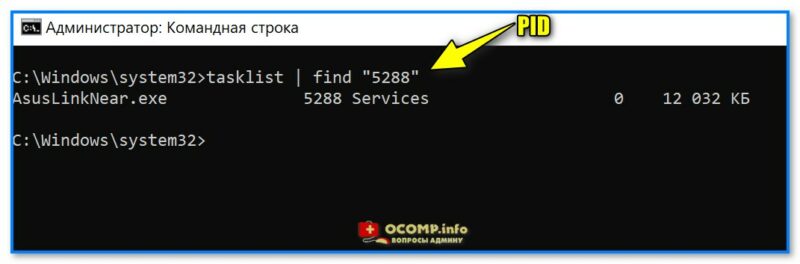
Вводим PID и смотрим название процесса
4) Почти сразу же узнаем, что это фирменная утилита от производителя ноутбука ASUS (шла вместе с операционной системой Windows // инсталлируется автоматически при установке драйверов).
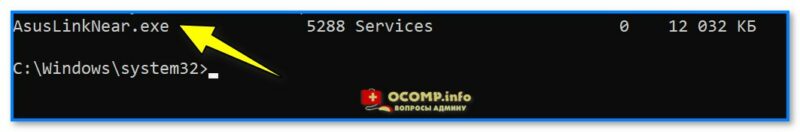
Asus
5) Кстати, если вам неудобно пользоваться командной строкой — то узнать название процесса и его расположение по PID можно в 📌диспетчере задач (Ctrl+Alt+Del): достаточно перейти во вкладку «Подробности».👇
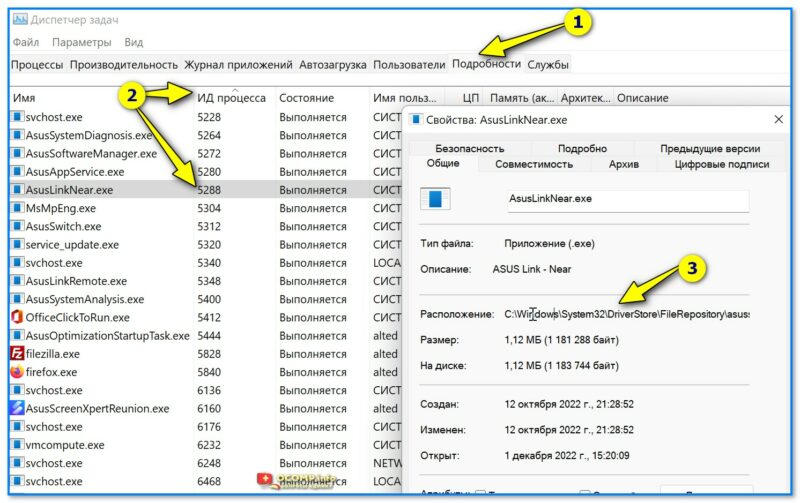
Диспетчер задач — подробности — сортировка по ИД процессу
*
Вариант 2: а если наоборот — по названию приложения узнать порт
Относительно просто!
Находим нужный процесс в 📌диспетчере задач (вкладка «Подробности» для Windows 11). Узнаем его ИД (в моем случае 6216, взял для примера uTorrent).
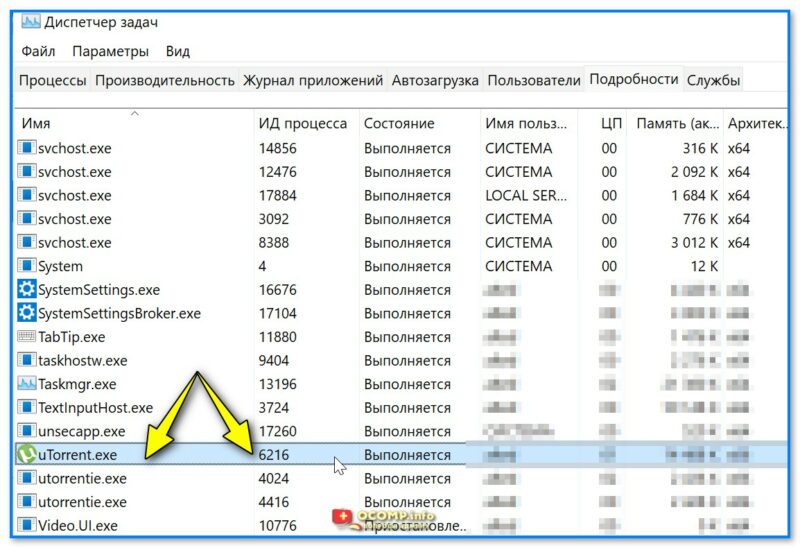
uTorrent — ИД 6216
Далее в комодной строке набираем следующее:
netstat -aon| find «6216»
где вместо «6216» нужно указать свой ИД.
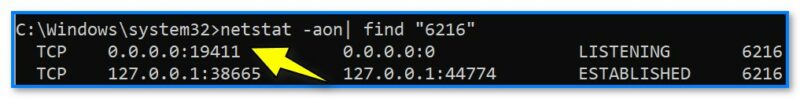
19411 порт, используемый uTorrent
В результате определяем, что uTorrent слушает порт 19411…
Кстати, в настройках uTorrent (если запустить саму программу) — можно тоже узнать и изменить этот порт на какой-нибудь другой.
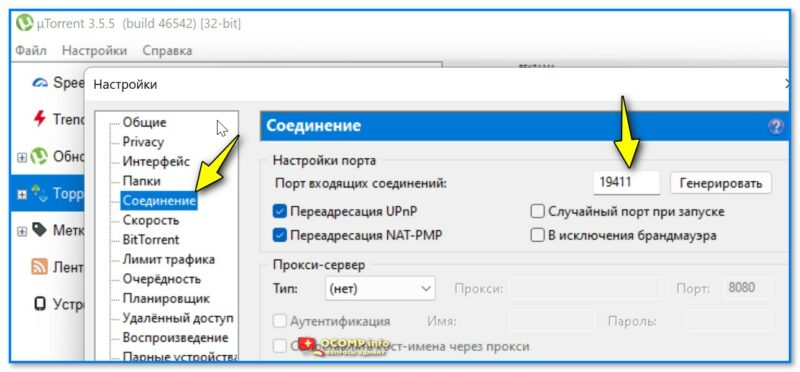
Настройки uTorrent — выбор порта
*
Вариант 3: исп-ем спец. приложения (более информативнее и быстрее)
📌 TCPView
Ссылка на сайт Microsoft: https://learn.microsoft.com/ru-ru/sysinternals/downloads/tcpview
TCPView — небольшая спец. утилита (не требующая установки), позволяющая очень быстро узнать список всех сетевых соединений, с информацией о портах, IP-адресах и пр.
Причем, список можно отсортировать по нужному вам столбцу + отфильтровать по какой-нибудь аббревиатуре. В общем, вещи удобная! См. скрин ниже. 👇
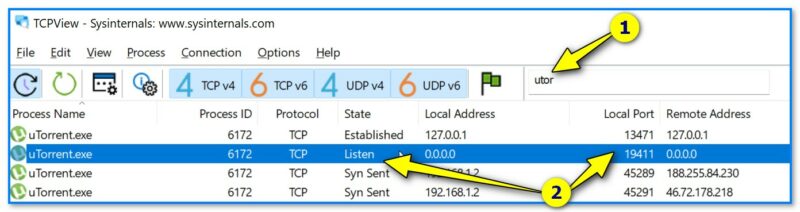
TCPView — список приложений, смотрим все необходимые свойства
📌 CurrPorts
Ссылка на офиц. сайт: https://www.nirsoft.net/utils/cports.html#DownloadLinks
CurrPorts — еще одна сетевая утилита для просмотра сетевых подкл. В установке программа не нуждается, по информативности не уступает первой. Кстати, у утилиты есть рус. перевод (но скачать его нужно отдельно, есть на офиц. сайте).
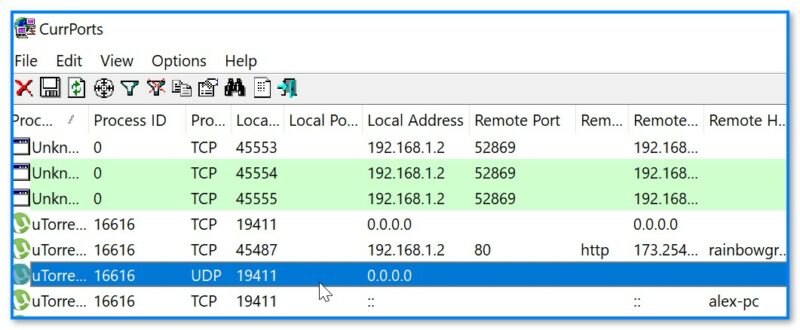
CurrPorts — пример использования
*
Дополнения по теме — приветствуются!
Успехов!
👋
In Windows, every software or tool typically has one or multiple processes with dependencies. For instance, if you have installed Apache Tomcat on Windows and started the server, it usually listens on port 8080 by default.
However, issues may arise if another process is already using the same port. In such cases, you might encounter an error message like 8080 is already in use. Please try different ports.
This post covers various methods to check process IDs and obtain details for a given port.
Using the netstat Command to Retrieve Process ID
The netstat command lists all processes, connection types, process IDs, and hostnames.
The following information is displayed:
- Protocol (TCP or UDP)
- Local address
- Foreign address
- State (e.g., LISTENING, ESTABLISHED, TIME_WAIT)
- Process ID
Here is an example command to retrieve the process ID and protocol type
To filter data for a specific port, you can use the findStr function with a pipe symbol:
If you know the process ID, you can use the tasklist command to identify the process name
The following find out process id is using which port
Finding Process Name and ID Using PowerShell in Windows
PowerShell is a powerful command-line tool for obtaining process details. The following commands showcase its capabilities
To find the process name for a given port
To find the process ID for a given port number
These PowerShell commands provide information about the process associated with the specified port, including details such as handles, memory usage, and the process name.
By using these commands, you can efficiently list all processes information associated with specific ports on a Windows system.
In computing, netstat is a command-line network utility that displays open network sockets, routing tables, and a number of network interface (network interface controller or software-defined network interface) and network protocol statistics. It is available on Unix, Plan 9, Inferno, and Unix-like operating systems including macOS, Linux, Solaris and BSD. It is also available on IBM OS/2 and on Microsoft Windows NT-based operating systems including Windows XP, Windows Vista, Windows 7, Windows 8 and Windows 10.
netstat
|
The |
|
| Developer(s) | Various open-source and commercial developers |
|---|---|
| Initial release | 1983; 42 years ago |
| Written in | Plan 9: C |
| Operating system | Unix, Unix-like, Plan 9, Inferno, OS/2, Microsoft Windows, ReactOS |
| Platform | Cross-platform |
| Type | Command |
| License | OS/2, Windows: Proprietary commercial software net-tools, ReactOS: GPLv2 Plan 9: MIT License |
It is used for finding problems in the network and to determine the amount of traffic on the network as a performance measurement.[1] On Linux this program is mostly obsolete, although still included in many distributions.
On Linux, netstat (part of «net-tools») is superseded by ss (part of iproute2). The replacement for netstat -r is ip route, the replacement for netstat -i is ip -s link, and the replacement for netstat -g is ip maddr, all of which are recommended instead.[2][3][4][5]
Netstat provides statistics for the following:
- Proto – The name of the protocol (TCP, UDP, etc.). On some systems, the protocol name may be followed by «4» or «6», depending on whether the protocol is running over IPv4 or IPv6.
- Local Address – The IP address of the local computer and the port number being used. The name of the local computer that corresponds to the IP address and the name of the port is shown unless the
-nparameter is specified. An asterisk (*) is shown for the host if the server is listening on all interfaces. If the port is not yet established, the port number is shown as an asterisk. - Foreign Address – The IP address and port number of the remote computer to which the socket is connected. The names that corresponds to the IP address and the port are shown unless the
-nparameter is specified. If the port is not yet established, the port number is shown as an asterisk (*). - State – Indicates the state of a TCP connection. The possible states are as follows: CLOSE_WAIT, CLOSED, ESTABLISHED, FIN_WAIT_1, FIN_WAIT_2, LAST_ACK, LISTEN, SYN_RECEIVED, SYN_SEND, and TIME_WAIT. For more information about the states of a TCP connection, see RFC 793.
Parameters used with this command must be prefixed with a hyphen (—) rather than a slash (/). Some parameters are not supported on all platforms.
| Name | Description | Windows | ReactOS | macOS | BSD | NetBSD | FreeBSD | Linux | Solaris | OS/2 |
|---|---|---|---|---|---|---|---|---|---|---|
| -a | Displays all active connections and the TCP and UDP ports on which the computer is listening. | Yes | Yes | Yes | Yes | Yes | Yes | |||
| -b | Displays the binary (executable) program’s name involved in creating each connection or listening port. (Windows XP, Windows Server 2003 and newer Windows operating systems; not Microsoft Windows 2000 or older). | Yes | No | No | ||||||
| -b | Causes -i to report the total number of bytes of traffic. | No | Yes | Yes | No | |||||
| -e | Displays ethernet statistics, such as the number of bytes and packets sent and received. This parameter can be combined with -s. | Yes | Yes | No | ||||||
| -f | Displays fully qualified domain names <FQDN> for foreign addresses (only available on Windows Vista and newer operating systems). | Yes | No | No | ||||||
| -f Address Family | Limits display to a particular socket address family, unix, inet, inet6 | No | Yes | No | ||||||
| -g | Displays multicast group membership information for both IPv4 and IPv6 (may only be available on newer operating systems) | No | No | Yes | ||||||
| -i | Displays network interfaces and their statistics | No | No | Yes | Yes | Yes | Yes | Yes | ||
| -m | Displays the memory statistics for the networking code (STREAMS statistics on Solaris). | No | No | Yes | Yes | Yes | Yes | Yes | ||
| -n | Displays active TCP connections, however, addresses and port numbers are expressed numerically and no attempt is made to determine names. | Yes | Yes | Yes | Yes | Yes | Yes | Yes | Yes | |
| -o | Displays active TCP connections and includes the process id (PID) for each connection. You can find the application based on the PID in the Processes tab in Windows Task Manager. This parameter can be combined with -a, -n, and -p. This parameter is available on Microsoft Windows XP, Windows Server 2003, and Windows 2000 if a hotfix is applied.[6] | Yes | No | No | ||||||
| -p protocol | Shows connections for the protocol specified by protocol. In this case, protocol can be tcp, udp, tcpv6, or udpv6. If this parameter is used with -s to display statistics by protocol, protocol can be tcp, udp, icmp, ip, tcpv6, udpv6, icmpv6, or ipv6. | Yes | Yes | Yes | Yes | Yes | Yes | |||
| -p | Show which processes are using which sockets (similar to -b under Windows) (you must be root to do this) | No | No | Yes | ||||||
| -P protocol | Shows connections for the protocol specified by protocol. In this case, protocol can be ip, ipv6, icmp, icmpv6, igmp, udp, tcp, or rawip. | No | No | Yes | ||||||
| -r | Displays the contents of the IP routing table. (This is equivalent to the route print command under Windows.) | Yes | Yes | Yes | Yes | Yes | Yes | Yes | Yes | Yes |
| -s | Displays statistics by protocol. By default, statistics are shown for the TCP, UDP, ICMP, and IP protocols. If the IPv6 protocol for Windows XP is installed, statistics are shown for the TCP over IPv6, UDP over IPv6, ICMPv6, and IPv6 protocols. The -p parameter can be used to specify a set of protocols. | Yes | Yes | Yes | Yes | Yes | Yes | Yes | Yes | |
| -t | Display only TCP connections. | No | Yes | Yes | ||||||
| -u | Display only UDP connections. | No | No | Yes | Yes | |||||
| -W | Display wide output — doesn’t truncate hostnames or IPv6 addresses | No | No | Yes | No | |||||
| -x | Displays NetworkDirect connections, listeners, and shared endpoints. | Yes | ||||||||
| -y | Displays the TCP connection template for all connections.Cannot be combined with the other options. | Yes | ||||||||
| -v | When used in conjunction with -b it will display the sequence of components involved in creating the connection or listening port for all executables. | Yes | No | No | ||||||
| Interval | Redisplays the selected information every Interval seconds. Press CTRL+C to stop the redisplay. If this parameter is omitted, netstat prints the selected information only once. | Yes | Yes | No | ||||||
| -h | Displays help at the command prompt. | Yes | No | Yes | Yes | Yes | Yes | Yes | Yes | No |
| -? | Displays help at the command prompt. | Yes | No | No | No | No | No | No | No | Yes |
| /? | Displays help at the command prompt. | Yes | Yes | No | No | No | No | No | No | No |
On macOS, BSD systems, Linux distributions, and Microsoft Windows:
To display the statistics for only the TCP or UDP protocols, type one of the following commands:
netstat -sp tcp
netstat -sp udp
On Unix-like systems:
To display all ports open by a process with id pid:
netstat -aop | grep "pid"
To continuously display open TCP and UDP connections numerically and also which program is using them on Linux:
netstat -nutpacw
On Microsoft Windows:
To display active TCP connections and the process IDs every 5 seconds, type the following command (works on NT based systems only, or Windows 2000 with hotfix):
netstat -o 5
To display active TCP connections and the process IDs using numerical form, type the following command (works on NT based systems only, or Windows 2000 with hotfix):
netstat -no
| Command | Explanation |
|---|---|
netstat -a |
Shows all sockets, both listening and non-listening, all protocols like TCP, UDP etc. |
netstat -at |
Shows only TCP connections (-au shows only UDP connections) |
netstat -ant |
Shows all TCP connections with no DNS resolution (show IP addresses instead). |
netstat -al |
Shows only listening sockets. |
netstat -aep |
Also show PID and to which program each socket belongs, e adds extra info like the user. Run as root to see all PIDs. |
netstat -s |
Shows network statistics. |
netstat -r |
Shows kernel routing information. This is the same output as route -e. |
netstat -i |
Displays a table of all network interfaces. Add -e to get output similar to ifconfig. |
netstat -ct |
Displays TCP connections continuously. |
netstat -g
|
Display multicast group membership information for IPv4 and IPv6. |
netstat -lntu
|
Display all services listening for TCP and UDP, all free open ports on the local machine. |
netstat -atnp | grep ESTA
|
Displays all currently «established» TCP connections. |
Netstat uses an asterisk * as a wildcard which means «any». An example would be
Example output:
....Local Address Foreign Address State
... *:smtp          *:*   LISTEN
Under «Local Address» *, in *:smtp, means the process is listening on all of the network interfaces the machine has for the port mapped as smtp (see /etc/services for service resolution). This can also be shown as 0.0.0.0.
The first *, in *:*, means connections can come from any IP address, and the second *, in *:*, means the connection can originate from any port on the remote machine.
Some versions of netstat lack explicit field delimiters in their printf-generated output, leading to numeric fields running together and thus corrupting the output data.
netstat commandnetstat commandUnder Linux, raw data can often be obtained from the /proc/net/dev to work around the printf output corruption arising in netstat’s network interface statistics summary, netstat -i, until such time as the problem is corrected.[citation needed]
On the Windows platform, netstat information can be retrieved by calling the GetTcpTable and GetUdpTable functions in the IP Helper API, or IPHLPAPI.DLL. Information returned includes local and remote IP addresses, local and remote ports, and (for GetTcpTable) TCP status codes. In addition to the command-line netstat.exe tool that ships with Windows, GUI-based netstat programs are available.
On the Windows platform, this command is available only if the Internet Protocol (TCP/IP) protocol is installed as a component in the properties of a network adapter in Network Connections.
On the Windows platform running Remote Desktop Services (formerly Terminal Services) it will only show connections for the current user, not for the whole computer.
On macOS, the /System/Library/CoreServices/Applications folder (or /Applications/Utilities in OS X Mountain Lion and earlier) contains a network GUI utility called Network Utility, the Netstat tab of which runs the netstat command and displays its output in the tab.
- ss, a Linux utility to investigate sockets from iproute2 meant to replace netstat
- lsof -i
- bmon
- ^ «IBM Systems Information Center». ibm.com. 8 May 2007.
- ^ «net-tools». linuxfoundation.org. Archived from the original on 2016-06-11. Retrieved 2014-08-02.
- ^ «Arch Linux». archlinux.org. 8 June 2011.
- ^ «Deprecated Linux networking commands and their replacements». Doug Vitale Tech Blog. 21 December 2011.
- ^ «netstat man page (notes section)». Retrieved 2 August 2014.
This program is obsolete. Replacement for netstat is ss. Replacement for netstat -r is ip route. Replacement for netstat -i is ip -s link. Replacement for netstat -g is ip maddr.
- ^ «The netstat command can now display process IDs that correspond to active TCP or UDP connections in Windows 2000». Archived from the original on 24 August 2007.
- Dyson, Peter (1995). Mastering OS/2 Warp. Sybex. ISBN 978-0782116632.
- Stanek, William R. (2008). Windows Command-Line Administrator’s Pocket Consultant, 2nd Edition. Microsoft Press. ISBN 978-0735622623.
netstat(8)– Linux Programmer’s Manual – Administration and Privileged Commandsnetstat(1)– FreeBSD General Commands Manualnetstat(8)– Solaris 11.4 System Administration Commands Reference Manualnetstat(1)– Inferno General commands Manual- Microsoft TechNet: Netstat – documentation for the Windows netstat.exe command-line program
- net-tools project page on SourceForge
- Netstat Command: WindowsCMD.com Archived 2022-01-11 at the Wayback Machine
(Image credit: Future)
On Windows 11, the Network Statistics (netstat) tool has been around for a long time (including on Windows 10 and older versions), and it’s a command-line utility you can use in Command Prompt to display statistics for all network connections. It allows you to understand open and connected ports to monitor and troubleshoot networking problems for systems or apps.
The tool helps you to list active network (incoming and outgoing) connections and listening ports. You can view network adapter statistics and statistics for protocols (such as IPv4 and IPv6). You can even display the current routing table and much more.
In this how-to guide, I’ll show you the steps to use the netstat command to examine connections to discover open and connected network ports on Windows 11 (and 10).
How to use netstat on Windows 11 and 10
In the client version of Windows, you can get started with the Network Statistics tool with a simple command, but then you have a lot of options to view different network activities, and here’s how.
Netstats basics
To get started with netstat, use these steps:
- Open Start.
- Search for Command Prompt, right-click the top result, and select the Run as administrator option.
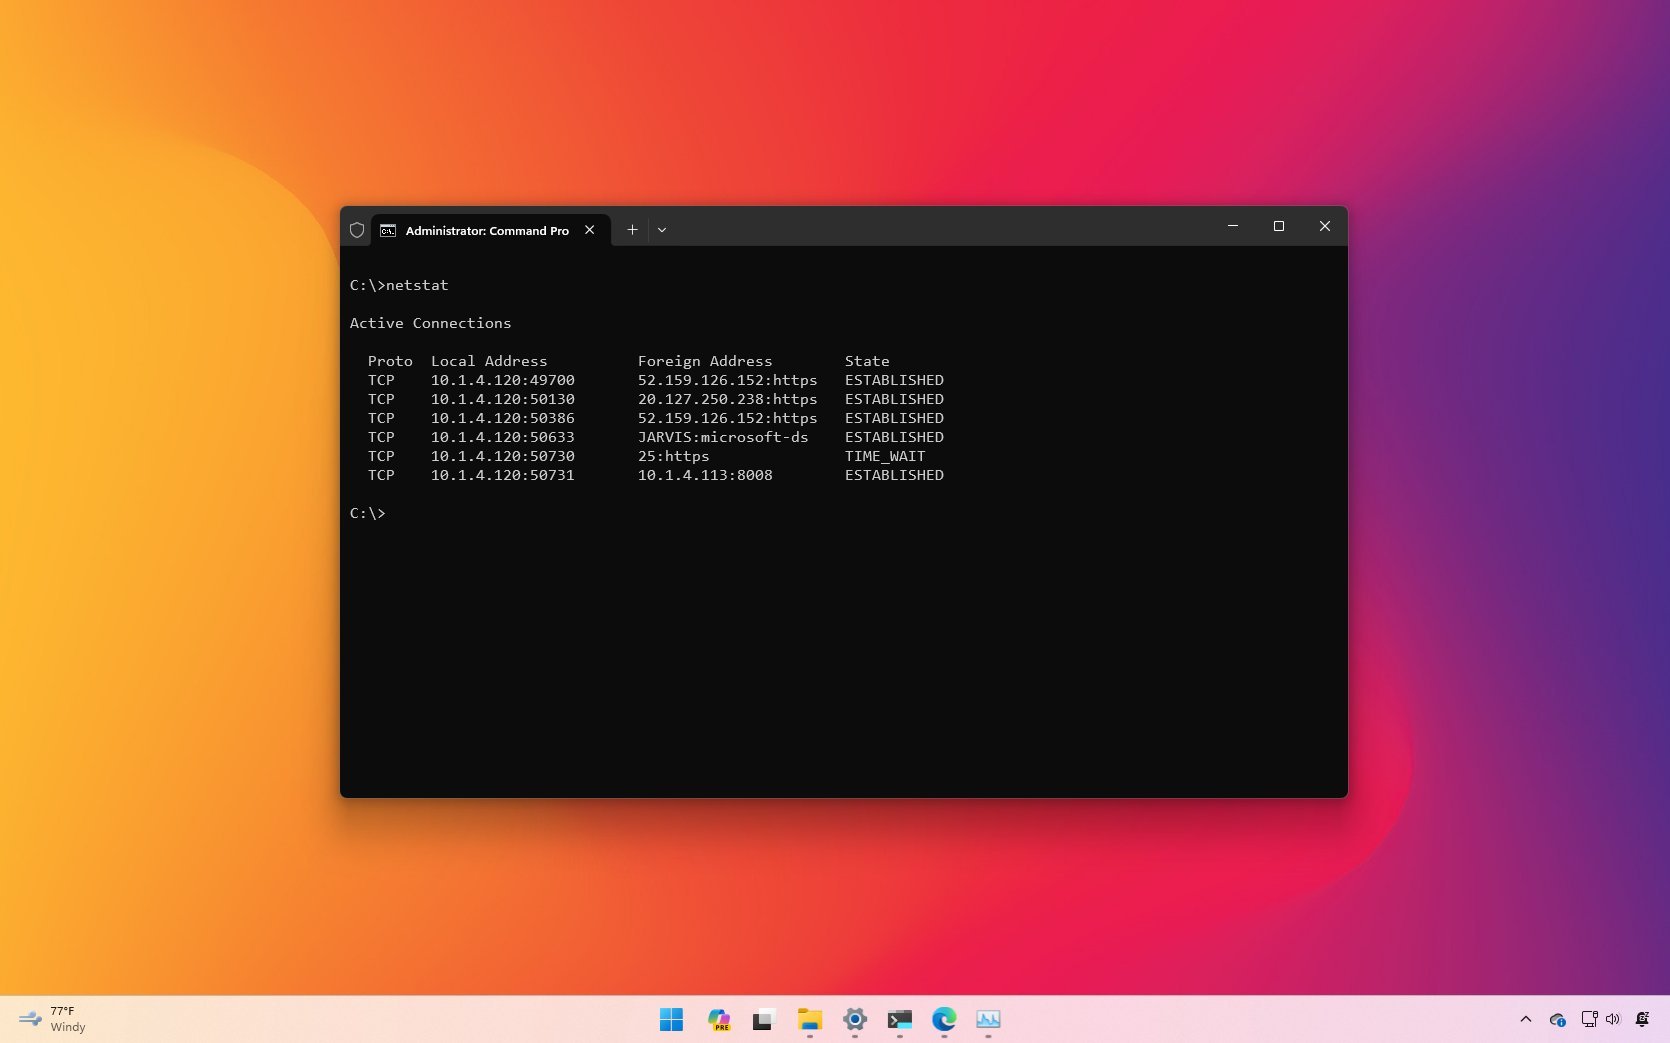
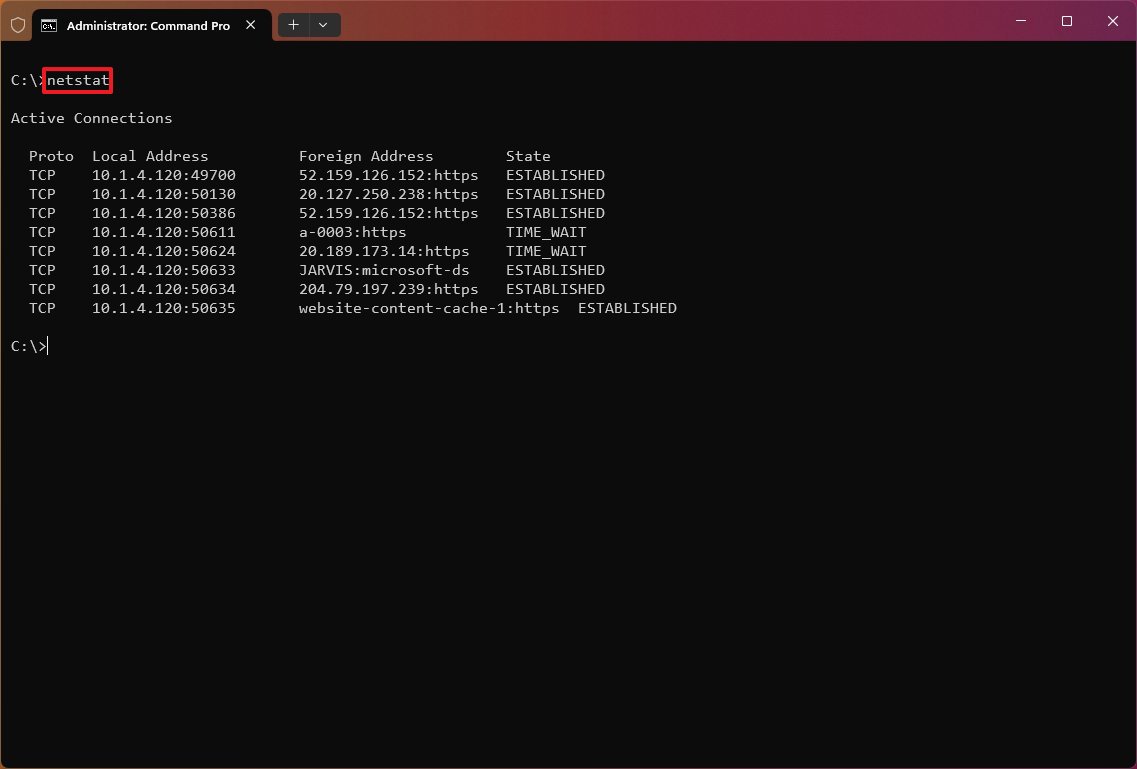
- Type the following command to show all active TCP connections and press Enter: netstat
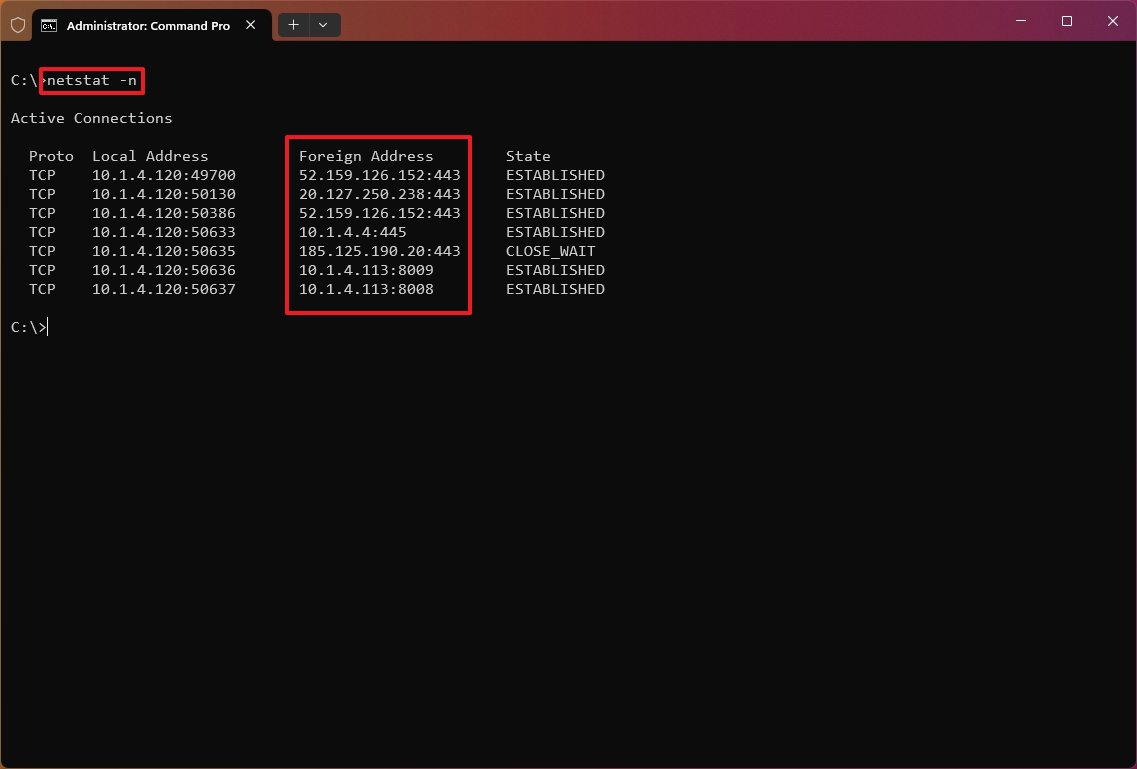
- (Optional) Type the following command to display active connections showing numeric IP address and port number instead of trying to determine the names and press Enter: netstat -n
- (Optional) Type the following command to refresh the information at a specific interval and press Enter: netstat -n INTERVAL
In the command, replace «INTERVAL» with the number (in seconds) to re-display the information. This example refreshes the command in question every five seconds: netstat -n 5
- Quick note: When using the interval parameter, you can terminate the command using the «Ctrl + C» keyboard shortcut.
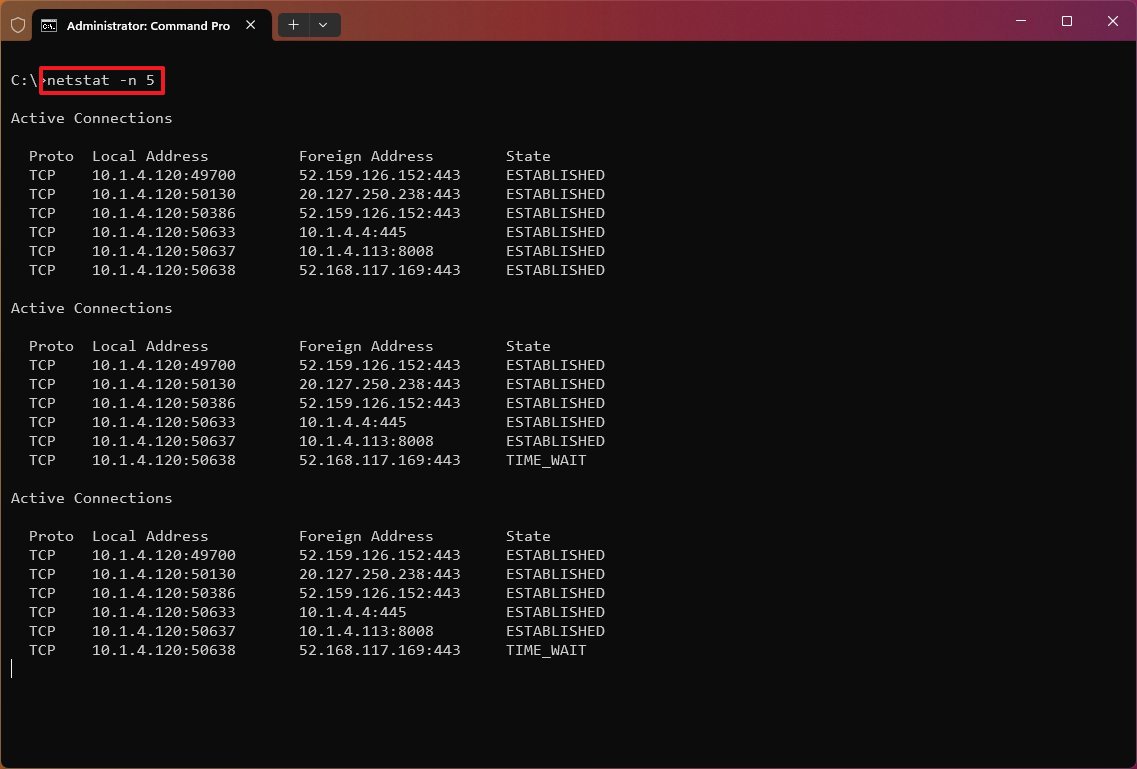
Once you execute the command, it’ll return a list of all active connections in four columns, including:
All the latest news, reviews, and guides for Windows and Xbox diehards.
- Proto: Shows the connection protocol (TCP or UDP).
- Local Address: Shows the computer’s IP address followed by a semicolon with the port number of the connection. The double-semicolon inside brackets indicates the local IPv6 address, and «0.0.0.0» refers to the local address.
- Foreign Address: Lists the remote device’s IP (or FQDN) address with the port number after the semicolon port name (for example, HTTPS, HTTP, Microsoft-ds, and wsd).
- State: Indicates where the connection is active (established), the local port has been closed (time_wait), and the program hasn’t closed the port (close_wait). Other status include, closed, fin_wait_1, fin_wait_2, last_ack, listen, syn_received, syn_send, and timed_wait.
Netstat parameters
The tool also includes several parameters you can use to display different information about the network connections on Windows 11 (and 10).
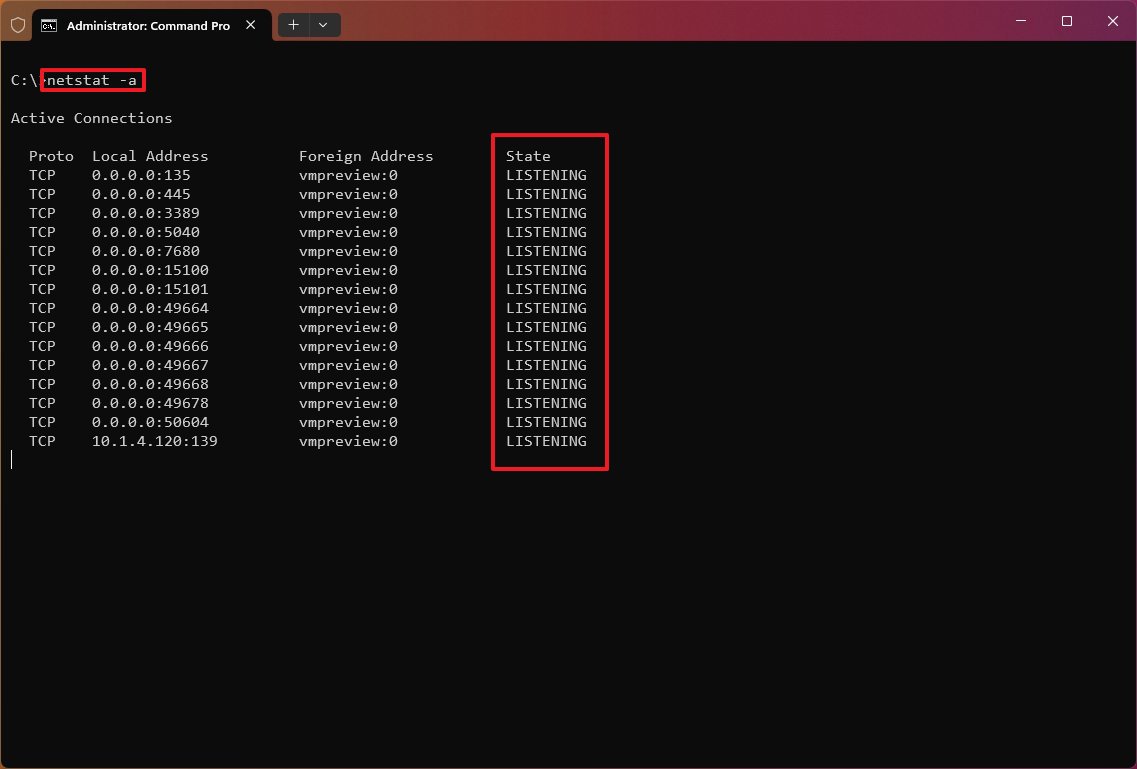
Show active and inactive connections
The «netstat -a» command displays all active and inactive connections and the TCP and UDP ports the device is currently listening to.
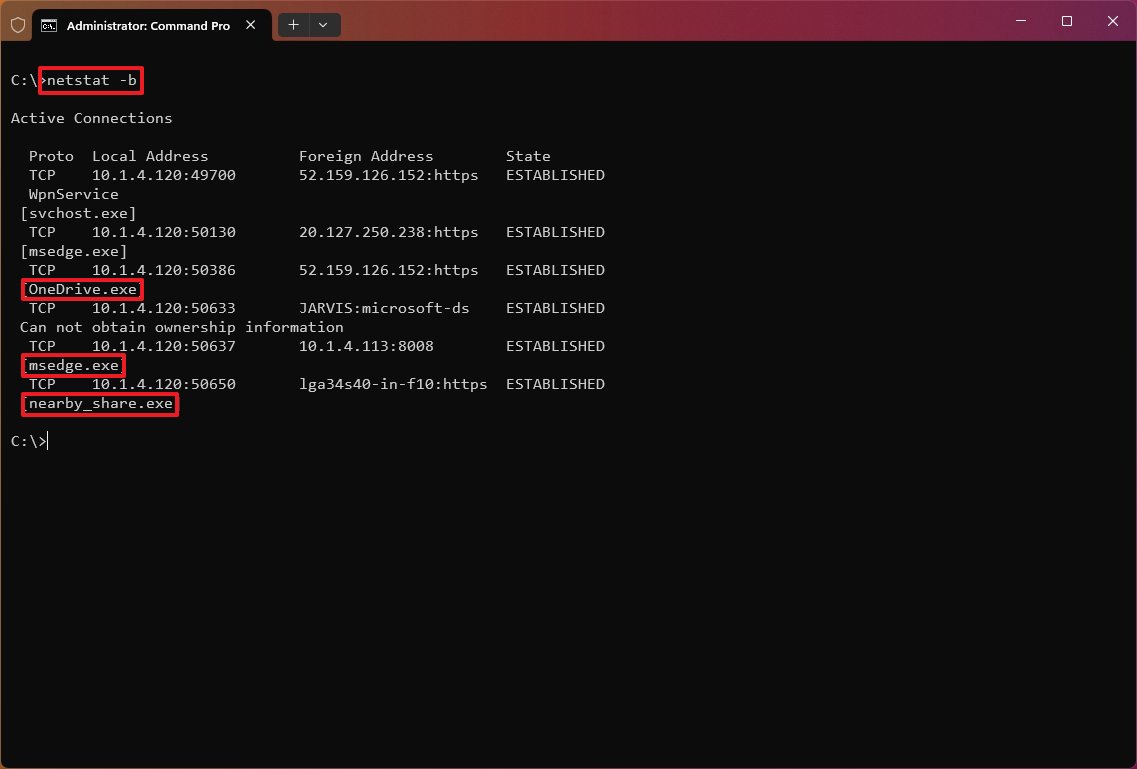
Show executable information
The «netstat -b» command lists all the executables (applications) associated with each connection. Sometimes, applications may open multiple connections.
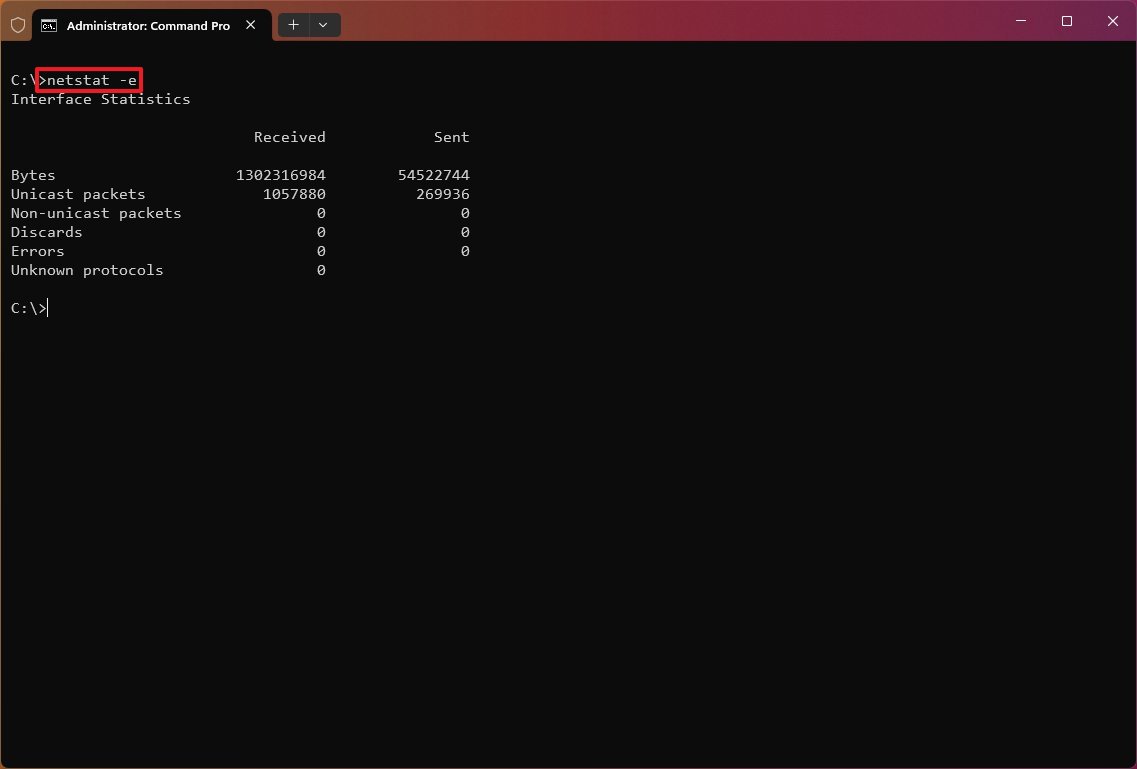
Show network adapter statistics
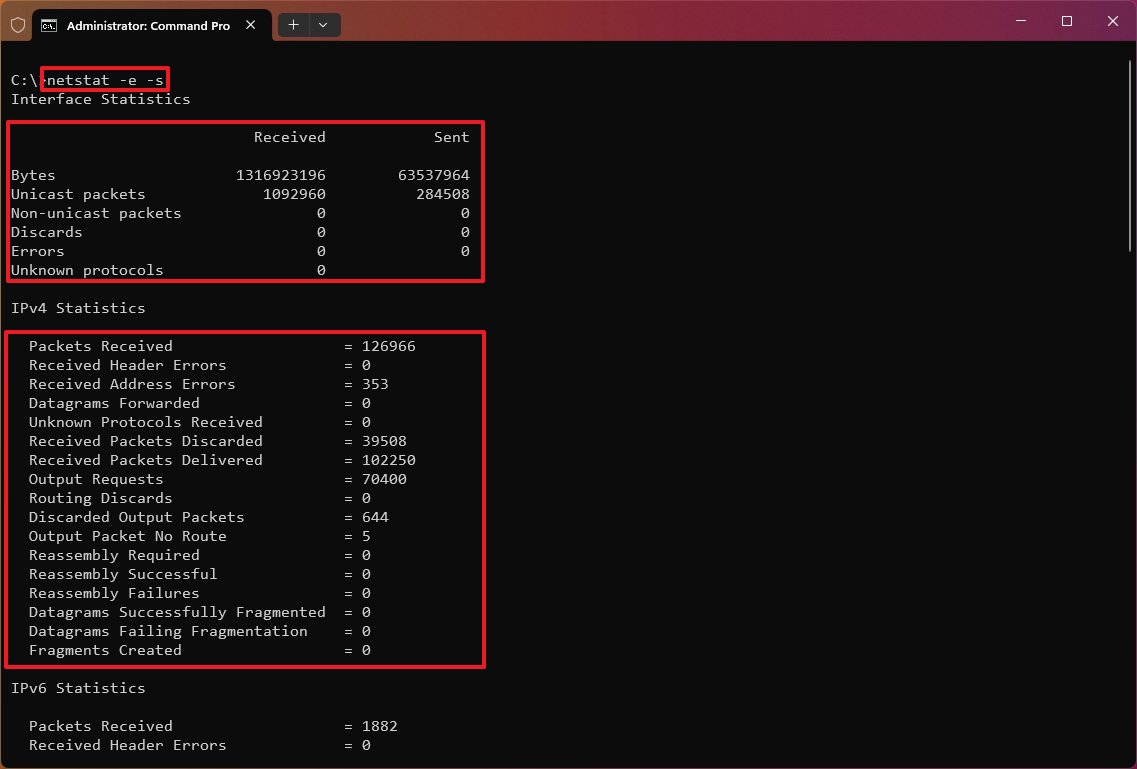
The «netstat -e» command generates a statistic of the network interface, which shows information like the number of bytes, unicast, and non-unicast sent and received packets. You can also see discarded packets, errors, and unknown protocols, which can help you troubleshoot networking problems.
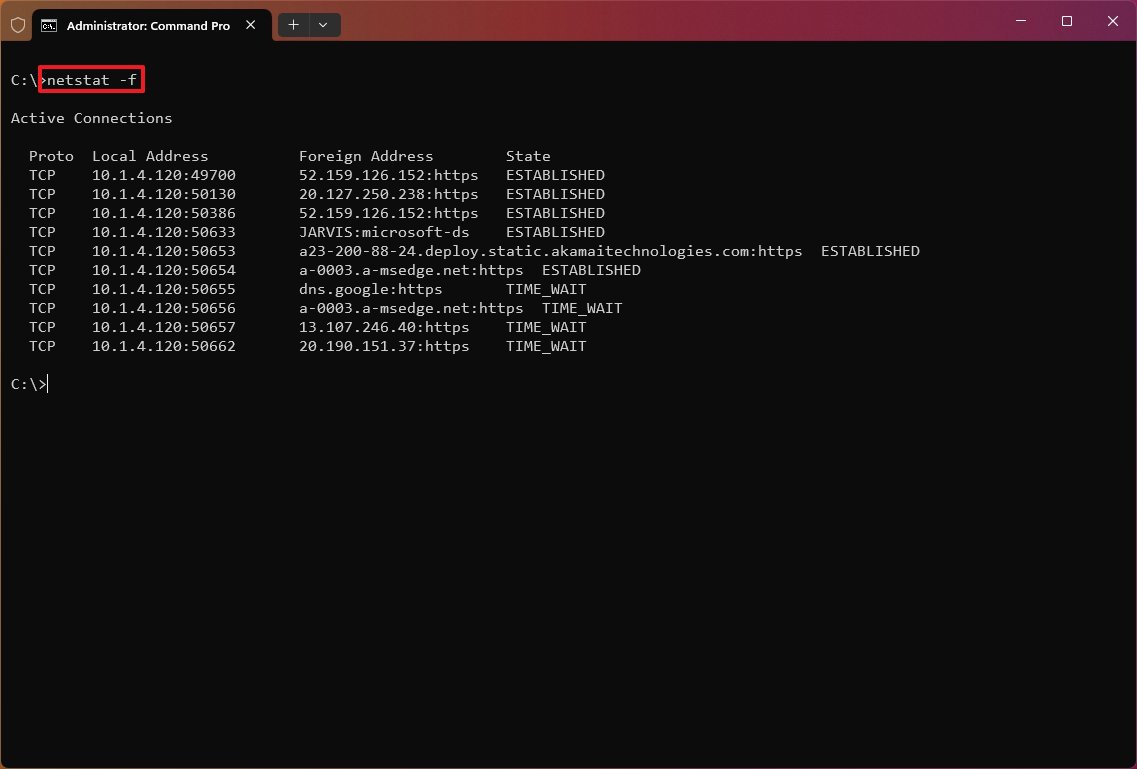
Show FQDNS for foreign addresses
The «netstat -f» command shows the fully qualified domain name (FQDN) for foreign addresses. For example, «a23-200-88-24.deploy.static.akamaitechnologies.com:https» instead of «a23-200-88-24:http» or «23.200.88.24».
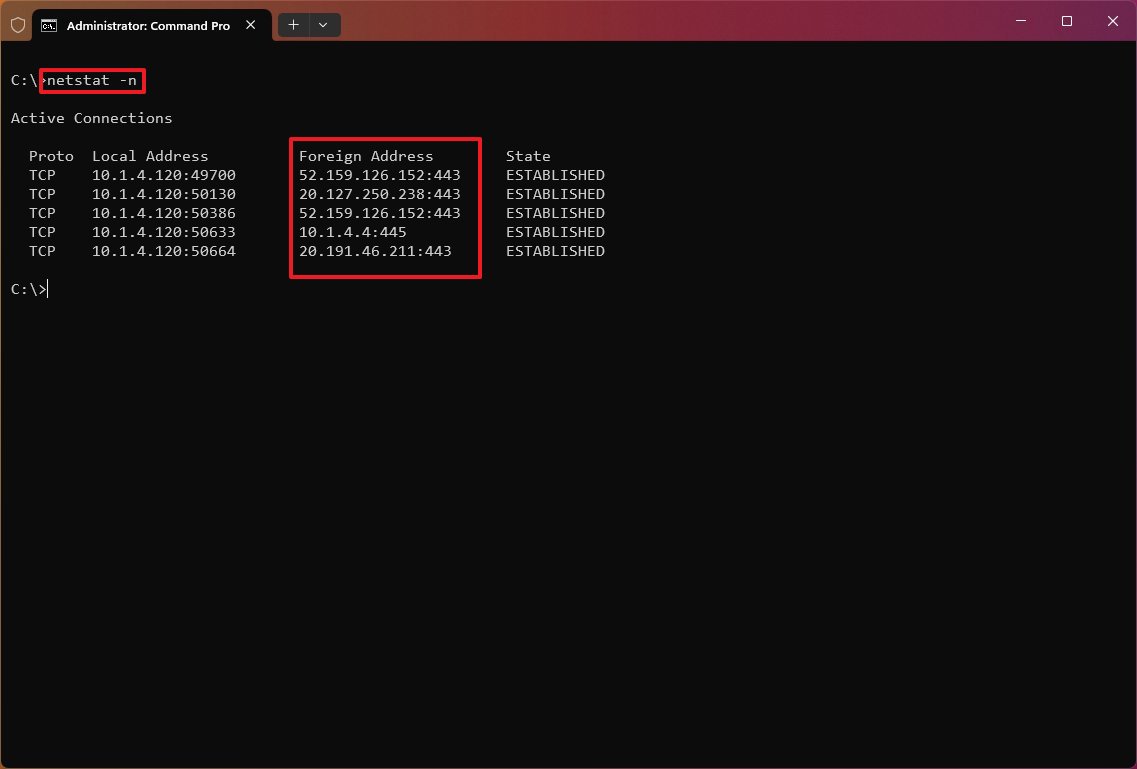
Show numerical form
The «netstat -n» command displays the addresses and ports in numerical form—for example, 52.159.126.152:443.
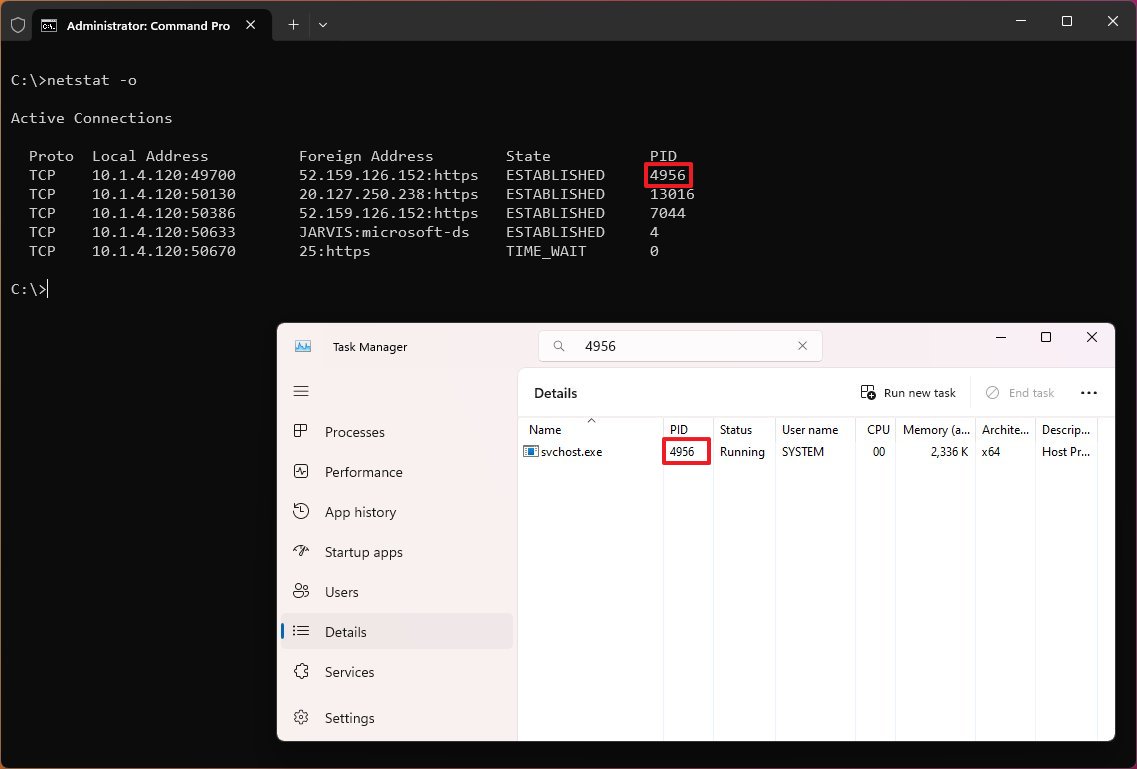
Show process ID
The «netstat -o» command shows active TCP connections like «netstat,» but with the difference that adds a fifth column to display the Process ID (PID) for each connection. The processes available in this view are the same in the «Details» tab of Task Manager, which also reveals the application using the connection.
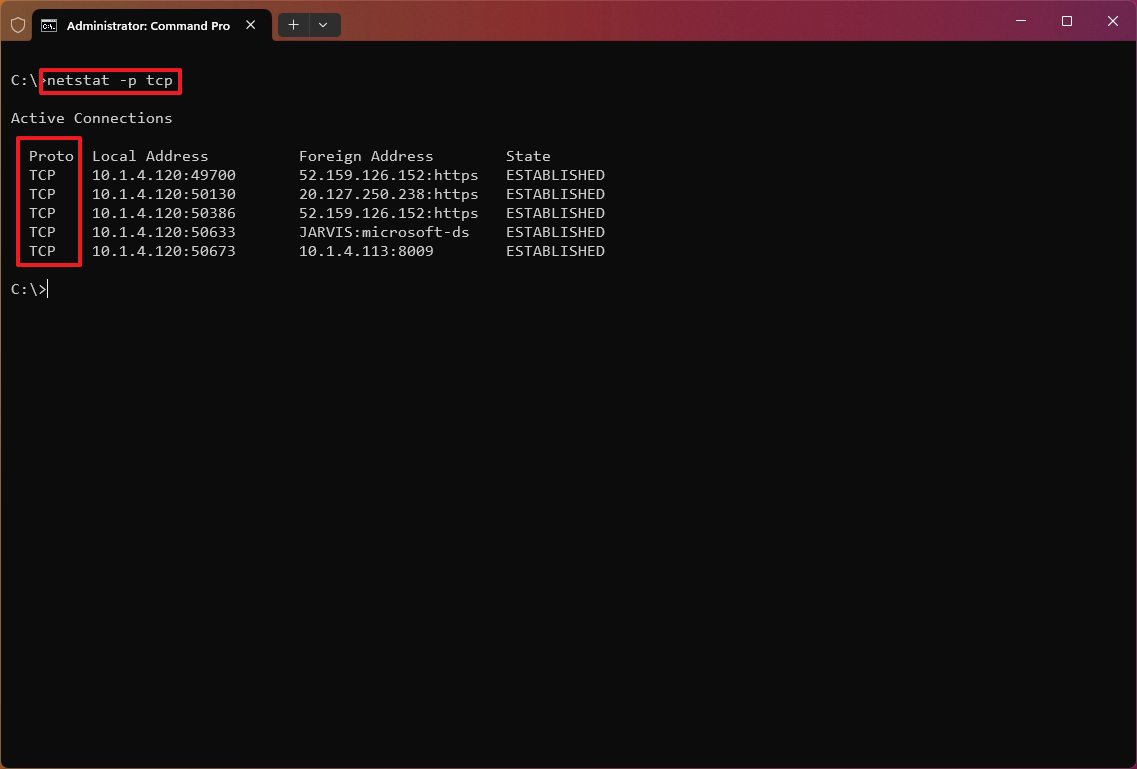
Show connections by Protocol
The «netstat -p» can be used to display connections per protocol that you have to specify using «TCP,» «UDP,» «TCPv6,» or «UDPv6» next to the command. For example, you can use the «netstat -p TCP» command to view a list of TCP connections.
Show listening and non-listening ports
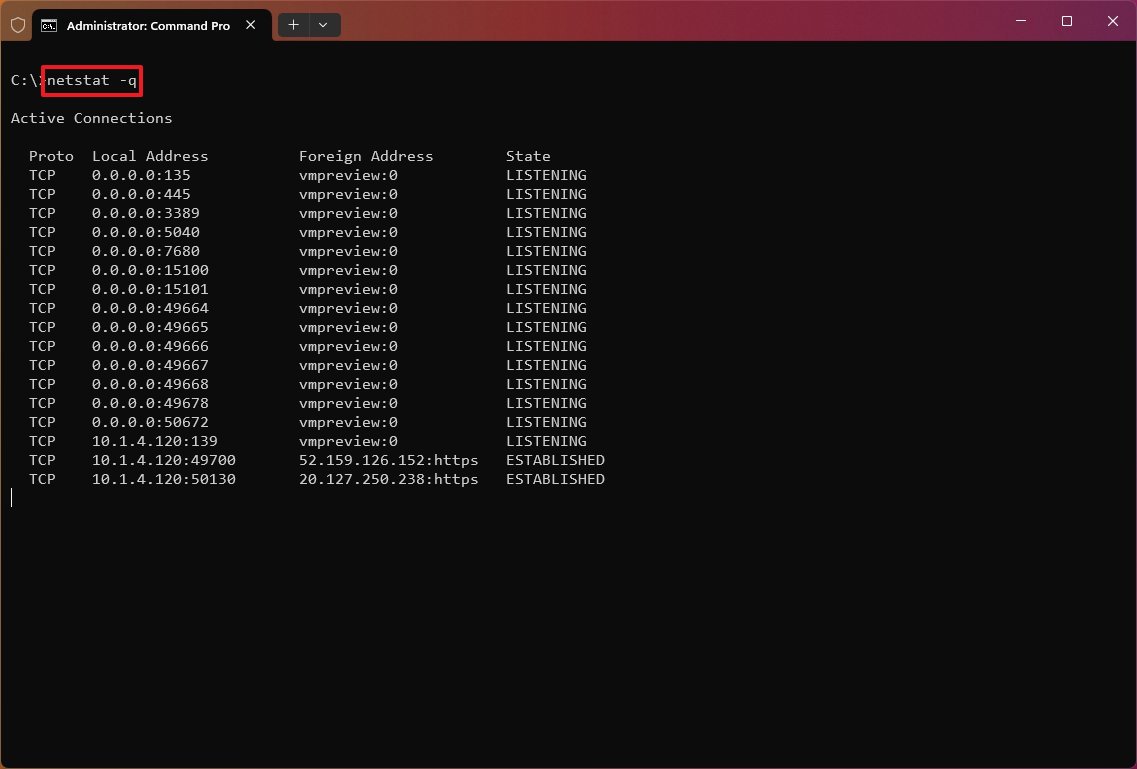
The «netstat -q» commands can produce a list of all the connections with the listening and bound non-listening ports.
Show statistics by Protocol
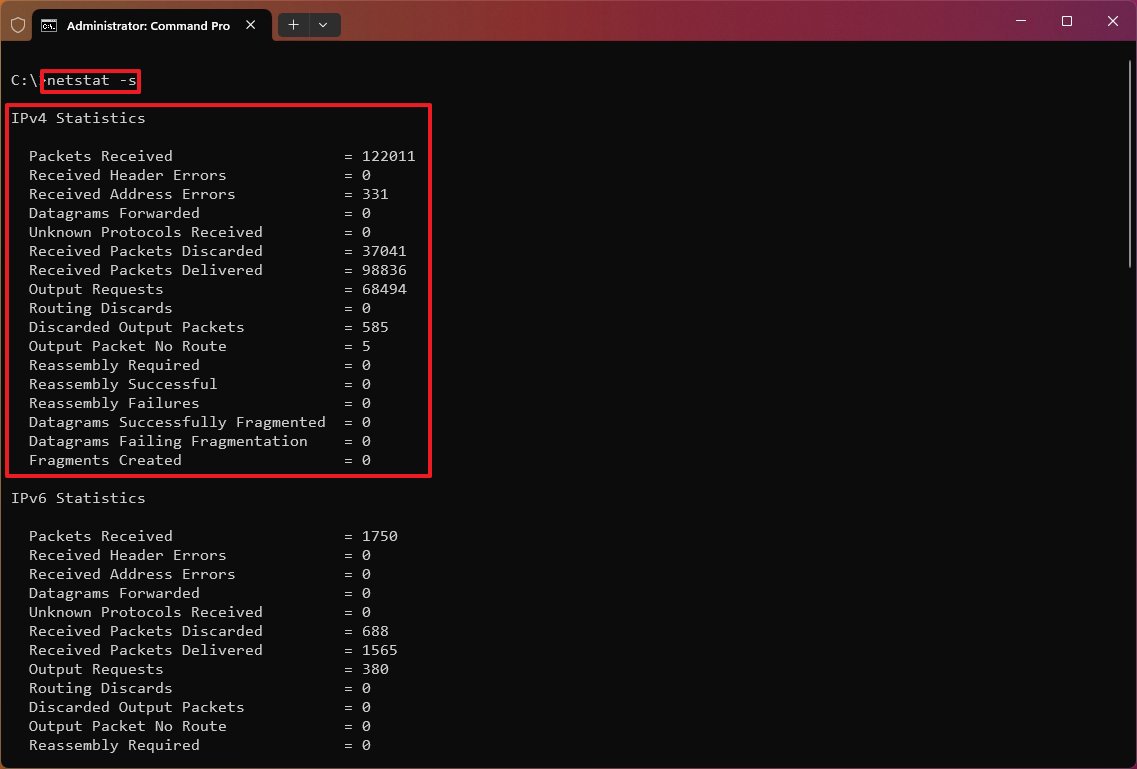
The «netstat -s» shows network statistics for the available protocols, including TCP, UDP, ICMP, and IP protocols (versions 4 and 6).
Show routing table
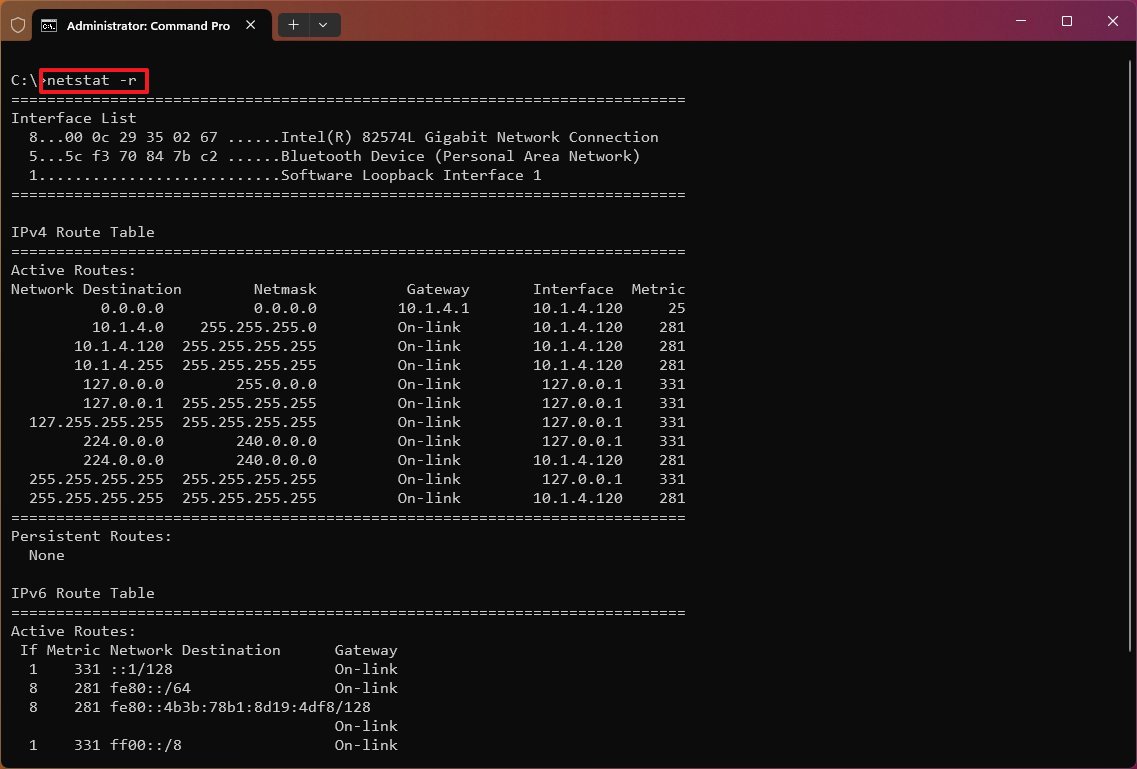
The «netstat -r» command displays the current network routing table that lists the routes to destinations and matrics known by the device for IP version 4 and version 6 (if applicable). If the returned information looks familiar, it’s because you can also output the data using the «route print» command.
Show offload state connections
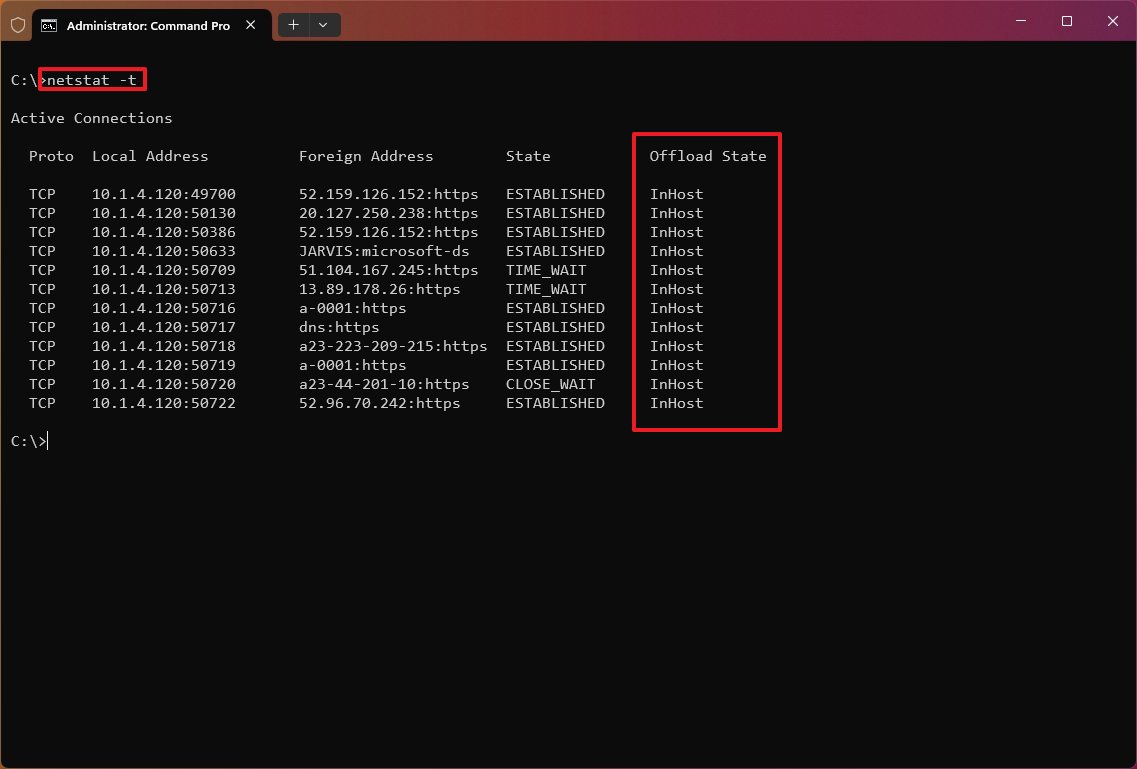
The «netstat -t» command generates a list of the current connection offload state. The offload state refers to the TCP Chimney Offload, which is a feature that transfers the network workload from the processor to the network adapter during data transmissions. The «InHost» value indicates that offloading isn’t enabled, and the «Offload» means that the feature is transferring the workload to the network adapter. (This feature is only present on supported network adapters.)
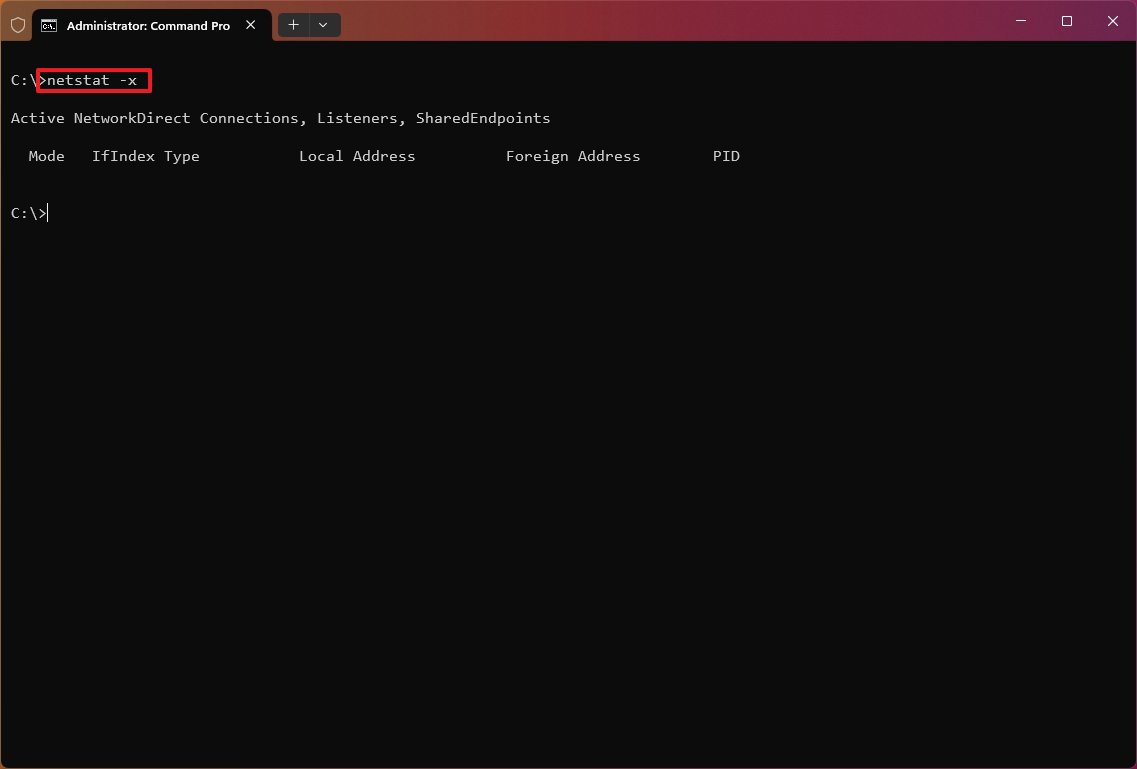
Show NetworkDirect connections
The «netstat -x» is another supported command, and it produces a list of NetworkDirect connections, shared endpoints, and listeners.
NetworkDirect is a specification for Remote Direct Memory Access (RDMA), which is a process that allows fast data transfers using the network adapter, freeing up the processor to perform other tasks. Usually, you’ll never use this command unless you’re using the Windows server version or a high-performance application with a network adapter that supports this feature.
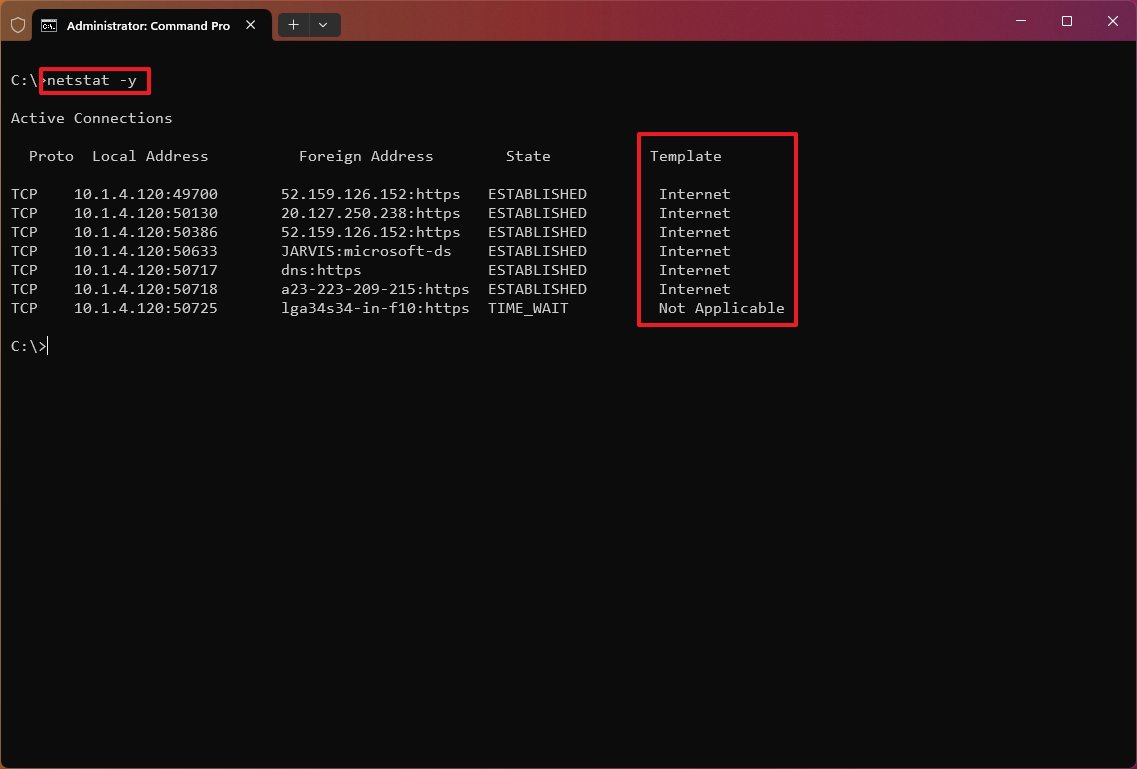
Show connection template
The «netstat -y» command displays TCP connection templates for all connections.
Combine parameters
When using the «netstat» command, you can combine the parameters to display various information for many cases.
For example, the «-e» parameter can also be used with the «-s» parameter to see statistics for each available protocol, and the «-o» parameter can be combined with «-a,» «-n,» and «-p» as necessary.
With the «netstat -p» command, you append the «s» parameter. You can display statistics from even more protocols, including «icmp,» «ip,» «icmpv6,» and «ipv6.»
Also, when using more than one parameter, you can combine them with a single «-.» For example, instead of writing the command «netstat -e -s,» you can write it like this: «netstat -es.»
To see all the available parameters and additional help, you can always use the «netstat /?» command.
Netstat search
In addition to displaying all the available statistic information, you can also output only the certain details you need using these steps:
- Open Start.
- Search for Command Prompt, right-click the top result, and select the Run as administrator option.
- Type the following command to list all the connections that have the state set to LISTENING and press Enter: netstat -q | findstr STRING
In the command, replace «STRING» for the information you want to list. Also, the findstr option is case-sensitive, which means you must enter the string you want to find with the exact casing. This example lists the connections set to «LISTENING:» netstat -q | findstr LISTENING
This other example shows all the connections from a foreign server FQDN, in this case, Amazon: netstat -f | findstr amazon
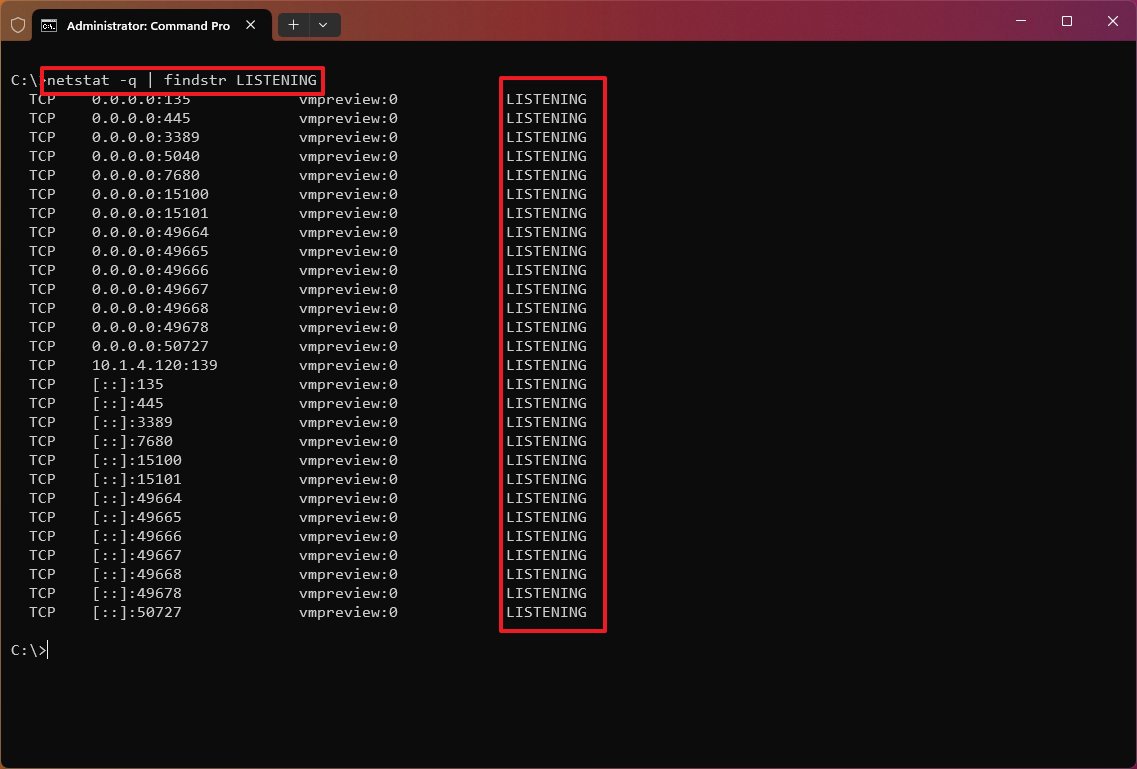
The «findstr» command isn’t part of the netstat tool. It’s a simple command to search for a text string in a file, but you can use it with many of the options for this tool to make more sense of the information you’re viewing.
The tool is not exclusive to Windows, as it’s also available across platforms, including Linux and macOS. Even though the parameters and syntax may be different, they all are very similar.
More resources
For more helpful articles, coverage, and answers to common questions about Windows 10 and Windows 11, visit the following resources:
- Windows 11 on Windows Central — All you need to know
- Windows 10 on Windows Central — All you need to know
Mauro Huculak has been a Windows How-To Expert contributor for WindowsCentral.com for nearly a decade and has over 15 years of experience writing comprehensive guides. He also has an IT background and has achieved different professional certifications from Microsoft, Cisco, VMware, and CompTIA. He has been recognized as a Microsoft MVP for many years.