
Zabbix Monitor Windows using SNMP
Zabbix Monitor Windows using SNMP
Would you like to learn how to monitor a Windows computer using SNMP? In this tutorial, we are going to show you how to install SNMP on Windows and how to configure the Zabbix server to monitor a Windows computer without the need to install the Zabbix agent.
• Zabbix version: 3.4.12
• Windows version: 2012 R2
Hardware List:
The following section presents the list of equipment used to create this Zabbix tutorial.
Every piece of hardware listed above can be found at Amazon website.
Zabbix Playlist:
On this page, we offer quick access to a list of videos related to Zabbix installation.
Don’t forget to subscribe to our youtube channel named FKIT.
Zabbix Related Tutorial:
On this page, we offer quick access to a list of tutorials related to Zabbix installation.
Tutorial — SNMP Installation on Windows
First, we need to install and configure the SNMP service on Windows.
Open the Server Manager application.
Access the Manage menu and click on Add roles and features.

Access the features screen, select the SNMP service option and finish the installation.

On the following screen, click on the Add features button.

The SNMP feature was installed on your computer but we still need to configure the SNMP service.
Open the Windows service management screen and access the SNMP service properties.

Access the Agent tab, select all the options and enter the device contact information.

Access the Security tab and select the Accept SNMP packets from any host option.

You need to create a Read-only SNMP community.
Here is a summary of our configuration example:
The GokuBlack Community has read-only permission on the Windows server.
The contact person responsible for this Windows computer was configured as Zamasu.
The location of the equipment was configured as the IT Room of Universe 10.
You have successfully installed the Windows SNMP service.
You have successfully configured the Windows SNMP service.
To test your SNMP configuration, use the following commands on a computer running Ubuntu Linux.
# apt-get install snmp
# snmpwalk -v2c -c GokuBlack 192.168.0.50
Here is a small sample of the SNMPWALK output.
iso.3.6.1.2.1.1.1.0 = STRING: «Hardware: Intel64 — Software: Windows Version 6.3
iso.3.6.1.2.1.1.2.0 = OID: iso.3.6.1.4.1.311.1.1.3.1.3
iso.3.6.1.2.1.1.3.0 = Timeticks: (614928) 1:42:29.28
iso.3.6.1.2.1.1.4.0 = STRING: «Zamasu <zamasu@dbsuper.com>»
iso.3.6.1.2.1.1.5.0 = STRING: «TECH-DC01.TECH.LOCAL»
iso.3.6.1.2.1.1.6.0 = STRING: «Universe10 — IT Room»
Congratulations! you have installed the SNMP service on a computer running Windows.
Keep in mind that your Windows firewall application needs to accept connections from the Zabbix server.
The Windows firewall should accept network packets on UDP port: 161
You can now use the Zabbix server dashboard to add this computer to the network monitoring service.
Tutorial — Zabbix Monitor Windows using SNMP
Now, we need to access the Zabbix server dashboard and add the Windows computer as a Host.
Open your browser and enter the IP address of your web server plus /zabbix.
In our example, the following URL was entered in the Browser:
• http://35.162.85.57/zabbix
On the login screen, use the default username and default password.
• Default Username: Admin
• Default Password: zabbix
After a successful login, you will be sent to the Zabbix Dashboard.

On the dashboard screen, access the Configuration menu and select the Host option.

On the top right of the screen, click on the Create host button.
On the Host configuration screen, you will have to enter the following information:
• Host Name — Enter a Hostname to identify the Windows server.
• Visible Hostname — Repeat the hostname.
• New group — Enter a name to identify a group of similar devices.
• Agent Interface — Click on the Remove option.
• SNMP Interface — Enter the IP address of the Windows server.
Here is the original image, before our configuration.

Here is the new image with our configuration.

Next, we need to configure the SNMP community that Zabbix will use to connect on the Windows computer.
Access the Macros tab on the top of the screen.
Create a macro named: {$SNMP_COMMUNITY}
The {$SNMP_COMMUNITY} macro value should be the Windows Computer SNMP community.

Next, we need to associate the host with a specific network monitor template.
By default, Zabbix comes with a large variety of monitoring templates.
Access the Templates tab on the top of the screen.
Click on the Select button and locate the template named: TEMPLATE OS Windows SNMPv2.

Click on the Add button (1).
Click on the Add button (2).
After a few minutes, you will be able to see the initial result on the Zabbix Dashboard.
The final result will take at least one hour.
By default, Zabbix will wait 1 hour to discover the number of interfaces available on the Windows computer.
By default, Zabbix will wait 1 hour before collect information from the network interfaces.
In order to test your configuration, access the Monitoring menu and click on the Graphs option.

On the top right of the screen, select the group named ALL.
Select your Windows computer host name.
Select the graph named: MEMORY UTILIZATION
You should be able to see the graphic of Memory utilization.

Congratulations! You have configured the Zabbix server to monitor a Windows computer.
VirtualCoin CISSP, PMP, CCNP, MCSE, LPIC22019-06-11T10:40:07-03:00
Related Posts
Page load link
Ok
We come to it at last the great tutorial of our time! Oh, boy, SNMP traps and Zabbix. I avoided this topic because it’s one of those features in Zabbix that is not implemented in a very user-friendly way. Therefore, I need to put in extra effort to properly explain how SNMP traps work on Zabbix
Even though it’s easy to configure when you know what you are doing, for beginners, this topic is just painful and nothing more! I mean, I really like Zabbix, but to say that SNMP implementation is great would be a lie.
But don’t worry! I will do my best to introduce you to SNMP traps in Zabbix step by step with lots of examples while we wait for the Zabbix team to improve this feature. Don’t know what is SNMP protocol? Learn step by step: MIB, OID, Agent, Manager
This tutorial should work on any Linux system: Debian, Ubuntu, Raspberry Pi OS, RHEL, CentOS, Oracle Linux, Alma Linux, or Rocky Linux.
So without further ado let’s get started!
Note: You need to log in as a root user with “su -” or use “sudo” to successfully execute commands used in this tutorial.
Table of Contents
- Step 1: Install SNMP packages
- Step 2: Configure Snmptrapd Service
- Step 3: Setup Script for SNMP Trap Processing
- Step 4: Restart and Enable Snmptrapd to Start on Boot
- Step 5: Configure Firewall to permit SNMP traps
- Step 6: Testing SNMP v3, v2 and v1 Traps
- Step 7: Enable SNMP Traps on Zabbix Server / Proxy
- Step 8: Create Zabbix items and triggers for SNMP traps
- a) Create a Template and Host in Zabbix for testing purposes
- b) Create Zabbix SNMP trap item using a Template
- c) Create Zabbix Triggers for SNMP traps using a Template
- Step 9: Learn more about SNMP Traps in Zabbix
- How do SNMP Traps work in Zabbix?
- How to Configure Logrotate for SNMP Trap File?
- How to add MIB Support for Human-Readable SNMP Traps?
- How to Troubleshoot SNMP Trap problems (snmptrapd)?
- How to Enable SNMP v2 / v1 Autorization?
- How to Configure a Python or Perl Script for Handling SNMP Traps?
- Using Additional Scripts in Snmptrapd for Specific SNMP Traps
- Filtering / Blocking SNMP Traps from Specific Hosts (blacklist)
- Learn about SNMP Traps and Zabbix Proxy Server Design issues
- Zabbix SNMP Trap Case Studies and Practical Examples
Step 1: Install SNMP packages
First, we need to install a collection of packages associated with the SNMP protocol:
RHEL / CentOS / Oracle Linux / Alma Linux / Rocky Linux
yum install -y net-snmp-utils net-snmp

Debian / Ubuntu / Raspberry Pi OS
sudo apt install -y snmptrapd snmp snmp-mibs-downloader
Step 2: Configure Snmptrapd Service
Edit the snmptrapd.conf configuration file using the following command:
nano /etc/snmp/snmptrapd.conf
And make the necessary changes so that the final configuration resembles this (you can delete everything else):
# Disables authorization for SNMP v1 and v2 traps, allowing all incoming traps without authentication.
disableAuthorization yes

# Creates two SNMPv3 user with authentication and encryption for testing purposes
createUser -e 0x80000009030038FD myuser MD5 authpass AES mypassword
authUser log,execute,net myuser priv

createUser -e 0x8000000001020304 traptest SHA mypassword AES
authUser log,execute traptest
Save and exit file (ctrl+x, followed by y and enter).
Note that on Ubuntu/Debian systems, the loading of MIBs is disabled by default. You can enable it with the following command:
sed -i 's/^mibs\s*:/# mibs :/' /etc/snmp/snmp.conf && systemctl restart snmptrapd
Nice job! This will enable the Linux system to receive traps, but where are they stored and in what format? To address this, we need to set up a script for SNMP trap processing, so let’s move on to the next step.
Step 3: Setup Script for SNMP Trap Processing
The easiest and simplest way to process traps is by using a shell script, as it eliminates the need to install any dependent packages. However, if you prefer to install a Python or Perl script (which is the default for Zabbix), you can do so by following the instructions provided at the end of this tutorial.
Please use the commands below to download ‘snmpparser.sh’ from github and set execution permissions:
curl -o /usr/bin/snmpparser.sh https://raw.githubusercontent.com/TheAldin/scripts/main/snmpparser.sh
chmod +x /usr/bin/snmpparser.sh
Now, update Snmptrapd configuration file to use that script:
echo 'traphandle default /usr/bin/bash /usr/bin/snmpparser.sh' >> /etc/snmp/snmptrapd.conf
The script will write traps to file ‘/var/log/snmptrap/zabbix_traps.tmp‘ so we need to create a directory with appropriate permissions:
mkdir -p /var/log/snmptrap
chmod a+rX /var/log/snmptrap
Step 4: Restart and Enable Snmptrapd to Start on Boot
Use the following command to restart the Snmptrapd service:
systemctl restart snmptrapd
And make sure to enable it to start on boot so that the Snmpd service starts automatically when the system reboots:
systemctl enable snmptrapd
Check the status of the snmptrapd process with command:
systemctl status snmptrapd
Step 5: Configure Firewall to permit SNMP traps
If you have firewall enabled then you need to permin UDP port 162 to receive SNMP traps.
Use these commands to open UDP port 162 on RHEL / CentOS / Oracle Linux / Alma Linux / Rocky Linux OS:
firewall-cmd --permanent --add-port=162/udp
firewall-cmd --reload
And if you have an UFW firewall installed on Ubuntu / Debian / Raspberry Pi OS, you can use this command to permit SNMP traps:
ufw allow 162/udp
Step 6: Testing SNMP v3, v2 and v1 Traps
Okay, keep our fingers crossed and hope that we’ve configured everything correctly. Let’s test SNMP traps for each SNMP version. Run these commands in the terminal:
# Testing SNMP v1 traps
snmptrap -v1  -c public 127.0.0.1 '.1.3.6.1.6.3.1.1.5.4' '0.0.0.0' 6 33 '55' .1.3.6.1.6.3.1.1.5.4 s "testSNMPv1"

# Testing SNMP v2 traps
snmptrap -v 2c -c secret 127.0.0.1 0 linkUp.0  .1.3.6.1.6.3.1.1.5.4 s "testSNMPv2"

# Testing SNMP v3 traps with MD5
snmptrap -e 0x80000009030038FD -v 3 -l authPriv -u myuser -a MD5 -A  authpass -x AES -X mypassword 127.0.0.1 0 linkUp.0  .1.3.6.1.6.3.1.1.5.4 s "testSNMPv3_MD5"

# Testing SNMP v3 traps with AES
snmptrap -v 3 -n "" -a SHA -A mypassword -x AES -X mypassword -l authPriv -u traptest -e 0x8000000001020304 localhost 0 linkUp.0  .1.3.6.1.6.3.1.1.5.4 s "testSNMPv3_AES"
Now, we need to check the ‘zabbix_traps.tmp‘ file, to see if the script has processed those traps, using this command:
cat /var/log/snmptrap/zabbix_traps.tmp
If everything was done correctly, you should have four SNMP traps that look like this:
[root@localhost ~]# cat /var/log/snmptrap/zabbix_traps.tmp

20230909.210230 ZBXTRAP 127.0.0.1
UDP: [127.0.0.1]:48749->[127.0.0.1]:162
DISMAN-EVENT-MIB::sysUpTimeInstance = 0:0:00:00.55
SNMPv2-MIB::snmpTrapOID.0 = IF-MIB::linkUp.0.33
IF-MIB::linkUp = "testSNMPv1"
SNMP-COMMUNITY-MIB::snmpTrapCommunity.0 = "public"
SNMPv2-MIB::snmpTrapEnterprise.0 = IF-MIB::linkUp
20230909.210234 ZBXTRAP 127.0.0.1
UDP: [127.0.0.1]:58439->[127.0.0.1]:162
DISMAN-EVENT-MIB::sysUpTimeInstance = 0:0:00:00.00
SNMPv2-MIB::snmpTrapOID.0 = IF-MIB::linkUp.0
IF-MIB::linkUp = "testSNMPv2"
20230909.210241 ZBXTRAP 127.0.0.1
UDP: [127.0.0.1]:55130->[127.0.0.1]:162
DISMAN-EVENT-MIB::sysUpTimeInstance = 0:0:00:00.00
SNMPv2-MIB::snmpTrapOID.0 = IF-MIB::linkUp.0
IF-MIB::linkUp = "testSNMPv3_MD5"
20230909.210245 ZBXTRAP 127.0.0.1
UDP: [127.0.0.1]:58096->[127.0.0.1]:162
DISMAN-EVENT-MIB::sysUpTimeInstance = 0:0:00:00.00
SNMPv2-MIB::snmpTrapOID.0 = IF-MIB::linkUp.0
IF-MIB::linkUp = "testSNMPv3_AES"
Please tell me if you see them so that we can move on. Yes? Great job, then! If not, you need to troubleshoot the problem. Check the chapter that deals with troubleshooting and debugging SNMP trap problems.
Step 7: Enable SNMP Traps on Zabbix Server / Proxy
All the setup we’ve done so far has nothing to do with Zabbix. That was the standard procedure for enabling traps on Linux. Now, we need to configure Zabbix to start the SNMP trapper process and point it to the trap file that the scripts generates. In our case, trap file would be ‘/var/log/snmptrap/zabbix_traps.tmp’.
Open ‘zabbix_server.conf’ file with command:
nano /etc/zabbix/zabbix_server.conf
and add this configuration anywhere in file:
StartSNMPTrapper=1
SNMPTrapperFile=/var/log/snmptrap/zabbix_traps.tmp
Save and exit file (ctrl+x, followed by y and enter). And restart Zabbix server afterwards:
systemctl restart zabbix-server
Note: In case of Zabbix proxy, follow similar steps: edit ‘zabbix_proxy.conf’ and restart the ‘zabbix-proxy’ service
Step 8: Create Zabbix items and triggers for SNMP traps
Great job! Now, all SNMP traps are accessible in Zabbix, allowing us to create items and triggers for them. The syntax for SNMP trap items in Zabbix is quite simple. The table below explains it all there is to SNMP trap options in Zabbix (item key).
| snmptrap[regexp] | Catches all SNMP traps that match the regular expression specified in regexp. If regexp is unspecified, catches any trap. This item can be set only for SNMP interfaces. User macros and global regular expressions are supported in the parameter of this item key. Examples: snmptrap[LineVoltageProblem] snmptrap[“IF-MIB::(linkDown|linkUp)”] snmptrap[“@coldStart trap”] |
| snmptrap.fallback | Catches all SNMP traps that were not caught by any of the snmptrap[] items for that interface. This item can be set only for SNMP interfaces. |
If you don’t understand these options, that’s okay. The best way to learn is by trying it out. Let’s dedicate 20 minutes to creating a lab and testing SNMP traps, and after that, everything will become clearer.
a) Create a Template and Host in Zabbix for testing purposes
Create a Template for SNMP traps
To create a template called ‘Template SNMP Traps’, follow these steps:
- Go to ‘Templates’ under the ‘Configuration’ section.
- Click on the upper left button ‘Create template’
- Define ‘Template name’ as ‘Template SNMP Traps’
- Set ‘Groups’ as ‘Templates’
- Click on the ‘Add’ button when you are finished.
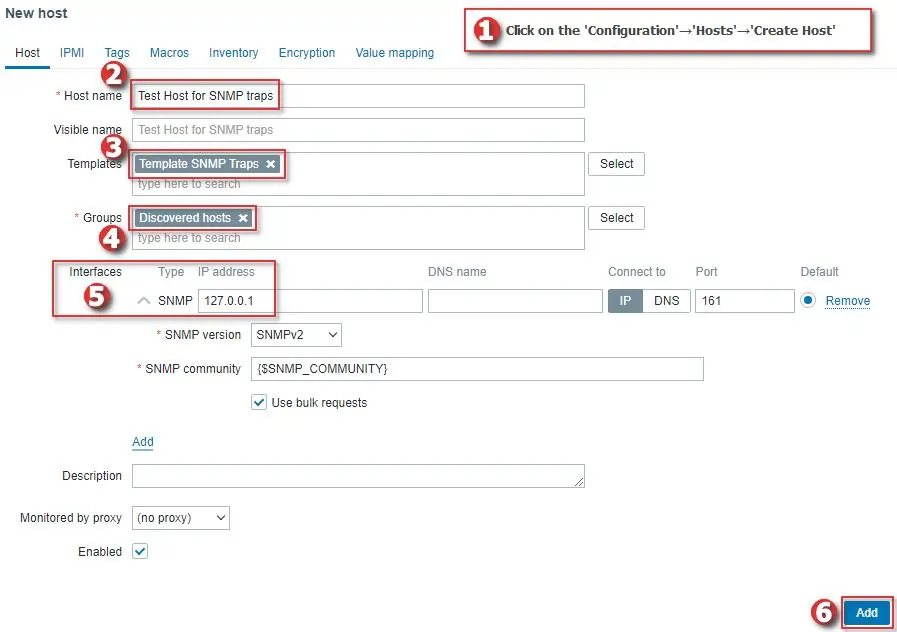
Create a Host for SNMP traps
Now, let’s create a host called ‘Test Host for SNMP traps’, with SNMP interface 127.0.0.1 and link it to the newly created ‘Template SNMP traps’, just as shown in the image below.
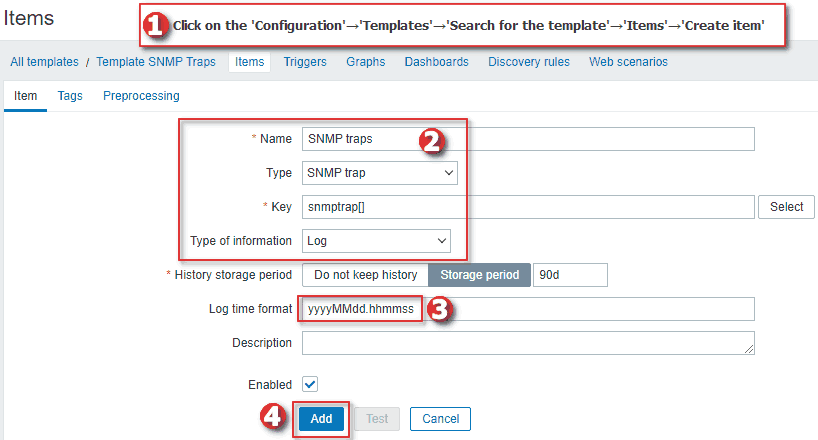
b) Create Zabbix SNMP trap item using a Template
Using ‘snmptrap[<regex>]’ allows you to filter any traps that you want. However, to keep things simple, we will create an ‘SNMP trap‘ item type with the key ‘snmptrap[]‘ on our test host.
Because we are not using regex, each host in Zabbix will receive all the traps that belong to them. Zabbix knows which host is associated with each trap because it compares the sender’s IP addresses from traps with the IP addresses on Zabbix hosts.
You can create the item directly on the host, but I recommend using the newly created template so that you can apply it to any host for better management.
When creating an item in the template, set ‘Name’ to ‘SNMP traps’, ‘Type’ to ‘SNMP trap’, ‘Key’ to ‘snmptrap[]’, ‘Type of information’ to ‘log’ and the ‘Log time format’ to ‘yyyyMMdd.hhmmss’, just as shown in the image below.
Now, I will use these Snmptrap commands to simulate interface up and down SNMP traps:
# This will send IF-MIB::linkDown SNMP trap for network interface eth0
snmptrap -v 1 -c public 127.0.0.1 '.1.3.6.1.6.3.1.1.5.3' '0.0.0.0' 6 33 '55' .1.3.6.1.6.3.1.1.5.3 s "eth0"

# This will send IF-MIB::linkUp SNMP trap for network interface eth0
snmptrap -v 1 -c public 127.0.0.1 '.1.3.6.1.6.3.1.1.5.4' '0.0.0.0' 6 33 '55' .1.3.6.1.6.3.1.1.5.4 s "eth0"
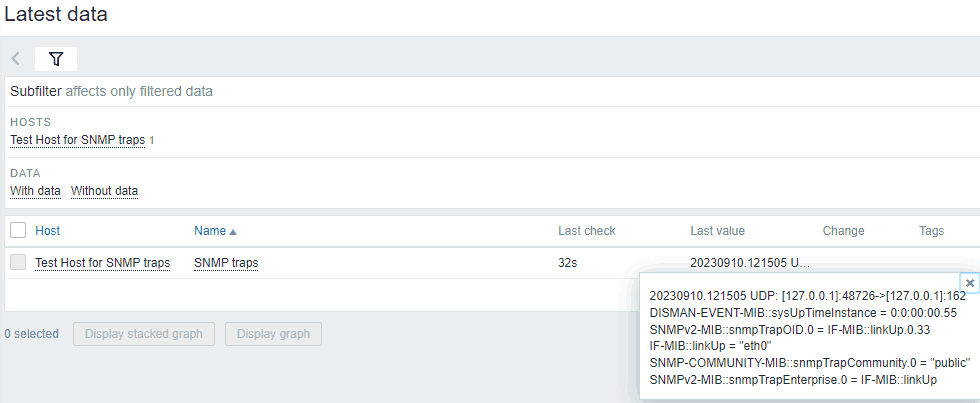
Those Snmptrap commands will generate the following SNMP traps in Zabbix:
[root@localhost ~]# cat /var/log/snmptrap/zabbix_traps.tmp

20230909.221844 ZBXTRAP 127.0.0.1
UDP: [127.0.0.1]:35776->[127.0.0.1]:162
DISMAN-EVENT-MIB::sysUpTimeInstance = 0:0:00:00.55
SNMPv2-MIB::snmpTrapOID.0 = IF-MIB::linkDown.0.33
IF-MIB::linkDown = "eth0"
SNMP-COMMUNITY-MIB::snmpTrapCommunity.0 = "public"
SNMPv2-MIB::snmpTrapEnterprise.0 = IF-MIB::linkDown

20230909.221849 ZBXTRAP 127.0.0.1
UDP: [127.0.0.1]:44550->[127.0.0.1]:162
DISMAN-EVENT-MIB::sysUpTimeInstance = 0:0:00:00.55
SNMPv2-MIB::snmpTrapOID.0 = IF-MIB::linkUp.0.33
IF-MIB::linkUp = "eth0"
SNMP-COMMUNITY-MIB::snmpTrapCommunity.0 = "public"
SNMPv2-MIB::snmpTrapEnterprise.0 = IF-MIB::linkUp
And on our host ‘Test Host for SNMP traps’ under the ‘Latest data’ section, you should see those SNMP traps.
Nice job! Let’s move on to trigger creation for SNMP traps.
c) Create Zabbix Triggers for SNMP traps using a Template
Example 1: Create a trigger for ONE network interface (down / up)
In this example, we will create a trigger that fires when it receives SNMP trap reporting that “eth0” is down (IF-MIB::linkDown = “eth0”) and clears when “eth0” is up (IF-MIB::linkUp = “eth0”).
Please create the trigger on the template ‘Template SNMP Traps’ with the following options:
Name: Interface eth0 is down on {HOST.HOST}
Severity: Warning
Problem expression: find(/Template SNMP Traps/snmptrap[],,"regexp","linkDown.*eth0\"")=1
Recovery expression: find(/Template SNMP Traps/snmptrap[],,"regexp","linkUp.*eth0\"")=1
Allow manual close: yes
As you can see, we are using regular expressions to match “linkDown.*eth0\”” for problem expression and “linkUp.*eth0\”” for recovery. Zabbix requires some time to update its configuration, so please wait for 30 seconds before proceeding to the next task.
Now, when you run the ‘snmptrap’ command with the option ‘IF-MIB::linkDown’ (1.3.6.1.6.3.1.1.5.3):
snmptrap -v 1 -c public 127.0.0.1 '.1.3.6.1.6.3.1.1.5.3' '0.0.0.0' 6 33 '55' .1.3.6.1.6.3.1.1.5.3 s "eth0"
An alarm will fire and you can see it on the Zabbix ‘Problems’ section:

To clear the alarm run the ‘snmptrap’ command with the option ‘IF-MIB::linkUp’ (1.3.6.1.6.3.1.1.5.4):
snmptrap -v 1 -c public 127.0.0.1 '.1.3.6.1.6.3.1.1.5.4' '0.0.0.0' 6 33 '55' .1.3.6.1.6.3.1.1.5.4 s "eth0"
Alright, that wasn’t too difficult. Let’s move on to the next example to learn about more complex concepts!
Example 2: Create a trigger for ANY network interface (down / up)
In our last example, we created an alarm for the network interface “eth0”. However, what if your network switch has 48 interfaces, and you want to receive alarms for every interface on that device? Creating 48 triggers individually can be quite labor-intensive. So, why go through all that when we have the powerful features of Zabbix to help us?
Let’s create a single trigger that sets off an alarm for every SNMP trap indicating an interface is down and clears it when the interface is up, and this will do for every interface: eth0, eth1, eth2, and so on.
Please create the trigger on the template ‘Template SNMP Traps’ with the following options:
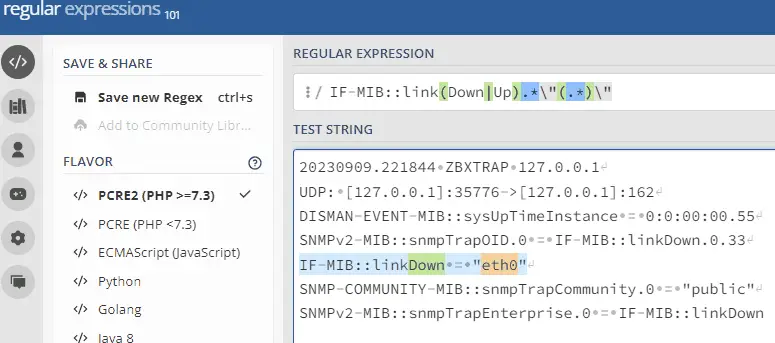
Name: Interface {{ITEM.VALUE}.regsub("IF-MIB::link(Down|Up).*\"(.*)\"", "\2")} is down on {HOST.HOST}
Severity: Warning
Problem expression: find(/Template SNMP Traps/snmptrap[],,"regexp","linkDown")=1
Recovery expression: find(/Template SNMP Traps/snmptrap[],,"regexp","linkUp")=1
PROBLEM event generation mode: Multiple
OK event closes: All problems if tag values match
Tag for matching: interface
Allow manual close: yes

Tags→Trigger tags:
    Name: interface
    Value: {{ITEM.VALUE}.regsub("IF-MIB::link(Down|Up).*\"(.*)\"", "\2")}
Now let’s see the magic in action. Run the ‘snmptrap’ command with the option ‘IF-MIB::linkDown’ for interfaces eth1 and eth2:
snmptrap -v 1 -c public 127.0.0.1 '.1.3.6.1.6.3.1.1.5.3' '0.0.0.0' 6 33 '55' .1.3.6.1.6.3.1.1.5.3 s "eth1"
snmptrap -v 1 -c public 127.0.0.1 '.1.3.6.1.6.3.1.1.5.3' '0.0.0.0' 6 33 '55' .1.3.6.1.6.3.1.1.5.3 s "eth2"
And two alarms will fire for both interfaces:

Since we are using our ‘interface’ tag, we can send a clear alarm for a specific interface, and Zabbix will only clear the alarm for that particular interface:
snmptrap -v 1 -c public 127.0.0.1 '.1.3.6.1.6.3.1.1.5.4' '0.0.0.0' 6 33 '55' .1.3.6.1.6.3.1.1.5.4 s "eth1"
So how does this work?
Zabbix uses the ‘regsub‘ function for the macro {ITEM.VALUE}. This macro represents the last item value, in our case, that would be the SNMP trap. By using ‘regsub’ we can employ regex to extract the interface name from the long trap string.
Our ‘interface’ tag was also extracted using the ‘regsub’ feature, and because of that, Zabbix can distinguish one alarm from another. This enables Zabbix to track only the words ‘linkDown’ and ‘linkUp’ for alarm activation and clearing without the need for complex regex.
I encourage you to try using regex on the website regex101.com to better understand these functions.
Now that we have a single trigger for all interfaces, you can go ahead and delete the trigger we created in the previous step.
If you need more examples and case studies, go to the chapter: Zabbix SNMP Trap Case Studies and Practical Examples
CONGRATULATIONS!
You have successfully configured SNMP traps on Zabbix monitoring system!
No need to change anything else as other steps are optional.
CONTINUE TO LEARN MORE:
How do SNMP Traps work in Zabbix?
How to Configure Logrotate for SNMP Trap File?
How to add MIB Support for Human-Readable SNMP Traps?
How to Troubleshoot SNMP Trap problems (snmptrapd)?
How to Enable SNMP v2 / v1 Autorization?
Using Additional Scripts in Snmptrapd for Specific SNMP Traps
How to Configure a Python or Perl Script for Handling SNMP Traps?
Filtering / Blocking SNMP Traps from Specific Hosts (blacklist)
Learn about SNMP Traps and Zabbix Proxy Server Design issues
Zabbix SNMP Trap Case Studies and Practical Examples
Step 9: Learn more about SNMP Traps in Zabbix
How do SNMP Traps work in Zabbix?
In a nutshell, the end-to-end SNMP trap processing goes like this:

- The device sends a trap to the Linux server, where it is received by the Snmptrapd service.
- Snmptrapd passes the trap, which translates the trap into the format that is suitable for the Zabbix server.
- After translation, the trap is saved to ‘/var/log/snmptrap/zabbix_traps.tmp’.
- Zabbix SNMP trapper process reads and parses the trap file
- For each trap Zabbix finds all “SNMP trap” items with host interfaces matching the received trap address
- For each found item, the trap is compared to regexp in “snmptrap[regexp]”. The trap is set as the value of all matched items
- If no matching item is found and there is an “snmptrap.fallback” item, the trap is set as the value of that
- If the trap was not set as the value of any item, Zabbix by default logs the unmatched trap (Administration > General > Other)
How to Configure Logrotate for SNMP Trap File?
The ‘zabbix_traps.tmp’ file can become quite large, so it would be a good idea to periodically compress it. Let’s create a logrotate configuration for the ‘/var/log/snmptrap/zabbix_traps.tmp’ file.
Create a new file with this command:
nano /etc/logrotate.d/zabbix_traps
And write these lines into that file:
# Specify the log file that this configuration applies to.
/var/log/snmptrap/zabbix_traps.tmp {
    # Rotate when log file reaches 50MB
    size 50M
    # Keep up to 10 rotated log files.
    rotate 10
    # Compress rotated log files.
    compress
    # Delay compression until the next rotation.
    delaycompress
    # Do not report errors if the log file is missing.
    missingok
    # Avoid rotating empty log files.
    notifempty
}
How to add MIB Support for Human-Readable SNMP Traps?
Later in this tutorial, you will learn how to create SNMP trap support for the Cisco UCS system. In those examples, SNMP trap look like this:
.1.3.6.1.4.1.9.9.719.1.1.1.1.11.1788684 value=STRING: "Config backup may be outdated"
.1.3.6.1.4.1.9.9.719.1.1.1.1.13.1788684 value=Counter64: 1788683
It would be helpful to have SNMP object IDs in a human-readable form, like this:
CISCO-UNIFIED-COMPUTING-FAULT-MIB::cucsFaultDescription.1790835 value=STRING: "Config backup may be outdated"
CISCO-UNIFIED-COMPUTING-FAULT-MIB::cucsFaultId.1790835 value=Counter64: 1788683
To achieve that, you need to download the correct MIB files and enable the Snmptrapd service to load all SNMP MIB modules.
a) Download SNMP MIB Files
Search the MIB database for the MIB that you would like to import into Zabbix. Download that MIB and every MIB listed under the ‘Imports’ section. Change the extension of all the downloaded MIB, replacing ‘.mib’ with ‘.txt’, and copy them to the correct directory path. By default, it is ‘/usr/share/snmp/mibs‘. Afterward, you need to reset the Snmpd service, and that’s it!
Read more about this in How to Import MIB to Zabbix: A Step-by-Step Guide.
b) Edit the Snmptrapd Service to Load all SNMP MIB Modules
You may have correct MIB files in the MIB directory (‘/usr/share/snmp/mibs’) but Snmptrapd will not load them by default!
To enable this, you need to edit the Snmptrapd service with the option ‘-m ALL‘ which means it will load and make available all SNMP MIB modules configured on the system:
nano /usr/lib/systemd/system/snmptrapd.service
Add the option ‘-m ALL’ so that the ‘ExecStart’ line looks like this (note that this line differs on RHEL from Debian-based OS):
RHEL / CentOS / Oracle Linux / Alma Linux / Rocky Linux
ExecStart=/usr/sbin/snmptrapd $OPTIONS -f -m ALL

Debian / Ubuntu / Raspberry Pi OS
ExecStart=/usr/sbin/snmptrapd -LOw -f -m ALL -p /run/snmptrapd.pid
Save and exit file (ctrl+x, followed by y and enter), then reload the daemon and restart the Snmptrapd service afterward:
systemctl daemon-reload
systemctl restart snmptrapd
How to Troubleshoot SNMP Trap problems (snmptrapd)?
Below you will find guidance on how to troubleshoot SNMP traps on Zabbix.
a) Review Steps
Read the tutorial carefully from the beginning to see if you have missed any steps.
b) Firewall
If you have firewall enabled then you need to permit UDP port 162 to receive SNMP traps.
c) SElinux
Check the SELinux if you are on an RHEL-based OS.
d) Snmptrapd Status
Check the status of the snmptrapd process with command:
systemctl status snmptrapd
e) Logs
Check system logs with the command:
journalctl
f) Run Debug
Stop the Snmptrapd service and start it manually in debug mode to check traps live as they come in.
systemctl stop snmptrapd
snmptrapd -f -Lo -Dusm
g) Tcpdump
Install TCP dump with these command:
RHEL / CentOS / Oracle Linux / Alma Linux / Rocky Linux
yum install tcpdump

Debian / Ubuntu / Raspberry Pi OS
 apt-get install tcpdump
To view SNMP traps as they come in on the network interface use this command (check your interface name with ‘ip a’):
tcpdump -i <interface> -n -X -s 0 'udp port 162'
How to Enable SNMP v2 / v1 Autorization?
Earlier in this tutorial, we set the ‘disableAuthorization’ option, allowing SNMP v1 and SNMP v2 traps to be received without a community string.
If you wish to enable authorization, you should comment out the ‘disableAuthorization’ line and add your SNMP communities. Edit the snmptrapd.conf configuration file using the following command:
nano /etc/snmp/snmptrapd.conf
Update the configuration:
#disableAuthorization
authCommunity execute public
authCommunity execute private
authCommunity execute MySnmpCommunity
Save and exit file (ctrl+x, followed by y and enter). And restart Snmptrapd service afterwards:
systemctl restart snmptrapd
How to Configure a Python or Perl Script for Handling SNMP Traps?
Depending on your specific situation, you may consider replacing that Shell script with either a Python or Perl script.
Option 1: Perl Script for SNMP traps (default)
From the beginning, Zabbix has recommended a Perl script (and still does) as the default script for trap processing in Zabbix.
Install a Perl package on Linux:
RHEL / CentOS / Oracle Linux / Alma Linux / Rocky Linux
yum install -y net-snmp-perl


Debian / Ubuntu / Raspberry Pi OS
sudo apt install -y libsnmp-perl
Download the ‘zabbix_trap_receiver.pl’ script from github, save it to ‘/usr/bin’ and grant it executable permissions:
curl -o /usr/bin/zabbix_trap_receiver.pl https://raw.githubusercontent.com/TheAldin/scripts/main/zabbix_trap_receiver.pl
chmod +x /usr/bin/zabbix_trap_receiver.pl
Disable the current traphandles with this command:
sed -i '/^traphandle/ s/^/# /' /etc/snmp/snmptrapd.conf
Add this line to the SNMP configuration file so that Snmptrapd knows it needs to send each trap to Perl script for processing:
echo 'perl do "/usr/bin/zabbix_trap_receiver.pl"' >> /etc/snmp/snmptrapd.conf
And don’t forget to restart the Snmptrapd service
systemctl restart snmptrapd
Option 2: Python Script for SNMP traps
Credit for this Python script goes to Opensource ICT Solutions B.V.
Install a Python package on Linux:
RHEL / CentOS / Oracle Linux / Alma Linux / Rocky Linux
yum install -y python3 python3-setuptools


Debian / Ubuntu / Raspberry Pi OS
apt install -y python3 python3-setuptools
Download the ‘snmptrap-parser.py’ script from github, save it to ‘/usr/bin’ and grant it executable permissions:
curl -o /usr/bin/snmptrap-parser.py https://raw.githubusercontent.com/TheAldin/scripts/main/snmptrap-parser.py
chmod +x /usr/bin/snmptrap-parser.py
Disable the current traphandles with this command:
sed -i '/^traphandle/ s/^/# /' /etc/snmp/snmptrapd.conf
Add this line to the SNMP configuration file so that Snmptrapd knows it needs to send each trap to python script for processing:
echo 'traphandle default /usr/bin/python /usr/bin/snmptrap-parser.py' >> /etc/snmp/snmptrapd.conf
Set the correct Python path in snmptrapd.conf:
sed -i "s|/usr/bin/python|$(whereis python | awk '{print $2}')|g" /etc/snmp/snmptrapd.conf
And don’t forget to restart the Snmptrapd service
systemctl restart snmptrapd
Using Additional Scripts in Snmptrapd for Specific SNMP Traps
What if you have already set up Shell or Perl scripts that are highly performance-efficient, and now you need to process or enrich data in a trap with a specific OID? That could slow down the whole trap process, and we don’t want that.
For example, many log systems can send crucial logs as a trap to Zabbix, but they use the IP address of the syslog server as the origin instead of the host that generated that syslog. In that case, you can leave everything as is in the Snmptrapd configuration file but add another trap handler that will be used only when a trap with a specific OID arrives.
Here is an example of an Snmptrap configuration that has a special script for traps with OID 1.3.6.1.4.1.700.1.1.0:
traphandle default /usr/bin/bash /usr/bin/snmpparser.sh
traphandle 1.3.6.1.4.1.700.1.1.0 /usr/bin/bash /usr/bin/SnmpparserSyslog.sh
That way, your default trap processing remains intact, and all the traps with the ‘1.3.6.1.4.1.700.1.1.0’ OID will be processed with another script.
Filtering / Blocking SNMP Traps from Specific Hosts (blacklist)
So what if some device is spamming your Zabbix server with tons of SNMP traps? You have the option to block that host. In this section, we will discuss how to filter SNMP traps from specific hosts using a blacklist approach. By configuring the snmptrapd.conf file as shown below, you can effectively block SNMP traps originating from the specific IP address.
Edit the snmptrapd.conf configuration file using the following command:
nano /etc/snmp/snmptrapd.conf
Add something like this in the file, but change the IP address to your IP address that you wish to block:
sourceFilterType blacklist
sourceFilterAddress 192.168.1.100
sourceFilterAddress 10.10.10.222
Save and exit file (ctrl+x, followed by y and enter). And restart Snmptrapd service afterwards:
systemctl restart snmptrapd
Learn about SNMP Traps and Zabbix Proxy Server Design issues
Zabbix traps work great when there aren’t too many Zabbix proxy servers. However, there is a design issue when dealing with a large number of proxy servers.
Each device that sends SNMP traps needs to send them to the proxy servers to which that device belongs. This means that if you configure all the devices in the network to send traps to the IP address of a specific Zabbix proxy, only devices assigned to that proxy will receive the traps. If you move a host to another proxy, it will stop receiving traps.
This situation can be problematic in large environments where multiple proxy servers serve the same purpose. For example, if you have 10 proxy servers in one location, and each proxy server handles 1000 devices, you have two options to make traps work. You can either configure each device to send traps to all proxy servers (which is not recommended), or you can configure each device to send traps to the appropriate proxy (which can be error-prone and difficult to manage).
What can be done about this?
You can use any of the SNMP trap scripts from this tutorial to develop new functionality, allowing it to identify which IP address belongs to which proxy server. This way, you can have only one IP address (Zabbix server) that devices will use to send SNMP traps, and the script will forward the trap to the correct proxy server.
However, this is beyond the scope of this tutorial.
Zabbix SNMP Trap Case Studies and Practical Examples
Earlier in this tutorial, we have learned how to configure a trigger for SNMP traps that activate and clear alarms for each network interface “down” and “up” status. Here, I will share additional examples to assist you in configuring traps.
Also, if you need more examples, please add comment with your trap data and describe what you need to do with it, and I will attempt to create regex and triggers for that trap.
Case Study 1: Creating Support for Fault Traps from Cisco UCS System
Cisco UCS systems use the MIB CISCO-UNIFIED-COMPUTING-FAULT-MIB to send system faults as traps to other systems. We will use three SNMP OIDs from the trap. The first OID is called cucsFaultDescription (1.3.6.1.4.1.9.9.719.1.1.1.1.11) and it contains the fault description.
The second OID is called CucsFaultSeverity (1.3.6.1.4.1.9.9.719.1.1.1.1.20), and it contains the status of the trap, which can be one of the following: cleared(0), info(1), warning(3), minor(4), major(5), or critical(6).
The last OID is called cucsFaultId (1.3.6.1.4.1.9.9.719.1.1.1.1.13), and it will enable Zabbix to know which trigger to clear when multiple traps arrive.
Here are examples of a few clear SNMP traps that UCS can send:
.1.3.6.1.4.1.9.9.719.1.1.1.1.11.1790835 type=4  value=STRING: "Local Internal backup failed while upgrade. Please re-trigger a manual backup."
.1.3.6.1.4.1.9.9.719.1.1.1.1.4.1790835 type=6  value=OID: .1.3.6.1.4.1.9.9.719.1.31.4.1.2.1769833
.1.3.6.1.4.1.9.9.719.1.1.1.1.5.1790835 type=4  value=STRING: "sys/backup-10.7.69.59"
.1.3.6.1.4.1.9.9.719.1.1.1.1.10.1790835 type=4  value=Hex-STRING: 07 E2 02 0B 0D 26 29 28
.1.3.6.1.4.1.9.9.719.1.1.1.1.14.1790835 type=4  value=Hex-STRING: 07 E2 02 0C 09 14 0B 33
.1.3.6.1.4.1.9.9.719.1.1.1.1.9.1790835 type=2  value=INTEGER: 1672
.1.3.6.1.4.1.9.9.719.1.1.1.1.22.1790835 type=2  value=INTEGER: 9
.1.3.6.1.4.1.9.9.719.1.1.1.1.7.1790835 type=2  value=INTEGER: 820
.1.3.6.1.4.1.9.9.719.1.1.1.1.20.1790835 type=2  value=INTEGER: 0
.1.3.6.1.4.1.9.9.719.1.1.1.1.16.1790835 type=65 value=Counter32: 65
.1.3.6.1.4.1.9.9.719.1.1.1.1.13.1790835 type=70 value=Counter64: 1790834
.1.3.6.1.4.1.9.9.719.1.1.1.1.11.1788684 type=4  value=STRING: "Config backup may be outdated"
.1.3.6.1.4.1.9.9.719.1.1.1.1.4.1788684 type=6  value=OID: .1.3.6.1.4.1.9.9.719.1.31.43.1.2.31644
.1.3.6.1.4.1.9.9.719.1.1.1.1.5.1788684 type=4  value=STRING: "sys/bkup-policy-cfg"
.1.3.6.1.4.1.9.9.719.1.1.1.1.10.1788684 type=4  value=Hex-STRING: 07 E2 02 08 0D 3B 1F 28
.1.3.6.1.4.1.9.9.719.1.1.1.1.14.1788684 type=4  value=Hex-STRING: 07 E2 02 0C 09 14 0B 39
.1.3.6.1.4.1.9.9.719.1.1.1.1.9.1788684 type=2  value=INTEGER: 1392
.1.3.6.1.4.1.9.9.719.1.1.1.1.22.1788684 type=2  value=INTEGER: 9
.1.3.6.1.4.1.9.9.719.1.1.1.1.7.1788684 type=2  value=INTEGER: 654
.1.3.6.1.4.1.9.9.719.1.1.1.1.20.1788684 type=2  value=INTEGER: 0
.1.3.6.1.4.1.9.9.719.1.1.1.1.16.1788684 type=65 value=Counter32: 1
.1.3.6.1.4.1.9.9.719.1.1.1.1.13.1788684 type=70 value=Counter64: 1788683
Now, we must create a trigger in Zabbix that will actvate an alarm and parse the description of the trap when statuses 3 – 6 arrive, and clear the traps when status 0 arrives. The fault description will end up as the name of the trigger. In my example, I will configure a trigger to ignore status ‘info (1)’ because it does not represent a fault.
Name: Cisco UCS fault: {{ITEM.VALUE}.regsub(".719.1.1.1.1.11.*\"(.*)\"", "\1")}
Severity: Warning
Problem expression: find(/Template UCS SNMP Traps/snmptrap[],,"regexp","719.1.1.1.1.20.*?INTEGER:.[34567]")=1
Recovery expression: find(/Template UCS SNMP Traps/snmptrap[],,"regexp","719.1.1.1.1.20.*?INTEGER:.0")=1
PROBLEM event generation mode: Multiple
OK event closes: All problems if tag values match
Tag for matching: ucsfaultid
Allow manual close: yes

Tags→Trigger tags:
    Name: ucsfaultdescription
    Value: {{ITEM.VALUE}.regsub(".719.1.1.1.1.11.*\"(.*)\"", "\1")}

    Name: ucsfaultid
    Value: {{ITEM.VALUE}.regsub(".719.1.1.1.1.13.*?Counter64:.(.*)", "\1")}
Well, this is the basic trap, but it can be improved. For example, you could create a trigger for each severity and in the regex you could put ‘719.1.1.1.1.20.*?INTEGER:.[4]’ to be warning severity (yellow), ‘719.1.1.1.1.20.*?INTEGER:.[5]’ major (orange) etc.
Note that I did not implement CISCO-UNIFIED-COMPUTING-FAULT-MIB on Linux, so the traps in this example have OIDs in numeric format instead of human-readable names. Replace the OIDs inside the regex with object names if you are using the MIB: ‘719.1.1.1.1.20’ to ‘cucsFaultSeverity’, ‘719.1.1.1.1.11’ to ‘cucsFaultDescription’, and ‘719.1.1.1.1.13’ to ‘cucsFaultId’.
And that’s all. If you have configured everything correctly, you should receive Cisco UCS alarms in Zabbix.
Case Study 2: Creating ‘Tag for matching’ by Combining Different OID Values from Multiple Lines in SNMP Traps
Previously, we have created alarms for interface UP and DOWN statuses using a single OID (represented by one line in the trap message) to generate a matching tag.
But what if you need to use two lines from traps for recovery, and you want to place them inside the ‘Tag for matching’? Do we use two tags? No, we need to craft two regexes in one tag. Let me explain.
Below is an SNMP trap that will trigger an alarm in Zabbix because it contains the string ‘STARENT-MIB::starPortDown’:
21:08:17 2023/10/19 ZBXTRAP 172.16.35.67
PDU INFO:
  community                      public
  errorindex                     0
  receivedfrom                   UDP: [172.16.35.67]:60030->[10.39.250.82]:162
  errorstatus                    0
  transactionid                  192
  messageid                      0
  notificationtype               TRAP
  version                        1
  requestid                      258800841
VARBINDS:
  DISMAN-EVENT-MIB::sysUpTimeInstance type=67 value=Timeticks: (0) 0:00:00.00
  SNMPv2-MIB::snmpTrapOID.0      type=6  value=OID: STARENT-MIB::starPortDown
  STARENT-MIB::starPortSlot      type=4  value=STRING: "5"
  STARENT-MIB::starPortNum       type=4  value=STRING: "6"
  STARENT-MIB::starPortType      type=2  value=INTEGER: 0
  STARENT-MIB::starSlotSerialNumber type=4  value=""
But when the clear alarm comes with ‘STARENT-MIB::starPortUp‘ how will Zabbix determine that only the alarm for an interface that has ‘starPortSlot’ equal to 5 and ‘starPortType’ equal to 6 needs to be cleared?
21:10:54 2023/10/19 ZBXTRAP 172.16.35.67
PDU INFO:
  errorstatus                    0
  transactionid                  193
  notificationtype               TRAP
  messageid                      0
  requestid                      258800842
  version                        1
  community                      public
  errorindex                     0
  receivedfrom                   UDP: [172.16.35.67]:63004->[10.39.250.82]:162
VARBINDS:
  DISMAN-EVENT-MIB::sysUpTimeInstance type=67 value=Timeticks: (0) 0:00:00.00
  SNMPv2-MIB::snmpTrapOID.0      type=6  value=OID: STARENT-MIB::starPortUp
  STARENT-MIB::starPortSlot      type=4  value=STRING: "5"
  STARENT-MIB::starPortNum       type=4  value=STRING: "6"
  STARENT-MIB::starPortType      type=2  value=INTEGER: 0
  STARENT-MIB::starSlotSerialNumber type=4  value=""
The solution is to create a tag for matching that is composed of two OID values, ‘starPortSlot’ and ‘starPortNum,’ like this:
Name: Interface {{ITEM.VALUE}.regsub("starPortSlot.+\"(.+)\"", "\1")} / {{ITEM.VALUE}.regsub("starPortNum.+\"(.+)\"", "\1")} is down on {HOST.HOST}
Severity: Warning
Problem expression: find(/Template SNMP Traps/snmptrap[],,"regexp","starPortDown")=1
Recovery expression: find(/Template SNMP Traps/snmptrap[],,"regexp","starPortUp")=1
PROBLEM event generation mode: Multiple
OK event closes: All problems if tag values match
Tag for matching: interface
Allow manual close: yes

Tags→Trigger tags:
    Name: interface
    Value: {{ITEM.VALUE}.regsub("starPortSlot.+\"(.+)\"", "\1")} / {{ITEM.VALUE}.regsub("starPortNum.+\"(.+)\"", "\1")}
Using the trigger configuration above, you will receive an alarm in Zabbix called ‘Interface 5 / 6 is down on HostXY‘ with an ‘interface‘ tag having both values ‘5 / 6′.
В этой статье мы рассмотрим, как настроить мониторинг устройств MikroTik с помощью Zabbix и протокола SNMP. Мы подключим необходимые шаблоны, чтобы визуализировать состояние интерфейсов и оценить производительность оборудования в реальном времени.
Если вы хотите убедиться в стабильной работе сетевых устройств, обеспечить контроль за трафиком и состоянием интерфейсов — SNMP-мониторинг с Zabbix станет вашим надёжным помощником.
Онлайн-курс: Zabbix 6. Мониторинг IT инфраструктуры предприятия.
Курс предлагает глубокое изучение Zabbix 6 и охватывает все ключевые аспекты: от установки и конфигурации до продвинутого мониторинга и автоматизации. Курс подходит как для начинающих, так и для опытных администраторов.
Содержание:
- Проверка SNMP-связи
- Создание хоста в Zabbix
- Применение шаблона
- Настройка SNMP-макросов
- Визуализация и мониторинг
- Элементы данных
- Настройка отдельных элементов для интерфейсов
- Создание собственных триггеров
- Заключение
Настройка собственных триггеров
Перед началом работы убедитесь, что на вашем устройстве MikroTik корректно настроена SNMP-связь.
Также необходимо задать SNMP-сообщество (community), через которое Zabbix будет получать данные.

Создание хоста в Zabbix
После настройки SNMP перейдите в веб-интерфейс Zabbix: Data Collection > Hosts > Create Host.
Здесь нужно указать основную информацию об устройстве:
- имя (hostname),
- IP-адрес,
- группу (например, «MikroTik» или «Сетевые устройства»).
Если вы работаете с несколькими устройствами MikroTik, рекомендуется логически организовать их по группам.

Применение шаблона
Zabbix предоставляет множество готовых шаблонов, подходящих для различных типов устройств.
Выберите шаблон, соответствующий вашей модели MikroTik — это позволит автоматически настроить ключевые метрики и упростит мониторинг.

Настройка SNMP-макросов
В разделе Macros укажите SNMP-сообщество, которое вы ранее настроили на MikroTik.
Нажмите Update, чтобы сохранить изменения.
Эта настройка даст Zabbix доступ к данным устройства.

Если вы мониторите несколько устройств с одним и тем же SNMP-сообществом, разумнее настроить глобальный макрос:
Administration > Macros.
Это удобно — один раз указав значение, вы избавитесь от необходимости повторно настраивать каждый хост вручную.

Визуализация и мониторинг
После выполнения всех настроек вы начнёте получать информацию от устройства прямо в интерфейсе Zabbix:
- Общая производительность устройства

- Состояние подключённых интерфейсов

Элементы данных
Zabbix способен автоматически обнаруживать новые интерфейсы через заданные интервалы, благодаря функции Network Interfaces Discovery.
Это избавляет от необходимости вручную добавлять новые элементы при изменениях в инфраструктуре.
Чтобы просмотреть состояние, перейдите в Data Collection > Hosts, выберите нужное устройство MikroTik и откройте вкладку Items.
Здесь можно увидеть, что, например, интерфейс 2 добавлен как зависимый элемент (dependent item).
Это значит, что данные он получает от главного элемента через MIB — базы данных, в которых хранятся параметры SNMP-устройств.

Настройка отдельных элементов для интерфейсов
Если вы хотите вручную создать элемент для мониторинга, выполните:
Data Collection > Hosts > Create Item
Укажите:
- Название, которое идентифицирует SNMP Agent
- Ключ (key) — имя параметра
- OID — идентификатор объекта из MIB
- Интервал обновления — в зависимости от ваших задач

Для валидации OID используйте snmpwalk, который вернёт значение, например IF-MIB::ifOperStatus.2, отображающее состояние интерфейса.
Документация по snmpwalk.

Создание собственных триггеров
Чтобы получить оповещение, если интерфейс отключится, перейдите в:
Data Collection > Hosts > Triggers > Create Trigger
Укажите:
- Понятное имя (можно с макросами)
- Условие события
- Уровень важности
- Логическое выражение
Например:
- Значение 2 → интерфейс отключён

- Значение 1 → интерфейс работает

Для правильной интерпретации значений SNMP в Zabbix перейдите в:
Data Collection > Templates > MikroTik RB4011iGS+RM by SNMP > Value Mapping
Здесь вы увидите, какие значения возвращает SNMP, и на их основе можно задать корректную логику срабатывания триггеров.

Проверить работу триггеров можно в Monitoring > Problems.

Заключение
Мониторинг по SNMP с помощью Zabbix — это универсальное и надёжное решение для централизованного наблюдения за сетевой инфраструктурой. Он предоставляет возможность подключать устройства сторонних производителей, получать детальную техническую информацию, создавать индивидуальные триггеры и автоматизировать контроль за ключевыми ресурсами.
Благодаря этому обеспечивается стабильная работа сети и своевременное реагирование на инциденты. Гибкая настройка, поддержка масштабирования и наличие готовых шаблонов делают Zabbix оптимальным выбором для построения современной системы мониторинга.
А если вы хотите углубиться в тему и освоить Zabbix на профессиональном уровне — обратите внимание на курс Zabbix 6. Мониторинг IT инфраструктуры предприятия. Это практическое и структурированное обучение, созданное с учётом реальных задач, с которыми сталкиваются системные администраторы и инженеры мониторинга.
Вам понравилась эта статья? Тогда вам, скорее всего, будет интересна другая полезная статья Мониторинг серверов Windows с помощью агента Zabbix.
Интересуешься IT и системным администрированием? Подпишись на SysAdminHub в телеграмм, чтобы узнавать обо всем первым — t.me/SysAdminHub
Статья была полезна? Поддержи автора, и благодаря твоей помощи новые материалы будут выходить еще чаще:
Upgrade & Secure Your Future with DevOps, SRE, DevSecOps, MLOps!
We spend hours on Instagram and YouTube and waste money on coffee and fast food, but won’t spend 30 minutes a day learning skills to boost our careers.
Master in DevOps, SRE, DevSecOps & MLOps!
Learn from Guru Rajesh Kumar and double your salary in just one year.
Get Started Now!
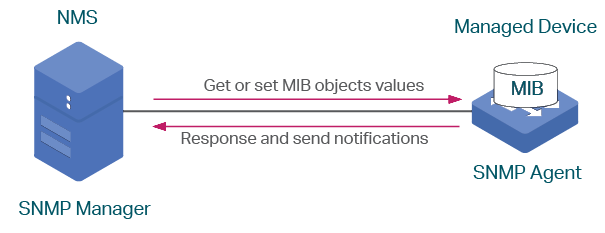
Lets understand about SNMP first?
The name “Simple Network Management Protocol,” also known as SNMP, sounds like this methodology is a quick but inferior alternative to a better protocol. In fact, SNMP is the universal monitoring standard for network devices and it is implemented in all of the network equipment that you buy. There is no better system
SNMP Version supported by Zabbix
- SNMPv1
- SNMPv2, and
- SNMPv3
SNMPv1 Vs SNMPv2 Vs SNMPv3
The differences between SNMPv1, SNMPv2, and SNMPv3 are functional. The main distinctions:
- SNMPv1, which is the oldest version is not secure as it’s not encrypted. The only thing that is used to confirm communication between the monitoring host and a device is the community. SNMP community is configured on the device and then used by the agent to get a metric. In addition, SNMPv1 is limited only to 32-bit counters and is outdated.
- SNMPv2 is not encrypted as well and uses only the community for identification (community name). SNMPv2 is able to use 64-bit counters.
- SNMPv3 allows encrypting communication between the network device and Zabbix server or Zabbix proxy, as well as for proper identification with the username and a password.
SNMPv3 is much more secure but it is also much more complicated to maintain as you need to create the users and set a lot of parameters, such as Context name, Security name, Security level, etc. You also need to maintain this configuration in all monitored environments and devices.
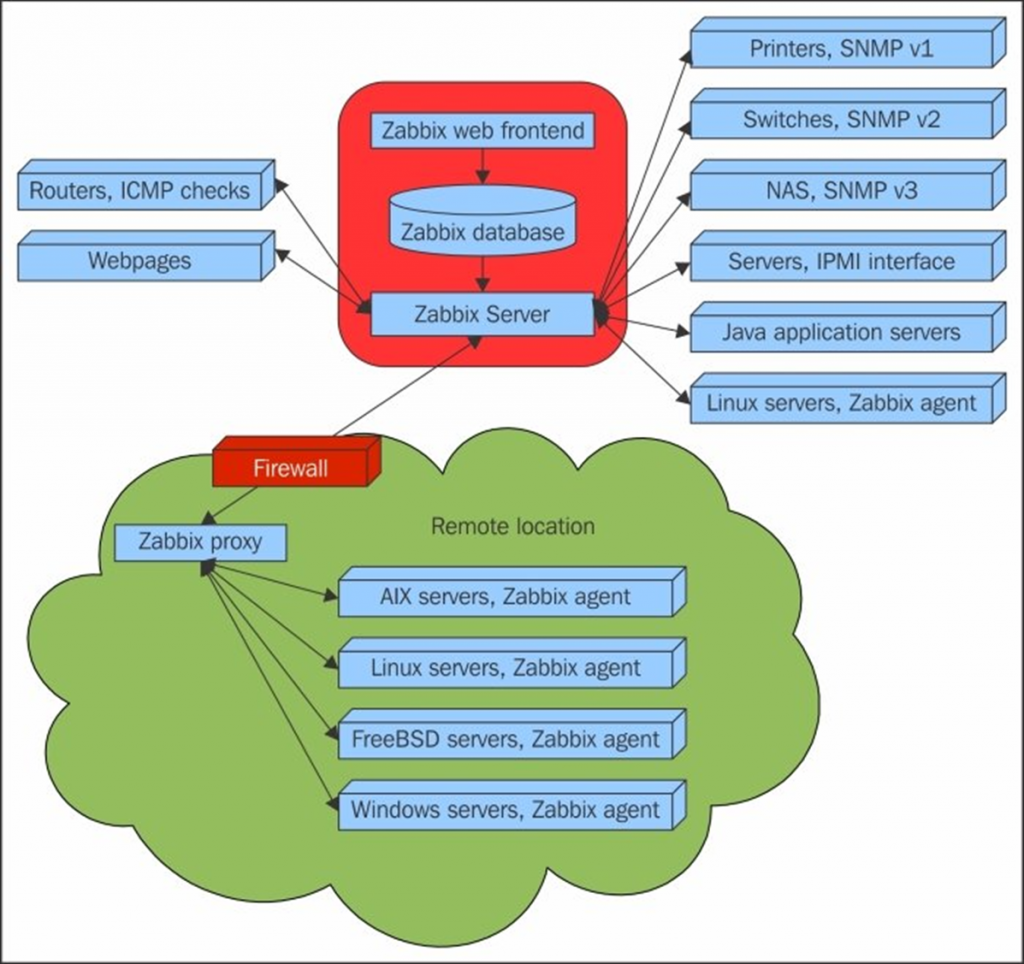
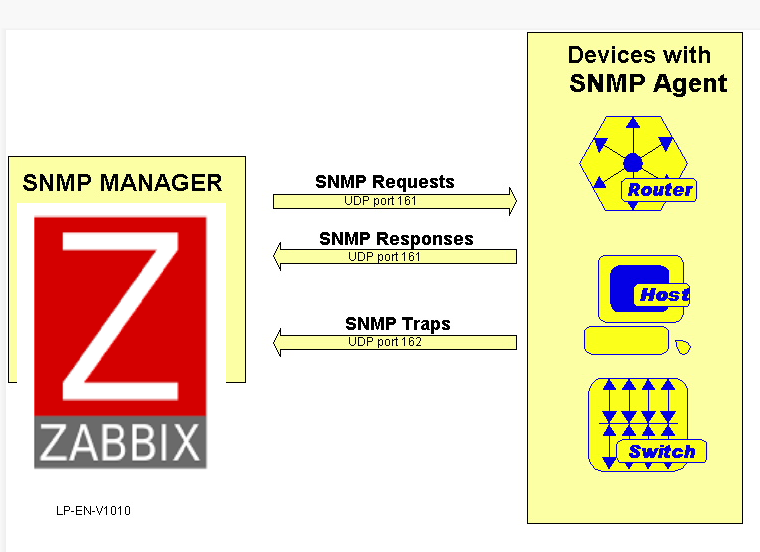
How SNMP works with Zabbix?


Zabbix Template for SNMP
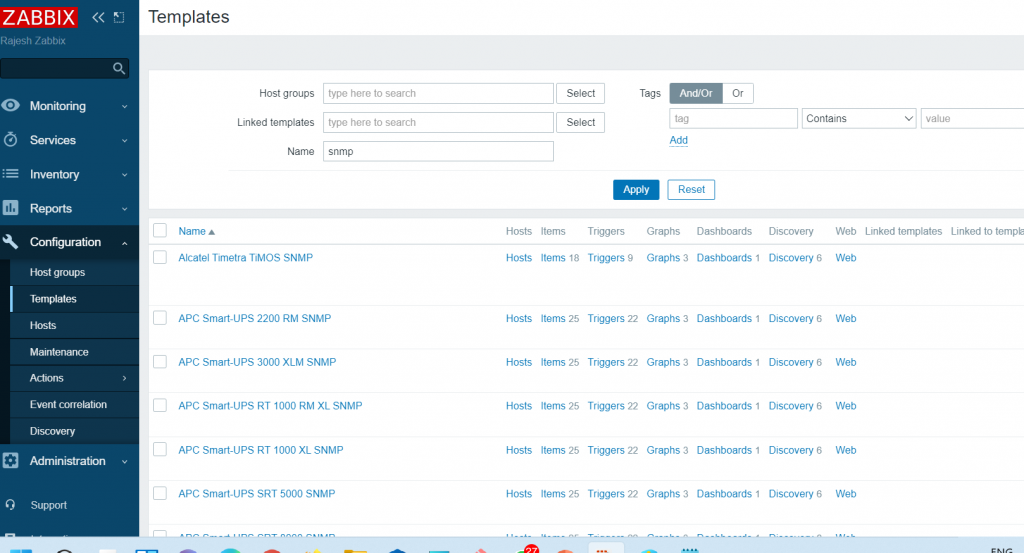
- Generic SNMP
- Interfaces SNMP
- Interfaces Simple SNMP
- Network Generic Device SNMP
- HOST-RESOURCES-MIB storage SNMP
- EtherLike-MIB SNMP
- 3rd Party Solutions
Refer Link here for details
What is an SNMP trap?
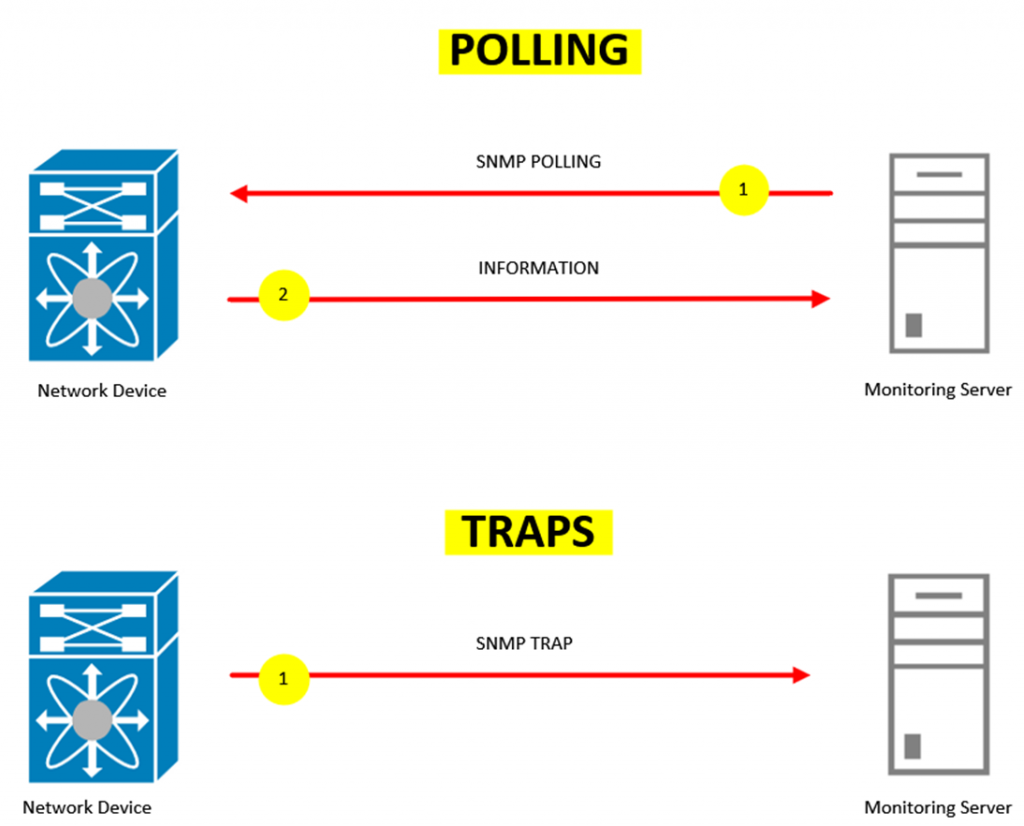
The normal operations of SNMP dictate that the device agent takes a passive role. It only sends out SNMP messages when prompted by a request from the SNMP manager. However, if the agent detects an emergency event on the device that it is monitoring, it will send out a warning message to the manager without waiting to be polled for data. This emergency message is called a trap.
Step 1 – Configure SNMP Agent
Certification Courses
DevOpsSchool has introduced a series of professional certification courses designed to enhance your skills and expertise in cutting-edge technologies and methodologies. Whether you are aiming to excel in development, security, or operations, these certifications provide a comprehensive learning experience. Explore the following programs:
- DevOps Certification — Learn the fundamentals and advanced concepts of DevOps practices and tools.
- DevSecOps Certification — Master the integration of security within the DevOps workflow.
- SRE Certification — Gain expertise in Site Reliability Engineering and ensure reliability at scale.
- MLOps Certification — Dive into Machine Learning Operations and streamline ML workflows.
- AiOps Certification — Discover AI-driven operations management for next-gen IT environments.

Explore our DevOps Certification, SRE Certification, and DevSecOps Certification programs at DevOpsSchool. Gain the expertise needed to excel in your career with hands-on training and globally recognized certifications.