
07.11.2018 — Мониторинг температуры процессора c оповещением в Zabbix
Продолжаем цикл статей по мониторингу узлов ИТ-инфраструктур клиентов на базе Zabbix, который мы активно используем в нашей повседневной работе по абонентскому обслуживанию серверов.
Сегодня речь пойдет о том, как мониторить температуру процессора используя Zaabbix и сторонние программы, так как zabbix использую лишь агента по умолчанию этого делать не умеет. Будем считать, что у вас уже есть функционирующая инфраструктура мониторинга в которую необходимо добавить отслеживании температуры CPU.
Настройка на стороне клиента
Настраивать все это будем на Windows Server 2008 R2 c процессором Intel Xeon E5-2609. Программа с которой будем забирать данные температуры называется «OpenHardwareMonitor» то есть ее консольная версия» OpenHardwareMonitorReport». Также настроим скрипт на PowerShell который будет выполнятся zabbix агентом и полученные данные передавать на сервер.
И так начнем, программу и скрипт можете скачать тут. Скаченную папку нужно положить по пути C:\Tools\Zabbix_Agent\ как показано на скриншоте ниже.

Прежде чем продолжать настройку дальше, нужно убедиться, что данные с OpenHardwareMonitorReport.exe можно получить. Для этого нужно в консоли выполнить следующую команду «c:\> C:\Tools\Zabbix_Agent\OpenHardwareMonitor\OpenHardwareMonitorReport.exe > c:\Tools\Zabbix_Agent\OpenHardwareMonitor\test.txt» После это откройте созданный файл и проверти что в нем есть строки показывающие температуру.

Отлично, данные есть можно продолжать. Следующий этап — это проверка работы скрипта на PowerShell. Он лежит в той же папки и называется cputemp.ps1. Для его выполнения откройте PS и выполните его. «PS C:\> C:\Tools\Zabbix_Agent\OpenHardwareMonitor\cputemp.ps1 0» Ноль в конце команды обозначает порядковый номер процессора, у меня их два так что первый будет «0» второй «1».

Стоит сразу сказать, если у вас CPU не Intel в скрипте нужно будет заменить название, также если при выполнении у вас ничего не выходит то измените значение «$words[15]» на 16 или 14, это номер символа от начала строки который нужно выводить.
Настройка Zabbix агента
Теперь откроем файл конфигурации агента и внесем туда следующие изменения.

Ниже приведу ряд обязательных параметров, которые должны присутствовать:
- ServerActive=192.168.155.1 – пишем адрес сервера zabbix
- UserParameter=TemperatureCPU[*], powershell C:\Tools\Zabbix_Agent\OpenHardwareMonitor\cputemp.ps1 $1 – наш параметр «TemperatureCPU[*] »который будем задавать на сервере для получения данных
- Timeout=15 – время ожидания, так как скрипт выполняется секунд 5 то серверу надо сказать чтобы он ждал 15 секунд получения данных. Можно и меньше указать, но лучше, как я взять с запасом.
После всех внесенных изменений перезагружаем агента и переходим к настройке сервера.
Для удобства советую вам создать шаблон и добавлять туда все элементы данных со всеми возможными процессорами, а после добавлять его к узлам и отключать ненужные. И так, переходим в настройке нашего узла и добавим элемент данных.

- Имя – понятное вам название
- Тип – zabbix агент активный
- Ключ – как раз то название «UserParameter=TemperatureCPU[*]» которое мы указывали в конфигурации агента, в скобках пишем порядковый номер процессора.
- Единица измерения — ℃ (просто для красоты)
Остальное можно оставить как есть, сохраняем, перезагружаем еще раз агента и проверяем в последних данных приходит ли что-нибудь.

Отлично, все работает! Заметьте у меня два процессора, и я добавил два элемента данных, вы же добавляете столько сколько их у вас.
На сегодня все, если будут вопросы пишите, наши инженеры с радостью решат ваши задачи!

DevOps & SysAdmins: Lightweight temperature monitoring on Windows Server 2008
Helpful? Please support me on Patreon: https://www.patreon.com/roelvandepaar
With thanks & praise to God, and with thanks to the many people who have made this project possible! | Content (except music & images) licensed under CC BY-SA https://meta.stackexchange.com/help/licensing | Music: https://www.bensound.com/licensing | Images: https://stocksnap.io/license & others | With thanks to user Zenham (serverfault.com/users/8438), user nik (serverfault.com/users/4721), user Laura Thomas (serverfault.com/users/3235), user Brohan (serverfault.com/users/8146), user Brian Spolarich (serverfault.com/users/11904), and the Stack Exchange Network (serverfault.com/questions/31157). Trademarks are property of their respective owners. Disclaimer: All information is provided “AS IS” without warranty of any kind. You are responsible for your own actions. Please contact me if anything is amiss at Roel D.OT VandePaar A.T gmail.com
source
windows server
Прочитано: 5 635
Всегда хотел знать об обслуживаемой системе чуточку больше – это как хобби которое нравится, стараешься узнать максимум всей информации. А в моем случае хобби совпадает с работой и я собственно рад этому. Цель данной заметки практически воспроизвести все действия которые нужно сделать чтобы снимать показатель температуры процессора, но если Вам не известно, то штатных средств для этой простой задачи в системе Windows 7 к сожалению нет. Что же мне даст в конечном итоге данный съем показателей температуры, а вот что, если температуры держится всегда на достаточно высоком уровне, то возможно не лишним будет произвести чистку системного блога, от пыли, заменить термопасту, сделать тщательный осмотр системного блога. И вот я перехожу к самому главному, раз нет встроенных средств, то буду использовать сторонние, а именно консольную утилиту для решения данной задачи – OpenHardwareMonitor, состоит она из двух файлов, exe-исполняемого файла и dll-библиотеки.
- OpenHardwareMonitorReport.exe
- OpenHardwareMonitorLib.dll
Настраиваю сервер по мониторингу Zabbix если не настроен по своей заметке:
Первым делом ставлю агент Zabbix по своей заметке:
Где брать данные мы поняли, теперь нужно наладить поставки значений показателей Zabbix серверу.
Для этих целей создам новый Template и в нем создам новый элемент данных (Item), захожу на Zabbix сервер:
http://IP&DNS – Configuration – Templates – Create template
Template Name: Template Hardware
Groups: OFFICE (это мои системы в обслуживаемой сети)
Save
Перехожу в созданный Template и в нем создаю приложение и элемент данных:
Configuration – Templates – Template Hardware – Applications – Create Applications
Name: CPU
Configuration – Templates – Template Hardware – Items – Create Item
Привожу к виду:
Name: CPU Template
Type: Zabbix agent
Key: Temperature.CPU[0]
Type of information: Numeric (unsigned)
Data type: Decimal
History storage period (in days): 90
Trend storage period (in days): 365
Application: CPU
Enabled: Yes
Save
Теперь нужно связать данный Template с хостом рабочей станции под управлением Windows 7:
Http://IP&DNS – Configuration – Hosts – выбираю хост (Name = aollo) – вкладка Templates – select (Group: Office, Template Hardware), нажимаю Select – после Add – после Save (для сохранения изменений)
Настройки серверного описания завершены, теперь перейдем собственно к клиенту, потребуется в конфигурационный файл Zabbix агента (zabbix_agentd.win.conf) на клиентской станции под управлением Windows 7 добавить пользовательский параметр: – UserParameters следующего вида:
Синтаксис: UserParameter=ключ[*],команда
Как этот синтаксис работает:
Команда, через которую мы получим значение, обрабатывается на стороне клиента. Zabbix сервер будет получать ключ с присвоенным ему значением. В статье имеется в виду, что агент у вас уже установлен в виде службы и дружит с сервером.
Открываем текстовым редактором Notepad++ конфигурационный файл (zabbix_agentd.win.conf) и добавляем следующую строчку:
UserParameter=Temperature.CPU[*],c:\script\temperature.bat
Теперь пояснения:
temperature.bat – это скрипт который задействует консольную утилиту OpenHardwareMonitorReport и некоторые дополнения по обработке получаемых результатов в системе Windows 7 текущей станции.
Для всех дополнений, снимаемых с рабочей станции я в системе создал каталог: c:\script и в него поместил следующие файлы:
- OpenHardwareMonitorReport.exe
- OpenHardwareMonitorLib.dll
- temperature.bat
Теперь продемонстрирую содержимое bat–файла для извлечения значения температуры из системы:
@echo off
for /F "usebackq tokens=7-10" %%a in (`C:\script\OpenHardwareMonitorReport.exe`) do echo %%b %%c %%d| find "/intelcpu/0/temperature/0">nul && set temper0=%%a
echo %temper0%
Скрипт возвращает значение в виде десятичного числа.
Можно также проверить, что параметр по ключу успешно извлекается:
c:\Program Files (x86)\zabbix>zabbix_agentd.exe --config zabbix_agentd.win.conf
--print | findstr Temperature
Temperature.CPU [t|52]
Видите, значения извлекаются, все работает.
После этого изменения конфиг файла и размещения всех файлов и скриптов, перезагружаем службу zabbix agent.
c:\Program Files (x86)\zabbix>net stop “Zabbix Agent” && net start “Zabbix Agent”
Служба “Zabbix Agent” останавливается.
Служба “Zabbix Agent” успешно остановлена.
Служба “Zabbix Agent” успешно запущена.
Теперь нужно связать хост
Начинаем получать значения на сервер:
http://IP&DNS – Monitoring – Latest data – Group (OFFICE):Host(aollo) – опускаемся в самый низ и видим новую категорию: -other – развернув которую можно наблюдать извлекаемые значения:
CPU Temperature Jan 22nd, 2015 06:14:56 AM 52 +2 Graph
Нажимаю Graph и получаю уже сейчас собранную статистику:
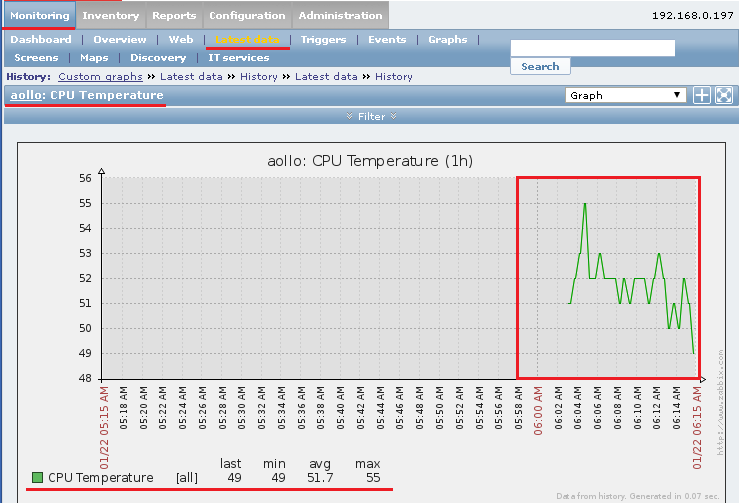
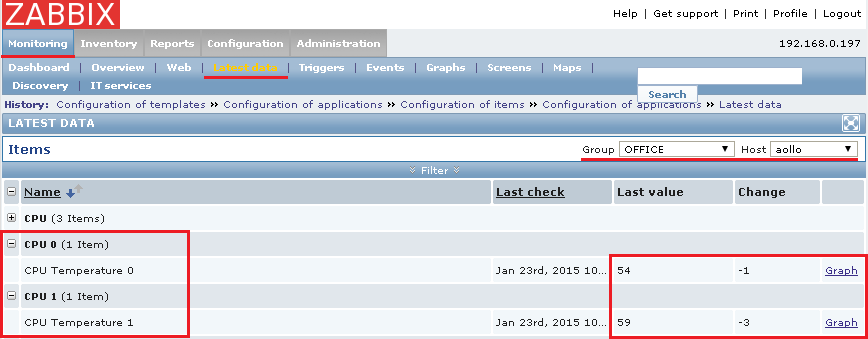
Работает, но это для одного CPU[0], а если из два CPU[1], то нужно:
Изменяем на клиенте конфигурационный файл:
LogFile=c:\zabbix_agentd.log
LogFileSize=10
Server=192.168.0.197
ListenPort=10050
Hostname=aollo
UserParameter=windows.services,"%ProgramFiles%\zabbix\services.exe"
UserParameter=Temperature.CPU0[*],c:\script\temperature0.bat
UserParameter=Temperature.CPU1[*],c:\script\temperature1.bat
c:\Program Files (x86)\zabbix>zabbix_agentd.exe –config zabbix_agentd.win.conf
–print | findstr Temperature
Temperature.CPU0 [t|51]
Temperature.CPU1 [t|60]
И также изменяем/дополняем элемент данных на сервере:
Теперь последние снимаемые данные с рабочей станции график уже пишутся и строятся отдельно.
Работает съем данных, проверил, что данные идут с клиентских рабочих станций различных материнок и в довесок с моего ноутбука Lenovo G700, а вот с серверной материнки (ProLiant DL180G6) данные с помощью данной утилиты вообще не снимаются, так что в отсутствие стандартизированных компонентов в малой компании подбор различных параметров которые нужно мониторить работа системного администратора превращается в отличное подобие квеста. Но я не отказываюсь от такого, а собираю статистику. Посмотрим, что еще можно с помощью данной консольной утилиты извлечь из системы чтобы мониторить:
c:\script>OpenHardwareMonitorReport.exe | findstr temperature
| +- CPU Core #1 : 53 52 53 (/intelcpu/0/temperature/0)
| +- CPU Core #2 : 59 59 59 (/intelcpu/0/temperature/1)
| +- GPU Core : 38 38 38 (/nvidiagpu/0/temperature/0)
Вот еще можно GPU мониторить, т.е. температуру графического процессора.
Возможно, если найти более функциональную утилиту консольного вида то съем различных параметров можно расширить, но не стоит стараться охватить все, следует остановиться, только на самом нужном и значимом в практическом применении, не тратьте время попусту. А вот и график за период в шесть дней, как меняется температура на моем рабочем ноутбуке с течением выполняемых задач (наверное, как-то так), и конечно же удовольствие от проделанной и визуализированной работы.
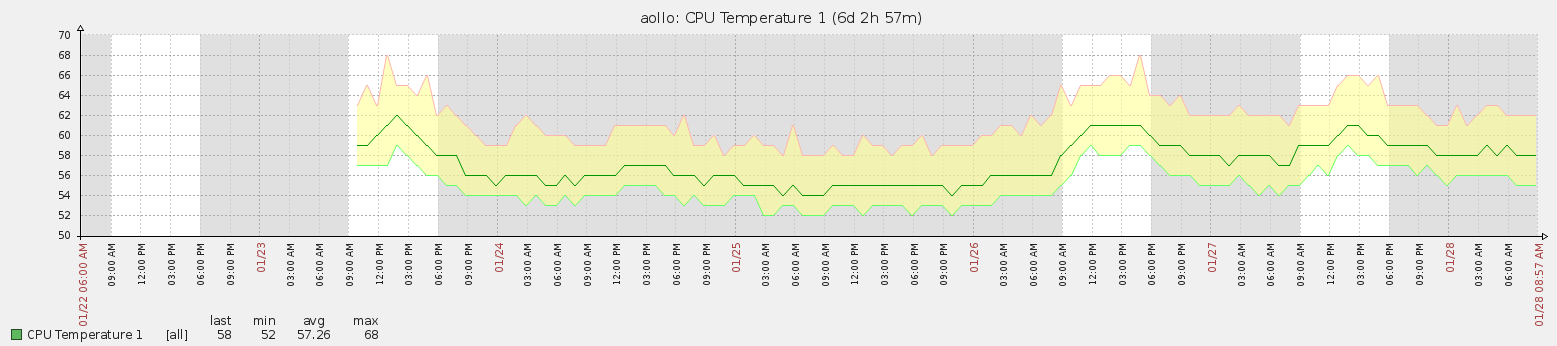
А так заметка полностью работоспособна, теперь буду прощаться. До встречи, с уважением – автор блога ekzorchik.
Introduction
Monitor the CPU temperature of your Windows or Linux computer to keep it running smoothly. You can help with this by using contemporary CPU temperature monitoring software.
Why do you require it?
The fact is, every PC produces heat. It can only withstand so much heat before the hardware starts to malfunction. The PC has numerous components, including a motherboard, hard drive, and more, and while operating, it generates heat. Before a threshold, the heat is normal, but it might seriously harm the CPU if it isn’t controlled.
So, if the temperature rises unusually, you can face a sudden system shutdown. While working, you or the other employees can notice a slowdown in their performance. In the worst instance, heat could harm the CPU’s motherboard, essential chips, or other components.
You must use a CPU temperature monitoring program to monitor your computer CPU to prevent all of these and safeguard your system and its performance.
What is a tool for monitoring CPU temperature?
CPU temperature monitors are software tools that provide precise information while checking the temperature of your CPU, voltage, fan speed, battery, and other components. You can take steps to protect your CPU by collecting these metrics from sensors.
These tools have a lot of beneficial characteristics, including:
- enabling high levels of customization
- supplying thorough information on the computer’s hardware
- displaying the CPU temperature in real-time
- the ability to measure bandwidth and usage
Who Needs to Monitor CPU Temperature?
CPU temperature monitors can be helpful for everyone, from casual computer users to busy professionals. The CPU temperature can increase for a variety of reasons, including:
In particular, CPU temperature monitoring is helpful for:
Gamers: They play expensive video games that need potent computers. So the temperature may rise while kids play video games. Gamers also upgrade their computers’ components and overclock them to improve online gaming performance. The CPU temperature may increase as a result of these.
Graphic designers: Just like gamers, graphic designers need fast computers to complete their work quickly.
Professionals: People working on computers for long periods often notice their PCs getting warm. They might also come across worms from the internet, networks, or emails, Trojans like Rootkit and backdoors, and viruses like file and system infectors and macros. Any of these can cause the CPU to become hotter.
What is the normal CPU temperature?
CPU must operate at the right temperature to function at its peak. When working under light loads, most CPUs function at a relatively low temperature; as workloads increase and more processing power is required, the temperature rises.
A temperature that is too high may cause components to malfunction or operate poorly. The performance of modern CPUs can be throttled if the CPU becomes too hot, thanks to built-in thermal protection. The PC may occasionally shut down due to a hot CPU. Consistently high temperatures can cause damage to components or hasten normal degradation.
You can place CPU temps in one of three categories:
Normal: When your computer isn’t in use, it may be 45 to 50 degrees Celsius.
Average: When using the computer for demanding operations like playing videos, manipulating graphics, processing videos, and other things, the temperature can reach an average of 70 to 80 degrees Celsius.
High: If you undertake more demanding duties, raising the temperature and load, the temperature can reach 80 to 100 degrees Celsius. This temperature causes a decrease in clock speed. Therefore, it is essential to examine and lower this temperature.
Laptops: Laptops operate at a higher temperature than PCs because they have more tightly packed components and less airflow. With a light load, a laptop’s permissible temperature range is roughly 160 to 170 degrees Fahrenheit (71 to 80 degrees Celsius). Temperatures on a laptop, while it is playing games, can get as high as 190 degrees Fahrenheit (88 degrees Celsius).
But what if the temperature is higher than 80 degrees Celsius?
Do this:
- Please verify that your computer’s fan spins when the specified load is applied and that it is dust-free.
- Ensure the computer is kept in a cool atmosphere because too much heat and humidity in a room can damage it.
- Stop overclocking or boost the Windows/Linux CPU’s speed. Because overclocking improves computer speed while also producing more heat
- You can also use thermal paste between the CPU and its cooler in a three-year interval.
Why should you use a CPU temperature monitor tool?
increases the performance of computers
The performance of the computer is impacted by increased CPU heat. While working, you can suffer slower speed, which can kill your productivity. Thus, a CPU temperature monitor enables you to ensure that your computer operates at peak efficiency.
Prevents the PC from heat damage
Extreme heat can seriously harm your CPU and its components. It will consequently begin to malfunction and shut off suddenly. This temperature can be detected by the CPU temperature monitor, allowing you to take timely precautions to avoid potential harm.
increases the computer’s durability
Suppose you can use the CPU temperature monitor to protect the CPU from extreme heat, humidity, and other harmful elements. In that instance, your computer system’s lifespan is being extended.
Ensure the data center’s dependability and uptime
Optimal environmental conditions for the computer are required in a data center to achieve the highest levels of uptime and dependability. It offers suggested settings for things like humidity, electricity, and temperature. It would help if you used internal and external sensors to monitor your server rooms.
So, let’s look at some of the top Windows CPU temperature monitors to see how they may help you control the heat generated by your computer’s CPU for optimum performance, dependability, and longevity.
Windows CPU temperature monitors tool
Core Temp
Try Core Temp’s most recent version to monitor the temperature if you are worried about your computer’s CPU. The program is easy to use and has a small, lightweight footprint while being robust enough to track CPU temperature and other data.
It shows the temperature of each processor core in the system individually. Real-time temperature changes will correspond to the changing workloads. In each central processor, there is a Digital Thermal Sensor that is independent of the motherboard.
Compared to conventional thermal sensors, the D.T.S. provides greater resolution temperature measurements that are also more precise. Recent x86 CPUs from AMD, VIA, and Intel include D.T.S. Core Temp is straightforward to use, enabling high-level customization and expandability.
With the help of additional capabilities, add-ons and plugins can expand the capability of Core Temp. The CPU’s temperature can be checked from the outside in both Windows and Android phone devices. The most recent version includes a graph view, memory usage, and a CPU load/temperature listing.
To enhance text color, size, and information, download CoreTempMC and Core Temp Gadget. The latest version includes compatibility for AMD Zen 2 and Zen 3 APUs, Intel Rocket Lake, Preliminary Alder Lake, and Meteor Lake.
Download the app to access a wealth of important data while on the go. Windows 10, 8, 7, Vista, XP, 2016, 2012, 2008, and 2003 servers are all supported. It supports Intel, AMD, and VIA x86 processors.
NZXT CAM
The NZXT CAM temperature monitor is the finest for gaming PCs. From a single app, it can control the temperature, gadgets, and performance. It is a quick, simple, and effective tool that allows you to access and manage every aspect of the computer.
You may view every internal computer activity using NZXT CAM, from processor load to bandwidth usage. Additionally, you may monitor how each machine’s applications are doing and find problems fast to improve computer performance.
Track temps, bandwidth, frame rates, and more while playing games with an extremely steady, less disruptive, in-game overlay. Time played, current frame rate, GPU/CPU temperature, battery level, GPU/CPU load, and many other variables are supported by NZXT CAM.
You can manage fan speeds, P.S.U. Voltages, case lighting, and more using its stunning and simple U.I. Start by downloading the latest C.A.M. software and monitoring the CPU temperature.
Speccy
You may save time by finding all the information you need to acquire stats on your motherboard, CPU, graphics cards, RAM, and other components in a single interface. By monitoring the temperatures of the vital components, you can become an expert at resolving issues before they arise.
It allows you to share your results by allowing you to save them as an XML, text file, or snapshot. Check your computer’s specifications to see if any problems need to be diagnosed. The tool enables you to increase PC performance without replacing their hardware. For advanced PC insights, download the free edition. To unlock additional capabilities, purchase the tool.
SolarWinds CPU Load Monitor
SolarWinds CPU Load Monitor is the best tool for simultaneously monitoring and charting the load on several Cisco routers.
An engineer’s toolkit is included with SolarWinds CPU Load Monitor. Business networks are frequently susceptible to viruses, raising the routers’ traffic load and CPU stress. This program allows it to simultaneously monitor and graph the load on several Cisco routers. This will enable you to stay one step ahead of issues.
Features:
- You may adjust each device’s warning and alert thresholds with SolarWinds CPU Load Monitor.
- It can concurrently track and graph the load on several Cisco routers.
- It supports SNMP version 3 and IPv6.
- The user-defined threshold for the warning will be indicated by the yellow load bar, and the user-defined critical level will be indicated by the red load bar.
- You will access over 60 network management tools with Engineer’s Toolset.
Open Hardware Monitor
Open Hardware Monitor is free software that monitors a computer’s temperature sensors, clock speeds, load, and fan speeds. It supports a wide variety of mainboard-mounted hardware monitoring chips.
The software scans the core temperature sensors of AMD and Intel processors to determine the CPU temperature. It displays the sensors for the Nvidia and A.T.I. video cards in addition to the hard drive’s temperature and SMART.
The values are shown on a desktop gadget that you can customize and in the system tray’s main window. Without installation, Open Hardware Monitor works with Linux and x86-based 64- and 32-bit versions of Microsoft Windows XP, Vista, 7, 8, 8.1, and 10.
Additionally, it develops new features and addresses bugs. It has improved its AMD GPU support, AMD GPU, and CPU labels and can now recognize ITE IT8655E, IT8686E, and IT8665E super I/O chips. It also improves fan R.P.M. calculations made by the Nuvoton NCT679XD super I/O.
The program utilizes the 4.5 version of the.NET framework and Microsoft Windows. Install the software by unzipping the downloaded Zip file, then start monitoring.
HWMonitor
Do you need to monitor your computer’s voltages, fans’ speeds, and temperatures?
Try the hardware monitoring application HWMonitor and give it access to the PC’s health sensors. It manages common sensor chips such as the ITE IT87 series, Winbond I.C.s, and others. The hard drive’s temperature, the chip’s CPU, and the visual card’s GPU may all be read via SMART.
Voltages, temps, and fan speed may all be tracked with HWMonitor. The application is compatible with most Winbond I.C.s, common sensor chips, etc. Hard drive temperatures, video card GPU temperatures, and on-die thermal sensors for CPUs may all be accessed using HWMonitor. S.M.A.R.T. is used to read the hard disk temperatures.
HWMonitor Pro adds features to the original HWMonitor. It also offers a more user-friendly U.I.
HWiNFO
Access detailed reporting by interacting with numerous reports, add-ons, tools, and status logging. It supports AMD and Intel families’ chipsets, graphics cards, and processors. Furthermore, it aids in the detection of overload, performance loss, and overheating.
The program also keeps track of many hardware and system metrics, including motherboards, drives, peripherals, CPUs, and GPUs. The output can be exported as reports in CSV, HTML, and XML. Additionally, it will display the results in various forms, including tables, O.S.D.s, tray icons, etc. Start examining what’s happening within your PC after downloading the software.
AIDA64
Are you looking for market-leading system information, diagnostic, and benchmarking solutions for engineers and corporate I.T. technicians?
Choose AIDA64. It contains a hardware identification engine that offers detailed information about the software and functions for overclocking and diagnostic support. Additionally, it keeps an eye on the sensors to record precise values for voltage, temperature, and fan speed, and its diagnostic feature aids in identifying and averting hardware problems.
The program provides benchmarks for assessing both system-wide and individual hardware performance. Additionally, Windows Server 2019 and Windows 10 64-bit and 32-bit variants are compatible with AIDA64 Engineer.
How to check CPU temperature on Ubuntu Linux
You must set up the lm sensor utility for Linux hardware monitoring. This program offers certain command-line utilities for Linux systems that incorporate hardware health monitoring gear, such as CPU and fan speed. The steps below are compatible with CentOS/R.H.E.L. versions 7 and 8.
sensors
Launch the terminal.
Type:
sudo apt install lm-sensorsType the following command:
sudo sensors-detectThen it would help if you found any hardware monitoring chips that have been put in your computer. Start by detecting the hardware sensors on your laptop that will give you information about:
CPUs and other powerful I/O processors contain sensors.
I/O ports and the SMBus/I2C bus on your system provide access to hardware monitoring chips.
Type the following command:
sensorsThe sensors command can be run repeatedly using the watch command, with the results shown on screen:
watch sensorsInstall sensors package on CentOS or RHEL 7 / 8
Type the yum command:
sudo yum install lm_sensorsRun the following command:
sensorsGlances
Glances is a cross-platform, sophisticated, and well-liked real-time system monitoring program that collects data from multiple system resources using the psutil library.
The psutil and/or hddtemp utilities can be used to display data from sensors. The webserver mode, which lets you access it using a web browser to monitor your Linux server remotely, is one of its unique features.
There are several ways to install Glances on your system, but utilizing an auto-install script, which will install the most recent production-ready version, is the recommended technique.
Use the curl or wget command as directed to install Glances on your PC.
curl -L https://bit.ly/glances | /bin/bashOR
wget -O- https://bit.ly/glances | /bin/bashAfter installation, launch Glances and hit the f key to access sensor data.
glancesHardinfo
The system profiler and benchmark program Hardinfo is compact and built for hardware analysis and report creation. It offers thorough data on system hardware and enables the creation of HTML reports on your system’s hardware.
Run the following command to install the hardinfo package on your Ubuntu Linux machine.
sudo apt install hardinfoYou can use the following command to launch hardinfo after the installation is finished and display device details.
hardinfo -rma devices.soi7z
A little command-line tool called i7z provides information about Intel Core i7, i5, and i3 CPUs, including temperatures. By executing the following command, you can install it on your Ubuntu machine.
sudo apt install i7zAfter installation, type:
sudo i7zConclusion
Your PC might suffer serious damage from high temperatures. Dust, infections, playing expensive video games, or other time-consuming tasks could all be blamed. Whatever the situation, take care of your computer using the finest CPU temperature monitoring tool to keep the CPU from overheating, enhancing its functionality, dependability, and lifespan.
How do I check the temp of my CPU?
Open the Settings and navigate to the Monitoring tab. Scroll down and click CPU Temperature, then select the box for Show in On-Screen Display.
How can I see my temperature in CMD?
How can I get the CPU temperature in a cmd shell? Try the following. function Get-Temperature { $t = Get-WmiObject MSAcpi_ThermalZoneTemperature -Namespace “root/wmi” $currentTempKelvin = $t.
What program can check CPU temp?
SolarWinds CPU Load Monitor, HWMonitor, Open Hardware Monitor, HWiNFO, and Core Temp are our top recommended CPU Temp Monitors. SolarWinds CPU Load Monitor, HWMonitor, Speccy, ManageEngine OpManager, and AIDA64 Extreme are the commercial tools. Out of these commercial tools, HWMonitor and Speccy offer a free plan.
How do I check my CPU and GPU temp?
Right-click on the Windows desktop, select Radeon Settings, and then head to Gaming > Global Settings > Global Wattman. After promising not to blow up your graphics card if you apply a wild overclock with the tool, you’ll gain access to Wattman, which tracks GPU temperature and other key statistics in graph form. Done!Sep 20, 2021.
Can you check CPU temp in BIOS?
Method 1 of 3: Your BIOS is the menu that lets you adjust your computer’s basic settings. Most BIOS interfaces have a hardware monitor built-in, which will allow you to check the temperature.
How do I check my CPU temperature Gigabyte?
The easiest way to check the CPU temperature is through your motherboard’s BIOS. To access the BIOS: Turn on or restart your PC. During the boot-up sequence, once you hear the signal beep, start pressing the Delete key on your keyboard until the BIOS pops up.
What is normal CPU temp?
Normal Idle CPU Temperature What is this? Idle CPU temp refers to the temperature of your desktop computer whenever you leave it idle. A normal temperature for idle PCs clocks in between 30 to 40 degrees C or 86 to 104°F.
What CPU temp is too high?
But, as a generalization that might help you identify a serious problem, if you have an Intel processor, you could say that a CPU core temperature of over 40-45-degrees Celsius while idling and/or a temperature of over 85-95-degrees Celsius while under full load is probably a cause for concern.
What is a good CPU temp in BIOS?
Your CPU should be at a range of 30 to 50 degrees Celsius. If your temperatures are above 80 degrees Celsius, your computer is getting too hot and could be overheating.
How do I check my CPU temperature with MSI Afterburner?
How do I make MSI Afterburner show CPU temperatures? Download and install MSI Afterbuner. Click on the MSI Afterburner icon. Click on the Settings cog in MSI Afterburner. Go to the Monitoring tab. Scroll down until you see CPU temperature on the list. Click on it and then check the box that says Show in On-Screen Display.
How do I check my CPU temperature Hwinfo?
How do I lower my CPU temperature?
System cooling 101: Ten easy ways to cool down a computer Keep your system away from vents and windows. Give your system some breathing room. Close your system’s case. Clean your fans. Upgrade your CPU fan. Add a case fan. Add a memory cooling fan. Check your system’s power supply fan.
Is 70c too hot for CPU?
Honorable. 70-80c is normal range for a CPU under full load. Only worry about temps over 80c.
How do I fix my CPU overheating?
How to cool down your computer Don’t block your computer’s vents. Use a laptop cooling pad. Avoid using programs that push your computer’s CPU limits. Clean your computer’s fans and vents. Change your computer’s settings to improve its performance. Shut down the computer.
How do I change my CPU temp limit?
In Windows. Control panel > Power options > Advanced, you can set Max CPU to less than 100% but it will also have repercussions on game FPS but without having to dig thru BIOS. In games, lower details which should also result in less work for CPU.
Does high temp damage CPU?
Running for extended amounts of time above 85 degrees can seriously damage your CPU. If your CPU does hit high temperatures, you could be thermal throttling. When the CPU temp hits about 90 degrees, the CPU will automatically self-throttle, slowing itself down so it cools.
Can you check CPU temp Windows 10?
There is no such option to check CPU temperature in Windows 10. You can either check the temperature in BIOS or you can use third-party applications.
How do I check my motherboard temperature?
To find your CPU temperature, scroll down to the entry for your CPU–mine, for example, is an “Intel Core i7 4930K”–and look at the “Core #” temperatures in the list. (Note that “Core Temperature” is different than “CPU Temp”, which will appear under the motherboard section for some PCs.
Is 80c safe for a CPU?
Anything more than 60 degrees for a CPU is dangerous. 70c is safe for i series. Laptop cpus can get even hotter, usually 80c is fine.
How do I check my GPU temp?
All you have to do is press CTRL + SHIFT + ESC and click the Performance tab. On the left, look for your GPU. You should see your temperature listed here.
Is 90 degrees hot for CPU?
If you are hovering around 70 to 80 degrees Celsius, some would say that it is generally safe. While it is a little bit safe, it is already near the danger levels of overheating as going close to 90 degrees while gaming can get your CPU damaged over time. The harder your CPU gets worked, the faster it could wear out.
What is TDIE and TCTL?
On some AMD CPUs, there is a difference between the die temperature (Tdie) and the reported temperature (Tctl). Tdie is the real measured temperature, and Tctl is used for fan control.
What is CPU package in HWiNFO?
“Core Max or CPU Package are the most important temperatures sourced from the CPU die. CPU Package is a 256 ms average of the hottest temperature among all sensors in CPU.
Is HWiNFO better than HWMonitor?
It offers higher-quality displays and visualization than HWMonitor for the same price. That being said if you would prefer something a little more simple HWiNFO stands as the natural successor to HWMonitor with alerts and plugins for those additional monitoring capabilities.