
И есть ли в этом смысл?

Для тех, кто задумался и сомневается, я решил описать кое-что из своего опыта.
Мониторинг вообще штука полезная, бесспорно. У меня лично в какой-то период возникло сразу несколько задач:
-
Круглосуточно и непрерывно мониторить одну специфическую железку по ряду параметров;
-
Мониторить у рабочих станций информацию о температурах, ЦП в первую очередь;
-
Всякие мелочи в связи с широким внедрением удалёнки: количество подключений по VPN, общее состояние дополнительных виртуальных машин.
Подробнее про локальные задачи:
-
Надо было оценить и наглядно представить данные об интернет-канале. Канал на тот момент представлял собой 4G-роутер Huawei. Это устройство было последним, но далеко не первым в огромном количестве плясок с бубном в попытках избавиться от разного рода нестабильностей. Забегая вперёд: забирать с него данные напрямую о качестве сигнала более-менее стандартными средствами оказалось невозможно, и даже добраться до этих данных — отдельный квест. Пришлось городить дендрофекальную конструкцию, которая, на удивление стабильно, и стала в итоге поставлять данные. Данные в динамике и в графическом представлении оказались настолько неутешительными, что позволили убедить всех причастных таки поменять канал, даже и на более дорогой;
-
Данные о температуре процессора дают сразу несколько линий: можно обнаружить шифровальщик в процессе работы, наглядно сделать вывод о недостаточной мощности рабочей станции, найти повод провести плановую чистку, узнать о нарушении условий эксплуатации. Последний пункт особенно хорош: множество отказов оборудования и BSOD’ов в итоге нашли причину в «я ставлю обогреватель под стол, ну и свой баул, ну да, прям к этой решётке. А что? А я канпуктер развернула, а то неудобно»;
-
Интерфейс того же OpenVPN… ну, он в общем даже и не интерфейс и оставляет желать любого другого. Отдельная история.
Как большой любитель велосипедить всё подряд, сначала я решил свелосипедить и это. Уже валялись под рукой всякие скрипты по сбору статистки, и html проекты с графиками на js, и какие-то тестовые БД… Но тут сработала жадность (и лень, чоужтам). А чего это, подумал я, самому опять корячиться, если в том же Zabbix уже куча всяких шаблонов, и помимо задач из списка можно будет видеть много чего ещё? Да и он бесплатный к тому же. Всего-то делов, виртуалку поднять да клиенты централизованно расставить. Потренируюсь с ним, опять же, он много где используется.
Итак, нам понадобятся:
-
Виртуальная машина или физический хост. Zabbix нетребователен к ресурсам при небольшом количестве хостов на мониторинге: мне хватило одного виртуального процессора на 2ГГц и 4 Гб RAM за глаза;
-
Любой инструмент для автоматического раскидывания zabbix-agent. При некотором скилле это можно делать даже через оригинальный WSUS, или просто батником с psexec, вариантов много. Также желательно запилить предварительно сконфигурированный инсталлятор агента — об этом ниже;
-
Много желания пилить напильником. Скажу честно и сразу: из первоначального списка 3 из 3 реализовывалось руками на местности. Zabbix стандартной комплектации в такое не может.
У Zabbix много вариантов установки. В моём случае (я начинал с 4 LTS) сработала только установка руками в чистую, из собственного образа, OC в виртуальной машине на Hyper-V. Так что, коли не получится с первого раза, — не сдавайтесь, пробуйте. Саму процедуру подробнее описывать не буду, есть куча статей и хороший официальный мануал.

Про формирование инсталлятора агента: один из самых простых способов — использовать утилиты наподобие 7zfx Builder . Нужно будет подготовить:
-
файл zabbix_agentd.conf ;
-
файлы сторонних приложений и скриптов, используемых в userParameters (об этом ниже) ;
-
скрипт инсталлятора с кодом наподобие этого:
SETLOCAL ENABLEDELAYEDEXPANSION
SET INSTDR=C:\Zabbix\Agent
SET IP=192.168.100.10
set ip_address_string="IPv4-адрес"

for /f "usebackq tokens=2 delims=:" %%F in (ipconfig ^| findstr /c:%ip_address_string%) do SET IP=%%F
SET IP=%IP: =%
ECHO SourceIP=%IP%>> "%INSTDR%\conf\zabbix_agentd.conf"
ECHO ListenIP=%IP%>> "%INSTDR%\conf\zabbix_agentd.conf"
ECHO Hostname=%COMPUTERNAME%>> "%INSTDR%\conf\zabbix_agentd.conf"

"%INSTDR%\bin\zabbix_agentd.exe" -c "%INSTDR%\conf\zabbix_agentd.conf" -i
net start "Zabbix Agent"
ENDLOCAL
Кстати, об IP. Адрес в Zabbix является уникальным идентификатором, так что при «свободном» DHCP нужно будет настроить привязки. Впрочем, это и так хорошая практика.
Также могу порекомендовать добавить в инсталлятор следующий код:
sc failure "Zabbix Agent" reset= 30 actions= restart/60000Как и многие сервисы, Zabbix agent под Windows при загрузке ОС стартует раньше, чем некоторые сетевые адаптеры. Из-за этого агент не может увидеть IP, к которому должен быть привязан, и останавливает службу. В оригинальном дистрибутиве при установке настроек перезапуска нет.
После этого добавляем хосты. Не забудьте выбрать Template – OS Windows. Если сервер не видит клиента — проверяем:
-
IP-адрес;
-
файрвол на клиенте;
-
работу службы на клиенте — смотрим zabbix_agentd.log, он вполне информативный.
По моему опыту, сервер и агенты Zabbix очень стабильны. На сервере, возможно, придётся расширить пул памяти по active checks (уведомление о необходимости такого действия появляется в дашборде), на клиентах донастроить упомянутые выше нюансы с запуском службы, а также, при наличии UserParameters, донастроить параметр timeout (пример будет ниже).
Что видно сразу, без настроек?
Сразу видно, что Zabbix заточен под другое  Но и об обычных рабочих станциях в конфигурации «из коробки» можно узнать много: идёт мониторинг оперативной памяти и SWAP, места на жёстких дисках, загрузки ЦП и сетевых адаптеров; будут предупреждения о том, что клиент давно не подключался или недавно перезагружен; агент автоматически создаёт список служб и параметров их работы, и сгенерирует оповещение о «необычном» поведении. Практически из коробки (со скачиванием доп. template’ов с офсайта и небольшой донастройкой) работает всё, что по SNMP: принтеры и МФУ, управляемые свитчи, всякая специфическая мелочь. Иметь алерты по тем же офисным принтерам в едином окне очень удобно.
В общем-то, очень неплохо, но…
Что доделывать?
Оооо. Ну, хотел повелосипедить, так это всегда пожалуйста. Прежде всего, нет алертов на события типа «критические» из системного лога Windows, при том, что механизм доступа к логам Windows встроенный, а не внешний, как Zabbix agent active. Странно, ну штош. Всё придётся добавлять руками.
Например
для записи и оповещения по событию «Система перезагрузилась, завершив работу с ошибками» (Microsoft-Windows-Kernel-Power, коды 41, 1001) нужно создать Item c типом Zabbix agent (active) и кодом в поле Key:
eventlog[System,,,,1001]По этому же принципу создаём оповещения на другие коды. Странно, но готового template я не нашёл.
Cистема автоматизированной генерации по службам генерирует целую тучу спама. Часть служб в Windows предполагает в качестве нормального поведения тип запуска «авто» и остановку впоследствии. Zabbix в такое не может и будет с упорством пьяного сообщать «а BITS-то остановился!». Есть широко рекомендуемый способ избавления от такого поведения — добавление набора служб в фильтр-лист: нужно добавить в Template «Module Windows services by Zabbix agent», в разделе Macros, в фильтре {$SERVICE.NAME.NOT_MATCHES} имя службы в формате RegExp. Получается список наподобие:
^RemoteRegistry|MMCSS|gupdate|SysmonLog|
clr_optimization_v.+|clr_optimization_v.+|
sppsvc|gpsvc|Pml Driver HPZ12|Net Driver HPZ12|
MapsBroker|IntelAudioService|Intel\(R\) TPM Provisioning Service|
dbupdate|DoSvc|BITS.*|ShellHWDetection.*$
И он не работает работает с задержкой в 30 дней.

Про службы, автоматически генерируемые в Windows 10, я вообще промолчу.
Нет никаких температур (но это, если подумать, ладно уж), нет SMART и его алертов (тоже отдельная история, конечно). Нет моих любимых UPS.
Некоторые устройства генерируют данные и алерты, работу с которыми надо выстраивать. В частности, например, управляемый свитч Tp-Link генерирует интересный алерт «скорость на порту понизилась». Почти всегда это означает, что рабочая станция просто выключена в штатном режиме (ушла в S3), но сама постановка вопроса заставляет задуматься: сведения, вообще, полезные — м.б. и драйвер глючит, железо дохнет, время странное…
Некоторые встроенные алерты требуют переработки и перенастройки. Часть из них не закрывается в «ручном» режиме по принципу «знаю, не ори, так надо» и создаёт нагромождение информации на дашборде.
Короче говоря, многое требует допиливания напильником под местные реалии и задачи.

О локальных задачах
Всё, что не встроено в Zabbix agent, реализуется через механизм Zabbix agent (active). Суть проста: пишем скрипт, который будет выдавать нужные нам данные. Прописываем наш скрипт в conf:
UserParameter=имя.параметра,путь\к\скрипту Нюансы:
-
если хотите получать в Zabbix строку на кириллице из cmd — не надо. Только powershell;
-
если параметр специфический – для имени нужно будет придумать и сформулировать дерево параметров, наподобие «hardware.huawei.modem.link.speed» ;
-
отладка и стабильность таких параметров — вопрос и скрипта, и самого Zabbix. Об этом дальше.
Хотелка №1: температуры процессоров рабочих станций
В качестве примера реализуем хотелку «темература ЦП рабочей станции». Вам может встретиться вариант наподобие:
wmic /namespace:\root\wmi PATH MSAcpi_ThermalZoneTemperature get CurrentTemperatureно это не работает (вернее, работает не всегда и не везде).
Самый простой способ, что я нашёл — воспользоваться проектом OpenHardwareMonitor. Он свои результаты выгружает прямо в тот же WMI, так что температуру получим так:
@echo OFF
SETLOCAL ENABLEDELAYEDEXPANSION
SET TMPTMP=0
for /f "tokens=* skip=1 delims=" %%I in ('wmic /namespace:\root\OpenHardwareMonitor PATH Sensor WHERE Identifier^="/intelcpu/0/temperature/1" get Value') DO (
	SET TMPTMP=%%I && GOTO :NXT
)
:NXT
ECHO %TMPTMP%
ENDLOCAL
GOTO :EOF
Конечно, при условии, что OHM запущен. В текущем релизе OHM не умеет работать в качестве Windows service. Так что придётся либо смущать пользователей очередной иконкой в трее, либо снова городить свой инсталлятор и запихивать OHM в сервисы принудительно. Я выбрал поcледнее, создав инсталляционный cmd для всё того же 7zfx Builder наподобие:
nssm install OHMservice "%programfiles%\OHM\OpenHardwareMonitor.exe"
timeout 3
net start "OHMservice"
del nssm.exe /Q
Два момента:
-
NSSM — простая и достаточно надёжная утилита с многолетней историей. Применяется как раз в случаях, когда ПО не имеет режима работы «сервис», а надо. Во вредоносности утилита не замечена;
-
Обратите внимание на «intelcpu» в скрипте получения температуры от OHM. Т.к. речь идёт о внедрении в малом офисе, можно рассчитывать на единообразие парка техники. Более того, таким образом лично у меня получилось извлечь и температуру ЦП от AMD. Но тем не менее этот пункт требует особого внимания. Возможно, придётся модифицировать и усложнять инсталлятор для большей универсальности.
Работает более чем надёжно, проблем не замечено.
Хотелка № 2: получаем и мониторим температуру чего угодно
Понадобятся нам две вещи:
-
Штука от братского китайского народа: стандартный цифровой термометр DS18B20, совмещённый с USB-UART контроллером. Стоит не сказать что бюджетно, но приемлемо;
-
powershell cкрипт:
param($cPort='COM3')

$port= new-Object System.IO.Ports.SerialPort $cPort,9600,None,8,one

$port.Open()
$tmp = $port.ReadLine()
$port.Close()

$tmp = $tmp -replace "t1="
if (([int]$tmp -lt 1) -or ([int]$tmp -gt 55)){

	#echo ("trigg "+$tmp)
	$port.Open()
	$tmp = $port.ReadLine()
	$port.Close()

	$tmp = $tmp -replace "t1="
}
echo ($tmp)
Связка работает достаточно надёжно, но есть интересный момент: иногда, бессистемно, появляются провалы или пики на графиках:
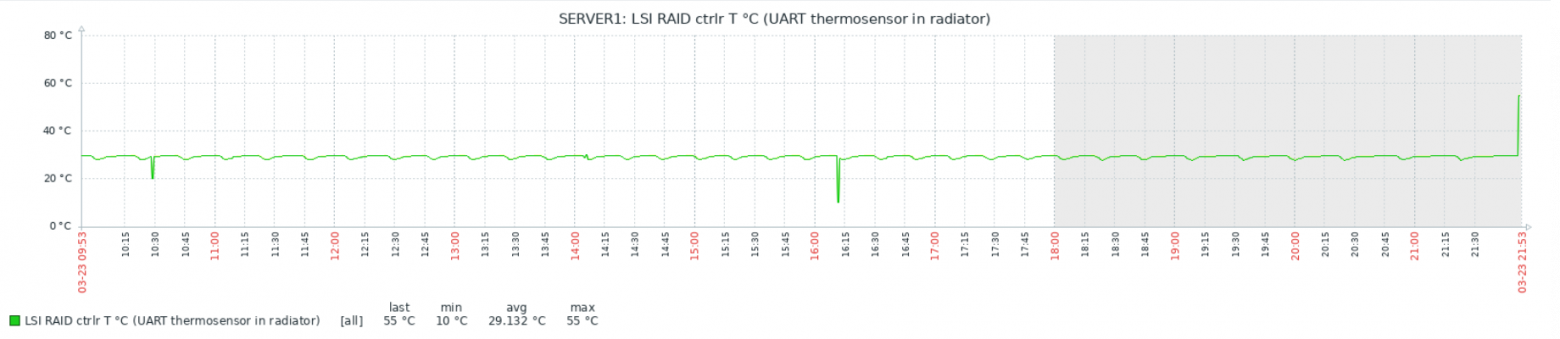
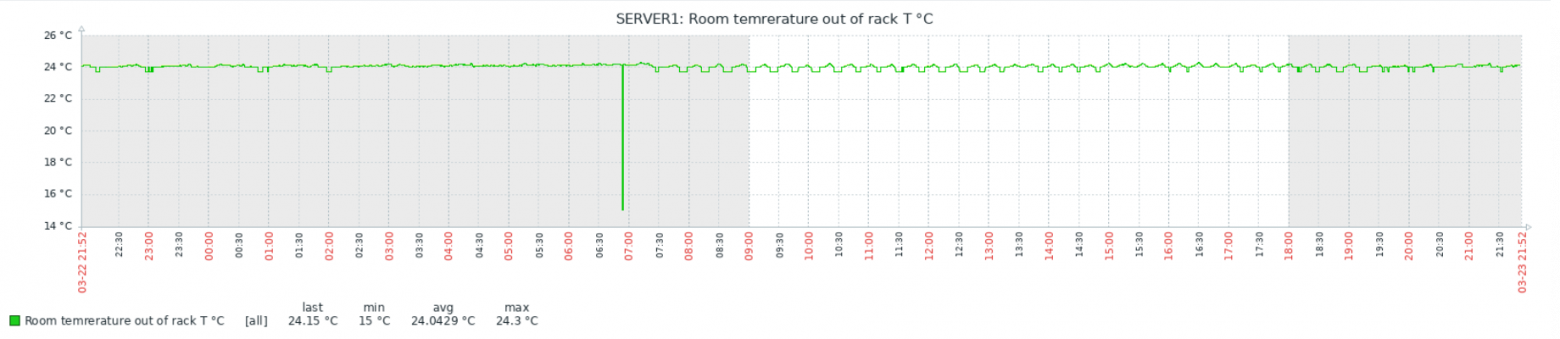
Тесты показали, что проблема в самом Zabbix, а данные с китайских датчиков приходят верные. Детальное рассмотрение пиков и провалов выявило неожиданный факт: похоже Zabbix иногда получает и/или записывает в БД не полное значение, а «хвост». Т.е., например, 1.50 от значения 21.50. При этом положение точки не важно — может получить и 1.50, и 50, и даже 0. Как так происходит, мне выяснить пока не удалось. Изменение timeout на поведение не влияет никак, ни в большую, ни в меньшую сторону.
Наверное, стоило бы написать багрепорт. Но уже вышел 6.0 LTS (у меня 5) и обновляться в текущей ситуации, пожалуй, не буду.
Хотелка № 3: OpenVPN подключения
Template’ов для OpenVPN и Zabbix существует довольно много, но все они реализованы на том или ином sh под *nix’ы . В свою очередь, «dashboard» OpenVPN-сервера представляет из себя, по сути, вывод утилиты в консоль, который пишется в файл по событиям. Мне лень было считать трафик по отдельным пользователям и вообще делать их discover, т.к. подключений и пользователей немного. Ограничился текущим количеством подключений:
$openvpnLogPath = "C:\OpenVPN\config\"
$openvpnLogName = "openvpn-status.log"

try {
	$logData = Get-Content $openvpnLogPath$openvpnLogName -ErrorAction Stop
}
catch{

	Write-Host("Missing log file")
	exit 1
}

$logHeader = "OpenVPN CLIENT LIST"
$logHeader2 = "Common Name,Real Address,Bytes Received,Bytes Sent,Connected Since"
$logMark1 = "ROUTING TABLE"

if ($logData[0] -ne $logHeader -or $logData[2] -ne $logHeader2 ){

	Write-Host("Bad log file")
	exit 1
}

$i = 0
foreach ($tmpStr in ($logData | select -skip 3)) {

	if ($tmpStr -eq $logMark1) {break}
	$i++
}

Write-Host($i)
exit 0
Хотелка № 4: спецжелезка 1
Для большого количества специфического оборудования существуют написанные энтузиастами Template’ы. Обычно они используют и реализуют функционал, уже имеющийся в утилитах к этим железкам.
Боли лирическое отступление
установив один из таких темплейтов, я узнал, что «нормальная рабочая» температура чипа RAID-контроллера в серваке — 65+ градусов. Это, в свою очередь, побудило внимательнее посмотреть и на контроллер, и на сервер в целом. Были найдены косяки и выражены «фи»:
-
Apaptec’у – за игольчатый радиатор из неизвестного крашеного силумина высотой чуть более чем нихрена, поток воздуха к которому закрыт резервной батарейкой с высотой больше, чем радиатор. Особенно мне понравилось потом читать у Adaptec того же «ну, это его нормальная рабочая температура. Не волнуйтесь». Ответственно заявляю: при такой «нормальной рабочей температуре» контроллер безбожно и непредсказуемо-предсказуемо глючил;
-
Одному отечественному сборщику серверов. «Берём толстый жгут проводов. Скрепляем его, чтобы он был толстым, плотным, надёжным. Вешаем это прямо перед забором воздуха вентиляторами продува серверного корпуса. Идеально!». На «полу» сервера было дофига места, длины кабелей тоже хватало, но сделали почему-то так.
Также был замечен интересный нюанс поведения, связанный с Zabbix. Со старым RAID контроллером при наличии в системном логе специфичных репортов, отваливался мониторинг температуры контроллера в Zabbix, но! при запуске руками в консоли скрипта или спец. утилиты температура выводилась корректно и без задержек.
Но полный функционал реализован далеко не всегда. В частности, мне понадобились температуры жёстких дисков с нового RAID-контроллера (ну люблю я температуры, что поделать ), которых в оригинальном темплейте не было. Пришлось самому реализовывать температуры и заодно autodiscover физических дисков: https://github.com/automatize-it/zabbix-lsi-raid/commit/1d3a8b3a0e289b8c2df637028475177a2b940689

Оригинальный репозиторий, вероятно, заброшен, как это довольно часто бывает.
Хотелка № 5, на десерт: спецжелезка 2
Как и обещал, делюсь опытом вырывания данных из беспроводной железки Huawei. Речь о 4G роутере серии B*. Внутри себя железка имеет ПО на ASP, а данные о качестве сигнала — RSSI, SINR и прочее — в пользовательском пространстве показывать не хочет совсем. Смотри, мол, картинку с уровнем сигнала и всё, остальное не твоего юзерского ума дело. К счастью, в ПО остались какие-то хвосты, выводящие нужное в plain JSON. К сожалению, взять да скачать это wget-ом не получается никак: мало того, что авторизация, так ещё и перед генерацией plain json требуется исполнение JS на клиенте. К счастью, существует проект phantomjs. Кроме того, нам понадобится перенесённая руками кука из браузера, где мы единожды авторизовались в веб-интерфейсе, вручную. Кука живёт около полугода, можно было и скрипт написать, но я поленился.
Алгоритм действий и примеры кода:
вызываем phantomjs с кукой и сценарием:
phantomjs.exe --cookies-file=cookie.txt C:\cmd\yota_signal\scenery.jsПримеры сценариев:
//получаем общий уровень сигнала
var url = "http://192.168.2.1/html/home.html";
var page = require('webpage').create();
page.open(url, function(status) {
  //console.log("Status: " + status);
  if(status === "success") {

	var sgnl = page.evaluate(function() {
		return document.getElementById("status_img").innerHTML; //
	});

	var stt = page.evaluate(function() {
		return document.getElementById("index_connection_status").innerText; //
	});

	var sttlclzd = "dis";
	var sgnlfnd = "NA";

	if (stt.indexOf("Подключено") != -1) {sttlclzd = "conn";}

	if (sgnl.indexOf("icon_signal_01") != -1) {sgnlfnd = "1";}
	else {
		var tmpndx = sgnl.indexOf("icon_signal_0");
		sgnlfnd = sgnl.substring(tmpndx+13,tmpndx+14);
	}

	console.log(sttlclzd+","+sgnlfnd);

	var fs = require('fs');

		try {
			fs.write("C:\\cmd\\siglvl.txt", sgnlfnd, 'w');
		} catch(e) {
			console.log(e);
		}

  }
  phantom.exit();
});
//получаем технические параметры сигнала через какбэ предназначенный для этого "API"
var url = "http://192.168.2.1/api/device/signal";
var page = require('webpage').create();


	page.onLoadFinished = function() {

		//console.log("page load finished");
		//page.render('export.png');
		console.log(page.content);

		parser = new DOMParser();
		xmlDoc = parser.parseFromString(page.content,"text/xml");

		var rsrq = xmlDoc.getElementsByTagName("rsrq")[0].childNodes[0].nodeValue.replace("dB","");
		var rsrp = xmlDoc.getElementsByTagName("rsrp")[0].childNodes[0].nodeValue.replace("dBm","");
		var rssi = xmlDoc.getElementsByTagName("rssi")[0].childNodes[0].nodeValue.replace("dBm","").replace(">=","");
		var sinr = xmlDoc.getElementsByTagName("sinr")[0].childNodes[0].nodeValue.replace("dB","");

		var fs = require('fs');

		try {
			fs.write("C:\\cmd\\rsrq.txt", rsrq, 'w');
			fs.write("C:\\cmd\\rsrp.txt", rsrp, 'w');
			fs.write("C:\\cmd\\rssi.txt", rssi, 'w');
			fs.write("C:\\cmd\\sinr.txt", sinr, 'w');
		} catch(e) {
			console.log(e);
		}

		phantom.exit();
	};

	page.open(url, function() {
		page.evaluate(function() {
		});
    });
Конструкция запускается из планировщика задач. В Zabbix-агенте производится лишь чтение соответствующих файлов:
UserParameter=internet.devices.huawei1.signal.level,type C:\cmd\siglvl.txt 
Требует постоянного присмотра, ручных прибиваний и перезапусков процессов, обновления кук. Но для такого шаткого нагромождения фекалий и палок работает достаточно стабильно.
Итого
Стоит ли заморачиваться на Zabbix, если у вас 20 машин и 1-2 сервера, да ещё и инфраструктура Windows?
Как можно понять из вышеизложенного, работы будет много. Я даже рискну предположить, что объёмы работ и уровень квалификации для них сравнимы с решением «свелосипедить своё с нуля по-быстрому на коленке».
Не стоит рассматривать Zabbix как панацею или серебряную пулю.
Тем не менее, использование уже готового и популярного продукта имеет свои преимущества — в первую очередь, это релевантный опыт для интересных работодателей.
А красивые графики дают усладу глазам и часто — новое видение процессов в динамике.
Если захочется внедрить, то могу пообещать, как минимум — скучно не будет! 
Только зарегистрированные пользователи могут участвовать в опросе. Войдите, пожалуйста.
Мониторите малые офисы?
61.22% Мониторю, Заббиксом60
3.06% Мониторю, не Заббиксом3
2.04% Мониторю, самописной системой2
25.51% Не мониторю, но вообще надо бы25
8.16% Не мониторю и не надо8
Проголосовали 98 пользователей. Воздержались 30 пользователей.
It’s 2 AM, and your phone buzzes with an urgent alert—your primary server application is down, and users are flooding the support channels with complaints.
As you dive into the logs, the cause is elusive, buried somewhere in the sea of system events.
Is it a rogue service eating up memory?
A failing disk?
Or a network bottleneck?
Without powerful Windows monitoring tools, you’re left troubleshooting in the dark.
The Challenges of Windows Monitoring
Windows servers and services are fundamental to the operations of many businesses.
Monitoring Windows servers and services involves tracking performance metrics, detecting issues, and ensuring that all components run smoothly. Without effective Windows monitoring tools, organizations can face significant problems, such as:
- Downtime: Unplanned outages of servers or critical services can lead to significant business disruptions and financial losses.
- Performance Degradation: Slow server or service performance can affect user satisfaction and productivity.
- Security Risks: Unmonitored servers and services are vulnerable to security breaches, which can compromise sensitive data.
- Complex Troubleshooting: Identifying and resolving server and service issues without proper tools can be time-consuming and inefficient.
In this post, we’ll delve into the best Windows monitoring tools. They give you the visibility and control to catch these issues before they escalate, ensuring your infrastructure is resilient and your nights are uninterrupted.
Top 10 Server Monitoring Tools and Software in 2024
Here are some of the best tools available on the market right now:
1. Sematext
Sematext Infrastructure Monitoring offers a robust solution for Windows monitoring, ensuring high availability and peak performance of servers and applications running on Windows platforms. Intuitive dashboards allow users swift troubleshooting and visualization of metrics including CPU, memory, disk usage, network statistics, and more.
Setting up Sematext is easy thanks to the auto-discovery feature, which quickly identifies applications and sets up pre-configured checks and alerts.
Sematext enhances server infrastructure management by offering a single-pane-of-glass view, enabling easy identification of underutilized resources to cut costs, optimization of server performance, and detection of failing servers with heartbeat alerts.
It also provides comprehensive cloud-aware monitoring that is agnostic to the cloud provider, supporting major container and Kubernetes solutions, and automatically collecting essential metrics and cloud-specific tags.
It’s designed to be lightweight yet comprehensive, ensuring minimal system overhead while providing deep insights into the infrastructure’s health and performance.
Features:
- Current & historical resource utilization view
- CPU, memory, disk usage, network metrics
- Flexible filtering with tags, hosts, etc.
- Aggregate top-like infrastructure view
- Monitoring alerts on any metric
- Visualizations for capacity planning
- Easy installation and deployment options
- Lightweight agent with minimal resource usage
- Identify underutilized resources
- Detect failing servers with heartbeat alerts
Pros:
- Fast integration via open-source Agent
- Monitor logs and events and correlate them for deeper insights into infrastructure health
- Inventory tracking alerts to inconsistencies, discrepancies, or outdated packages
- Detailed process monitoring to identify and resolve performance bottlenecks
- Easy installation and excellent support
- Out-of-the-box dashboards and alert rules save time
- Flexible subscription pricing and pay-as-you-go options
- Provides both internal and external monitoring capabilities
- Integrates with incident management systems for seamless response
- Detailed browser checks for anomaly detection
- Provides full stack observability
Cons:
- Limited capabilities for transaction tracing.
- Fewer integrations than some larger competitors
- Lacks a comprehensive profiling feature.
Pricing:
Sematext offers a free plan with basic features, moderate data retention, and alert capabilities, all without requiring a credit card.
Paid plan starts at only $3.60 per host per month with various retention options. The highest tier plan starts at $5.76 and provides the most comprehensive feature set, and retention plans.
Sematext provides a 14-day free trial allowing you to evaluate the full capabilities of the product for a limited period.
Annual commitments also offer additional discounts, making it an even more attractive option for long-term monitoring solutions.
Ideal for:
Organizations of all sizes looking for a cost-effective and user-friendly monitoring and troubleshooting solution. Very large enterprises might require more specialized features.
Want to see more? You can check out our full range of packages by visiting the pricing page.
2. SolarWinds Server and Application Monitor (SAM)
SolarWinds Server and Application Monitor (SAM) helps keep Windows servers running smoothly by tracking important details like CPU, memory, and disk usage. It watches over 1,200 applications, including Windows Server, Active Directory, and SQL Server. You can even create custom templates to monitor specific apps.
SAM alerts allow you to fix issues quickly and provide charts to help you see when resources like memory or CPU are running low.
It automatically finds applications and maps out their dependencies.
The tool can monitor virtual environments like VMware and Hyper-V, giving you a clear view of your virtual machines’ performance. It also supports cloud services like AWS and Azure, so you can see how your cloud resources are being used.
Features:
- Application Availability and Performance Monitoring
- Application Dependency Mapping
- Cloud Application Monitoring
- Cross-Stack IT Data Correlation
- Customizable Reports and Alerts
- Real-time Monitoring
- Pre-configured Templates
- Agentless Monitoring
- Optional Agent Deployment
- Auto-Discovery
- Customizable Interface
Pros:
- Extensive feature set
- Customizable
- Strong Visualization Tools
- Integration with SolarWinds Orion Platform
- Application Performance Insights
- Cross-Platform Monitoring
- Suitable for small to large IT environments.
Cons:
- High cost
- Complexity
Pricing:
They don’t publicly disclose specific pricing details which usually tells that your Windows server monitoring could be a quite substantial “investment”.
Here’s what we were able to find…
SolarWinds SAM starts at ~$2,955 per year for 150 max number of elements and 1-year support, reflecting its extensive capabilities and enterprise-level features.
For specific pricing details, it’s recommended to contact SolarWinds directly or request a quote through their website.
Ideal for:
Large enterprises in need of detailed application and server monitoring to ensure optimal performance and quick resolution of issues.
3. Datadog
Datadog is a massive, full-stack monitoring solution renowned for its strong cloud integrations and comprehensive monitoring capabilities. Its market value is approximated to an astonishing $40B, making it by far the most comprehensive performance monitoring tool… with massive cost associated. It provides detailed insights across servers, infrastructure, applications, and logs, making it a preferred choice for enterprises with significant cloud infrastructure.
The platform provides real-time monitoring of Windows servers, containers, and applications, allowing users to visualize performance metrics instantly. Key metrics such as CPU usage, memory utilization, disk activity, and network performance are tracked using Windows Performance Counters.
In short, Datadog provides pretty much everything you can need for your monitoring needs, but at an enterprise-level price, without overage protection.
Features:
- Infrastructure monitoring
- Application performance monitoring (APM)
- Real user monitoring (RUM)
- Log management
- Security monitoring
- Cloud monitoring
- Container monitoring
- Customizable dashboards & alerts
- Integrations with various tools
Pros:
- Easy to use and deploy
- Unified view of IT infrastructure
- Powerful visualizations
- Scalable
- Helpful customer support
Cons:
- Very expensive
- No overage protection!
- Users report poor customer service
- Users report a steep learning curve
Pricing:
Infrastructure monitoring starts at $18 per month per host, providing you with 750+ integrations, out-of-the-box dashboards, and 15-month metric retention. Enterprise plan, on the other hand, starts at $27/mo without annual commitment and provides everything available in pro, with additional features like Machine learning-based alerts and Live Processes.
For a detailed comparison, visit our page on Sematext vs Datadog. We’ve broken down their pricing and compared it to Sematext, providing a clear visual of the potential savings you could achieve.
Ideal for:
Enterprises with significant cloud infrastructure require a detailed and integrated monitoring solution. Its comprehensive capabilities and strong cloud integrations make it a valuable tool for maintaining system health and performance.
4. PRTG Monitor
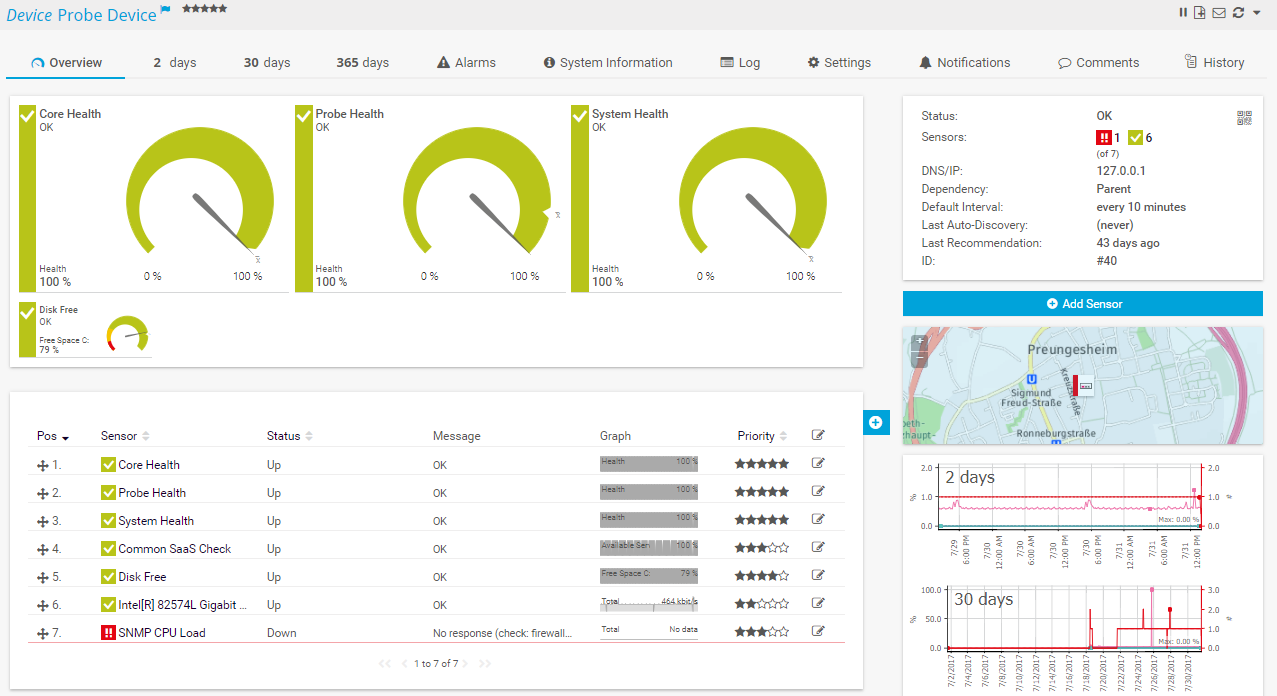
PRTG Network Monitor is a versatile and powerful monitoring tool designed by Paessler to manage and monitor both servers and network devices. Its extensive range of features and user-friendly interface make it a popular choice for organizations seeking a flexible and detailed monitoring solution.
PRTG Network Monitor offers a comprehensive solution for monitoring Windows environments, providing real-time insights and ensuring the reliability of your IT infrastructure. It includes predefined sensors for monitoring key metrics such as CPU usage, memory load, disk health, and network performance. PRTG can monitor both physical and virtual servers, including Hyper-V and VMware, as well as applications like Microsoft Exchange, SQL Server, and IIS.
One of the standout features is its automatic network discovery. This makes the initial setup process straightforward and efficient.
Features:
- Network device monitoring (servers, routers, switches, etc.)
- Application monitoring (HTTP, ping, etc.)
- Traffic monitoring (bandwidth usage)
- Uptime monitoring
- Sensor-based monitoring (customizable data collection)
- Real-time alerts and reports
- Auto-discovery of devices
- Mobile app for remote monitoring
- Free tier available (limited sensors)
Pros:
- User-friendly interface
- Agentless monitoring for some devices
- Scalable with tiered pricing
- Customizable dashboards and alerts
- Excellent customer support
- Free tier for basic needs
- On-premise & cloud hosting
Cons:
- Can become expensive
- Steep learning curve
- Can be complex for very large network environments
- Fewer integrations compared to some competitors
Pricing:
PRTG Network Monitor is priced at €1,649 per license for the on-prem version giving you 1 server installation, up to 10,000 monitoring aspects, and only email support. PRTG Hosted Monitor, on the other hand, is cloud-based and starts at €1,349 per year for the same features.
For more installations, better support, and a richer feature set, you’ll need to consider PRTG Enterprise Monitor which starts at ~ €16,000 per year.
Ideal for:
Organizations looking for a flexible and detailed monitoring solution that can be customized to meet their specific needs. Its versatility and comprehensive feature set make it suitable for businesses of all sizes, particularly those with diverse and complex monitoring requirements.
5. Nagios XI
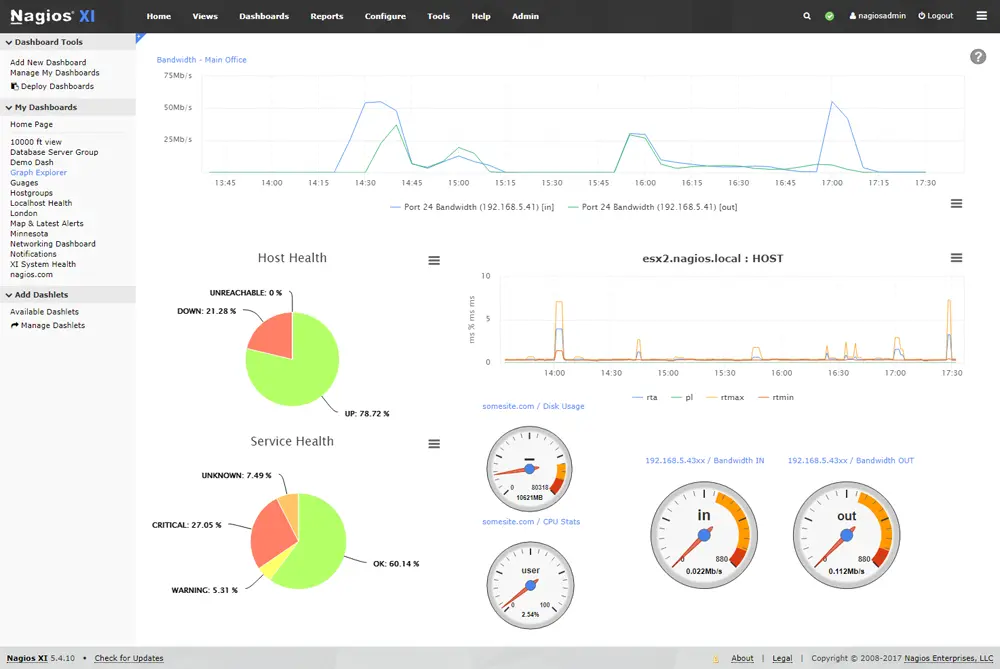
Nagios XI is a comprehensive IT infrastructure monitoring tool designed to provide real-time insights into the performance and health of your entire IT environment. Nagios XI excels at monitoring a wide range of IT infrastructure, including Windows environments.
It offers both agent-based and WMI (Windows Management Instrumentation) monitoring for comprehensive coverage of Windows servers. This allows you to track critical metrics, services, and applications running on your Windows machines.
Features:
- Monitors IT infrastructure (networks, servers, apps, services)
- Comprehensive Windows server monitoring (agent-based, WMI)
- Tracks Windows metrics, services, applications
- Real-time monitoring and alerts
- Customizable dashboards, reports
- Supports plugins for extended functionality
Pros:
- Extensive features, strong Windows server monitoring
- Scalable for large, complex environments
- Open-source option (Nagios Core)
- Highly customizable dashboards, alerts, plugins
Cons:
- Complex setup and management (beginner difficulty)
- Paid version has licensing costs
- Limited user interface compared to some competitors
Pricing:
You can start using Nagios XI for free if 7 nodes and 100 services (whichever reached first) without any support is enough for your organization. If not, Nagios XI paid plans start at $2,495, which reflects its extensive capabilities and enterprise-level features.
Ideal for:
Nagios XI is ideal for enterprises requiring extensive and customizable infrastructure monitoring. Its robust feature set and scalability make it well-suited for large organizations with complex IT environments, including those needing Windows server monitoring tools and Windows service monitoring tools open source.
6. AppDynamics
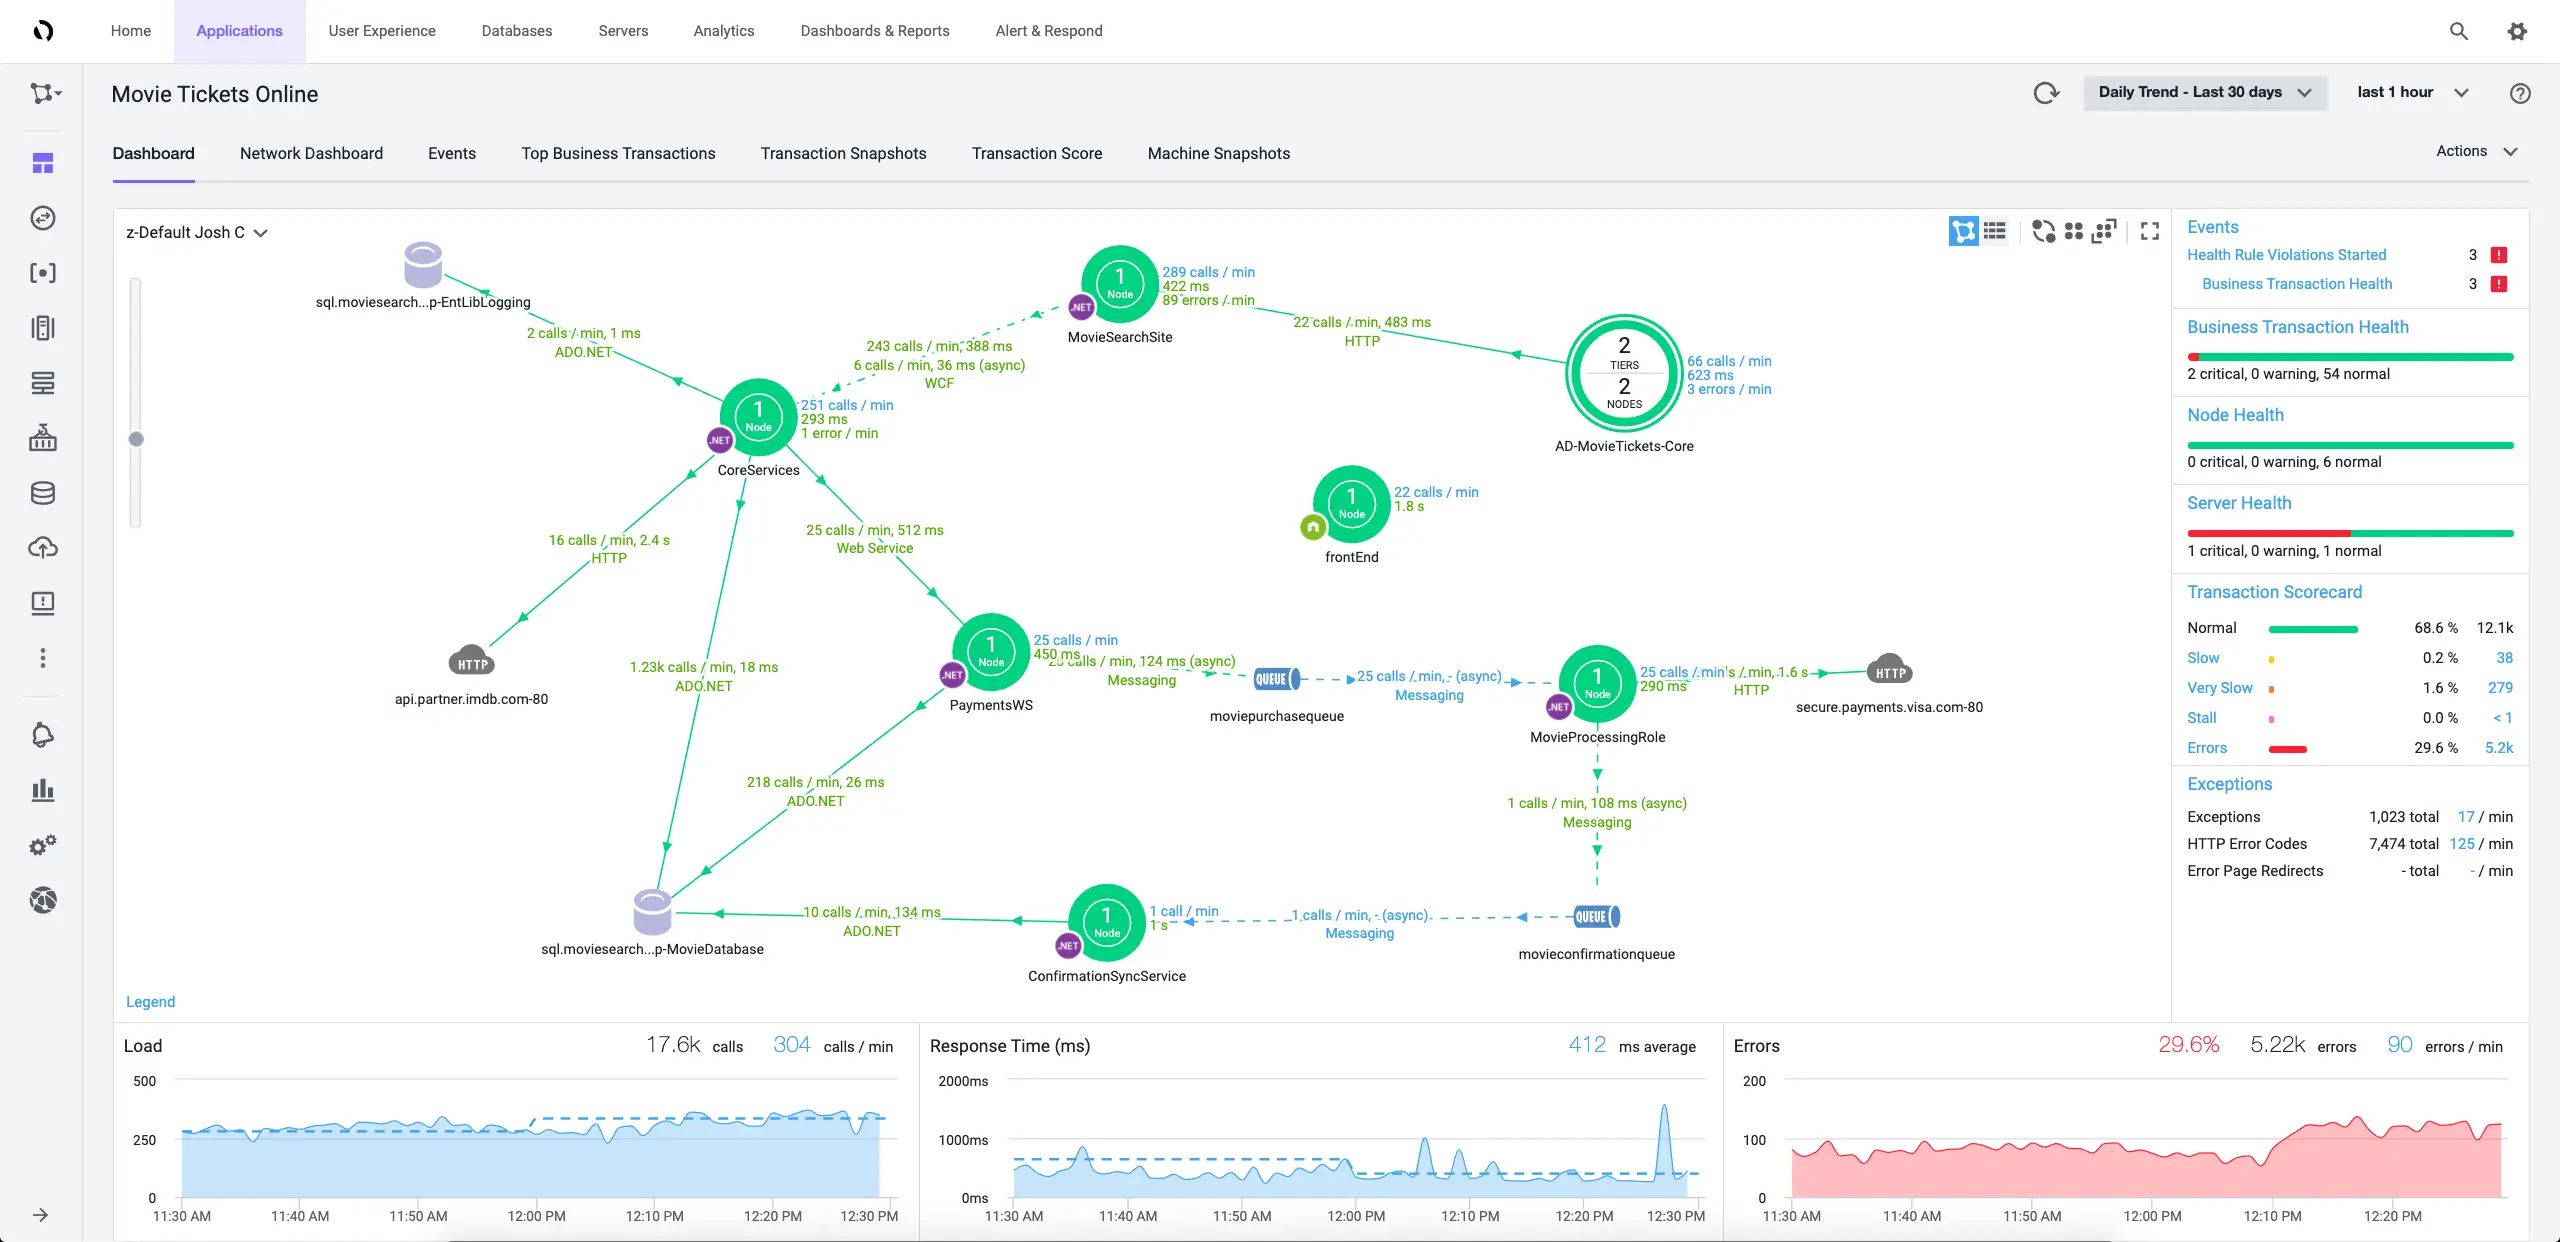
AppDynamics is an enterprise-grade monitoring solution designed to provide comprehensive insights into applications and infrastructure. It excels in application performance monitoring (APM), making it a top choice for enterprises focused on optimizing application performance and enhancing user experience.
It supports end-to-end transaction tracing, infrastructure resource monitoring, and service health checks. The platform integrates seamlessly with Microsoft Azure, providing extensive support for cloud services.
Features:
- Deep application performance monitoring (APM)
- End-to-end transaction tracing
- Infrastructure monitoring (CPU, memory, disk I/O, network traffic)
- Windows service health monitoring and alerts
- Integration with Microsoft Azure services
- Customizable dashboards and alerts
- Code-level visibility for .NET applications
- Alerts and notifications
- Customizable dashboards and reports
- Business performance monitoring
- Log Analytics
Pros:
- Powerful APM capabilities
- Real-user experience monitoring
- End-to-end visibility
- Scalability
- Easy new application deployment
- Code-level visibility option for deep performance analysis
- Intuitive workflow monitoring within application tracking
- Predictive intelligence provides valuable insights into tool usability
- High transaction visibility for detailed performance analysis
Cons:
- Costly (for smaller businesses)
- User reviews complain of various difficulties across the entire platform
- Challenges with integrating with different event sources
- User Review complains of 3rd-party tools required to start/stop instances being monitored
- Limited free options
Pricing:
AppDynamics is priced at $6 per CPU core per month. This cost can add up quickly, especially for organizations with extensive infrastructure, but it provides significant value in terms of performance optimization and user experience enhancement.
Ideal for:
AppDynamics is ideal for enterprises that prioritize application performance and user experience. Its robust APM features and real-time insights make it an invaluable tool for maintaining high-performance standards and quickly addressing issues as they arise.
7. CheckMK
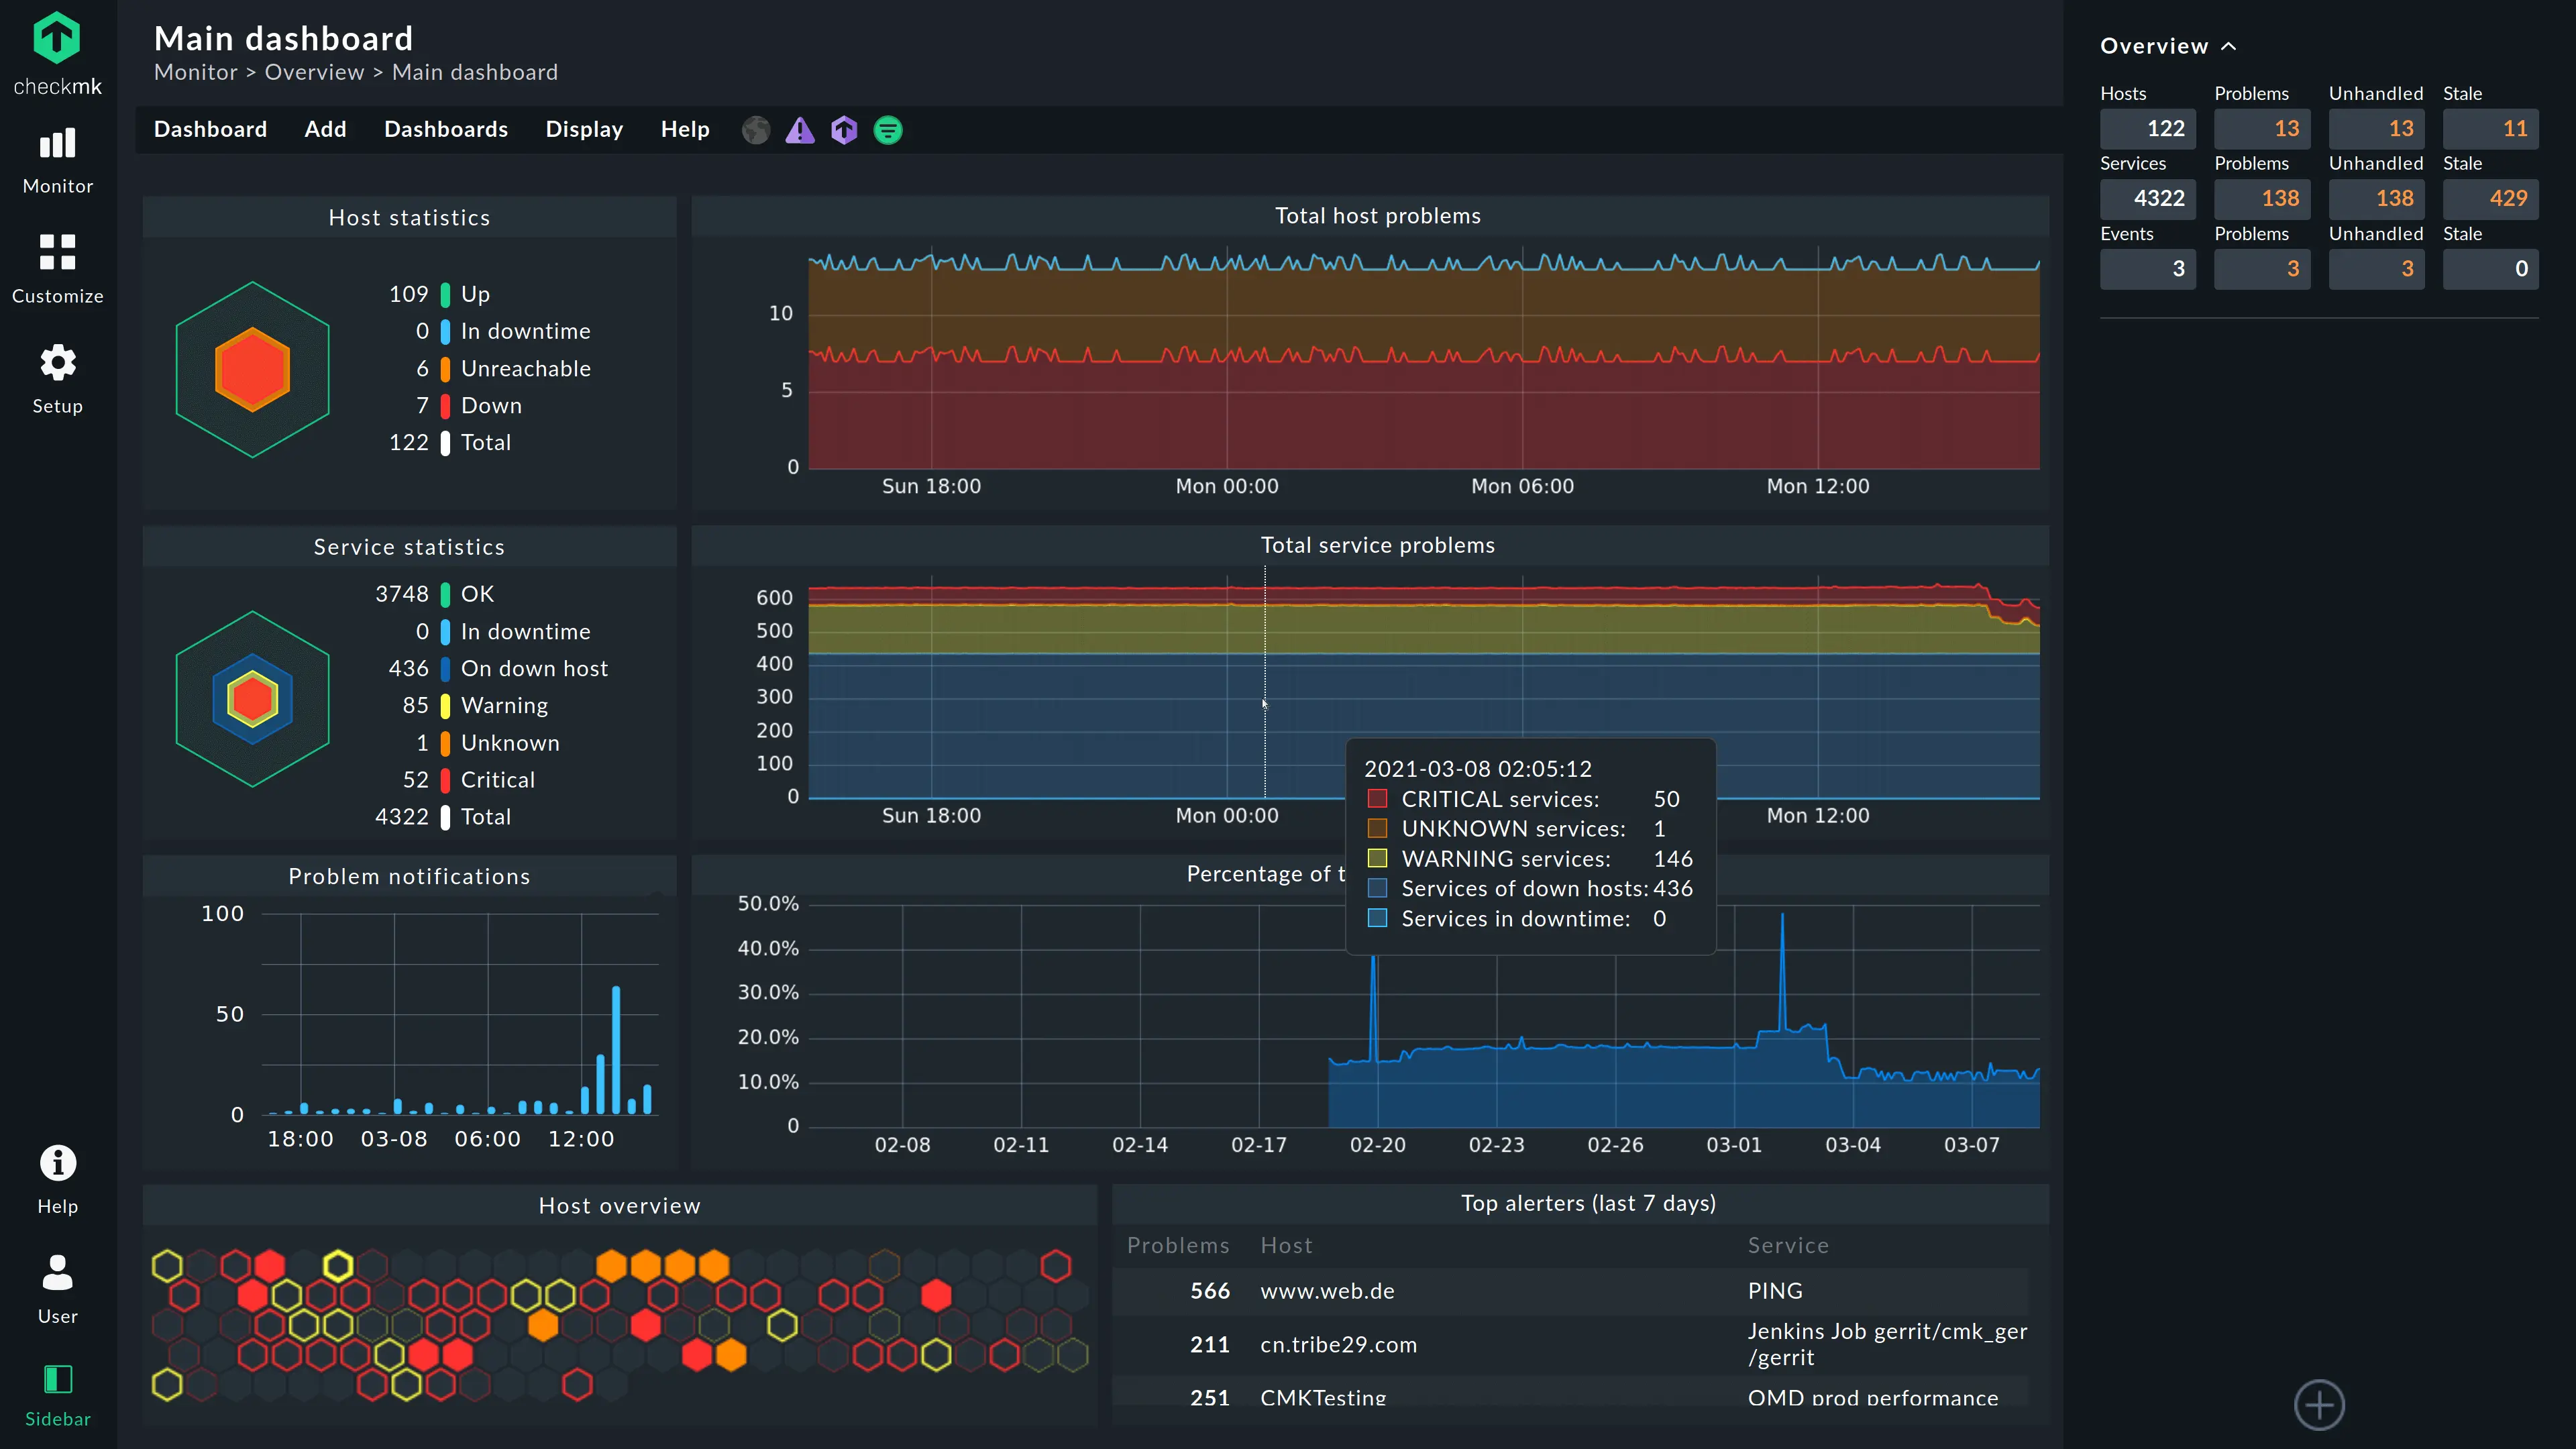
Checkmk is a comprehensive monitoring tool designed to provide detailed insights into servers, networks, and applications. It is particularly noted for its scalability and extensive feature set, making it a robust choice for organizations with complex monitoring needs. CheckMK is a valuable tool for organizations monitoring the health and performance of their Windows servers. It offers agent and agentless monitoring methods for flexibility. CheckMK automates tasks like server discovery and configuration, saving IT teams time.
Features:
- Monitors IT infrastructure (servers, networks, applications)
- Supports various monitoring methods (agents, agentless)
- Automates monitoring tasks (host discovery, configuration)
- Customizable dashboards and reports
- Integrates with various tools and platforms
- Auto-discovery
- Customizable dashboards
- Real-time monitoring
- Extensive plugin support
- Alerting and notification
Pros:
- Scalable
- User-friendly interface
- Strong community support
- Flexible configuration
- Easy to use and deploy
- Manages large, complex environments efficiently
- Cost-effective compared to some competitors
Cons:
- Initial setup complexity
- Requires technical expertise
Pricing: Checkmk offers a flexible pricing model based on the number of services and hosts monitored. It provides cost-effective solutions for businesses of all sizes.
Ideal for:
Medium to large organizations needing flexible and scalable Windows monitoring tools.
8. ManageEngine OpManager
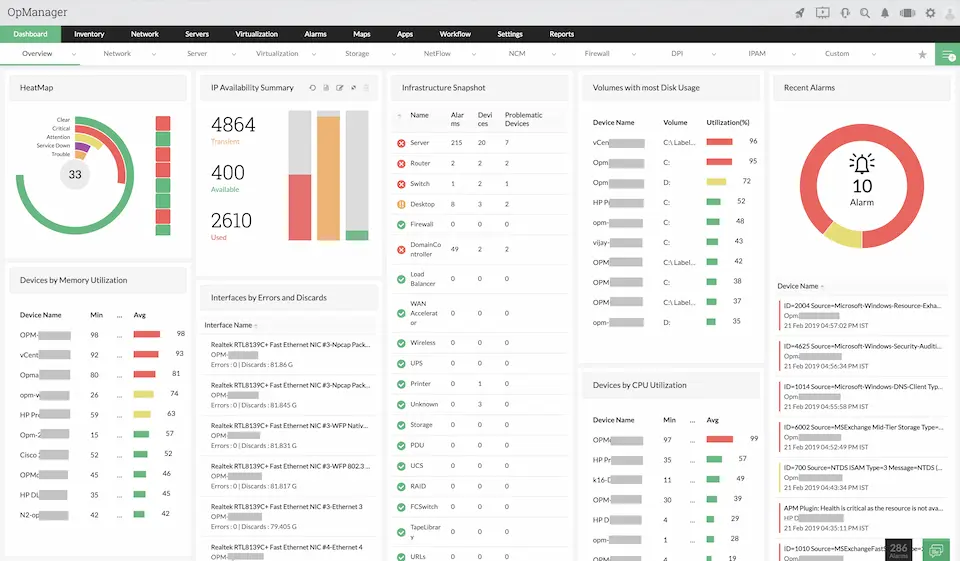
ManageEngine OpManager is a comprehensive network management solution designed to provide in-depth monitoring of both servers and network devices. Its extensive range of features and user-friendly interface make it a reliable choice for businesses of all sizes.
It offers robust Windows server monitoring with both agent and agentless monitoring options, providing flexibility in your deployment strategy. It automates tedious tasks like server discovery and configuration, saving you valuable time.
Features:
- Monitors Windows servers (agent & agentless)
- Automates setup tasks (discovery, configuration)
- Pre-built templates for Windows servers
- Customizable dashboards for focused monitoring
- Alerts and reports for server health
Pros:
- Flexible deployment (agent/agentless)
- Saves time with automation
- Tracks key metrics with pre-built templates
- Tailored views with customizable dashboards
- Proactive with alerts and reports
Cons:
- Can be resource-intensive
- Initial setup can be complex
Pricing:
ManageEngine OpManager uses a tiered pricing model based on the number of monitored devices (including Windows servers, network devices, applications, etc.). It’s a real effort to find their pricing, but we were able to do so.
The standard edition starts at $245 for 25 devices and offers basic features. The professional edition, starting at $345 provides an almost full feature set. If you want everything, plus multi-site / distributed network monitoring, the price skyrockets to $11,545 for 250 devices.
Ideal for:
Organizations looking for a robust and scalable network and server monitoring solution. It is particularly well-suited for environments with a diverse range of devices and applications.
Comparing the 8 Best Windows Server Monitoring Tools
| Tool | Best for | Price | Free trial | Free plan |
| Sematext | SMBs who are looking for an affordable, full-stack monitoring tool with advanced features and stellar support. | Starts at $3.60 per host per month for infrastructure monitoring. | Yes | Yes |
| SolarWinds Server and Application Monitor (SAM) | Large enterprises needing detailed application and server monitoring | Starts at ~$2,955 per year for 150 elements and 1-year support. | No | No |
| Datadog | Full stack observability for large organizations with a large budget. | Infrastructure monitoring starts at $18 per month per host. | Yes | Yes |
| PRTG Monitor | Organizations of any size seeking flexible, comprehensive monitoring. | €1,649 per license for on-premise version with 10,000 monitoring aspects. | Yes | No |
| Nagios XI | Large organizations requiring highly customizable infrastructure monitoring. | Paid plans start at $2,495. | No | Yes |
| AppDynamics | Enterprises and large-scale APM (Application Performance Monitoring). | $6 per CPU core per month. | Yes | No |
| CheckMK | Medium to large organizations needing scalable, cost-effective monitoring. | Starting at Starting at €175.00 for 3000 Services | Yes | Yes |
| ManageEngine OpManager | Businesses seeking comprehensive network and server monitoring with flexible deployment options. | Starts at $245 for 25 devices (Standard Edition). | No | No |
Top 5 Open source Server Monitoring Tools
While there are many paid solutions available, open-source tools offer a cost-effective alternative. These free open source network monitoring tools for Windows provide robust features without the hefty price tag.
Open-source Windows monitoring tools come with numerous advantages.
They are often highly customizable, allowing you to tailor them to your specific needs. Additionally, the strong community support around these tools can be invaluable for troubleshooting and expanding functionality. Free Windows service monitoring tools and free open source network monitoring tools are particularly appealing for organizations looking to optimize their monitoring capabilities without significant investment.
However, it’s important to acknowledge the hidden costs associated with open-source tools.
Configuring Windows service monitoring tools open source and Windows system monitoring tools open source can be complex and requires significant manual work, setup, and maintenance, which can ultimately be more expensive due to the time and expertise needed.
This is where paid solutions can offer a significant advantage, providing ease of use, professional support, and advanced features that streamline the monitoring process.
1. Zabbix
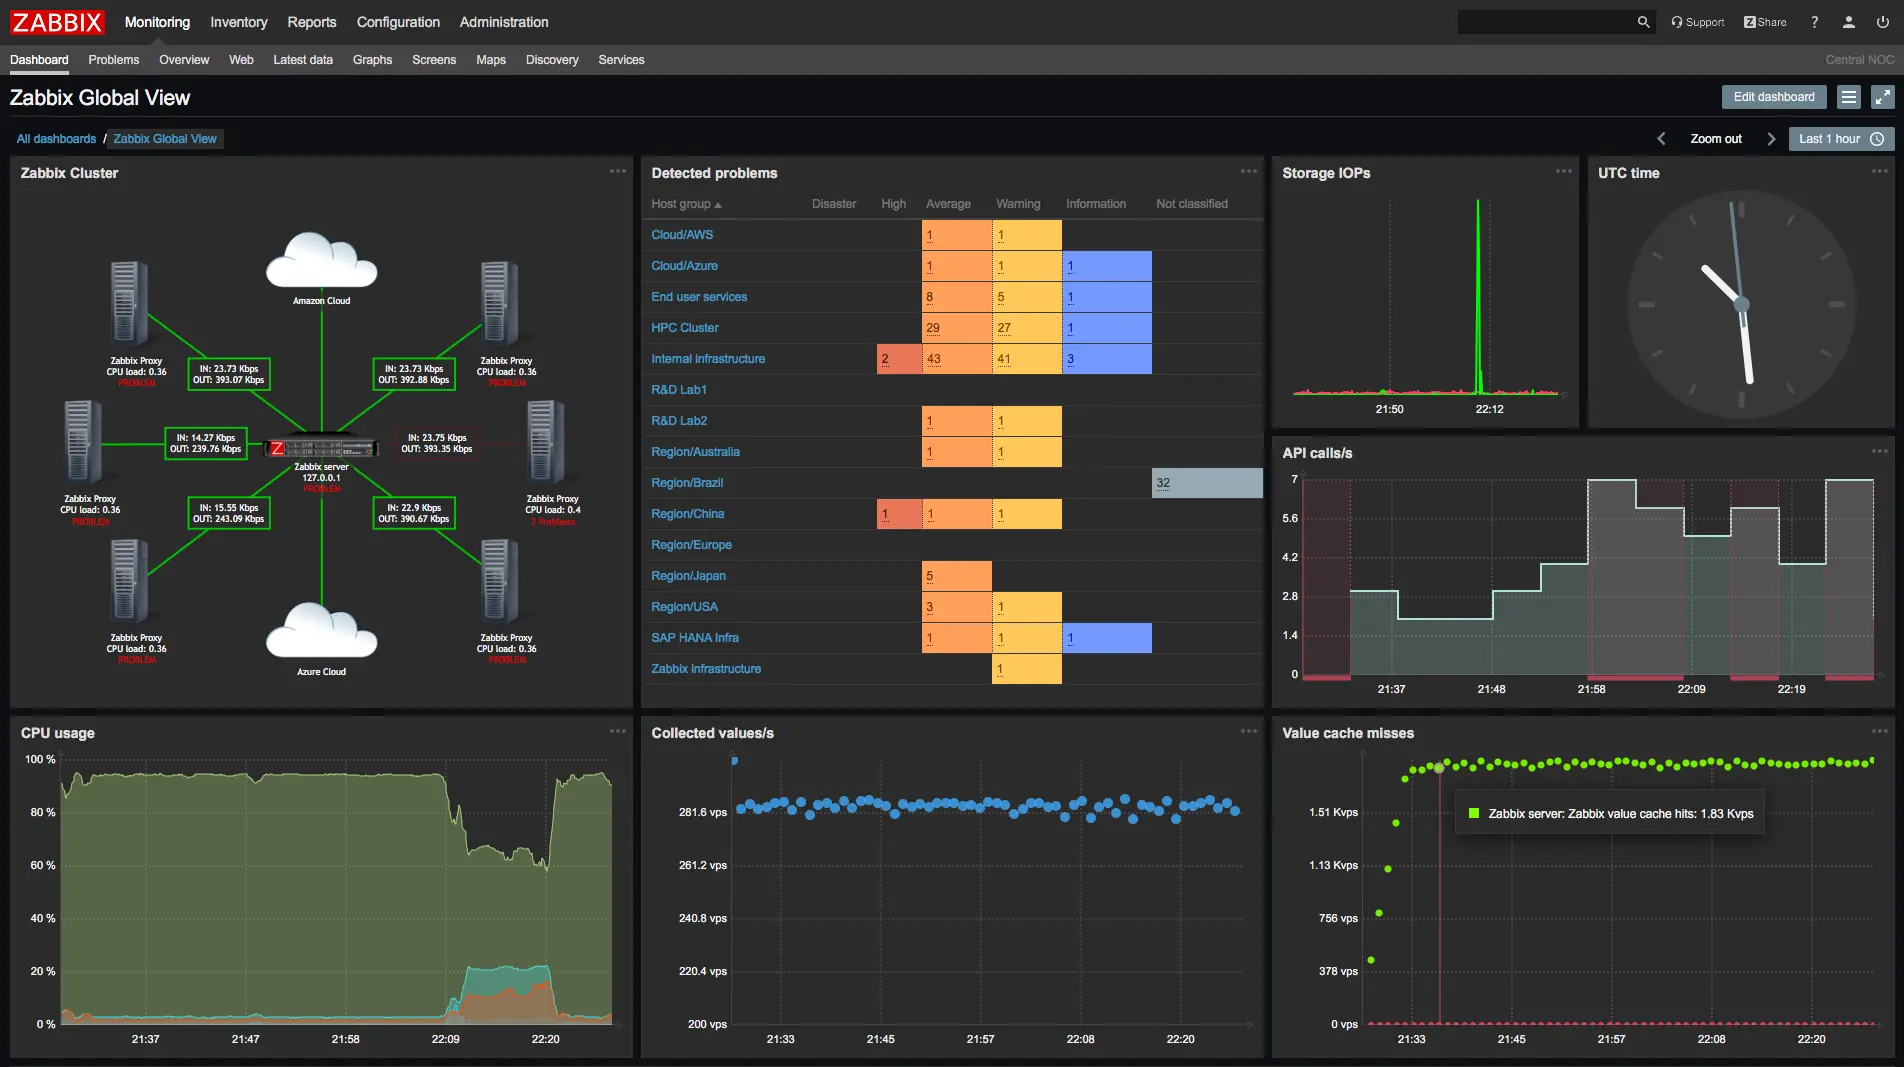
Zabbix is a free and open-source monitoring tool that keeps a watchful eye on everything from your network to your applications and servers. It’s flexible and powerful, letting you customize exactly how you see your IT health. While it might require a bit more learning to set up compared to some paid options, the active community and scalability make it a popular choice.
For Windows servers specifically, Zabbix can dive deep with agent-based monitoring, giving you detailed insights into performance and health. It can even integrate with Windows Management Instrumentation (WMI) to keep an eye on specific services and configurations.
Features:
- Open-source monitoring
Pros:
- Deep server insights
- Cost-effective
- Scalable
- Flexible
Cons:
- User reviews complain about a steep learning curve
- Less user-friendly interface
- Ongoing maintenance required
- High upfront cost (time & expertise)
Ideal for:
Small organizations with technical expertise looking for a free, customizable solution who don’t mind spending hours on setup, and maintenance.
2. Prometheus
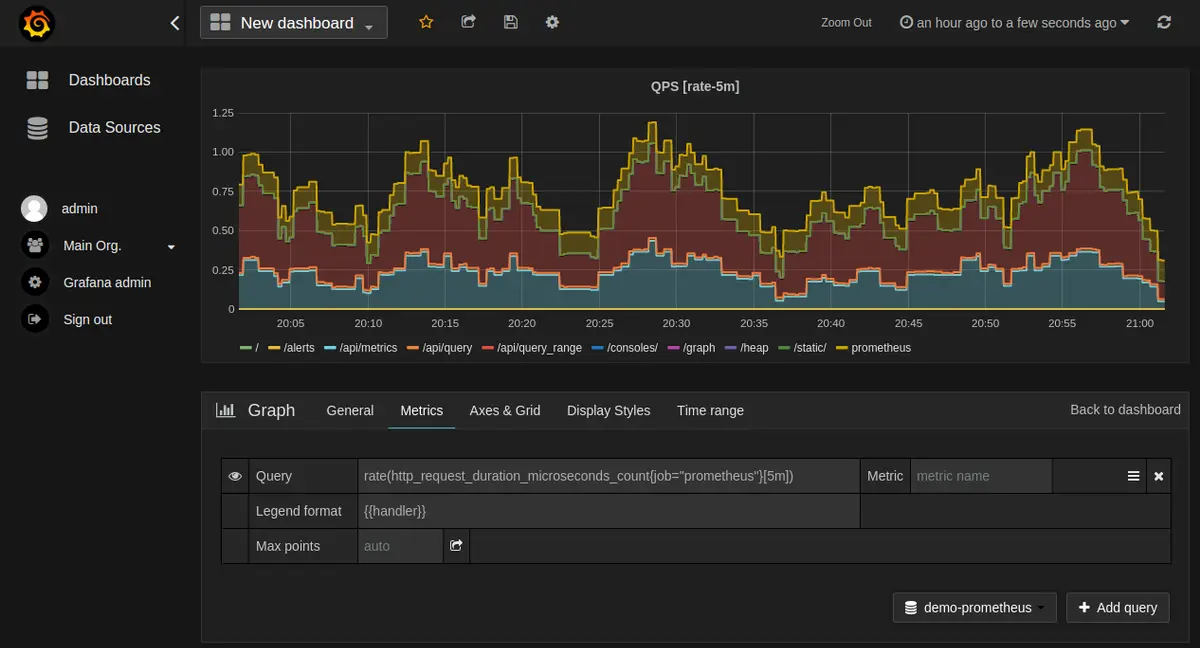
Prometheus is a powerful, open-source monitoring solution known for its robust capabilities in data collection and analysis. It excels in real-time monitoring, providing a flexible data model and a powerful query language that make it an invaluable tool for DevOps teams.
Prometheus is an excellent choice among free Windows server monitoring tools, effectively monitoring Windows server performance, collecting detailed metrics, and providing real-time alerts. While primarily agentless, it can integrate with Windows service monitoring tools open source and use exporters to pull detailed performance data from Windows servers.
Features:
- Open-source monitoring
Pros:
- Highly scalable
- Strong community support
- Extensive documentation
- Seamless integration with third-party tools
Cons:
- Requires configuration
- Limited built-in visualization tools
- Free tools require significant manual work, setup, and maintenance
- High upfront cost (time & expertise)
- User reviews complain about needing third-party tools for better visualization
- User reviews complain about queries being complex and hard to learn
Ideal for:
Ideal for organizations with technical expertise and resources to manage open-source solutions. It is especially suitable for DevOps teams and enterprises looking for a highly scalable and customizable monitoring tool.
3. Nagios Core
Nagios Core is an open-source IT infrastructure monitoring solution known for its robust plugin ecosystem and flexibility. It can monitor things like servers, network devices, applications, and more.
Nagios Core can track the health of your Windows machines, but it usually requires installing an agent on each server. This agent allows Nagios Core to delve deeper and monitor things like specific services or disk usage.
Features:
- Open-source monitoring
Pros:
- Strong community support
- Extensive plugin ecosystem
- Highly customizable
- Community-created plugins available to extend Nagios Core’s functionality
Cons:
- Complex configuration
- Outdated interface
- High upfront cost (time & expertise)
- User reviews complain about difficulties with installing plugins
Ideal for:
Nagios Core is ideal for organizations with in-house technical expertise looking for a free, robust monitoring solution. It is particularly suitable for those needing Windows monitoring tools open source and free Windows server monitoring tools that can be extensively customized to meet specific requirements.
4. Sensu
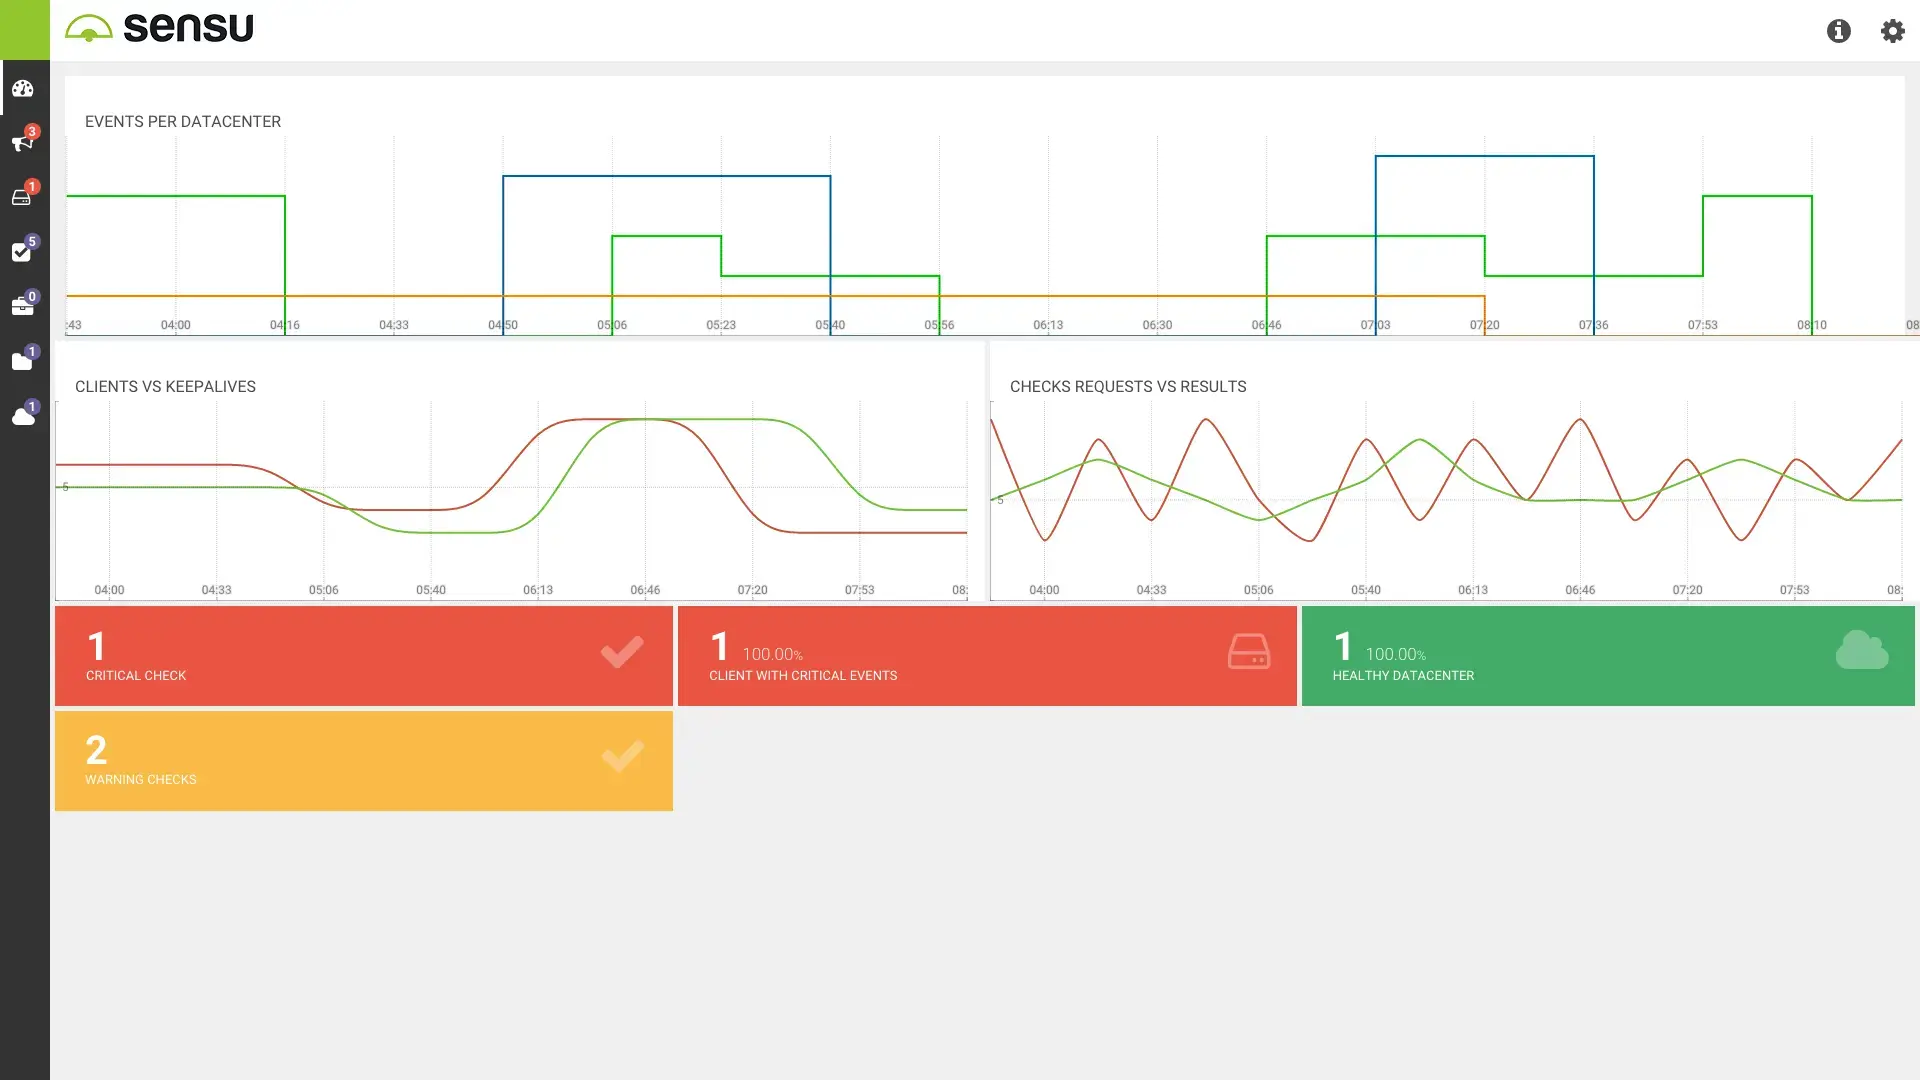
Sensu, like Nagios Core, is an open-source monitoring tool for IT infrastructure. However, Sensu focuses on scalability and flexibility, making it particularly well-suited for cloud environments and modern applications. Sensu works for Windows server monitoring too. It installs an agent on each Windows machine to gather in-depth data on services, disk usage, and other key metrics.
Features:
- Open-source monitoring
Pros:
- Flexible
- Scalable
- Strong community support
Cons:
- Requires configuration
- Can be resource-intensive
- High upfront cost (time & expertise)
Ideal for:
Sensu is ideal for enterprises needing a flexible and scalable monitoring solution. It suits organizations looking for Windows service monitoring tools open source and free open source network monitoring tools that can be tailored to specific needs.
5. Icinga
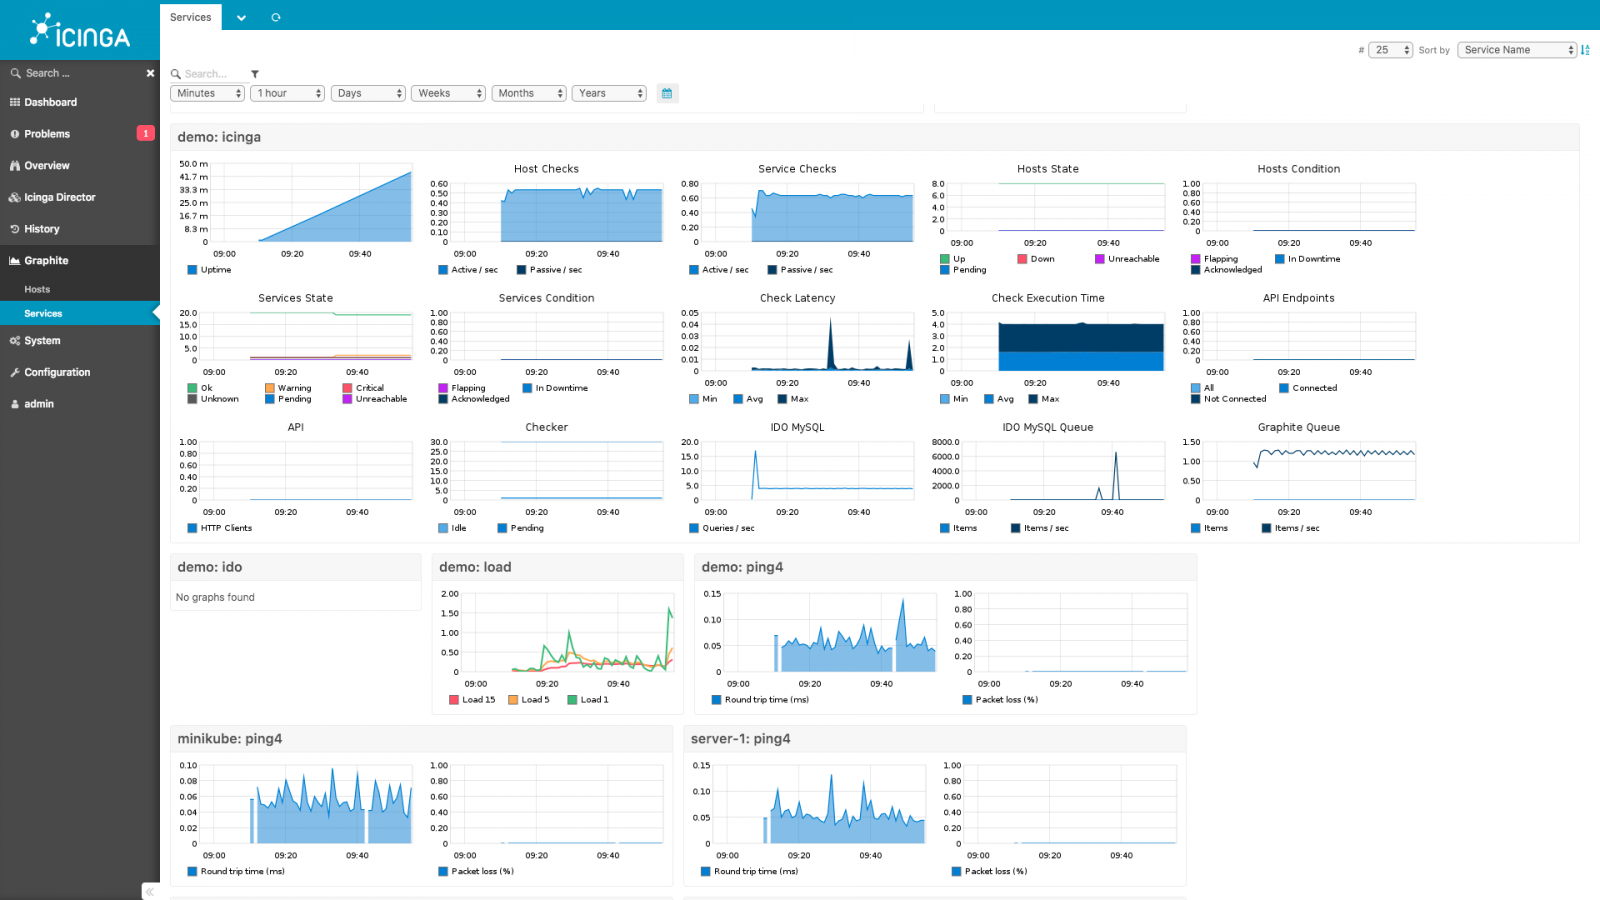
Icinga Core, similar to Nagios, is a free and open-source monitoring powerhouse. It keeps a watchful eye on your entire IT infrastructure, including servers, network devices, and applications. When things go south, Icinga Core fires off alerts to notify you before users are affected.
Icinga can monitor the health of Windows servers but typically requires an agent on each machine. This agent unlocks deeper monitoring, checking specific services or disk usage. Plus, Icinga has a vibrant community creating plugins to expand its Windows monitoring capabilities.
Features:
- Open-source monitoring
Pros:
- Highly customizable
- Strong community support
- Scalable
Cons:
- Complex setup
- Requires technical expertise
- High upfront cost (time & expertise)
Ideal for:
Icinga is ideal for medium to large organizations needing flexible and scalable monitoring. It is particularly well-suited for those requiring Windows system monitoring tools open source and open source network monitoring tools for Windows.
Conclusion
Finally, our list ends here.
As much as the tools might look great on the screen, actually testing and using the tool will prove to be the biggest indicator of success.
For organizations seeking a balance between functionality, ease of use, and cost-effectiveness, Sematext emerges as a top choice among Windows server monitoring tools and Windows service monitoring tools.
Its user-friendly interface, out-of-the-box dashboards, and alert rules save time and effort, while its flexible pricing model ensures that businesses only pay for what they need.
Keeping your IT infrastructure running smoothly often depends on how well your Windows servers are monitored. Managing a small network or overseeing an enterprise system both require proactive server management to avoid downtime and ensure optimal performance.
This guide talks about best practices, key strategies, and essential tools for effective Windows server monitoring.
Why Windows Server Monitoring Matters
Windows Server forms the backbone of many organizations’ IT environments. From hosting databases and running applications to managing web servers, its performance directly impacts business operations. However, even reliable systems can face challenges like:
- Hardware Failures: Hard drives, memory, or power supplies can give up without warning.
- Security Threats: Cyberattacks and malware often target Windows servers.
- Performance Bottlenecks: Overloaded applications, network traffic, or system processes can slow things down.
- Configuration Issues: Incorrect settings or changes can lead to unexpected behavior.
Proper monitoring helps catch these issues early, allowing you to fix them before they escalate into critical problems that disrupt operations.
For a deeper understanding of the differences between observability, telemetry, and monitoring, check out our detailed guide here.
Key Elements of Effective Windows Server Monitoring
Building an effective Windows server monitoring strategy means focusing on several key areas. Here’s what to prioritize:
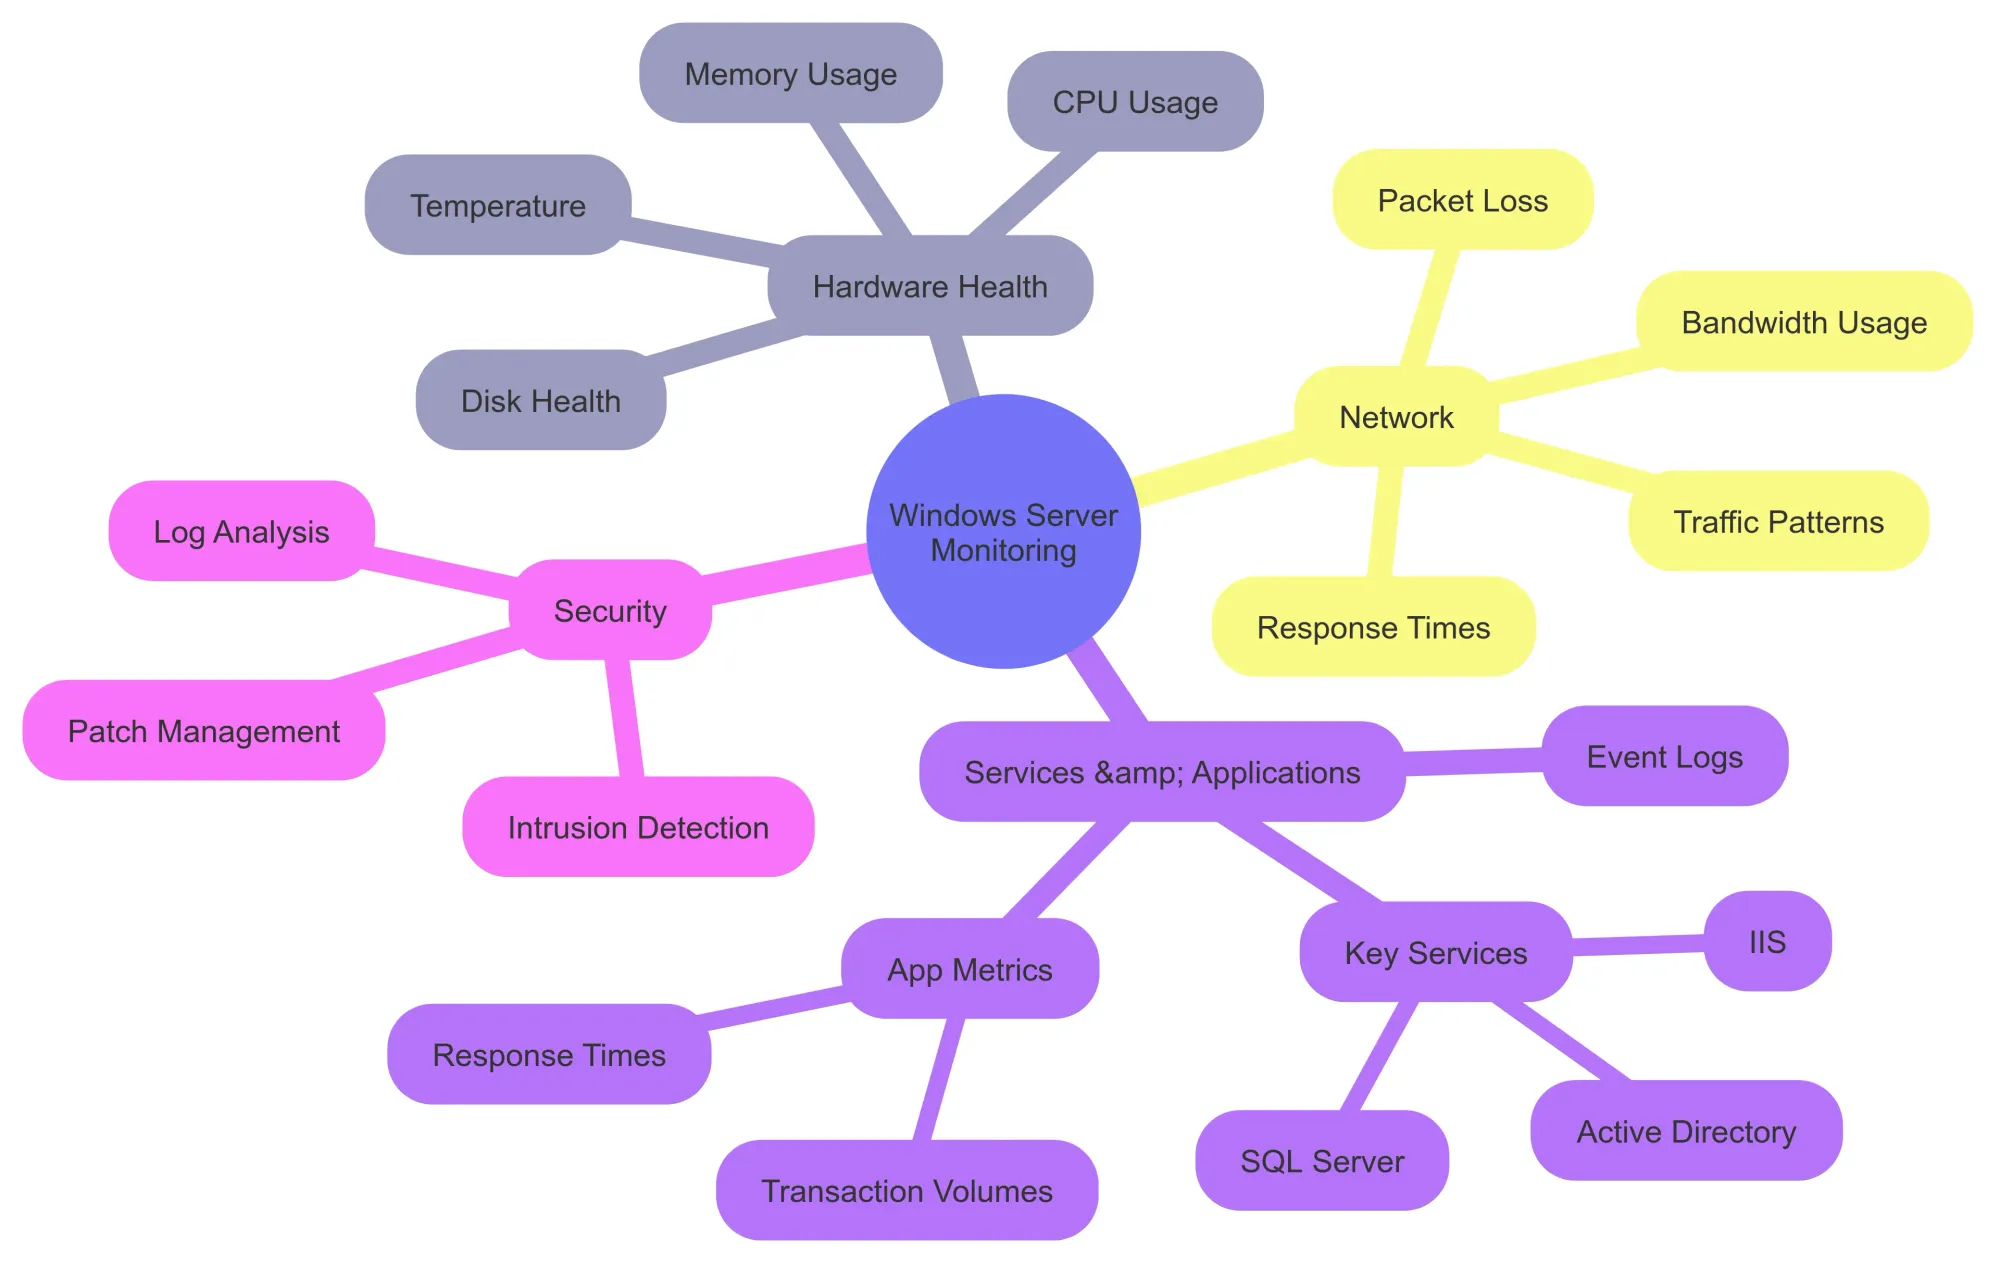
1. Hardware Health Monitoring
The performance of your server starts with its hardware. A malfunction here can lead to major disruptions. Hardware monitoring tools help track critical components like:
- CPU Usage: High CPU usage might indicate inefficient processes or system overload.
- Memory Usage: Low available RAM can slow down applications or even crash the server.
- Disk Health: Keeping tabs on disk space and I/O operations helps prevent data loss and sluggish performance.
- Temperature: Overheating can cause physical damage over time.
Monitoring these metrics ensures your hardware stays reliable and spots problems before they escalate.
2. Network Monitoring
A reliable network is essential for your Windows servers to perform well. Monitoring key network metrics ensures smooth operations. Focus on:
- Bandwidth Usage: Detect and resolve network bottlenecks.
- Packet Loss: Pinpoint connectivity issues impacting server performance.
- Response Times: Ensure optimal server communication and user experience.
Network monitoring tools can also identify unusual traffic patterns, signaling potential security breaches or unauthorized access.
3. Service and Application Monitoring
Your Windows server likely supports critical applications, from databases to web services. Keeping them running smoothly involves:
- Monitoring Key Services: Check the health of services like IIS, SQL Server, and Active Directory.
- Analyzing Event Logs: Spot warnings or errors before they turn into outages.
- Tracking App Metrics: Measure response times, transaction volumes, or other app-specific metrics.
This proactive approach helps prevent downtime and maintain optimal application performance.
To learn more about how synthetic monitoring can improve your server’s performance, check out our article here.
4. Security Monitoring
Security threats are always evolving, so protecting your servers is a must. A robust security monitoring strategy should include:
- Log Analysis: Review security logs regularly for signs of breaches or anomalies.
- Intrusion Detection: Use IDS tools to catch unauthorized access or suspicious activity.
- Patch Management: Keep systems updated with the latest patches to close security gaps.
Monitoring Windows servers is essential for keeping your infrastructure healthy and secure. There are several tools available, each offering unique features to help you track your server’s performance.
Let’s explore some of the top options available today.
Windows Performance Monitor
Windows Performance Monitor is a built-in tool available with every version of Windows Server. It provides deep insights into your server’s performance, from CPU and memory usage to disk activity and network performance.
Key Features:
- Customizable Tracking: Track various metrics like CPU usage, memory, disk activity, and network performance.
- Alerts: Set up alerts for predefined thresholds to get notified of issues.
- Free: Since it’s built into Windows, there’s no extra cost.
User Perspective:
This tool works well for users familiar with Windows Server tools. While powerful, its interface can be a bit complex for beginners.
Nagios Core
Nagios Core is a widely used open-source solution recognized for its flexibility and scalability. It’s ideal for monitoring Windows servers, applications, and network devices.
Key Features:
- Comprehensive Monitoring: Tracks system health, services, and applications.
- Extensive Plugin Support: Allows monitoring of additional metrics with plugins.
- Customizable Alerts: Sends notifications when thresholds are exceeded.
User Perspective:
People with technical expertise value Nagios Core’s adaptability, but the setup process may be overwhelming for newcomers.
SolarWinds Server & Application Monitor
SolarWinds SAM is a user-friendly solution designed for Windows server monitoring. It delivers comprehensive tracking of server health and application performance.
Key Features:
- Easy-to-Use Interface: Provides a clean, intuitive dashboard.
- Detailed Reporting: Generates customizable reports to identify trends.
- Real-Time Alerts: Instantly notify you when thresholds are crossed.
User Perspective:
Businesses looking for simplicity and reliable support often choose SolarWinds, despite its cost.
PRTG Network Monitor
PRTG Network Monitor offers robust Windows server monitoring through sensors, providing real-time insights into server health and network performance.
Key Features:
- Comprehensive Sensors: Monitors metrics like CPU load, disk space, and bandwidth.
- Real-Time Alerts: Sends notifications when metrics exceed thresholds.
- User-Friendly Dashboard: Quickly highlights issues with a clean interface.
User Perspective:
Organizations with complex infrastructures appreciate PRTG’s ease of use, but its cost can increase based on the number of sensors required.
ManageEngine OpManager
ManageEngine OpManager provides versatile monitoring for Windows servers. It delivers a centralized view of performance, network status, and server health.
Key Features:
- Real-Time Monitoring: Tracks server health, performance, and network status.
- Alert System: Notifies you of issues affecting performance.
- Centralized Dashboard: Offers a clear overview of key metrics.
User Perspective:
OpManager is favored for its robust features and centralized visibility, though its pricing may require careful evaluation.
Best Practices for Windows Server Monitoring
Using the right tools is only part of the puzzle. To truly keep things running smoothly, it’s also important to follow some best practices.
Here are a few simple guidelines to help you stay on top of your server monitoring:
1. Set Clear Monitoring Objectives
Before you dive into the world of monitoring, take a moment to figure out what you’re trying to achieve.
- Are you focused on preventing server crashes?
- Boosting security?
- Maybe just keeping an eye on performance?
Having clear goals helps you choose the right metrics to track and avoid getting lost in a sea of unnecessary data.
2. Automate Alerts and Notifications
Why spend your day constantly staring at dashboards? Set up automated alerts that will notify you when things go haywire—whether it’s high CPU usage, low disk space, or a service going down.
This way, you can rest easy knowing you’ll be notified instantly, and you can jump into action without having to monitor things manually all day.
3. Regularly Review Logs and Metrics
Reviewing your system logs and performance metrics regularly helps you spot potential issues before they turn into bigger problems. Set a schedule to go through your logs, and ensure they’re stored in a way that’s easy to access when needed.
4. Maintain Backup Systems
No system is perfect, and monitoring tools can miss things. That’s why it’s crucial to have a solid backup plan in place.
Make sure you’re regularly backing up your data and testing your disaster recovery procedures. It’s better to be prepared than to be scrambling when things go wrong!
For insights into taking a proactive approach to monitoring, check out our blog on Proactive Monitoring.
5. Stay Current with Updates
Just like your server software, your monitoring tools need regular updates too. These updates often come with new features, bug fixes, and security improvements that make sure you’re always ahead of the game. So, don’t let your tools fall behind—keep them updated to stay on top of things.
How to Set Up a Monitoring System
Monitoring your servers is crucial to ensure they stay healthy and perform well. This guide walks you through the essential steps to set up an effective server monitoring system, so you can catch potential issues before they become costly problems.
1. Assess Your Monitoring Needs
The first step is understanding what you need to monitor. This depends on the scale and complexity of your infrastructure.
- Infrastructure Type: Are you monitoring one server or a whole data center?
- Key Metrics: CPU usage, memory consumption, disk space, and network traffic are common ones.
- Security & Compliance: Consider if you need to track security threats or comply with industry regulations.
2. Select the Right Tools
Choose monitoring tools that match your needs and can scale with your infrastructure.
Key factors to consider:
- Scalability: Can the tool handle growth?
- Ease of Use: It should be intuitive so your team can spot issues quickly.
- Real-Time Monitoring: Tools that provide instant alerts are essential.
- Customization: Look for tools that let you adjust thresholds and track the right metrics.
Popular tools include:
- Nagios: Great for flexibility and open-source options.
- PRTG: Offers a user-friendly interface.
- SolarWinds: Comprehensive tool for monitoring server health.
3. Define Metrics and Set Thresholds
Now that you have your tools, it’s time to set what to monitor.
Common metrics to track:
- CPU & Memory Usage: Monitor system performance and prevent bottlenecks.
- Disk Space & Network Traffic: Keep an eye on storage health and network efficiency.
- Service Status: Ensure essential services like your web server or database are running.
Here’s an example for monitoring CPU with Nagios:
define command{
   command_name check_cpu
   command_line $USER1$/check_cpu -w 80 -c 90
}
4. Set Up Alerts and Notifications
Alerts notify you of potential issues before they cause downtime. Set alerts for:
- Thresholds Exceeded: For example, CPU usage is over 90%.
- Service Failures: If key services stop unexpectedly.
- Security Threats: For unauthorized logins or malware activity.
Make sure to send alerts via email, SMS, or Slack to ensure your team gets them instantly.
5. Implement Logging and Reporting
In addition to alerts, logs are crucial for troubleshooting and performance analysis.
Types of logs to keep:
- Event Logs: Track system start, shutdown, and error events.
- Performance Logs: Monitor system metrics over time.
- Security Logs: Keep tabs on security-related activities like login attempts.
Generate regular performance reports to spot recurring issues and areas for improvement.
6. Test and Optimize the System
Once everything is set up, test the system by simulating issues like high CPU usage or service failure. This helps ensure the system works as expected.
Areas to test:
- Alert Sensitivity: Make sure alerts trigger when needed and don’t overwhelm you with false positives.
- Notification Delivery: Verify alerts are reaching the right channels.
- Logging Accuracy: Ensure logs capture relevant data.
Adjust settings based on the test results to fine-tune the system.
7. Ongoing Maintenance
Keep your monitoring system up to date and continually review your metrics and thresholds as your infrastructure evolves.
Regular tasks:
- Update Tools: Keep your monitoring tools and server software up to date.
- Review Metrics: Adjust monitoring metrics as your infrastructure changes.
- Refine Alerts: Tweak thresholds to avoid alert fatigue and improve response accuracy.
Why Integration and Security Matter for Server Monitoring
When setting up server monitoring tools, it’s not just about performance; integration with your cloud services and ensuring security are just as important.
Here’s why these two elements should be top of mind:
Integration with Cloud Services
Today, most businesses rely on cloud platforms like AWS, Azure, or Google Cloud for hosting applications and infrastructure. For your server monitoring system to be effective, it needs to integrate smoothly with these platforms.
Key Things to Keep in Mind:
- Multi-Cloud Monitoring: If you’re using more than one cloud platform, make sure your monitoring tool can pull data from all of them. A unified dashboard makes it easy to keep track of everything.
- API Integration: Cloud services offer APIs that your monitoring tool can use to pull metrics and performance data. Make sure your tools can connect to these APIs for real-time insights.
- Cloud-Specific Metrics: Every cloud provider offers unique metrics (like CPU usage or network traffic). Your monitoring tool should be able to capture these to give you an accurate view of your entire system.
- Scalability: As your cloud environment grows, your monitoring system should grow with it. Ensure the tools you choose can handle more data and scale as needed.
For insights on ensuring optimal performance of your APIs, check out our blog on API Monitoring.
Security Risks in Server Monitoring
While server monitoring is essential for system health, it can also expose you to security risks. If not set up correctly, monitoring tools can be a potential gateway for cyber threats.
Common Risks to Watch For:
- Exposure of Sensitive Data: Monitoring tools collect a lot of data, from system logs to performance metrics. If this data isn’t encrypted or properly protected, it’s vulnerable to attacks.
- Unauthorized Access: Since monitoring tools have access to critical systems, they’re prime targets for hackers. Use strong authentication and limit access to only those who need it.
- Insecure Integration: Integrating with external services (cloud platforms, APIs) can create weak points if not done securely. Always use secure protocols and encrypt data when integrating with third-party tools.
- Denial of Service (DoS) Attacks: Monitoring systems can be vulnerable to DoS attacks, especially if they’re exposed publicly. Keep your monitoring system behind a firewall or VPN.
- Misconfigured Alerts: Monitoring tools are only useful if they alert you to the right issues. Regularly check your alert configurations to avoid missing critical events or being flooded with false alarms.
Encryption
Always encrypt both data in transit and at rest to ensure attackers can’t access or misuse sensitive information.
Role-Based Access Control (RBAC)
Implement RBAC to restrict access to sensitive data. Only authorized users should have access to critical monitoring data, reducing the risk of insider threats or accidental exposure.
Regular Audits
Conduct regular audits to identify vulnerabilities, misconfigurations, or potential threats in your monitoring system. These audits ensure your security practices remain current and effective.
Network Segmentation
Isolate your monitoring tools from the rest of your network. This limits exposure in case of a breach and helps minimize the impact of potential attacks.
Patch Management
Regularly update your monitoring tools to protect against known vulnerabilities. Apply security patches as soon as they become available to keep your system secure.
Conclusion
Choosing the right monitoring tools and sticking to best practices is key to keeping your Windows servers running smoothly. With the right approach, you’ll be able to address issues before they become problems and maintain a reliable IT environment.
If you’re looking for a simpler way to manage observability, Last9 has you covered. We make Cloud Native monitoring easier and more affordable for companies like Disney+ Hotstar, CleverTap, Replit, and Axio.
Our platform integrates with Prometheus and OpenTelemetry to bring together your metrics, logs, and traces, all while handling complex data seamlessly—so your teams get the insights they need when they need them.
Book a demo with us or try it out for free!
Windows server monitoring tools are essential for the maintenance of server health for smooth operations and the prevention of crashes. Windows server monitoring tools help admins proactively track and respond to errors, issues, and downtime, and these steps will help prevent major breakdowns and outages and avoid breaches of the SLA (Service Level Agreement).
There are 4 benefits of Windows server monitoring tools.
- Monitor server health to reduce crashes and outages
- Increase availability of servers, applications, and related services
- Quickly identify and fix errors, failed services, and processes
- Help maintain smooth operations to increase trust in the company/product or service
Geekflare team has compiled this list of the top tools to monitor Windows servers based on features like the user-friendly dashboard, event log monitoring, packet sniffing, etc.
- 1. PRTG
- 2. Opsview
- 3. Sysguage
- 4. ManageEngine
- 5. SolarWinds
- 6. Nagios XI
- 7. Zabbix
- 8. Checkmk
- 9. Icinga
- 10. Syskit
- Show moreShow less
You can trust Geekflare
At Geekflare, trust and transparency are paramount. Our team of experts, with over 185 years of combined experience in business and technology, tests and reviews software, ensuring our ratings and awards are unbiased and reliable. Learn how we test.
1. PRTG
PRTG Network Monitor, a mature and widely trusted monitoring solution since 1997, offers a comprehensive suite of capabilities specifically designed for in-depth Windows Server monitoring. Trusted by over 500,000 users globally, PRTG provides a centralized and efficient way to keep a pulse on your critical Windows infrastructure.
PRTG employs a variety of industry-standard technologies to gather detailed monitoring data from your Windows servers, including WMI, Windows performance counters, SNMP, packet sniffing, and NetFlow. This multi-faceted approach ensures a comprehensive collection of metrics, all presented within a unified and intuitive dashboard.

The software provides extensive monitoring for a wide array of server types, such as database, email, web, and virtual servers. It goes beyond basic checks to monitor critical parameters like uptime, CPU and memory utilization, disk activity, and network traffic bandwidth.
PRTG assists with proactive maintenance by tracking patches and updates, alerting administrators to incomplete updates that could pose security risks or impact performance. Its built-in alerting system provides timely notifications when monitored resources exceed predefined thresholds, enabling rapid response to potential issues.
One of PRTG’s key strengths is its speed of deployment. Administrators can quickly initiate monitoring by simply entering an IP range. The software’s automatic network discovery and predefined sensors instantly identify and configure monitoring for Windows servers, leveraging industry-standard sensors to begin collecting data immediately.
PRTG Features
- Monitor your Windows servers from anywhere with the dedicated mobile application.
- Gain insight into Windows application and system events with monitoring of logs, triggering alerts for errors and critical events.
- Tailor monitoring metrics and thresholds to precisely match your specific infrastructure requirements and priorities.
- Access historical performance graphs for up to 365 days, enabling trend analysis, capacity planning, and retrospective troubleshooting.
The full version of PRTG can be installed and deployed within your environment, offering complete control over your monitoring infrastructure.
PRTG
2. Opsview
Opsview helps observe, analyze, monitor, and automate end-to-end IT services, applications, and solutions. Opsview supports databases, virtual environments (AWS, Azure), operating systems, networks, websites, and more.
Opsview platform monitoring provides comprehensive coverage of Windows and related services and applications in one centralized dashboard, to name a few:
- Hardware Monitoring: Monitoring CPU, Disk Queue, Paging Files, Physical Memory, Windows Events, etc.
- Event log monitoring: application, system, and security logs
- Services: Active Directory Monitoring, DNS, IIS, Exchange, SQL, Azure, Terminal Services, etc.
If you are an IT administrator or systems administrator looking for a monitoring and management solution for your IT infrastructure, Opsview easily integrates into your environment, regardless of scale, type, product, and depth.
Opsview
3. Sysguage
Sysguage server monitoring software helps monitor and access all hardware resources used to start a Windows server. It is one of the easiest software to organize, monitor, and review reports and take necessary actions whenever needed.
Sysguage’s user-friendly dashboard helps ease the operation and management of Windows servers by locating higher usages and bottlenecks. Pre-configured metrics help enable and initiate monitoring instantly, and you can even customize counters to suit your infrastructure needs.

Sysgauge has a client-server model wherein the server package is installed on the server, and metrics can be accessed from any system on the network via its client interface software. The client interface helps configure server monitor counters, set up email notifications for any threshold violations, monitor performance through various reports, and much more.
Sysgauge’s system administrators can monitor up to 200 resource counters on Windows servers, including memory usage, disk activity, network activity, processor threads, and TCP/IP protocol. Along with these resources, NAS (Network Attached Server), SQL Server, and IIS Server can be monitored.
Sysgauge’s reporting engine offers various types of notifications and reports, including audio error notifications, emails, Excel reports, PDF reports, and more.
Sysgauge
4. ManageEngine
ManageEngine Application Monitoring software has over 120+ awards for various IT management software, including Gartner’s 2021 Magic Quadrant for Application Performance Monitoring. The Windows server monitoring is one of the features of ManageEngine Application Monitoring software.
ManageEngine is a wide-ranging monitoring software that monitors hardware and software resources of Windows servers, Windows clusters, SQL, web servers, virtual servers, website statistics, and more.
Hardware components monitoring contains detailed performance counters for critical factors such as CPU fan speed, individual CPU core temperature and utilization, disk I/O statistics, and more, which are taken care of by Manage Engine. The software takes care of basic troubleshooting actions such as threshold alarms, email or SMS notifications for Windows events related to applications, system, security, file replication services, DNS server monitoring, server restart, disk space issues, and more.
On the reporting front, ManageEngine provides various reports that are to be pulled from the dashboard, including capacity planning reports that help predict overutilization and underutilization of the server to prevent a server overload or crash.
ManageEngine Features
- Scheduled Windows tasks can be monitored to optimize performance
- Event log monitoring to detect network anomalies, data breaches, and network breaches
- Collects network performance statistics such as incoming traffic, outgoing traffic, network errors, speed
- Forecast usage trends based on server usage and performance
ManageEngine is available in two versions: Professional and Enterprise. Users can use the license in both subscription and perpetual editions.
ManageEngine
5. SolarWinds
SolarWinds Microsoft monitoring covers all Microsoft products and services such as Windows Server, SQL-DB, Hyper-V, Azure, and more.
The extensive platforms such as Azure Monitor and AWS IaaS, PaaS, and SaaS are monitored by SolarWind servers and application monitoring software (SAM). SAM tracks the entire Microsoft IT stack, including performance, uptime, capacity, and resource utilization.

SolarWinds’ prognostic indicators easily detect when server resources reach critical warnings and thresholds, which is one of the important criteria for taking precautions to avoid crashes and disruptions.
SolarWinds’ SAM monitors physical components and applications, including high CPU usage, disk usage, network load balancing, print services, remote desktop services, FTP services, and more. The software also tracks performance metrics related to paging file usage, CPU time, pages/second, disk queues, and more.
One of the advantages for enterprises having heterogeneous environments is the SolarWind software, which offers customizable server monitoring using APIs and around 1200+ monitoring templates. Basic troubleshooting, including detecting hardware errors, restarting the server, and monitoring server health, is performed using SAM.
SolarWinds Features
- Help build an IT asset inventory by identifying and collecting hardware and software assets.
- Identify Active Directory performance issues and fixes
- Monitor DNS for availability and performance issues
- Helping server size based on estimation and determination of server capacity
In a nutshell, SolarWinds’ centralized SAM console can closely monitor Windows Server, Active Directory, IIS, Exchange Server, Dynamics CRM, Skype for Business, SQL Server, SharePoint, DHCP, and DNS.
SolarWinds
6. Nagios XI
Nagios XI is an enterprise server and network monitoring software trusted by millions of users ranging from small businesses to the Fortune 500. It provides full IT infrastructure monitoring with transparency, performance, and customization with ease of use.
Nagios XI covers all infrastructure components, including applications, services, operating systems, network protocols, system metrics, and network infrastructure.
Nagios XI offers integration with hundreds of third-party add-ons to monitor almost all applications, services, and internal systems, making it compatible with heterogeneous environments. The software is built with four monitoring engines that provide the highest degree of monitoring server performance with high efficiency and scalability effectiveness.
Nagios XI provides full real-time monitoring of critical Windows services such as system metrics, processes, performance counters, event logs, Internet Information Server (IIS), Active Directory, DHCP, Exchange Server, DNS, and more.
Nagios XI Features
- A centralized and dedicated dashboard that provides general information about network hosts, services, and devices.
- Granular performance data of Windows operating systems
- Comprehensive monitoring of Windows processes from start to finish, including instances
- Monitors network adapters for unexpected bandwidth over a period of time
Nagios XI’s software tracks the complete end-to-end server hardware, including network statistics, hard drive usage, CPU utilization trends, and memory performance. System administrators can also take advantage of advanced user management, easy setup, automatic discovery, system upgrades based on capacity planning, and more.
Nagios XI
7. Zabbix
Zabbix is a professionally developed open-source software to monitor and track any metric from any source in IT infrastructure. Zabbix software monitors the health and integrity of servers, virtual machines, network parameters, applications, services, databases, websites, and the cloud.
Zabbix agent needs to be installed for deep monitoring of Windows servers while other infrastructure components can be monitored via protocols like SNMP, TCP, ICMP, etc.
Zabbix helps to monitor, track and present every granular detail of servers such as CPU, memory, file system, physical disk, etc., through XML-based templates to measure performance for efficient server infrastructure management.
Zabbix’s email-based notifications allow for quick response to server issues. This software provides the best results in terms of reporting and visualization of excellent capacity planning data.
Zabbix Features
- Automatically set baseline based on historical data to bypass manual threshold setting
- Early prediction of problem thresholds for a proactive approach
- Automatically detects bottlenecks within the incoming metric flow
- Export open issues in real-time to third-party systems for further analysis
Zabbix’s web-based frontend ensures the health of the servers can be monitored and supported remotely. Zabbix can be used by small organizations to large companies and, importantly, free of cost. YES, Zabbix is free of cost. Its customer support is commercial.
Zabbix
8. Checkmk
Checkmk is a comprehensive monitoring software not only for servers but also for applications and networks. The software is easy to use as it was developed after years of research and customer feedback. Its main engine has a massively scalable architecture that supports thousands of services, hundreds of websites and millions of devices disturbed across multiple locations.

The automation section of Checkmk is versatile and includes automation of configuration using REST-API, automatic monitoring of Ephemeral infrastructure, rule-based 1-to-N configuration that minimizes configuration in complex environments, and automation of third party applications using API.
Checkmk’s software database contains 1900 plugins so that almost any software can be easily integrated. The appropriate indicators can be monitored and tracked in heterogeneous environments such as easy to manage incidents by integrating with third-party tools like Jira, Slack, PagerDuty, etc., and VictorOps.
Checkmk is one of the top-notch monitoring software suitable for small to complex infrastructure. One of its uniqueness is that it uses advanced analytics based on observational algorithms that predict thresholds based on historical events.
Checkmk Features
- Easily identify hosts to update with hotfixes with outdated and vulnerable software versions.
- Automatically detects relevant indicators and starts monitoring in minutes
- Customizable dashboard based on admin requirements and can even be integrated with Grafana
- Smart alert mechanism to forward alerts to specific admins instead of overloading all alerts
Checkmk can be easily customizable to suit all hardware and software monitoring, troubleshooting, log monitoring, reporting, integration with ITOM/ITSM tools to streamline workflows, automate configuration, scalability, and more.
Checkmk
9. Icinga
Icinga Infrastructure Monitoring can monitor large and complex environments across multiple locations. The platform monitors network resources, warns users of errors, and collects data for reporting purposes.
It is a full-stack monitoring suite that supports infrastructure monitoring, metrics and log files, monitoring automation, cloud monitoring, and more. You can look at the live demo at the Icinga demo link.

Icinga software monitors Linux, UNIX, Windows servers on-premises and in the cloud, and immediately notifies administrators of errors and helps fix them. A centralized dashboard helps monitor the entire infrastructure, collecting and analyzing data to identify faults at a glance.
Icinga’s scalability model adapts easily to your current infrastructure and offers endless possibilities for configuration, automation, scaling, etc. Icinga even communicates with DevOps tools to create custom monitoring solutions to suit your infrastructure needs.
Features
- Proactively notify errors before interrupts are made
- Provides entry point for proper RCA (Root Cause Analysis)
- Offers various plugins for easy integration with other services/products
- Administration and user management to control software usage for better management
Icinga can fit into a large heterogeneous environment. The software covers six key infrastructure areas to provide valuable insights, alerts, visual imagery, and analytics to support end-to-end coverage and improve business results. Prices are available upon request for a quote.
Inciga
10. Syskit
Syskit Monitor is a tool for monitoring and managing enterprise servers. It is used to monitor virtual applications on Citrix, Share Point, SQL and Windows servers, RDP sessions, and Gateways.

Apart from monitoring, Syskit assists in user activity auditing. Main functions include monitoring server performance in terms of CPU, memory, and disk usage, SQL transactions, IIS connections, remote connections to servers, and more.
Syskit tracks server usage in terms of access duration, concurrent connections, and usage efficiency. It tracks user activity related to server connections, user logins/outlets, etc.
Syskit
Conclusion 👇
The monitoring of Windows servers has become an important task for companies of all sizes and from all sectors.
Windows server monitoring is important to help organizations take proactive steps to detect problems, prevent them before they occur, and avoid bigger issues before high-priority incidents arise.
Windows monitoring software helps to detect a variety of server issues, including RAM (Random Access Memory) leaks to address performance issues, prevent attackers from gaining access, block updates from unreliable resources, easily find bottlenecks, and most importantly, help with troubleshooting, and get the server online faster.
Learn More About Website Monitoring
-
Best Website Monitoring Solutions
-
Best Tools to Monitor Website Changes
-
Top Open-Source Monitoring Tools
Главная →
Блог →
Мониторинг компьютеров в локальной сети
Мониторинг компьютеров в локальной сети

Сегодня в каждом бизнесе – и в небольших компаниях, и в крупных предприятиях –используются компьютерные системы, которые необходимы для работы сотрудников, управления бизнес-процессами и обеспечения безопасности. В таких условиях важно иметь возможность отслеживать состояние всех устройств и серверов, чтобы избежать сбоев и обеспечить стабильную работу. Для этого используются различные программы мониторинга, которые позволяют получать подробную информацию о текущем состоянии всех устройств, сети и системы в целом.
Мониторинг компьютеров и серверов в локальной сети помогает системным администраторам выявлять проблемы с оборудованием, приложениями и сервисами, а также оперативно реагировать на любые сбои. Это особенно важно для обеспечения стабильной работы организации и безопасности информации. В этой статье мы подробно рассмотрим, что такое мониторинг локальной сети, какие инструменты для этого существуют, какие задачи он решает и почему важно внедрить системы мониторинга в работу любой организации.
Зачем нужен мониторинг компьютеров в локальной сети
Мониторинг устройств в локальной сети выполняет несколько ключевых задач:
- Обеспечение безопасности позволяет отслеживать потенциальные угрозы и предотвращать утечки данных или несанкционированный доступ.
- Управление ресурсами помогает анализировать нагрузку на серверы и устройства, а также оптимизировать использование ресурсов.
- Реагирование на сбои – с помощью мониторинга можно оперативно обнаружить сбой в работе оборудования или программного обеспечения и быстро устранить его.
- Оптимизация работы сотрудников – мониторинг позволяет выявить проблемы с производительностью и настройками рабочих станций, что может повлиять на эффективность работы сотрудников.
- Анализ использования сетевых ресурсов позволяет отслеживать трафик, используемый приложениями и пользователями, чтобы избежать перегрузки и потери производительности.
Среднее время реакции на обращение: 13,5 мин.
Среднее время решения задачи: 1 час 21 мин.
Инструменты для мониторинга локальной сети
Существует множество программ и приложений для мониторинга локальной сети, которые предоставляют системным администраторам возможность отслеживать состояние всех устройств и процессов. Некоторые из них являются бесплатными, другие – платными с расширенными функциями.
Бесплатные программы для мониторинга
- PRTG Network Monitor – мощное программное обеспечение для мониторинга состояния серверов, устройств и сетевых ресурсов. Бесплатная версия позволяет мониторить до 100 сенсоров (агентов) и идеально подходит для небольших организаций.
- Zabbix – открытый инструмент для мониторинга, который предоставляет гибкие настройки и возможности для отслеживания различных параметров: от использования процессора до состояния дискового пространства.
- Nagios – популярная программа для мониторинга сетевых устройств и серверов. Позволяет настроить автоматическое обнаружение устройств и мониторинг в реальном времени.
- Cacti – инструмент для анализа трафика и использования ресурсов с помощью графиков. Программа работает с SNMP-протоколом и поддерживает множество устройств.
Платные решения для мониторинга
- SolarWinds Network Performance Monitor – решение для крупных организаций, позволяющее отслеживать состояние сети, устройства и приложения. Включает расширенные функции анализа и создания отчетов.
- ManageEngine OpManager – инструмент, предназначенный для мониторинга всей IT-инфраструктуры. Подходит для организаций любого размера и предоставляет подробную информацию о состоянии сети и серверов.
Как работает мониторинг компьютеров
Системы мониторинга анализируют состояние устройств, сетевых ресурсов и серверов с помощью различных технологий. Основные из них:
- SNMP-протокол (Simple Network Management Protocol) используется для получения информации о состоянии устройств и сетевых ресурсов.
- WMI (Windows Management Instrumentation) используется для мониторинга серверов и компьютеров, работающих под управлением операционной системы Windows.
- SSH (Secure Shell) используется для мониторинга Linux-систем.
- Агентский и безагентский мониторинг – в агентском мониторинге на устройства устанавливаются специальные агенты, которые собирают информацию. В безагентском мониторинге информация поступает через протоколы сети.
90% клиентов пришли к нам по рекомендации
Возможности и функции мониторинга
Программы для мониторинга локальной сети обладают широким набором функций, которые позволяют выполнять различные задачи. Перечислим некоторые из них:
- Мониторинг трафика и сетевых устройств позволяет отслеживать состояние всех подключенных устройств, анализировать трафик и выявлять потенциальные проблемы.
- Мониторинг дискового пространства и загрузки серверов помогает контролировать загрузку серверов, использование процессора и памяти, а также следить за состоянием жестких дисков.
- Уведомления и отчеты – в случае возникновения проблемы система отправляет уведомления через электронную почту, SMS или другие каналы связи, чтобы системный администратор мог быстро отреагировать.
- Реальный мониторинг в реальном времени позволяет отслеживать все параметры с точностью до секунды, что важно для оперативного реагирования.
- Анализ работы приложений и процессов помогает выявить «тяжелые» приложения, которые занимают слишком много ресурсов, или ошибки в их работе.
Как настроить систему мониторинга
Настройка программы для мониторинга локальной сети не требует сложных действий. Однако важно правильно выбрать программу, которая соответствует потребностям вашей компании.
- Выберите подходящее приложение. В зависимости от размера организации и количества устройств выберите программу, которая поддерживает нужное количество агентов.
- Установите программу на сервер. Для мониторинга вам нужно установить программу на сервер, который будет собирать информацию.
- Настройте параметры мониторинга. Определите, какие параметры вы хотите отслеживать: трафик, использование процессора, состояние серверов, дисковое пространство и другие.
- Настройте уведомления. Настройте систему уведомлений, чтобы получать оповещения о проблемах и сбоях в работе устройств.
- Запустите мониторинг. После настройки вы можете начать мониторинг и отслеживание состояния сети и оборудования.
Преимущества мониторинга компьютеров в локальной сети
- Повышение безопасности. Мониторинг позволяет вовремя обнаружить попытки несанкционированного доступа или атаки на систему.
- Управление ресурсами. С помощью мониторинга можно эффективно распределять ресурсы и избегать перегрузки серверов и сетевых устройств.
- Планирование обновлений и улучшений. Анализ работы устройств помогает выявить слабые места в инфраструктуре и заранее подготовиться к обновлениям оборудования.
- Повышение производительности. Мониторинг помогает оперативно устранять проблемы, которые могут замедлять работу сотрудников и сервисов.
Заключение
Мониторинг компьютеров в локальной сети является важной составляющей эффективного управления IT-инфраструктурой. Он позволяет системным администраторам не только выявлять проблемы в работе оборудования и программ, но и предотвращать сбои, улучшать безопасность и оптимизировать использование ресурсов. Использование современных программ для мониторинга – это не только способ улучшить стабильность работы компании, но и залог долгосрочного успеха и безопасности.
Преимущества мониторинга очевидны: снижение рисков, увеличение производительности и безопасность данных. Важно выбрать подходящее решение, которое будет эффективно работать в вашей организации и обеспечит вам полную картину состояния всей IT-инфраструктуры в реальном времени.
Остались вопросы?
Оставьте заявку и наш менеджер свяжется с Вами в течение 15 минут

Подберем индивидуальное
решение под ваш запрос
- Опыт более 8 лет в оказании ИТ-услуг
- В штате 20 квалифицированных специалистов с разными компетенциями
- Более 260 успешно реализованных проектов
Нажимая кнопку «Отправить», я даю свое согласие на обработку моих персональных данных, в соответствии с Федеральным законом от 27.07.2006 года №152-ФЗ «О персональных данных», на условиях и для целей, определенных в Соглашении на обработку персональных данных