
Windows · September 28, 2024
Windows Server 2012 introduced several enhancements aimed at improving system performance and resource management. One of the most valuable tools included in this operating system is the Resource Monitor. This utility provides real-time data about the system’s resource usage, allowing administrators to monitor CPU, memory, disk, and network activity effectively. Understanding how to utilize the Resource Monitor can significantly enhance the management of server resources, leading to improved performance and stability.
What is Resource Monitor?
Resource Monitor is a system monitoring tool that provides detailed information about the usage of hardware resources by various processes and services running on a Windows Server. It allows administrators to identify resource bottlenecks, troubleshoot performance issues, and optimize system performance. The Resource Monitor can be accessed through the Task Manager or directly via the Run dialog.
Accessing Resource Monitor
To access Resource Monitor in Windows Server 2012, follow these steps:
- Press
Ctrl + Shift + Escto open Task Manager. - Click on the Performance tab.
- At the bottom of the window, click on Open Resource Monitor.
Alternatively, you can open the Run dialog by pressing Windows + R, typing resmon, and hitting Enter.
Understanding Resource Monitor’s Interface
The Resource Monitor interface is divided into several tabs, each focusing on different resource types:
- CPU: Displays the current CPU usage, including processes using the most CPU resources, services, and associated handles.
- Memory: Shows memory usage details, including the amount of physical memory in use, available memory, and the processes consuming the most memory.
- Disk: Provides information about disk activity, including read and write speeds, and the processes accessing the disk.
- Network: Displays network activity, including data sent and received, and the processes using network resources.
Using Resource Monitor for Performance Monitoring
Resource Monitor is particularly useful for diagnosing performance issues. Here are some practical applications:
Identifying High CPU Usage
If a server is running slowly, the CPU tab can help identify processes that are consuming excessive CPU resources. For example, if a specific application is consistently at the top of the list, it may need optimization or replacement.
Memory Management
In the Memory tab, administrators can see which processes are using the most memory. If the system is running low on memory, it may be necessary to close certain applications or increase the server’s RAM.
Disk Activity Monitoring
The Disk tab allows for monitoring of read and write operations. If a server is experiencing slow disk performance, this tab can help identify which processes are causing the bottleneck.
Network Traffic Analysis
The Network tab provides insights into network usage. If users are experiencing slow connectivity, this tab can help identify if a particular application is consuming excessive bandwidth.
Conclusion
Resource Monitor is an essential tool for administrators managing Windows Server 2012. By providing real-time insights into CPU, memory, disk, and network usage, it enables effective troubleshooting and optimization of server performance. Understanding how to leverage this tool can lead to more efficient resource management and improved server reliability.
For those looking to enhance their server capabilities, consider exploring USA VPS Hosting options that can provide the necessary resources and support for your applications.
Resource Monitor is a great tool to identify which program/service is using resources like program, applications, network connection and memory usages.
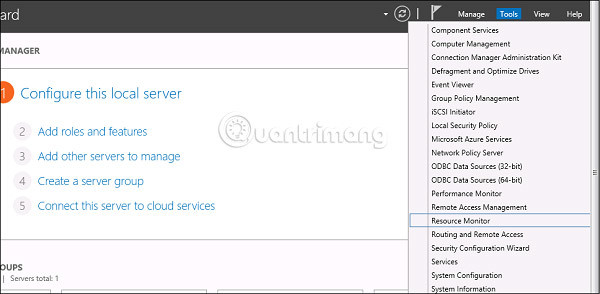
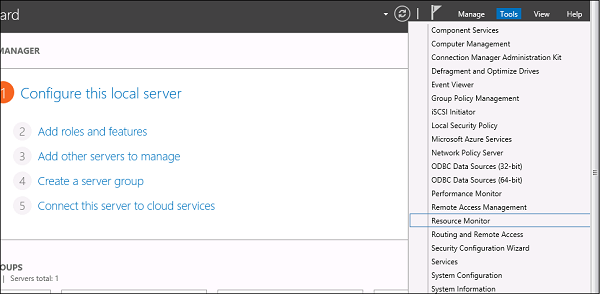
To open Resource Monitor, go to Server Manage → Tools.

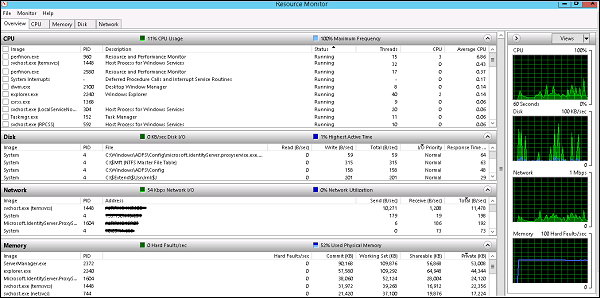
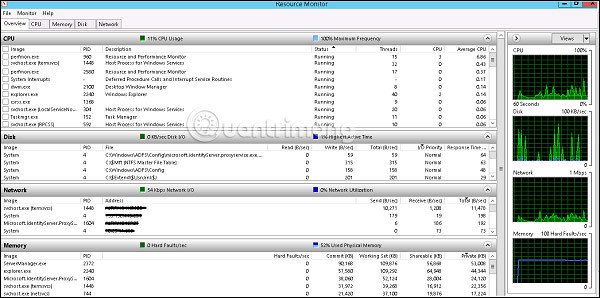
Click on “Resource Monitor”, the First Section is “Overview”. It tells how much CPU is consuming every application and on the right side of the table, it monitors in real time the chart of CPU usage. The Memory tells how much memory every application is consuming and in the right side of the table it is being monitored in real time in the chart of CPU usage.
The Disk tab splits it by the different hard drives. This will show the current Disk I/O and will show the disk usage per process. The network tab will show the processes and their network bytes sent and received. It will also show the current TCP connections and what ports are currently listening, IDs too.
- How to install and open File Server Resource Manager in Windows Server 2012
- How to install IIS in Windows Server 2012
The Resource Monitor is a great tool in Windows Server 2012 to determine which programs or services are using resources such as programs, applications, network connections, and memory.
To open the Resource Monitor, go to Server Manage → Tools .
Click on ‘ Resource Monitor ‘, the first part is ‘ Overview ‘. It indicates how much CPU is being used by each application and on the right side of the table, it tracks in real time the CPU usage chart. The Memorysectionindicates how much memory each application uses and on the right side of the table, it is being tracked in the CPU usage graph (in real time).
The Disk tab splits into different hard disks. This will show the current I / O drive and disk usage level for each process. The Network tab displays the processes and network bytes sent and received.It also displays current TCP connections, currently listening ports and IDs.
See more:
- How to enable Remote Desktop Management in Windows Server 2012
- Learn about firewalls, Windows Firewall on Windows Server 2012
- 6 ways to access Control Panel on Windows Server 2012
5 stars4 stars3 stars2 stars1 star3.7 ★ | 6 Vote
You should read it
- Learn about Windows Server 2012 (Part 3)
- Trick to start and shut down Windows Server 2012 computer in a blink of an eye
- Instructions for installing Windows Server 2012 step by step
- Learn about Windows Server 2012 (Part 2)
- Learn Windows Server 2012 (The last part)
- Learn about Windows Server 2012 (Part 1)
- Learn about firewalls, Windows Firewall on Windows Server 2012
- 6 ways to access Control Panel on Windows Server 2012
May be interested
- How to install DNS Role in Windows Server 2012

dns role is one of the most important services in the network containing the domain controllers environment.
- How to create Primary Zones in Windows Server 2012
to manage dns, we have to create a primary zone because by default, there is no zone to manage records at all.
- How to add and manage logs in Windows Server 2012
as you know, in dns, you can add records according to your needs and so is windows server 2012.
- Learn about Resilient File System in Windows Server 2012
in windows server 2012, a new file system was introduced, called resilient file system (refs).
- How to install Hyper-V in Windows Server 2012
virtualization is one of the most important technological features. microsoft has invested in developing this feature and called it hyper-v.
- How to create a virtual machine in Windows Server 2012
in this article, we will look at how to create a virtual machine. first, you need to open the hyper-v manager and then follow the steps below.


Performance is a basis for measuring
how fast application and system tasks are completed on a computer, and
reliability is a basis for measuring system operation. How reliable a
system is will be based on whether it regularly operates at the level
at which it was designed to perform. Based on these descriptions, it
should be easy to recognize that performance and reliability monitoring
are crucial aspects in the overall availability and health of a Windows
Server 2012 infrastructure. To ensure maximum uptime, a
well-thought-through process needs to be put in place to monitor,
identify, diagnose, and analyze system performance. This process should
invariably provide a means for quickly comparing system performances at
varying instances in time and detecting and potentially preventing a
catastrophic incident before it causes system downtime.
Performance Monitor, which is an MMC snap-in,
provides a number of tools for administrators that enable them to
conduct real-time system monitoring, examine system resources, collect
performance data, and create performance reports from a single console.
This tool is literally a combination of three legacy Windows Server
monitoring tools: System Monitor, Performance Monitor, and Server
Performance Advisor. However, new features and functionalities have
been introduced to shake things up, including data collector sets,
Resource view, scheduling, diagnostic reporting, and wizards and
templates for creating logs. To launch the Performance Monitor MMC
snap-in tool, select Server Manager or type perfmon.msc at a command prompt.
The Performance Monitor MMC snap-in consists the following elements:
• Overview screen
• Performance Monitor
• Data collector sets
• Report generation
The upcoming sections further explore these major elements of the Performance Monitoring tool.
1. Performance Monitor Overview
The first area of interest in the Performance
Monitor snap-in is the Overview of Performance Monitor screen, also
known as the Performance icon. It is displayed as the home page in the
central details pane when the Performance Monitor tool is invoked.
The Overview of Performance Monitor screen
presents holistic, real-time graphical illustrations of a Windows
Server 2012 system’s CPU usage, disk usage, network usage, and memory
usage, as displayed in Figure 1.
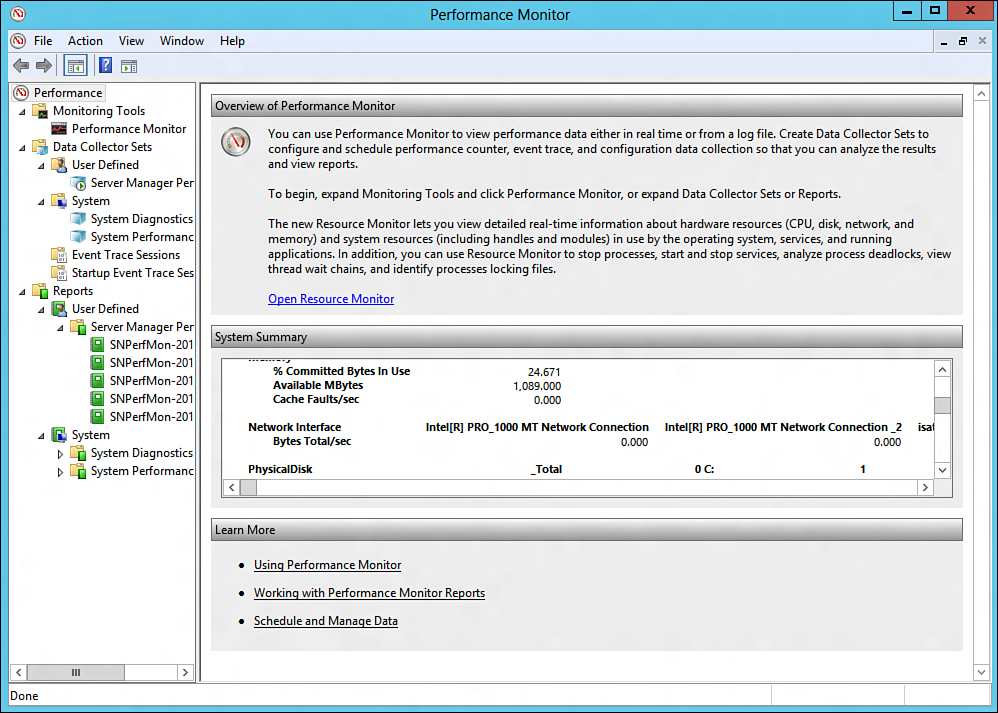
Figure 1. Viewing the Overview of Performance Monitor screen.
Additional process-level details can be
viewed to better understand your system’s current resource usage by
reviewing subsections beneath each metric being displayed. For example,
the Memory section includes % Committed Bytes in Use, Available Mbytes,
and Cache Faults/sec.
The Overview of Performance Monitor
screen is the first level of defense when there is a need to get a
quick overview of a system’s resources. If quick diagnosis of an issue
cannot be achieved, an administrator should leverage the additional
tools within Performance Monitor. These are covered in the upcoming
sections.
Resource Monitor — отличный инструмент для определения того, какая программа / служба использует такие ресурсы, как программа, приложения, сетевое соединение и использование памяти.
Чтобы открыть монитор ресурсов, перейдите в Управление сервером → Инструменты.
Щелкните «Монитор ресурсов», первый раздел — «Обзор». Он сообщает, сколько ЦП потребляет каждое приложение, а в правой части таблицы отслеживает в реальном времени график использования ЦП. Память сообщает, сколько памяти потребляет каждое приложение, и в правой части таблицы он отслеживается в режиме реального времени на диаграмме использования ЦП.
Вкладка «Диск» разбивает его на разные жесткие диски. Это покажет текущий дисковый ввод-вывод и покажет использование диска для каждого процесса. На вкладке сети будут показаны отправленные и полученные процессы и их сетевые байты. Он также покажет текущие TCP-соединения и какие порты в настоящее время прослушивают, а также идентификаторы.
