
В этой статье, друзья, рассмотрим средства потребления системных ресурсов в актуальных операционных системах Windows 10 и 11. Многие из вас знают, что при необходимости отслеживания загруженности определённых компонентов компьютера можно обратиться к системному диспетчеру задач. Но, возможно, немногие из вас обращали внимание на все его примечательные возможности в современных Windows, мы поговорим об этих возможностях. Также мы рассмотрим альтернативы диспетчеру задач по отслеживанию нагрузки на компоненты компьютера – от простых виджетов производительности до масштабных инструментов мониторинга ресурсов. Windows 11 не получила никаких изменений в плане системных средств мониторинга ресурсов, всё как есть унаследовала от Windows 10. Потому то, что мы будем рассматривать – как системные, так и сторонние средства — одинаково касаются что Windows 10, что Windows 11.
{banner_google1}
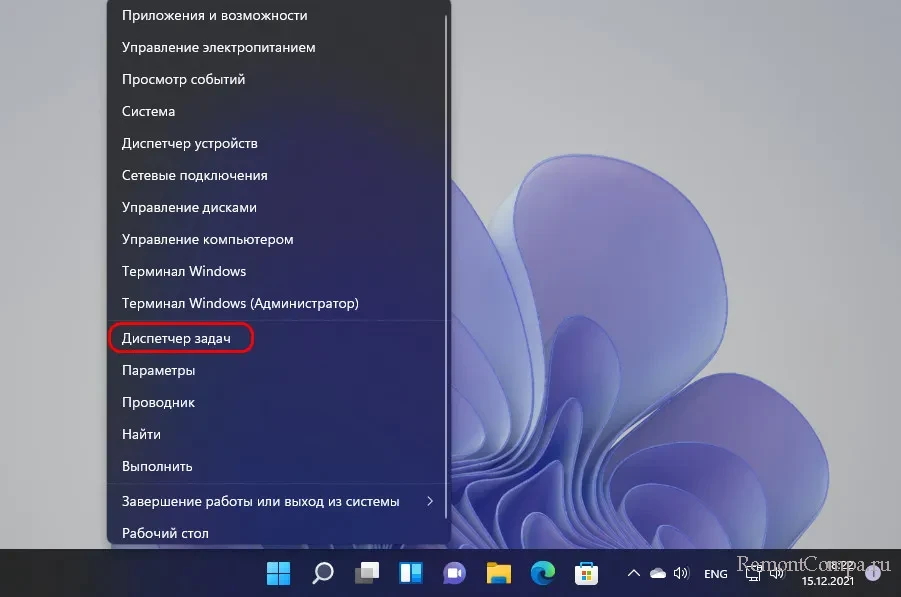
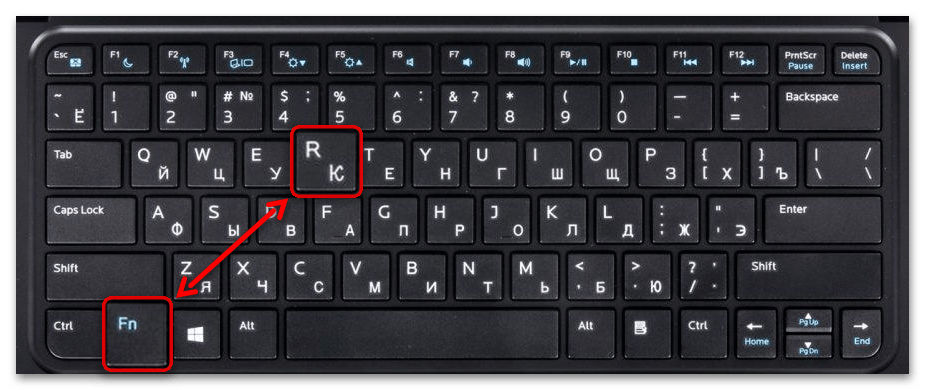
Первое место, куда обычно обращаются при системных тормозах или специально за отслеживаем нагрузки на компоненты компьютера – это системный диспетчер задач. Его можно вызвать клавишами Shift+Ctrl+Esc, либо в меню по клавишам Win+X, это же меню вызывается кликом правой клавиши мыши по кнопке «Пуск» в Windows 10 и 11.
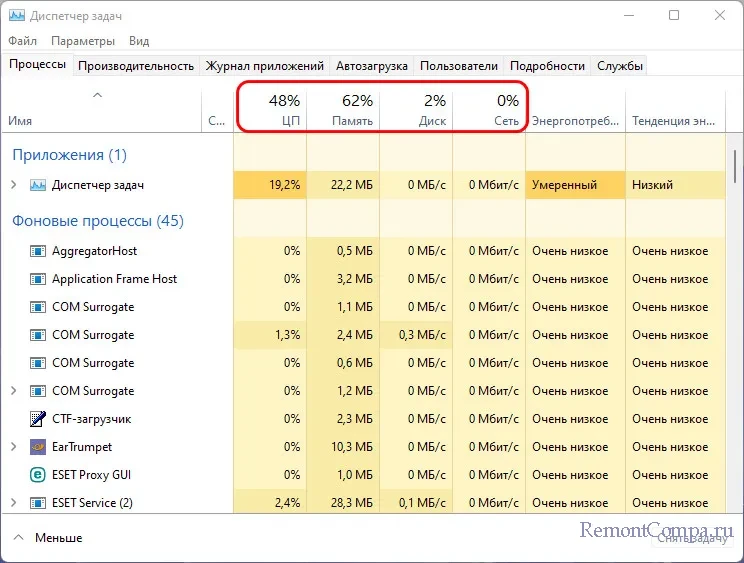
Нагрузка на ресурсы компьютера в процентном выражении отображается прямо в главной вкладке диспетчера задач. Вверху таблицы нам даётся общий процент нагрузки на процессор, оперативную память, жёсткие диски (на суммарно все диски), а также на сеть. В самой таблице можем видеть детализацию, какие системные и сторонние процессы сколько какого ресурса потребляют. Для процессора это будет тот же процент нагрузки, для оперативной памяти – потребляемый объём, для диска – скорость обработки данных, для сети – скорость передачи данных по сети.
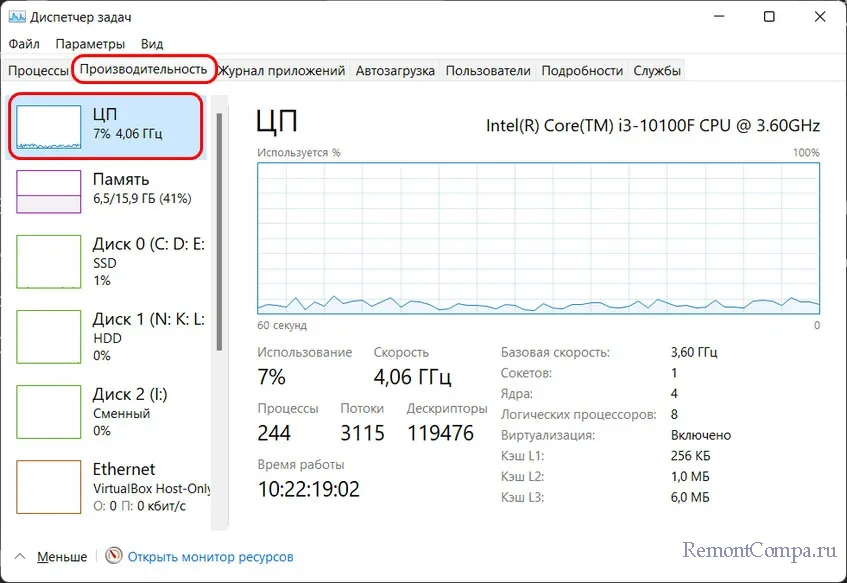
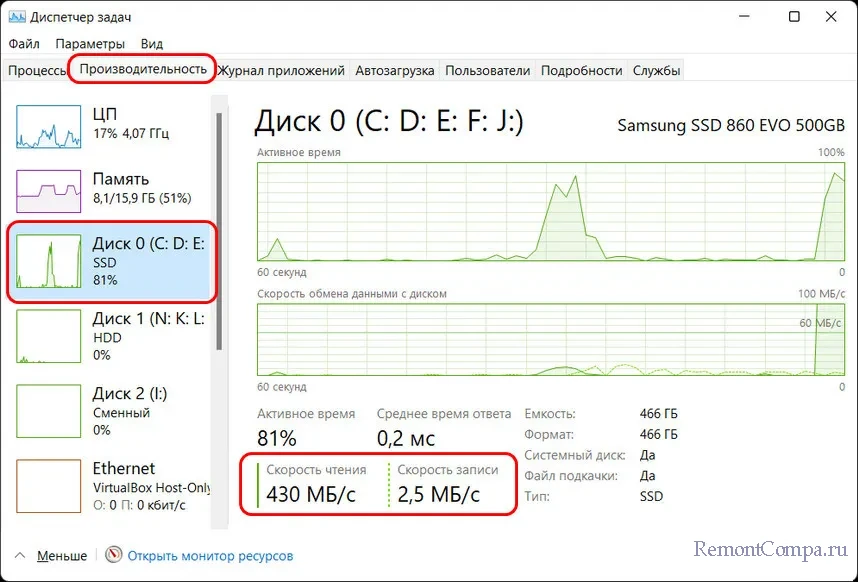
Детализацию по нагрузке на ресурсы компьютера можем посмотреть во вкладке «Производительность». Здесь нам предлагаются графики течения нагрузок. Для процессора можем видеть его характеристики, текущую частоту ядер, число активных процессов и потоков, информацию о включении виртуализации. Полезной может оказаться для многих информация о времени работы компьютера с момента его включения.
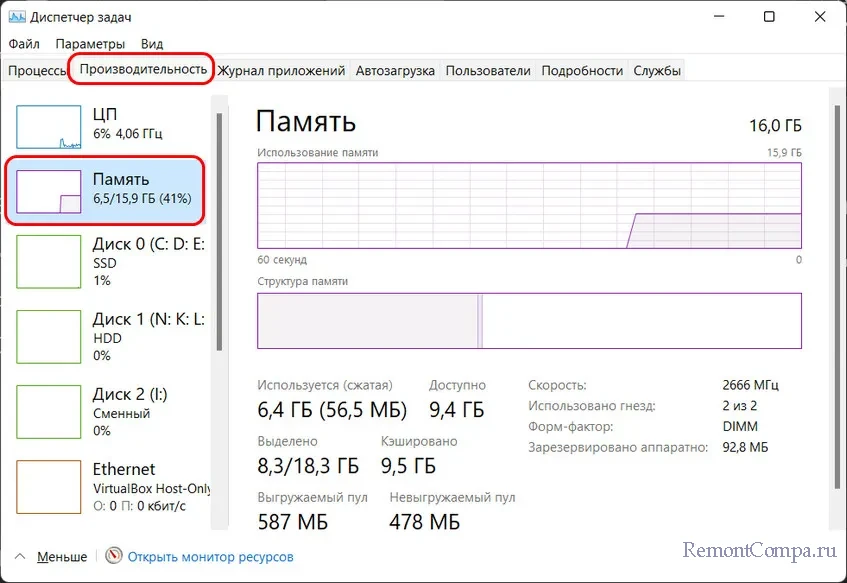
Для оперативной памяти нам показывается общий её объём, эффективная частота, на которой работают планки, используемый и доступный, т.е. свободный объём. Для используемого объёма отображаются разные его категории — кэшированная память, зарезервированная аппаратно, выгружаемый и невыгружаемый пул.
Друзья, диспетчер задач Windows – не лучший диагност для жёстких дисков, но с его помощью, помимо отслеживания нагрузки, можно зафиксировать реальную скорость проведения операций чтения и записи данных. Эта именно та скорость, с которой нам есть в толк при работе с компьютером в противовес синтетическим тестам измерения производительности дисков, где, как правило, только и могут развить максимальные скорости SSD, которые нам обещают их производители. Запустите диспетчер задач на вкладке производительности тестируемого диска и нагрузите последний задачами – чтением данных, копированием, скачиванием, запуском ресурсоёмкой программы. И увидите те скорости, которые ваш SSD может реально развить.
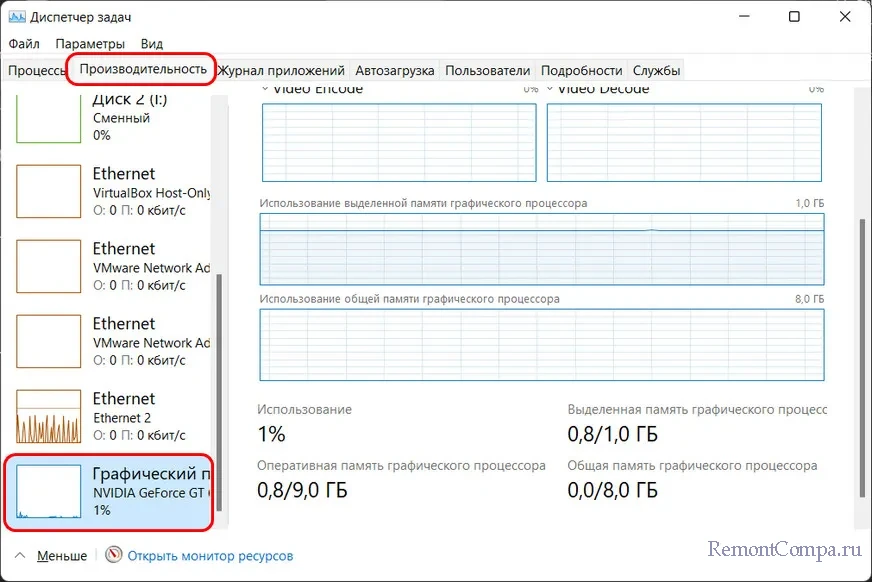
Для видеокарты нам предлагаются графики течения нагрузок, которые задействуют разные её области работы. Помимо этого, предлагаются данные о задействовании памяти видеокарты.
{banner_google1}
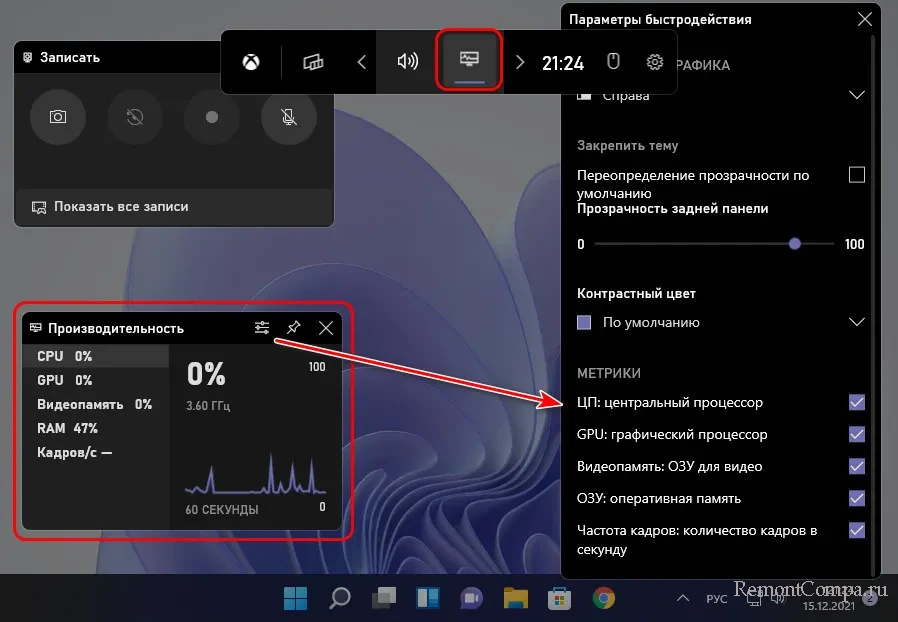
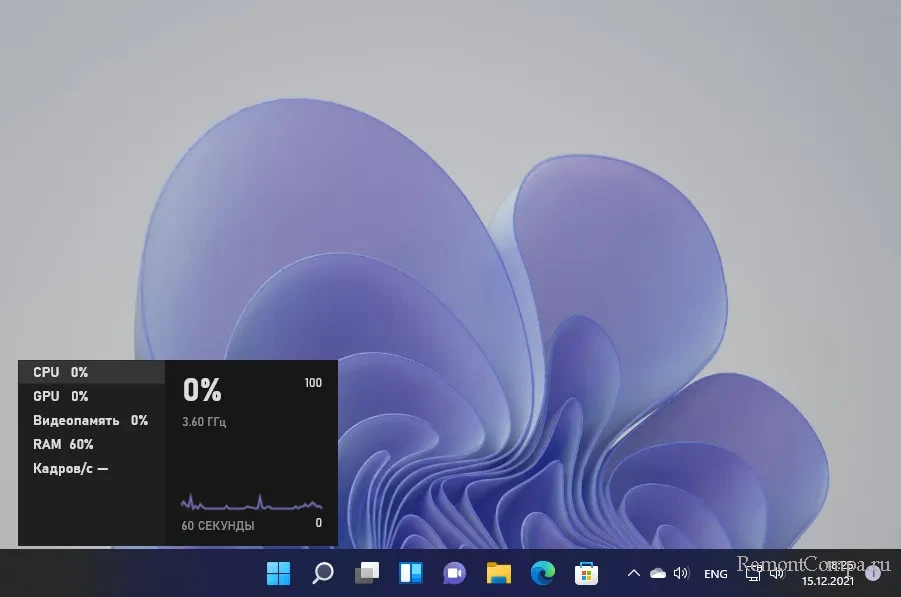
Мониторинг нагрузки на системные ресурсы есть в составе игровой панели (Game Bar) Windows 10 и 11. Эта панель предусматривает небольшой виджет мониторинга производительности в упрощённом формате. Виджет заточен под игровой процесс, чтобы геймеры могли отслеживать, как компьютер справляется с теми или иными игровыми задачами. В нём отображается общая нагрузка на процессор, видеокарту, причём отдельно на графический процессор и отдельно на видеопамять. Отображается нагрузка на оперативную память и FPS (число кадров в секунду). Для запуска игровой панели жмём клавиши Win+G, ищем виджет производительности, если его нет, включаем его на панели-менюшке вверху. Сам виджет можем настроить, задав нужные значения прозрачности, цветовой отделки, отображения системных компонентов, размещения самого виджета на экране.
Игровая панель со всеми активными виджетами появляется при нажатии клавиш Win+G и потом исчезает, как только мы переключимся на другую задачу. Но нужные нам её виджеты, включая виджет производительности, мы можем закрепить для постоянной активности.
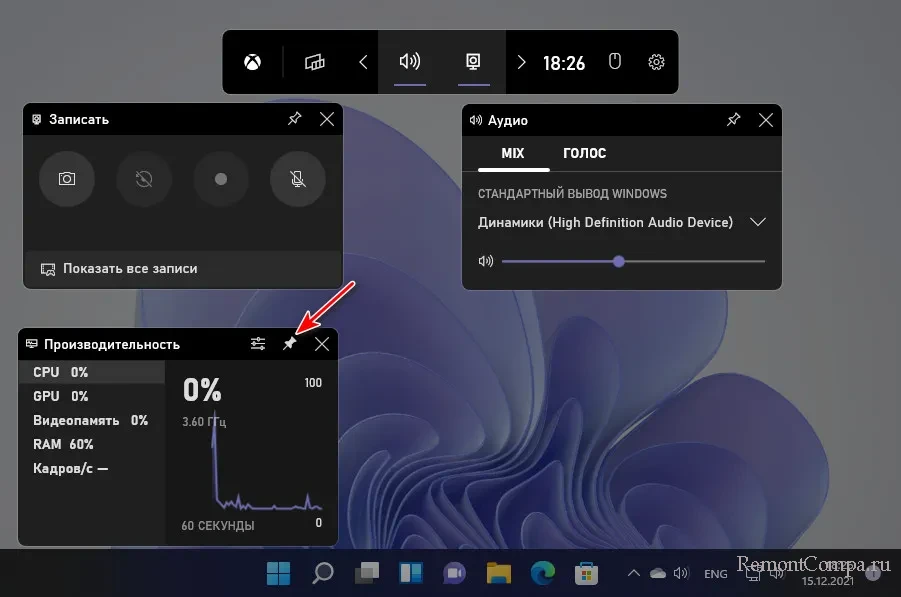
И тогда виджет производительности у нас будет постоянно отображаться на экране поверх других окон.
{banner_google1}
Минималистичный виджет для отслеживания нагрузки на системные ресурсы компьютера можно получить на рабочем столе с помощью бесплатной программы Rainmeter. Она реализует скины рабочего стола Windows с различными виджетами, в числе которых по умолчанию идут дата и время, монитор общей нагрузки на процессор, оперативную память и файл подкачки, отображение дисков компьютера с их загруженностью.
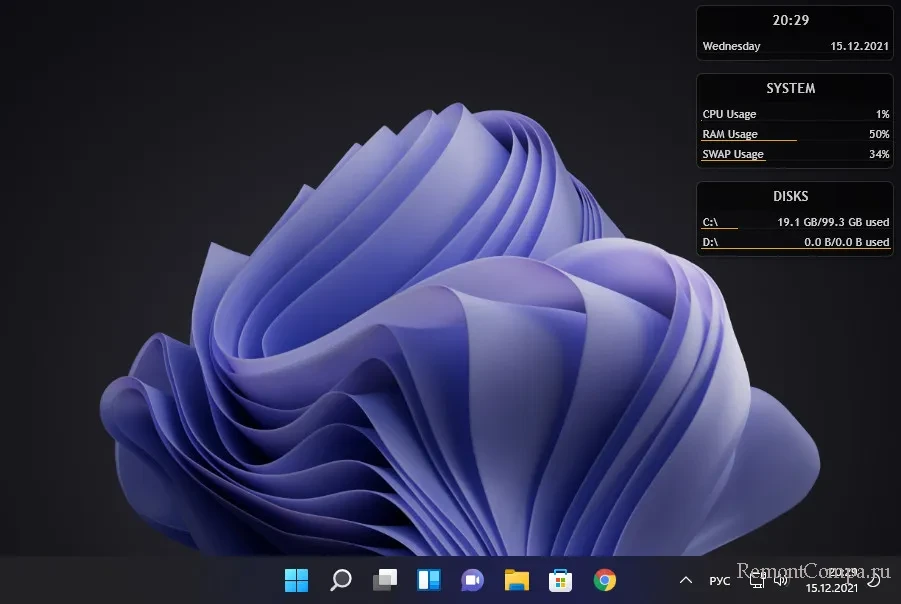
В настройках программы можно добавить другие виджеты – монитор нагрузки на сеть, системную корзина, поиск Google и т.п.
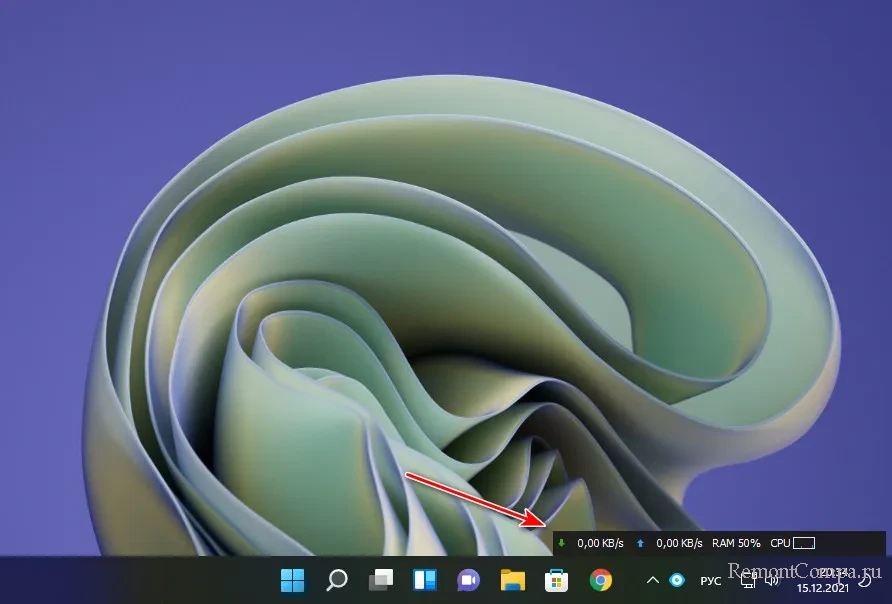
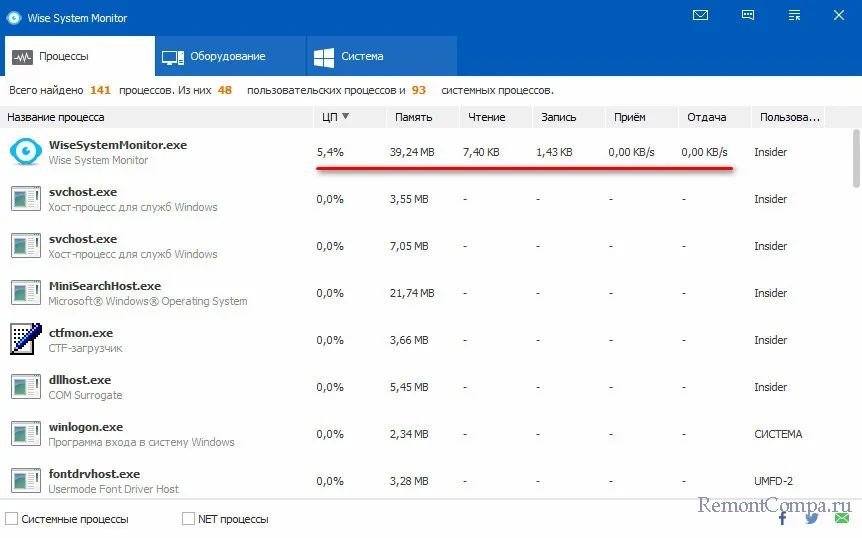
Ещё более минималистичный виджет нагрузки на системные ресурсы предлагает бесплатная программа Wise System Monitor. Она реализует на рабочем столе небольшую полоску с отображением нагрузки на процессор, оперативную память и сеть.
При наведении в виджете на тот или и иной ресурс компьютера увидим детализацию процессов, потребляющих этот ресурс. Для процессора и сети в детализации будут отображаться графики течения нагрузок. Для оперативной памяти – кольцевая диаграмма занятого и свободного объёма.
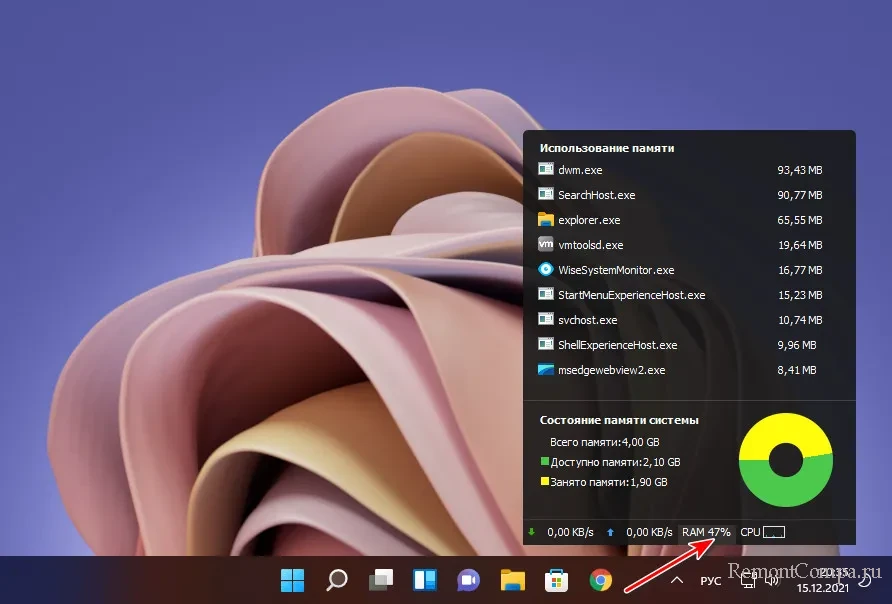
Непосредственно же сама программа Wise System Monitor может предложить нам некоторую информацию об операционной системе, в частности, дату и время установки. А также сведения об аппаратных компонентах нашего компьютера. Ну а основная фишка Wise System Monitor – это реализация альтернативы системному диспетчеру задач Windows. У программы он своего формата. С возможностью отслеживания каждым из процессов нагрузки на процессор, оперативную память, сеть. С возможностью отслеживания скорости чтения и записи данных процессами.
{banner_google1}
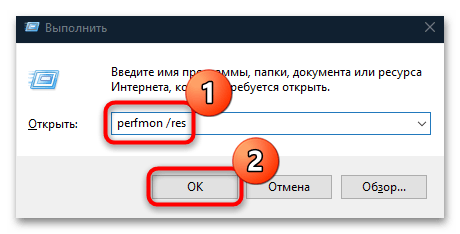
Теперь, друзья, давайте рассмотрим более мощные средства мониторинга ресурсов компьютера. За таким средством далеко ходить не нужно, он есть в Windows 10 и 11 в числе штатного функционала, это системный монитор ресурсов. Запускается по отсылке внизу из раздела «Производительность» диспетчера устройства, либо отдельно, для чего необходимо в командлет «Выполнить» или системный поиск вписать:
Или можно вписать в системный поиск «Монитор ресурсов». Системный монитор ресурсов являет собой расширение данных, отображаемых в системном диспетчере задач. Здесь показывается общая и детализированная нагрузка на ресурсы в процентах и метриках. По каждому активному процессу можем узнать:
- сколько он потребляет потоков и процента загруженности процессора,
- скорость чтения и записи данных процессом, оперируемые им файлы на диске,
- скорость отправленных и полученных данных по сети,
- использованный объём оперативной памяти – текущий, завершённый, общий.
Также нам предлагаются графики течения нагрузок на ресурсы компьютера.
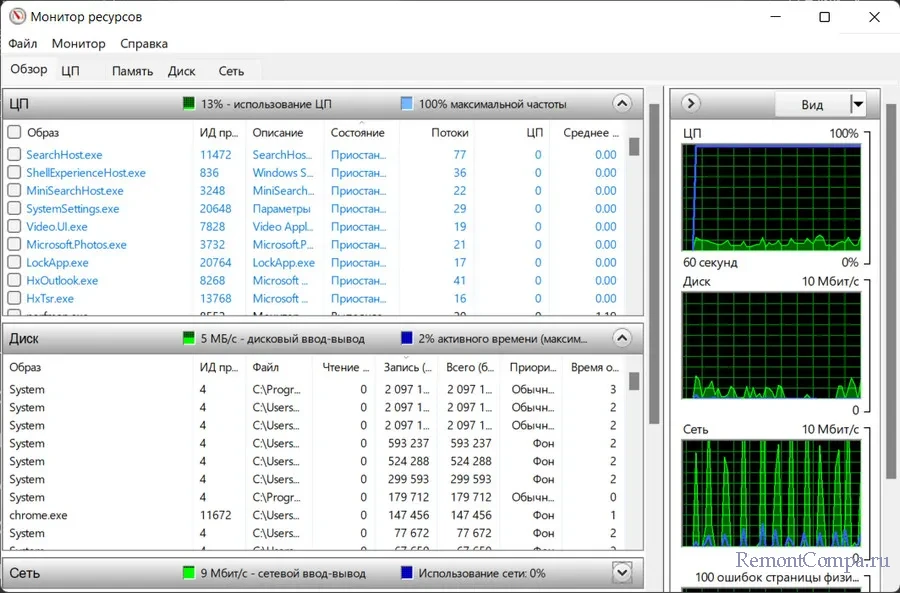
В отдельных вкладках процессора, памяти, диска и сети можем увидеть дополнительную информацию об использовании этих ресурсов.
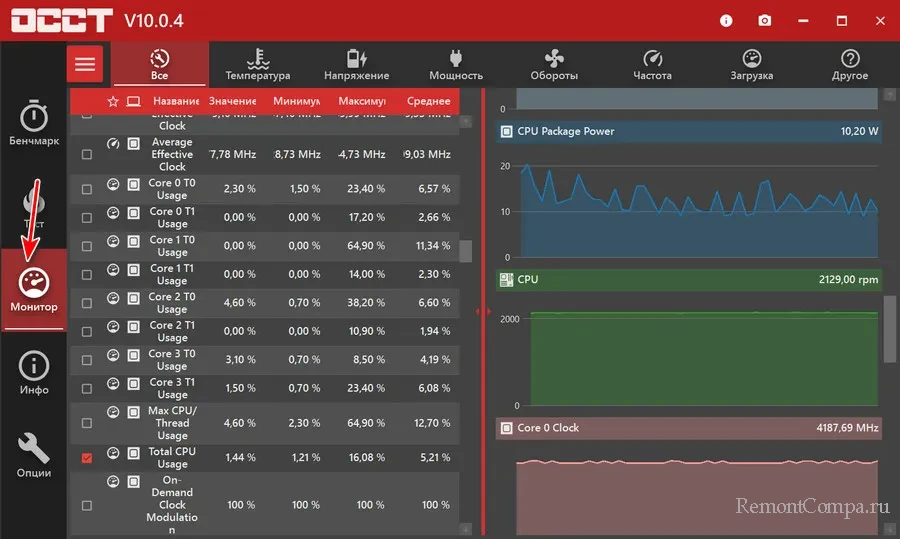
Ну и, друзья, напоследок разрешите вам представить программу, являющую собой мощнейшее средство мониторинга работы аппаратных компонентов компьютера – бесплатную OCCT. Это программа для тестирования компьютерных компонентов, и в ней отслеживанию текущего их состояния посвящён целый раздел. Здесь у нас не будет, как в мониторе ресурсов Windows детализации по системным процессам, OCCT заточена конкретно под аппаратную часть. Нам предлагается распределение нагрузки в процентном выражении на ядра и потоки процессора, на отдельные составляющие видеокарты, на оперативную память. Также можем видеть вольтаж, частоты и прочие метрики отдельных компонентов процессора, материнской платы и видеокарты. Можем видеть скорость работы сетевых устройств, обороты кулера. Есть графики течения нагрузок.
Вот такие, друзья, есть средства мониторинга потребления системных ресурсов для Windows 10 и 11.
System Monitor II
для Windows
System Monitor II — гаджет для боковой панели ОС Windows Vista/7/8/8.1/10, который в реальном времени наглядно отображает загрузку и температуру процессора (для многоядерных ЦП информация предоставляется для каждого ядра в отдельности) и использование оперативной памяти (как физической, так и виртуальной). Также утилита предоставляет быстрый доступ к диспетчеру задач или монитору ресурсов.
Что нового в System Monitor II 31.5?
- Улучшения в работе программы
ТОП-сегодня раздела «Мониторинг»
SpeedFan 4.52
SpeedFan — бесплатный и удобный в использовании инструмент для контроля за температурой и…
MSI Afterburner 4.6.5
MSI Afterburner — настоящая находка для истинного оверклокера, с помощью которой можно…
Speccy 1.33.079
Speccy — небольшая бесплатная программа, позволяющая узнать массу полезной информации об…
HWMonitor 1.57
HWMonitor — бесплатная утилита для мониторинга параметров работы различных компонентов ПК,…
Quick CPU 4.10.0
Бесплатная, но очень мощная программа, разработанная для настройки и мониторинга…
Отзывы о программе System Monitor II
1 про System Monitor II 27.0 [05-08-2019]
не удаляются dll файлы в папке C:\Users\****\AppData\Local\Microsoft\Windows Sidebar\Gadgets\SystemMonitorII.gadget возможно заразно, плока не разобрался как удалить
7 | 12 | Ответить
DOG666 про System Monitor II 20.8 [26-01-2015]
Гаджет очень помогает,жаль только что здесь на сайте обновления появляются с запоздание,
а на оф. сайте очень сложно скачать без вирусов
20 | 17 | Ответить
- Home
- Blog
-
13 Best Tools to Monitor Your System’s Resources
/
/

In Windows 10 and Windows 11, keeping track of your system resources is quite simple. However, some users choose to use third-party applications for this function because they provide a more user-friendly interface. These utilities can provide thorough reports for CPU usage, temperature, RAM consumption, or hard disc memory if you demand complete data for your system performance and operations. This type of data is critical for your computer’s health, as it tells you everything you need to know about the hardware or software’s quality and usability. If you’re searching for a dedicated tool to monitor your system’s resources, we’ve compiled a handy list of options for you to consider.
Disclaimer: The list presented here is not based on any rank criteria. Listed as First could not be the best or listed as Last in the list is not the worst by any means. This is not a complete product review. Please don’t go with the order of the tools. We clarify that the order doesn’t carry any rank. We are not here to judge the rank of the tools. We created this post to share the best options available in the market. Let’s get started.
-Author
Why You Should Monitor Your System’s Resources?
As a system administrator, it is essential to be aware of the health of your servers and desktops. By monitoring your system’s resources, you can be proactive in addressing any potential issues that may arise. Additionally, by tracking resource utilization over time, you can identify trends that may help you optimize your system’s performance.
There are a number of different factors that you should monitor, including CPU usage, memory usage, disk space, and network traffic. By monitoring these resources, you can ensure that your system is running smoothly and address any potential issues before they become problems.
Additionally, by monitoring your system’s resources, you can identify trends that may help you optimize your system’s performance. For example, if you notice that your CPU usage is consistently high during certain times of the day, you may want to investigate ways to improve your system’s utilization during those times.
Monitoring your system’s resources can be done manually or through the use of monitoring tools. If you choose to monitor your system manually, it is essential to be familiar with the various tools to monitor your system’s resources that are available. Additionally, you should have a good understanding of your system’s architecture so that you can effectively interpret the data that you collect.
If you choose to use monitoring tools, there are a number of different options available. Some of these tools are designed specifically for monitoring system resources, while others are more general purpose. In addition, some monitoring tools are free, while others must be purchased.
Whichever method you choose to monitor your system’s resources, it is essential to have a plan in place so that you can effectively address any issues that arise. Additionally, by tracking resource utilization over time, you can identify trends that may help you optimize your system’s performance.
Paessler PRTG
Let’s start this post with Paessler PRTG, one of the best tools to monitor your system’s resources. Paessler PRTG is a comprehensive monitoring solution for your computer, applications, network, and other devices. In a nutshell, it has your IT infrastructure at your fingertips. Anyone who owns a computer should be aware that monitoring system resources is a must-do chore. As a result, employing this third-party program to keep track of your hardware components can provide you with extensive information about CPU usage and other tasks.
PRTG technology can be used to monitor hardware data such as CPU or RAM capacities, hard disc storage, network printers, routers, and so on from the same page. Paessler also offers built-in alerting technologies, a cluster failover solution for safety, real-time maps or dashboards, distributed network monitoring, and a multi-user interface for tracking activities. To give you a clearer picture, the software monitors the performance of your PC components using various sensors that reveal how fast the processor runs. An SNPM CPU load, for example, is a sensor that monitors your network channels and displays valuable data. By keeping an eye on system resources, you may contribute to greater device operation while also keeping track of traffic-related data at a glance.
Solarwind Network Performance Monitor
This multi-solution firm may provide multi-vendor network monitoring on your own PC, displaying network connection statistics in a single glance. You may see precise information for network performance components like hardware internet difficulties or cloud server monitoring using this thorough program. It’s simple to handle your IT infrastructure with a complete view of physical network performance or cloud server data, depending on your monitoring needs.
Furthermore, you have complete control over network processes and can document anything related to connectivity using key metrics and drill-down analysis.
From the comfort of your own home, you can monitor and analyze Cisco device networks. More precisely, you may see availability and performance graphs in one place. It doesn’t get any easier than automatically locating and identifying the network if you need to detect Cisco routers or other devices.
You can also conduct packet inspections to see network slowing problems and their causes for further information. By monitoring over 1.200 applications for reaction time or classifying network traffic, you can find the best solutions to your problems. Finally, you’ll be able to effectively monitor network performance by receiving quick notifications when issues arise, as well as essential network hardware health data.
Wise System Monitor
Another good tool to monitor your system’s resources is Wise System Monitor. The main tool lets you see all of your running processes as well as how much of your computer’s resources they consume.
A Hardware monitor is also provided, which allows you to view all hardware-related data. You may examine specific details on your motherboard, CPU, graphics card, memory, and other components. You can also examine essential information about your operating system if you like.
Wise System Monitor is a good tool for keeping track of your computer’s resources. The tool makes all information readily available, making it ideal for novice users. Wise System Monitor also allows you to view your system information, which some users may find beneficial. The lack of personalization may be the sole issue in this free and easy program. Check out Wise System Monitor if you’re seeking a simple program to monitor system resources.
Rainmeter
Rainmeter is one such free, open-source tool to monitor the system’s resources. Rainmeter is an application that allows you to keep track of your system’s resources. Small gadgets will appear on your desktop, allowing you to monitor your CPU and RAM utilization conveniently. You may also keep track of your hard disc space as well as your upload and download speeds. You can quickly choose which gadgets to display and move them around on your screen. Although Rainmeter is simple to use, it has a lot of customizing options. This tool can be customized to add new skins and features to the program. If you’re not a developer, there’s a vibrant community generating new skins and features all the time.
Rainmeter is available in a portable form, so you don’t have to install it on your computer. The tool has all of the essential capabilities, but if you want to get the most out of Rainmeter, we strongly advise you to experiment with other skin. Although this is an excellent tool to monitor your system’s resources, advanced users may be turned off by the vast customization.
System Examiner
System Examiner
System Examiner is a free, easy-to-use application that creates a report of your computer’s system information on Windows devices. It displays the details of the hardware and software installed on your computer and also identifies any common errors or potential issues within the system.
After installation, the tool will generate an extensive yet easy-to-use system information report which you can also share. Simply click the Share Report button in the app, and it will upload your report to its website and generate a link you can share.
The report consists of detailed information about your Windows computer, such as:
– Summary of your computer’s hardware information and operating system configuration.– Installed Windows hotfixes and when Windows Update was last used.– Automatically starting programs.– Installed software from the system, including detailed information on all files and registry keys relating to each software.– Installed third-party and system device drivers and system services.
In addition, System Examiner performs testing of the core hardware components, such as the CPU, RAM, and the system hard drive to detect any critical hardware problems. The tool also supports automation via command line parameters and also supports Dark Mode.
AIDA64 Extreme
AIDA64 Extreme is a robust system diagnostic and benchmark application with features such as CPU, RAM, GPU, and system functionality monitoring.
-
It can also provide benchmarks and a thorough analysis of your system’s resources.
-
It has a user interface that is comparable to Microsoft Console Management. A vast range of activity indicators is available for review.
-
You may also use this software to stress test all of your components in a wide range of combinations.
-
You will also have AIDA’s team’s full support at your disposal. Take a look at it and give it a shot.
TinyResMeter
TinyResMeter is another easy-to-use tool for monitoring system resources. Because this is a compact and lightweight program, it can operate on practically any computer. Although the application’s user interface isn’t stunning, it will provide you with all of the information you require. A horizontal or vertical menu can be used to display system information. You can change the font and colors if you wish, but you can’t change the available fields. You can also mark the fields with your own labels. You can see RAM, CPU Speed, CPU use, network speed, and other information in the available areas.
TinyResMeter has an out-of-date UI, but it is still functional. You can view comprehensive information about each field by right-clicking it. You may see the entire amount of space, label, system type, and any other relevant information by right-clicking your hard drive, for example. In terms of defects, the program can be sluggish at times, and we detected one visual bug. When you move your mouse over the TinyResMeter, it will turn black for a split second before returning to normal. This is a minor annoyance, although it can be annoying at times.
TinyResMeter is a lightweight application that allows you to keep track of system resources. Despite its simplicity, the program feels a little out of date and contains a few minor issues.
FreeMeter
FreeMeter is a helpful tool to monitor your system’s resources that is both dependable and simple to use. The application offers a straightforward user interface and displays all relevant data in the form of graphs. The tool provides detailed performance data that will assist you in resolving any issues and ensuring that you have the best possible experience. FreeMmeter provides easy-to-understand reports and real-time updates on your system’s uptime and hard disc space. In addition, it keeps track of CPU utilization. The professional version can distinguish between kernel and user CPU utilization. The software can check both wireless and Ethernet speeds when it comes to Internet connections. It can also assist in troubleshooting and resolving latency problems. FreeMeter keeps track of network ping and assists with sluggish connections. FreeMeter comes in two flavors: a free edition and a premium version with more functionality. Give it a shot to see if it suits your requirements.
Process Explorer
Process Explorer is a Task Manager alternative that displays a list of all your running processes. You may simply end or adjust the priority of a process with this tool.
Process Explorer can also be used to keep track of system resources. In Process Explorer, there are four graphs, each of which represents a single resource. You may view the overview or examine the CPU, RAM, I/0, and GPU consumption individually on Process Explorer.
This program also includes a little graph that will appear in your Taskbar, allowing you to keep track of your system’s resources at all times. Process Explorer is not only a great Task Manager replacement, but it can also be used to keep track of system resources. This program is both free and portable, so don’t miss out on giving it a try.
Moo0 System Monitor
Moo0 System Monitor is a free and portable system resource monitoring utility. This tool is made up of multiple graphs that display all of the relevant system data. This program displays CPU and GPU use and temperatures, as well as the amount of free memory, HDD temperature, and network speed. You can also add other fields to show more information if you wish. The tool allows for some customization, such as changing the tool’s size or transparency. You may also set this tool to auto-hide after a specified amount of inactivity. Many different color schemes are supported by the tool, and you can even set the color scheme to change automatically.
Moo0 System Monitor is a fantastic tool that is both simple and portable. Making it ideal for both novice and advanced users. Depending on the number of fields you have, this tool can take up a lot of screen real estate, so keep that in mind. Overall. Moo0 System Monitor is an excellent tool that you should investigate further.
CPUID HWMonitor
If you want to see detailed information about your system, HWMonitor is the tool to use. This system monitor program is entirely free, and it allows you to keep track of your gear and examine all pertinent data. The application includes a hardware tree that you may expand to obtain all of the information you need. You can see vital statistics like temperature, fan speed, and utilization with this tool.
Although you can view information on your motherboard, CPU, graphics card, and hard disc, you don’t appear to be able to see any information about your RAM or network connection.
HWMonitor, unlike the other tools on our list, does not provide a real-time graph, and you must keep the HWMonitor window active to check your system resources. This program provides a wealth of information on your hardware and can be really helpful if you want to learn more about your components when it comes to resource monitoring. the tool provides practically all relevant information, although some users may have difficulty discovering what they’re looking for.
HWMonitor is a good program; it’s free and portable, but it doesn’t offer any information about your network connection or RAM, which is, in our opinion, its major weakness.
TaskbarMeters
Taskbar Meters is a collection of programs that lets you keep track of your computer’s resources. There are three different applications to choose from, and they all work in the same way. Each application will appear in your Taskbar and show you how much of your resources are being used. Every application is designed to change the color of its icon in the Taskbar, so you’ll be able to tell if you’re using too many resources.
You can monitor your CPU, RAM, and disc utilization using these tools, which is more than adequate for most people. You can change the colors or the frequency of each tool if you wish. We should point you that these apps employ a simple way to display your system’s resource utilization. Unfortunately. you won’t be able to see the actual figures if you use this method, which may be a drawback for specific users.
These tools’ only shortcoming is their inability to display extensive information about CPU, RAM, or disc usage, which may deter some users.
We hope this post would help you know the step-by-step procedure to install WSL2 on Windows and run Ubuntu on Windows using WSL2. Please share this post if you find this interested. Visit our social media page on Facebook, LinkedIn, Twitter, Telegram, Tumblr, Medium & Instagram, and subscribe to receive updates like this.
You may also like these articles:
Arun KL
Arun KL is a cybersecurity professional with 15+ years of experience in IT infrastructure, cloud security, vulnerability management, Penetration Testing, security operations, and incident response. He is adept at designing and implementing robust security solutions to safeguard systems and data. Arun holds multiple industry certifications including CCNA, CCNA Security, RHCE, CEH, and AWS Security.
-
Home
-
News
- Top 6 Resource Monitor Software for Windows 10/11 or Mac
By Alisa |
Last Updated
This post introduces some top resource monitor software for Windows 10/11 or Mac to help you monitor and measure the real-time usage of your computer resources like CPU, disk, memory, network, etc. For more computer tips and tricks, you may visit MiniTool Software official website.
You can use a professional resource monitor software to monitor the resource usage of your computer hardware and software components. Check the top 6 free resource monitor apps for Windows 10/11 or Mac below.
Top 6 Resource Monitor Software for Windows 10/11
1. Resource Monitor
Windows has a built-in Resource Monitor that displays information about the use of computer hardware and software resources in real-time. You can see the information of CPU, memory, disk, and network.
To open the Resource Monitor on Windows 10/11, you can press Windows + R, type resmon.exe in the Run dialog, and press Enter to quickly open the Resource Monitor app on Windows 10/11.
Alternatively, you can also click Start, type resource monitor in the Search box, and choose Resource Monitor to open it.
2. Performance Monitor
Windows also has another resource monitor software named Performance Monitor that helps you detect your computer’s performance. Also called System Monitor, it is a system monitoring program that can monitor various activities on a computer like CPU and memory usage. It helps measure the performance of hardware and software services and applications. You may use it to determine the cause of problems of a computer.
3. Paessler PRTG
If you are looking for a third-party application to help track your computer component’s performance, you can try this program. Paessler PRTG is a professional network monitoring tool. You can use it to monitor and classify system conditions like bandwidth usage or uptime, and collect statistics from various hosts like switches, routers, servers, and other services and applications.
4. AIDA64 Extreme
This is a professional system information diagnostic tool that can diagnose and display detailed information about the hardware and installed software on your PC. It helps you diagnose hardware issues and offers benchmarks to measure the performance of your computer. It also supports overclocking. It is compatible with all Windows editions including Windows 11 and Windows Server 2022.
5. Wise System Monitor
To monitor the performance of various hardware components of your computer, you can also try this free resource monitor for Windows 11/10. It helps monitor processes, hardware, network traffic, memory, and many other things. It is a simple and comprehensive PC monitoring tool that lets you know what is consuming your RAM and CPU, which part of your PC is overheated, etc. It helps you keep an eye on all the running processes in your system. It displays detailed information of the main hardware components like CPU, motherboard, RAM, graphics card, hard disk, network card, sound card, etc.
6. Network Performance Monitor
This is also a professional network monitoring tool that features multi-vendor network monitoring, network insights for deeper visibility, intelligent maps, NetPath and PerfStack for easy troubleshooting, etc. It offers a free trial version.
Best Free Resource Monitor for Mac
For Mac users, you can use the built-in free Activity Monitor to monitor your CPU, network, disk usage, and other components’ performance. You can also use it to troubleshoot problems on a Mac computer.
To open Activity Monitor on Mac, you can go to Applications -> Utilities, and double-click Activity Monitor to open the app.
Bottom Line
This post introduces some top resource monitor software for Windows 10/11 or Mac to help you keep an eye on the performance and resource usage of various computer components. Hope it helps.
If you have other computer problems, you can visit MiniTool News Center. MiniTool Software also provides some tools like MiniTool Partition Wizard, MiniTool Power Data Recovery, MiniTool ShadowMaker, MiniTool MovieMaker, MiniTool Video Converter, and more.
About The Author
Position: Columnist
Alisa is a professional English editor with 4-year experience. She loves writing and focuses on sharing detailed solutions and thoughts for computer problems, data recovery & backup, digital gadgets, tech news, etc. Through her articles, users can always easily get related problems solved and find what they want. In spare time, she likes basketball, badminton, tennis, cycling, running, and singing. She is very funny and energetic in life, and always brings friends lots of laughs.
Все способы:
- Способ 1: Меню «Пуск»
- Способ 2: Диалоговое окно «Выполнить»
- Способ 3: «Диспетчер задач»
- Способ 4: «Проводник»
- Способ 5: «Панель управления»
- Способ 6: «Командная строка»
- Вопросы и ответы: 0
Способ 1: Меню «Пуск»
Самый простой способ открыть «Монитор ресурсов» в Windows 10 – это использовать поиск в «Пуске». Достаточно вызвать это меню, затем начать вводить запрос «Монитор ресурсов». В процессе набора отобразится совпадение, которое и выберите.
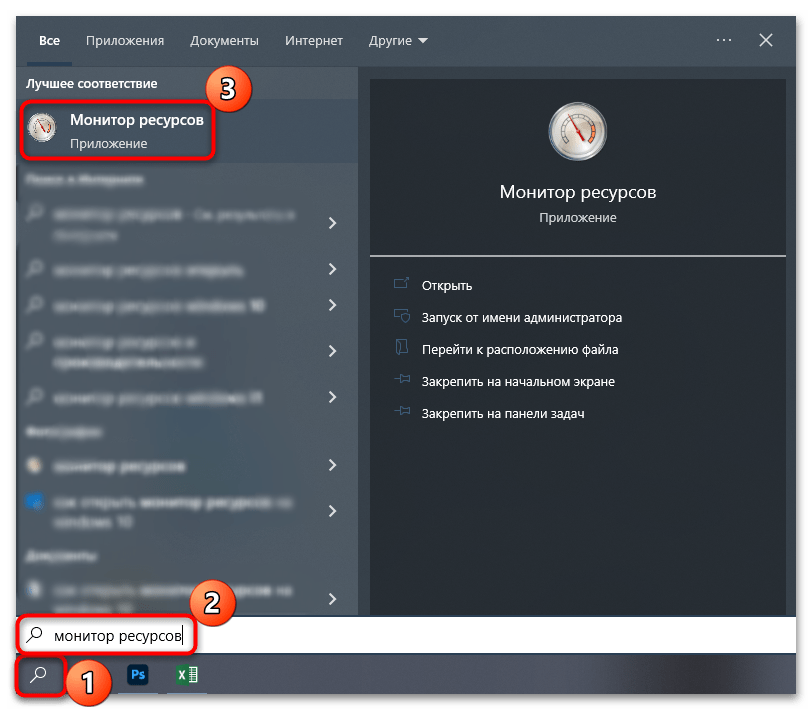
Когда надо запустить средство с расширенными правами, в окне справа выберите пункт «Запуск от имени администратора».
Все средства администрирования располагаются в соответствующем разделе главного меню. Найти «Монитор ресурсов» там не слишком сложно — достаточно нажать на кнопку «Пуск» на нижней рабочей панели, отобразить «Все приложения», затем отыскать папку «Средства администрирования Windows» и развернуть ее. Появится список инструментов, где есть и искомый.
Способ 2: Диалоговое окно «Выполнить»
Открытие «Монитора ресурсов» доступно и через диалоговое окно «Выполнить». Для этого нужно знать специальную команду, которая запускает окно встроенного средства.
- Одновременно зажмите клавиши «Win + R».
- Появится окно «Выполнить» — в строку «Открыть» вставьте команду
perfmon /resи нажмите на клавишу «Enter».
Также можно использовать и команду resmon.exe, аналогичным образом прописав ее в строке окна «Выполнить». Эту же команду можно написать и в «Пуске», вместо названия приложения.
Способ 3: «Диспетчер задач»
Перейти в «Монитор ресурсов» в Windows 10 можно напрямую из интерфейса «Диспетчера задач», представляющего собой информационную утилиту, которая визуализирует сведения о работающих службах и процессах, а также потреблении ресурсов, производительности и другой информации.
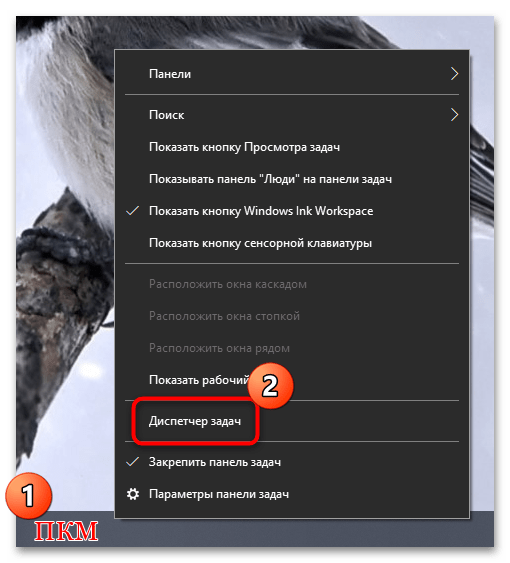
- Кликните по рабочей панели правой кнопкой мыши и из меню выберите пункт «Диспетчер задач».
- Перейдите на вкладку «Производительность» и кликните по ссылке «Открыть монитор ресурсов», расположенной внизу.
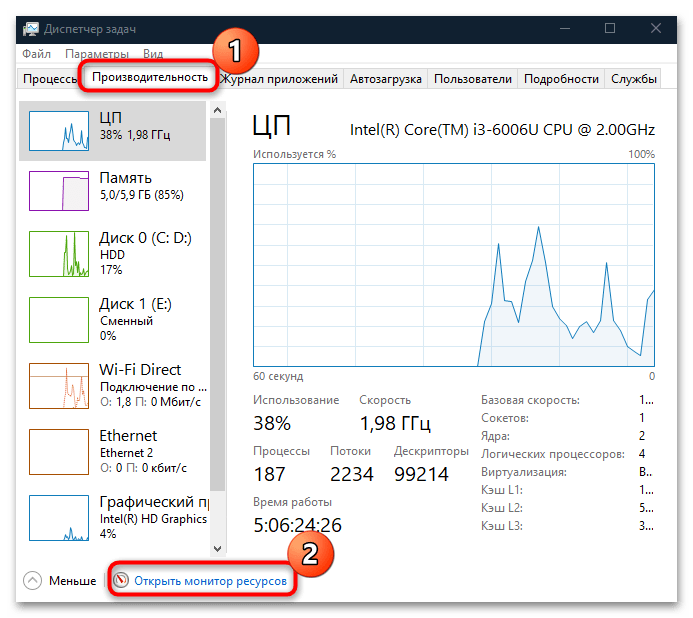
Если «Диспетчер задач» изначально открылся в свернутом виде, нажмите на кнопку «Подробнее», чтобы отобразились все вкладки утилиты.
Читайте также: Методы запуска «Диспетчера задач» в Windows 10
Способ 4: «Проводник»
Исполняемые файлы сторонних и встроенных средств Windows 10, а также некоторых их ярлыков располагаются в папках на локальных дисках. Системные средства – в разделе, на котором установлена система, чаще всего это «Локальный диск (C:)». Средства администрирования, в том числе «Монитор ресурсов» — не исключение.
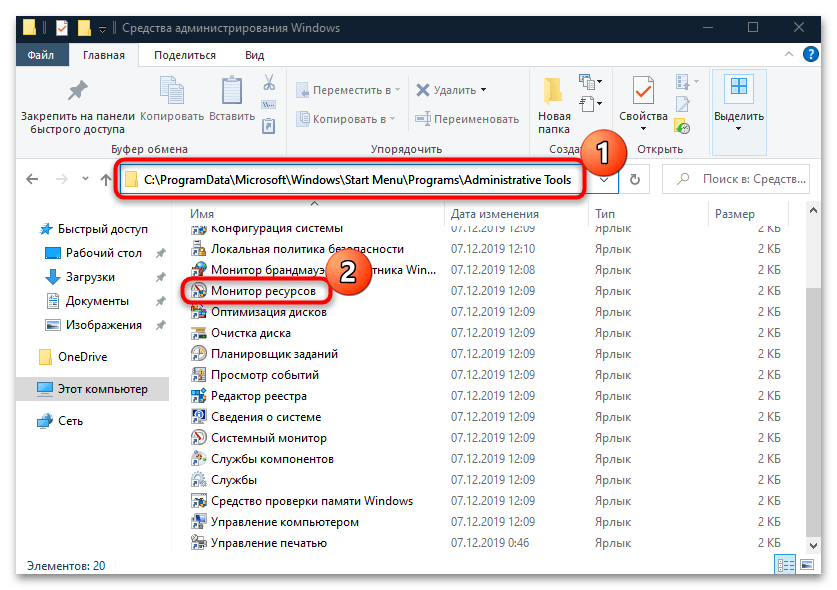
Запустите «Проводник», вставьте в адресную строку путь C:\ProgramData\Microsoft\Windows\Start Menu\Programs\Administrative Tools и нажмите клавишу «Enter». Отобразится список ярлыков средств администрирования, где отыщите «Монитор ресурсов» и запустите его двойным нажатием левой кнопкой мыши.
Способ 5: «Панель управления»
Следующий способ открыть «Монитор ресурсов» на Windows 10 – это «Панель управления», в которой собраны средства настройки операционной системы. Через ее интерфейс можно совершить быстрый переход в папку, которая была рассмотрена в предыдущем способе.
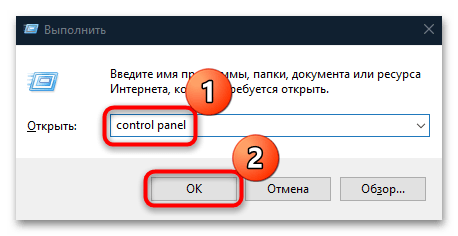
- Вызовите диалоговое окно «Выполнить» с помощью сочетания клавиш «Win + R». В строке напишите
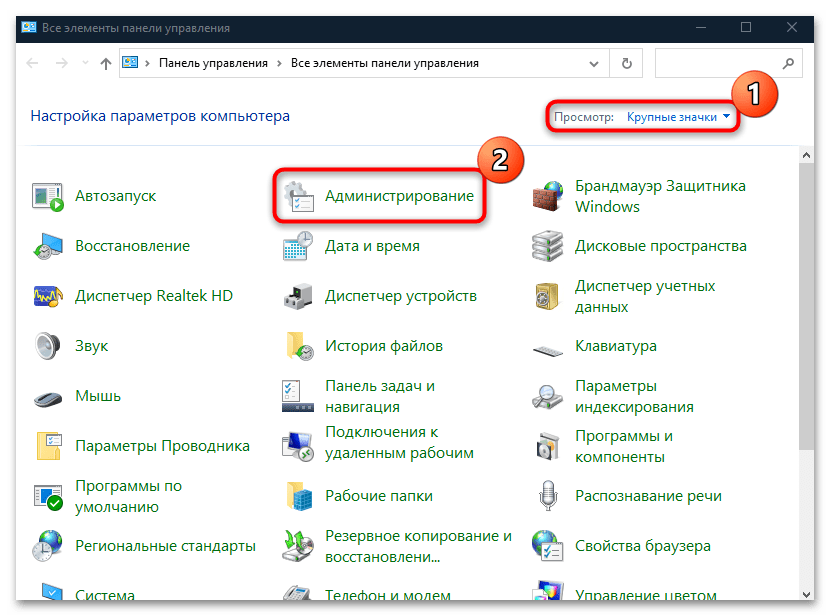
control panelи кликните по «ОК». - Вверху разверните меню «Просмотр», чтобы выбрать формат отображения и задайте крупные или мелкие значки. В появившемся перечне щелкните по разделу «Администрирование».
После выбора раздела откроется окно «Проводника» с инструментами Windows 10. Найдите «Монитор ресурсов» и запустите его.
Читайте также: Открытие «Панели управления» на компьютере с Windows 10
Способ 6: «Командная строка»
Если ни один способ не подошел (например, в работе «Проводника» или рабочей панели произошли системные ошибки), можете воспользоваться функциями консоли «Командная строка», через которую доступен запуск приложений и различных штатных средств. Чтобы открыть «Монитор ресурсов» таким образом, нужно знать только команду:
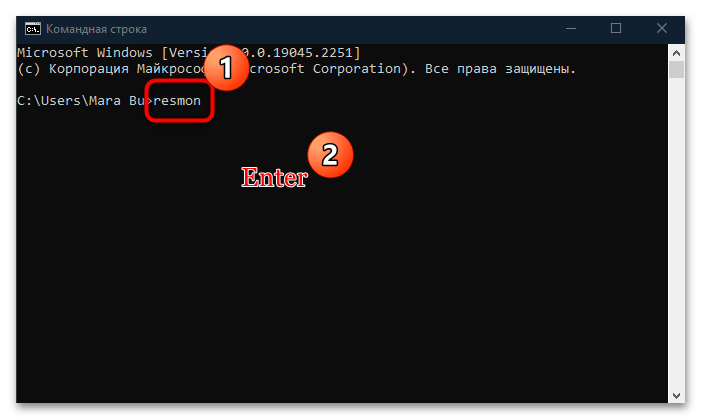
- Откройте «Командную строку», отыскав ее в «Пуске» по названию.
- В строку введите
resmonи нажмите на клавишу «Enter» для подтверждения.

Если вы запускаете консоль от имени администратора, то и все средства, открытые через нее, будут с расширенными правами.
После этого отобразится окно «Монитор ресурсов». В Windows 10 вместо «Командной строки» также можно использовать и аналогичную консоль – Windows PowerShell, где принцип запуска утилиты такой же.
Читайте также: Открытие «Командной строки» в Windows 10
Наша группа в TelegramПолезные советы и помощь