
Дамп памяти (снимок состояния оперативной, содержащий отладочную информацию) — то, что часто оказывается наиболее полезными при возникновении синего экрана смерти (BSoD) для диагностики причин возникновения ошибок и их исправления. Дамп памяти сохраняется в файл C:\Windows\MEMORY.DMP, а мини дампы (малый дамп памяти) — в папку C:\Windows\Minidump (подробнее об этом далее в статье).
Автоматическое создание и сохранение дампов памяти не всегда включено в Windows 10, и в инструкциях на тему исправления тех или иных ошибок BSoD мне время от времени приходится описывать и путь включения автоматического сохранения дампов памяти в системе для последующего просмотра в BlueScreenView и аналогах — потому и было решено написать отдельное руководство именно о том, как включить автоматическое создание дампа памяти при ошибках системы, чтобы в дальнейшем ссылаться на него.
Настройка создания дампов памяти при ошибках Windows 10
Для того, чтобы включить автоматическое сохранение файла дампа памяти системных ошибок достаточно выполнить следующие простые шаги.
- Зайдите в панель управления (для этого в Windows 10 вы можете начать набирать «Панель управления» в поиске на панели задач), если в панели управления в поле «Просмотр» включено «Категории», установите «Значки» и откройте пункт «Система».

- В меню слева выберите пункт «Дополнительные параметры системы».

- На вкладке «Дополнительно» в разделе «Загрузка и восстановление» нажмите кнопку «Параметры».

- Параметры создания и сохранения дампов памяти находятся в разделе «Отказ системы». По умолчанию включены опции записи в системный журнал, автоматической перезагрузки и замены существующего дампа памяти, создается «Автоматический дамп памяти», хранящийся в %SystemRoot%\MEMORY.DMP (т.е. файл MEMORY.DMP внутри системной папки Windows). Параметры для включения автоматического создания дампов памяти, используемые по умолчанию вы также можете увидеть на скриншоте ниже.


Опция «Автоматический дамп памяти» сохраняет снимок памяти ядра Windows 10 с необходимой отладочной информацией, а также память, выделенную для устройств, драйверов и ПО, работающего на уровне ядра. Также, при выборе автоматического дампа памяти, в папке C:\Windows\Minidump сохраняются малые дампы памяти. В большинстве случаев этот параметр оптимален.
Помимо «Автоматический дамп памяти» в параметрах сохранения отладочной информации есть и другие варианты:
- Полный дамп памяти — содержит полный снимок оперативной памяти Windows. Т.е. размер файла дампа памяти MEMORY.DMP будет равен объему используемой (занятой) оперативной памяти на момент появления ошибки. Обычному пользователю обычно не требуется.
- Дамп памяти ядра — содержит те же данные что и «Автоматический дамп памяти», по сути это одна и та же опция, за исключением того, как Windows устанавливает размер файла подкачки в случае выбора одной из них. В общем случае вариант «Автоматический» подходит лучше (подробнее для интересующихся, на английском — здесь.)
- Малый дамп памяти — создание только мини дампов в C:\Windows\Minidump. При выборе данной опции сохраняются файлы по 256 Кб, содержащие базовую информацию о синем экране смерти, списке загруженных драйверов, процессах. В большинстве случаев при непрофессиональном использовании (например, как в инструкциях на этом сайте по исправлению ошибок BSoD в Windows 10), используется именно малый дамп памяти. Например, при диагностике причины синего экрана смерти в BlueScreenView используются файлы мини дампов. Однако в некоторых случаях может потребоваться и полный (автоматический) дамп памяти — часто службы поддержки ПО при возникновении неполадок (предположительно вызванных этим ПО) могут просить предоставить именно его.
Дополнительная информация
В случае, если вам нужно удалить дамп памяти, вы можете сделать это вручную, удалив файл MEMORY.DMP в системной папке Windows и файлы, содержащиеся в папке Minidump. Также можно использовать утилиту «Очистка диска» Windows (нажать клавиши Win+R, ввести cleanmgr и нажать Enter). В «Очистке диска» нажмите кнопку «Очистить системные файлы», а затем в списке отметьте файла дампа памяти для системных ошибок, чтобы удалить их (при отсутствии таких пунктов можно предположить, что дампы памяти пока не создавались).
Ну и в завершение о том, почему может быть отключено создание дампов памяти (или отключаться само после включения): чаще всего причиной являются программы для очистки компьютера и оптимизации работы системы, а также софт для оптимизации работы SSD, который также может отключать их создание.
Windows 11 (including earlier version), when, encounter a Blue Screen of Death (or BSOD), accumulates all the memory information into a file. Holding Dump file as name it further helps users to identify and debug the cause of the crashes. The files also allow writing the debugging details in different file formats in order to simplify the readability of the data.
Dump file may be of various types depending on the nature of crash and bug check values. These are “Small memory dump (Minidump)”, “Kernel memory dump”, “Complete memory dump”, “Automatic memory dump”, and “Active memory dump”. However, among all these, Windows 10/11 generates Automatic memory dump all by itself as its name suggests. The following section will deal with everything related to Dump File Location Windows 11 or 10.
Dump File Location Windows 10 or 11
Here is the Dump File Location Windows 11 or 10 –
Dump File Location
Instead, you can say Dump file locations so see the following paths to find out the data –
%SystemRoot%memory.dmp which means
C:\Windows\memory.dmp
This is the default location and here, C: refers to the system drive where Windows is installed.
Windows 11/10 can also capture memory dumps that consume a small amount of space. These are created at –
%SystemRoot%Minidump.dmp i.e.,
C:\Window\Minidump.dump
Change Dump File Location Windows 11 or 10
- Go to desktop and right-click on This PC icon. From the available options, choose Properties.
- Click Advanced system settings link that shows up on the top left of the subsequent window.
- Click Settings beneath Startup and Recovery section.
- Locate the Dump File text field and insert the location of the file.
Configure the Type of Memory Dump File
As aforementioned, Windows generates Automatic memory dump files but users can choose to configure the settings as per need. Thankfully, there are certain ways using which a user can change the type of memory dump file that Windows creates.
1]Through Startup and Recovery
- Press “Win logo+R” hotkey to open Run dialog box. System properties wizard will become visible, switch to Advanced tab.
- Here, click Settings just below Startup and Recovery section.
- Click the drop-down under Write debugging information. From the list of dump file types, choose the type that you wish Windows to generate when Windows crashes.
- To apply the changes, click OK.
Note – In case the system crashes a lot, it’s better to deselect the checkbox against the option Overwrite any existing file. Doing this will eventually create incremental dump files that will have a memory dump file for each crash that occurs.
2] Use Elevated Command Prompt
- Fire up taskbar search using Win+S combination of keys. Type in cmd.exe, right-click ok Command Prompt and choose Run as administrator.
- Click Yes on the prompt of UAC to access elevated Command Prompt.
- Once into the black window, insert the applicable command from the list below to change the type of dump file and hit Enter.
| Memory Type | Command Line |
| No memory | wmic RECOVEROS set DebugInfoType = 0 |
| Small memory dump | wmic RECOVEROS set DebugInfoType = 3 |
| Kernel memory dump | wmic RECOVEROS set DebugInfoType = 2 |
| Complete memory dump | wmic RECOVEROS set DebugInfoType = 1 |
| Automatic memory dump | wmic RECOVEROS set DebugInfoType = 7 |
| Active memory dump | wmic RECOVEROS set DebugInfoType = 1 |
- Finally, close the prompt window and Restart Windows 10 PC to make the changes effective.
Note – The Command Prompt also lets you view the current memory dump file. Just open Command Prompt as Administrator and run the following command-line –
wmic RECOVEROS get DebugInfoType
Types of Memory Dump Files
It is important to know the types after finding Dump File Location Windows 11 or 10 –
Small memory dump – It is the type that contains a minimal amount of details. Basically, the file includes the stop code, list of device drivers, parameters. Furthermore, it also contains the current process and informs which kernel thread or process crashed.
Kernel memory dump – This is the most useful and comprehensive one with respect to the kernel. Moreover, this type contains information in connection with programs and drivers in kernel mode. However, the dimension of this dump file completely depends on the amount of kernel-mode memory specified by Windows and drivers. Now, in case a second crash occurs and a kernel memory dump file is generated, the earlier content gets overwritten.
Complete memory dump – A remarkably large file type which is equal to the RAM of the system. It incorporates physical memory allocation that is basically left out in other kernel dumps.
Automatic memory dump – When compared to the kernel memory option, this is quite similar to it in terms of information. The only difference between them is the size of the paging file that Windows sets for them.
Active memory dump – It is comparatively smaller than complete memory dump. This type refines the items that are not influential in spotting the cause of a crash.
That’s all!!!
When it comes to troubleshooting computer issues, reading minidump files can provide valuable insights. These files, generated by Windows 10 when a system crash occurs, contain crucial information about the crash. Did you know that minidump files can reveal the cause of the crash, helping you identify problematic drivers or hardware? By understanding how to read these files, you can effectively diagnose and resolve system issues.
Reading minidump files in Windows 10 requires some technical knowledge, but it can be a powerful tool for troubleshooting. Minidump files serve as a record of the system state at the time of the crash, including information about the processes running, memory usage, and any error codes. By analyzing these files, you can identify patterns, find potential software conflicts, and take necessary steps to prevent future crashes. Learning how to read minidump files is a valuable skill that can save you time and frustration when it comes to diagnosing and resolving system issues in Windows 10.
If you’re experiencing a crash or system error on your Windows 10 computer, analyzing minidump files can provide valuable information. To read minidump files in Windows 10, follow these steps:
- First, make sure you have the debugging tools for Windows installed on your computer.
- Open the minidump file in the WinDbg tool, which is part of the debugging tools.
- Analyze the crash dump by examining the call stack, loaded modules, and other information.
- Look for error codes or warnings that can help identify the cause of the crash.
- Search for solutions or consult with technical forums if you need assistance interpreting the analysis.

Understanding Minidump Files in Windows 10
Minidump files are essential diagnostic files generated by the Windows operating system when a system crash, also known as a Blue Screen of Death (BSOD), occurs. These files contain vital information about the crash, including the memory contents at the time of the crash, which can be invaluable in diagnosing and troubleshooting the issue. However, reading and interpreting minidump files requires a deep understanding of the internal structure and context of the operating system.
Locating Minidump Files in Windows 10
Before diving into reading minidump files, it’s essential to know where to find them. By default, Windows 10 is configured to create minidump files whenever a system crash occurs. These files are typically stored in the %SystemRoot%\Minidump folder, where %SystemRoot% represents the installation directory of Windows.
To locate the minidump files, follow these steps:
- Open File Explorer.
- Navigate to the
C:drive (or the drive where Windows is installed). - Open the
Windowsfolder. - Find and open the
Minidumpfolder.
Inside the Minidump folder, you will find the minidump files with the extension .dmp. These files are binary files that contain valuable information about the crash that occurred.
Using WinDbg to Read Minidump Files
WinDbg is a powerful debugging tool provided by Microsoft that can be used to read and analyze minidump files in Windows 10. It offers advanced features and commands that help in understanding the cause of the crash and identifying the faulty components.
To use WinDbg to read minidump files, follow these steps:
- Download and install the Windows Software Development Kit (SDK) for Windows 10 from the official Microsoft website.
- Launch WinDbg once the SDK is installed.
- From the File menu, click on «Open Crash Dump» or press Ctrl + D.
- Navigate to the location of the minidump file and select it.
- Click «Open» to load the minidump file into WinDbg.
Once the minidump file is loaded, you can use various commands and analyze the output to gain insights into the crash. WinDbg provides access to the system’s memory, registers, stack trace, and other relevant information that can help identify the root cause of the crash.
Analyzing the Stack Trace
One of the most crucial aspects of reading minidump files is analyzing the stack trace. The stack trace provides information about the sequence of function calls leading up to the crash, helping developers pinpoint the exact location where the error occurred.
To analyze the stack trace in WinDbg:
- Use the
kbcommand to display the stack trace. - Examine the function names, memory addresses, and module names in the stack trace to identify any patterns or abnormal behavior.
- Look for function names or module names that are related to your application or drivers to identify potential culprits.
By carefully analyzing the stack trace, you can narrow down the potential causes of the crash and focus on troubleshooting those specific areas.
Using Symbols for Better Analysis
Symbols play a crucial role in the analysis of minidump files. They provide human-readable names for memory addresses, functions, and modules, making it easier to understand the crash context.
To configure symbol settings in WinDbg:
- From the File menu, click on «Symbol File Path» or press Ctrl + S.
- Add the symbol server path provided by Microsoft:
srv*https://msdl.microsoft.com/download/symbols. - Click «OK» to save the settings.
Once the symbol server path is set, WinDbg will automatically download the necessary symbol files for better analysis.
A notable command for symbol analysis is !analyze -v. This command provides a verbose analysis of the minidump file and helps identify potential causes based on various factors, such as exception codes, faulting modules, and more.
Extending Analysis with Extensions
WinDbg allows users to extend its functionality through various extensions. These extensions provide additional commands, scripts, and features for specialized analysis scenarios.
Some popular extensions for minidump analysis include:
- NTSD extension: Offers advanced commands for analyzing both user-mode and kernel-mode crashes.
- SOS extension: Designed for debugging managed .NET applications and provides powerful commands for analyzing the managed code stack and objects.
- Common WinDbg extensions: Includes a collection of extensions that provide additional functionality and information for various analysis scenarios.
Using extensions can significantly enhance the analysis capabilities of WinDbg and help uncover critical details about the crash.
Analyzing Minidump Files Using Visual Studio
Another powerful tool for reading and analyzing minidump files in Windows 10 is Visual Studio. It provides a rich debugging experience and integrates seamlessly with the development environment.
To analyze minidump files using Visual Studio, follow these steps:
- Open Visual Studio.
- From the «Debug» menu, select «Open Dump File» or press Ctrl + Alt + D.
- Navigate to the location of the minidump file and select it.
- Click «Open» to load the minidump file into Visual Studio.
Once the minidump file is loaded, Visual Studio provides a comprehensive set of tools for analyzing the crash. You can examine the call stack, view memory contents, evaluate expressions, and even step through the code to understand the flow of execution.
Using the Call Stack Window
The Call Stack window in Visual Studio displays the sequence of function calls leading up to the crash, similar to the stack trace in WinDbg. However, Visual Studio provides more advanced features and a user-friendly interface for analyzing the call stack.
To use the Call Stack window:
- From the «Debug» menu, select «Windows» and then «Call Stack» or press Ctrl + Alt + C.
- Examine the function names, file paths, and line numbers in the call stack to identify any potential issues.
- You can double-click on a function in the call stack to navigate directly to its source code for further analysis.
The Call Stack window in Visual Studio helps developers quickly identify the origin of the crash and navigate to relevant code sections for debugging and troubleshooting.
Inspecting Variable Values with the Watch Window
The Watch window in Visual Studio allows developers to inspect the values of variables and expressions at different points during the crash. This enables a deeper understanding of the state of the program and can reveal valuable insights into the cause of the crash.
To use the Watch window:
- From the «Debug» menu, select «Windows» and then «Watch» or press Ctrl + Alt + W.
- Add variables or expressions of interest to the Watch window.
- As you step through the code using breakpoints or the debugger, the values in the Watch window will update dynamically.
By observing the variable values, developers can identify any anomalies or unexpected changes that might be contributing to the crash.
Mining Valuable Information from Minidump Files
Minidump files contain a wealth of information that can shed light on the cause of a system crash. However, to extract the most value from these files, it is crucial to know what specific details to look for and how to interpret them.
Some key information that can be obtained from minidump files includes:
- Exception codes: These codes provide insight into the type of exception that occurred during the crash, such as access violations or illegal instructions.
- Faulting modules: The minidump file identifies the modules or drivers that were active at the time of the crash, helping to pinpoint potential problem areas.
- Register values: The values of CPU registers (e.g., EAX, EBX, EIP) provide information about the state of the system at the time of the crash and can aid in understanding the flow of execution.
- Memory contents: By analyzing the memory contents, it is possible to determine the values of variables, function return addresses, and other critical data that might be relevant to the crash.
Understanding the significance of these details and correlating them with the application or system state can help identify the root cause of the crash and guide the troubleshooting process.
Analyzing Minidump Files with WinDbg Preview
In addition to the traditional WinDbg, Microsoft has introduced a new WinDbg Preview tool, specifically designed for Windows 10. It provides an improved user interface and introduces new features to enhance the analysis of minidump files.
To use WinDbg Preview:
- Download and install WinDbg Preview from the Microsoft Store or the official Windows Dev Center.
- Launch WinDbg Preview.
- From the «File» menu, click on «Open Dump File» or press Ctrl + D.
- Navigate to the location of the minidump file and select it.
- Click «Open» to load the minidump file into WinDbg Preview.
WinDbg Preview offers a refreshed and modernized interface, making it easier to navigate and explore the contents of a minidump file. It also introduces several new commands and features, such as a command-line interface, JavaScript scripting, and integration with the Windows Debugger extension gallery.
Developers familiar with the original WinDbg will find the transition to WinDbg Preview smooth, while benefiting from the additional functionality and improvements offered by the new tool.
Leveraging Symbol Servers in WinDbg Preview
Similar to traditional WinDbg, WinDbg Preview also relies on symbols for better analysis of minidump files. Setting up symbol servers in WinDbg Preview offers the same advantages as in the traditional tool, including the ability to resolve memory addresses and provide meaningful names for modules and functions.
To configure symbol settings in WinDbg Preview:
- From the «File» menu, click on «Symbol File Path» or press Ctrl + S.
- Add the symbol server path provided by Microsoft:
srv*https://msdl.microsoft.com/download/symbols. - Click «OK» to save the settings.
With the symbol server path properly configured, WinDbg Preview will automatically download and load the necessary symbol files, improving the analysis experience.
Scripting and Automation with JavaScript
An exciting feature introduced in WinDbg Preview is the ability to automate analysis tasks using JavaScript scripting. This enables developers to write scripts that can perform complex analysis operations, inspect variables, apply breakpoints, and extract valuable information from minidump files.
WinDbg Preview provides an integrated JavaScript console where scripts can be executed, eliminating the need to switch between the debugger and external scripting environments.
By leveraging the power of JavaScript

Understanding Minidump Files in Windows 10
Minidump files are small memory dump files that are created when Windows encounters a critical error. These files contain important information that can help in diagnosing the cause of the error. If you are experiencing frequent crashes or blue screens in Windows 10, learning how to read minidump files can provide valuable insights into the underlying issues.
To read minidump files in Windows 10, you need to analyze them using specialized tools. One such tool is WinDbg, which is part of the Windows Software Development Kit (SDK). WinDbg allows you to load and examine minidump files, analyze the stack trace, identify the faulty driver or module, and interpret error codes.
When analyzing minidump files, it is important to have knowledge of Windows internals and debugging techniques. The process can be complex and requires expertise in troubleshooting Windows issues. However, with proper guidance and resources, even non-experts can learn how to interpret minidump files and find clues to resolve system crashes.
Reading minidump files is a valuable skill for IT professionals, system administrators, and software developers. By understanding the information stored in these files, you can effectively troubleshoot and fix Windows 10 crashes, ensuring a stable and reliable computing experience.
Key Takeaways — How to Read Minidump Files Windows 10:
- Understanding minidump files can help diagnose and troubleshoot Windows 10 crashes.
- Minidump files contain important information such as error codes and memory addresses.
- Using the Windows Debugger tool, you can analyze minidump files and identify the cause of the crash.
- Learning to read the stack trace in a minidump file can provide insights into the sequence of events leading to the crash.
- Knowledge of common error codes and their meanings can help interpret minidump files more effectively.
Frequently Asked Questions
Reading minidump files in Windows 10 can be a valuable skill when troubleshooting system crashes. Here are some common questions and answers that can help you understand how to read minidump files in Windows 10.
1. Why are minidump files important for analyzing system crashes in Windows 10?
Minidump files are essential for analyzing system crashes in Windows 10 because they contain valuable information about the state of the system at the time of the crash. These files provide a snapshot of the memory, processes, and threads that were active when the crash occurred. Analyzing minidump files can help identify the root cause of the crash, such as a driver issue or hardware problem.
Analyzing minidump files can help system administrators and technicians troubleshoot and resolve the underlying issues that caused the system crash. It can also provide valuable insights into the stability and reliability of the system, enabling proactive maintenance and preventive measures to avoid future crashes.
2. How can I locate and open minidump files in Windows 10?
To locate and open minidump files in Windows 10, follow these steps:
1. Open File Explorer by pressing Windows Key + E.
2. Navigate to the following location: C:\Windows\Minidump (or the location where your minidump files are stored).
3. Look for files with the .dmp extension.
4. Double-click on a minidump file to open it in the default minidump analysis tool in Windows.
By following these steps, you will be able to locate and open minidump files, allowing you to begin the analysis process.
3. What tools can I use to read minidump files in Windows 10?
There are several tools available that can help you read and analyze minidump files in Windows 10. The most commonly used tools include:
1. WinDbg: A powerful debugging tool provided by Microsoft, primarily used by developers and advanced users to analyze minidump files.
2. BlueScreenView: A user-friendly tool that provides a simple interface to view and analyze minidump files. It highlights important information such as the crash address, the driver responsible for the crash, and the crash stack.
3. Visual Studio: If you are a developer using Visual Studio, you can use its built-in debugging and analysis capabilities to read and analyze minidump files.
4. WhoCrashed: Another user-friendly tool that automatically analyzes minidump files and provides information about the cause of the crash.
By using these tools, you can effectively read and analyze minidump files to diagnose system crashes in Windows 10.
4. What information can I find in a minidump file?
Minidump files contain valuable information that can help diagnose system crashes in Windows 10. Some of the key information you can find in a minidump file includes:
1. Crash address: The memory address where the crash occurred.
2. Stack trace: The sequence of function calls leading up to the crash, providing insights into the code execution flow.
3. Module information: Information about the loaded modules and drivers at the time of the crash.
4. Process and thread information: Details about the active processes and threads at the time of the crash.
5. Exception code: The specific code that caused the crash, such as an access violation or an invalid handle.
Analyzing this information can help identify the specific cause of the crash and guide the troubleshooting and resolution process.
5. What are some common causes of system crashes indicated by minidump files in Windows 10?
Minidump files can provide insights into the common causes of system crashes in Windows 10. Some of the common causes indicated by minidump files include:
1. Faulty hardware drivers: Outdated or incompatible drivers can cause system crashes. Minidump files can identify the specific driver responsible for the crash.
2. Memory issues: Problems with system memory, such as faulty RAM modules, can cause crashes. Minidump files can help identify memory-related issues.
3. Software conflicts: Conflicts between different software applications or between software and hardware can lead to crashes. Minidump files can reveal the software components involved in the crash.
4. Overheating: Excessive heat can cause system instability and crashes. Minidump files can provide information about the temperature at the time of the crash.
5. Malware or security threats: Certain types of malware or security threats can cause system crashes. Minidump files can provide insights into any suspicious processes or modules.
By analyzing minidump files, you can identify the underlying causes of system crashes and take appropriate action to resolve them.
Understanding how to read minidump files in Windows 10 can be a valuable skill for troubleshooting system crashes. By analyzing these files, you can gain insights into the root cause of the crash and take appropriate measures to resolve the issue.
To read minidump files in Windows 10, you can start by using specialized tools like WinDbg, which can provide detailed information about the crash. By examining the stack trace, module information, and error codes within the minidump file, you can identify the faulty driver or hardware component causing the crash.
If a Windows 10 system runs into a serious problem, the system will be halted and Windows will show a blue screen with a stop error. This blue screen of death (BSOD) means a software error caused a kernel-level fault. In some cases, the information on the screen can be enough to analyze and fix the error. But in many cases, more information is needed to troubleshoot and solve the BSOD. For this, the Windows 10 minidump file can be used.
The minidump is basically an instrument to analyze the system crash. It represents the state of the system as it was running when the error happened. A minidump file contains only a minimal amount of information though. The stop error code, loaded device drivers, and some process and processor information. But since many stop errors are caused by device drivers or memory errors, this information can be enough to find the cause.
Configure the system to create a minidump
If you want Windows 10 to create a minidump file when it crashes, you can configure this through the system settings.
- Open Settings from the Start menu.
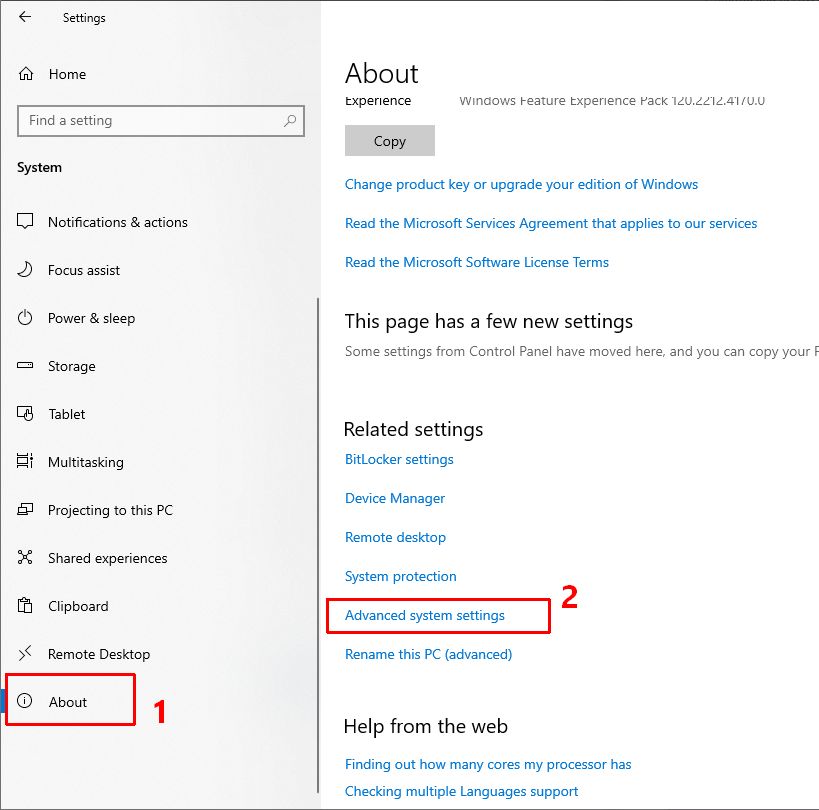
- Select About in the left-hand tab (1) in the Settings window (1).

- In the right-hand panel, scroll down to Related settings and then click the Advanced system settings link (2). This will open a new window with the System Properties.
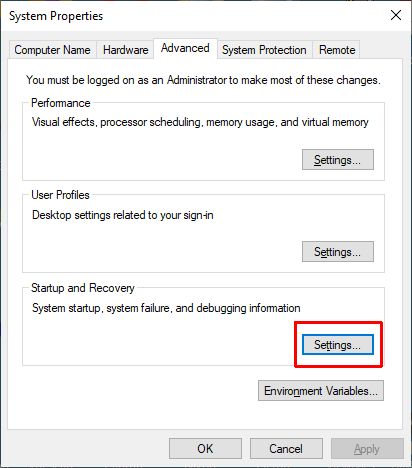
- In the System Properties window, click the Settings button in the Start and Recovery group.

This will again open a new window showing the System startup options.
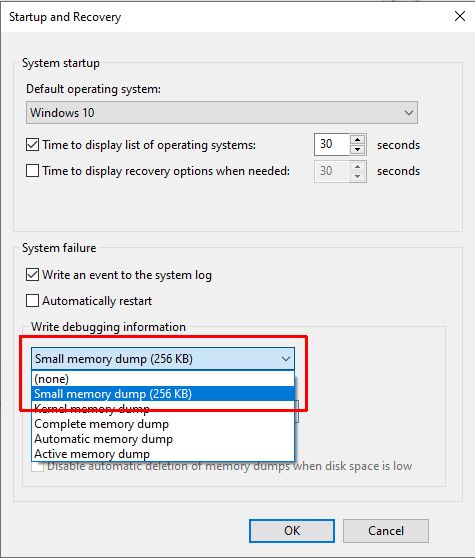
- Under Write debugging information, select the Small memory dump (256 KB) option.

- To change the location of the minidump file, the path in the Small dump directory field can be changed.
- Click the OK button to confirm the startup changes for system failure.
- Click the OK button in the System Properties window to close it.
- Finally, close the Settings window.
The next time a stop error occurs and the system is halted showing a blue screen, a minidump file will be created in the specified path.
Where is the minidump file stored?
The path for the minidump file can be configured, but by default is %SystemRoot%\Minidump. The %SystemRoot% is an environment variable that translates to C:\Windows on most systems. C: depends on the system drive letter.
Can I safely delete a minidump file?
Yes, the minidump files are files with information about a crash. After using it for analyzing an error, it can be deleted. Depending on where the file is saved, a user account with admin-level privileges may be needed.
What file format is a minidump?
The file format for a minidump file is binary. The file extension is .DMP which indicates the type of file.
How can I open a minidump file?
In Windows 10, you can open a minidump file using the WinDbg program, which can be downloaded from the Microsoft App store. Alternatively, you can download the Windows SDK for Windows 10 and install the Debugging Tools for Windows.

Welcome Dear Visitors All;
If you are a windows user, then you may encounter a blue screen of death error message that indicates that “Your Device Ran into a Problem and Needs to Restart”. This blue screen indicates that your windows detected a system or hardware corruption, so the computer restarted as an attempt to protect your hardware or system files from further corruption. In such case, the computer will write a log report into a file called Memory.dmp or minidump file to inform you what is the problem that caused the system to crash or to restart. But the Crash debugging mode should be enabled before this event.
This topic I will show you how to enable Windows crash Memory dump, and how to view or share the file in windows 10 and windows 11 operating systems to get an online support from Microsoft or from ValiumMedia Techs channel on YouTube.
You can configure your system to write a debugging information either into a large file called Memory.dmp stored in windows folder on this path “C:\Windows\Memory.dmp“, or as a small numerically named file with .dmp extension stored inside Minidump folder on this path “C:\Windows\Minidump\“.
How to Check Crash Debugging Status?
You can check whether the crash debugging status is enabled or disabled by using either Command Prompt or using Advanced System Properties, a System Settings panel. Both methods are applicable to Windows 7,Windows 8, Windows 10, Windows 11 or any windows edition.
How to Check Debugging Status from Advanced System Settings?
- Press Windows + R keys from keyboard to open Run tool
- Type SystemPropertiesAdvanced and press Enter to open System Properties settings panel.
- Click on Settings icon under Startup and Recovery field
- If None is the selected option under Write Debugging Information field, then the debugging status is disabled in your computer.
- So select Automatic Memory Dump or Small memory dump or another option to enable the Memory Dump debugging.
- In Advanced Recovery Environment, you can use CMD to open System Properties Advanced after changing the CMD path into System32 folder.
How to Check Debugging Status Using CMD in Windows 11?
- To check debugging status from Command Prompt, do the followings:
- Type CMD into search box and then run the Command Prompt as administrator
- Type the following command and press Enter
- WMIC RECOVEROS Get DebugInfoType
- The seven value indicates that the Debugging is enabled in Automatic Memory Dump mode.
- Note: In Advanced Recovery Environment, you have to change the CMD path into C:\Windows\System32 folder first, in order to check or to enable Crash debugging mode using this command:
- CD /D C:\Windows\System32
- Replace the C with the letter of windows drive in your PC.
- CD /D C:\Windows\System32
You can enable the Crash debugging mode in windows using one of the following methods:
- From System Properties settings
- From Command Prompt
- From Registry Editor
How to Enable Crash Debugging Using System Properties settings:
- Press Windows + R keys from keyboard to open Run tool
- Type SystemPropertiesAdvanced and press Enter from keyboard to open System Properties settings
- Click on Settings icon under Startup and Recovery field
- From Write Debugging Information field, choose Complete Memory Dump, Kernel Memory Dump, Automatic Memory Dump, or Small Memory Dump according to what you want
- After that, click Ok to save changes.
How to Enable Crash debugging Memory File Using CMD?
- To enable Memory dmp or minidump creation using CMD, do the followings:
- Type CMD into Search box and then Run the Command Prompt as administrator
- Execute the following command to enable Complete Memory Dump:
- WMIC RECOVEROS set DebugInfoType = 1
- Execute the following command to enable Kernel Memory Dump:
- WMIC RECOVEROS set DebugInfoType = 2
- Execute the following command to enable Small memory dump (128 KB):
- Execute the following command to enable Automatic memory Dump:
- WMIC RECOVEROS set DebugInfoType = 7
- To disable Crash debugging, execute this command:
- WMIC RECOVEROS set DebugInfoType = 0
- You can also use the same commands to enable the debugging memory files from Windows Recovery Environment, but you have to change the CMD path to System32 folder first using this command:
- CD /D C:\Windows\System32
- Replace the C with the letter of windows drive in your PC.
- CD /D C:\Windows\System32
How to Enable Debugging Memory File Using Registry Editor?
- To enable crash debugging file from registry editor, do the followings
- Press Windows logo + R keys to open Run Tool
- Type Regedit and press Enter to open Registry Editor tool
- Navigate to this key path:
- Computer\HKEY_LOCAL_MACHINE\SYSTEM\CurrentControlSet\Control\CrashControl
- Right click on CrashDumpEnabled key and then select Modify option
- Change the value data into one of the followings:
- Type 1 to enable Complete Memory Dump
- Type 2 to enable Kernel memory Dump
- Type 3 to enable Small Memory Dump
- Type 7 to enable Automatic Memory Dump
- You can enable debugging from advanced recovery menu using Registry editor as followings:
- Type REGEDIT into command prompt and press Enter to open Registry editor
- Select HKEY LOCAL MACINE
- From File tab, select Load Hive option
- Select your windows and then navigate to Windows\System32\Config folder
- Select System file and then click on Open option
- Type Sys and then click ok to load the system Registry file
- Expand Sys key and then navigate to this path:
- ControlSet\Control\CrashControl
- Right click on CrashDumpEnabled key and select Modify option
- Type three to enable Small Memory Dump, or type Seven to enable Automatic Memory Dump
- Collapse the keys list and then select Sys key
- Click on file tab and then select Unload Hive option
How to Read Memory Dump File?
- To View the memory.dmp or the Minidump file, do the followings:
- Install the WinDbg tool from Microsoft Store or from the official Microsoft website for free
- After installing the debugger tool, locate the tool launcher and start it
- From File tab, select Open Crash Dump option
- Navigate to the windows or Minidump folder and then double click the dump file to load it.
- Click on !analyze -v to start analyzing the crash file
- Note: You have to be connected to the internet in order to download the debugging codes and symbols required to analyze the file.
- You have to have enough experience in coding and in Microsoft symbolsmeanings in order to understand the analyzing result of the Memory.dmp file.
- You can also use free windows memory.dmp viewer from third party source, such as NirSoft BlueScreenView tool. This free tool can also be used while booting into Windows Recovery Environment.
How to Share the Memory Dump File?
- To get an online support, you can upload the memory dump or minidump file as followings:
- Open C:\Windows\ and/or C:\Windows\Minidump\ folder according to debug settings in your computer
- Copy the memory.dmp file or the Minidump file into Documents or another folder so you can compress and share the file without access denied or permission errors, because windows security settings is not allow copy or modification the files in their default paths.
- Right click the Memory.dmp file and then select “Compress to zip File” option to reduce the file size so you can share it faster.
- You can copy both memory.dmp and minidump files if your computer created both files.
- If you have failed to copy the files, you can run the CMD as administrator and then execute one of the following commands to copy the files into Dump folder in the main directory of C partition:
- XCOPY /R /H /i “C:\Windows\Memory.dmp” C:\DUMP
- To copy Memory.dmp file
- XCOPY /R /H /i “C:\Windows\Minidump” C:\DUMP
- To copy Minidump folder or its contents
- XCOPY /R /H /i “C:\Windows\Memory.dmp” C:\DUMP
- To compress the Dump folder using CMD, execute this command;
- Powershell Compress-Archive c:\dump c:\dump.zip
- In Advanced Recovery Menu, you can send the Memory.dmp file into a USB drive, after that, connect the USB drive to your mobile or another computer to upload the file into google drive or into another file hosting website or online cloud.
- After that, copy the link and add it in a comment or into email to get the online help.
How do I upload files to a shared Google Drive?
- To upload the file into your Google Drive, do the followings:
- Click on +New icon in the upper left corner and then select File upload option
- Navigate to the file path and double click it to start uploading
- You can also drag and drop the zip file into the main website page to upload it.
- To all others viewing or downloading the file, hover on the file name and then click on the Share icon, and then change the General Access of the file from “Restricted” to “Anyone with the link” option and click Done to save changes. After that, copy the link and share it to anyone you want to share with.
VIDEO:
For more details about how to enable crash debugging mode, and how to view or share the memory.dmp file to get online support, watch the following video to see everything step by step:
Please follow and like us: