
Windows Performance Recorder is a useful tool for troubleshooting computer problems. It’s easy to install, run, and work with Windows.
Windows Performance Recorder (WPR) and Windows Performance Analyzer are two separate utilities that make up the Windows Performance Toolkit (WPA).
A performance recording tool based on Event Tracing for Windows (ETW) is called Windows Performance Recorder (WPR). It logs system and application events, which can then be used by Windows Performance Analyzer (WPA) to inspect.
Windows Performance Analyzer (WPA) is a program that generates graphs and tables of data using Event Tracking for Windows (ETW) events that have been recorded by Windows Performance Recorder (WPR), Xperf, or assessments that have been run on the Assessment Platform. Any event trace log (ETL) file can be opened by WPA for analysis.
To view specific performance issues and get an overview of resource usage, use WPR in conjunction with WPA. Development and IT workers can proactively identify and address performance issues thanks to WPR and WPA.
Other Interesting Articles
Install Windows Performance Recorder
Along with other performance tools such as Windows Performance Analyzer and Xperf, Windows Performance Recorder (WPR) is a component of the Windows Assessment and Deployment Kit (Windows ADK).
Download WPR on Windows Assessment and Deployment Kit (Windows ADK)
- Run ADKSetup.exe the result of the download.
- Select where the Windows ADK should be installed by clicking Install, and then clicking Next.
- Click Install after selecting the Windows Performance Toolkit (ADK) features you want to install. Other than the Windows Performance Toolkit, nothing else needs to be installed. The entire ADK does not have to be installed (or SDK).
Start Windows Performance Recorder Recording
- Open Windows Performance Recorder.
- Select at least one profile from the list in the Select a profile box. The addition of a unique profile is optional. To do so, click “Add Profiles”, select the desired profile, and then click Open.
- Select the desired scenario from the “Performance scenario” drop-down list. Select “General” except recording for on/off scenarios such as sleep, shutdown, reboot, etc.
- Select the detail level of the report, you can choose “Verbose” (default) and “Light”.
- Select File from the Logging mode drop-down menu to save the recording to a file. Except for the on/off transition log, which must be written to a file, memory is the default logging mode.
- To start or stop recording, select Start or Cancel.
Turn off Windows Performance Recorder recordings
- Klik Save on the WPR screen. (No recording data is saved if you click Cancel.)
- Select the location where you want to save the recording file by browsing there.
- Provide a summary of the issue the record wants to address.
- Click OK after clicking Save.
View Windows Performance Recorder Recording Status
The recording status appears on the WPR screen as soon as you start the recording using the WPR user interface (UI).
WPR can only provide the status of a record if WPR starts its recording first. It cannot display the status of records that have been started by Xperf or other programs.
The following details are displayed in the recording state:
- Recording Time: The recording has been played all along.
- Buffer: The size of the buffer used to record is this. It is displayed in MB and as a proportion of the available combined memory.
- Events dropped: how many events have been lost since the recording first started?
In this article, I will show you how to use “Windows Performance Recorder” to record a Windows boot trace and troubleshoot a slow boot.
First of all, you need to download the Software Development Kit (DSK)
After running the sdksetup.exe you should select one of the following options:

The first option is to install the Windows performance toolkit on the computer running the setup.
The second one will allow you to download the offline setup files that can be executed on another computer.
For our purpose, we will choose the first one.
Click next and accept the license agreement.

Click on “Windows Performance Toolkit” and then on the install button.
Reboot your computer to finish the setup.
To record a boot trace, type “wpr” from the Windows start menu and click “Windows Performance Recorder”.


On the “Performance scenario” menu, choose “Boot“.
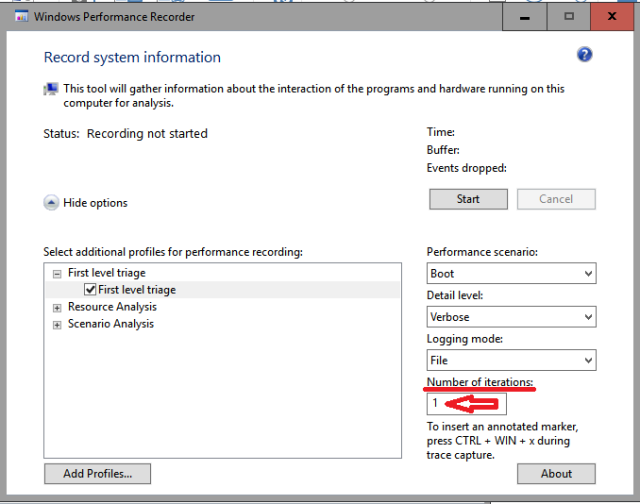
Type “1” for the number of iterations and then click the start button.

Select the path where the trace file, with the “.etl” extension, will be saved and click the “Save” button.

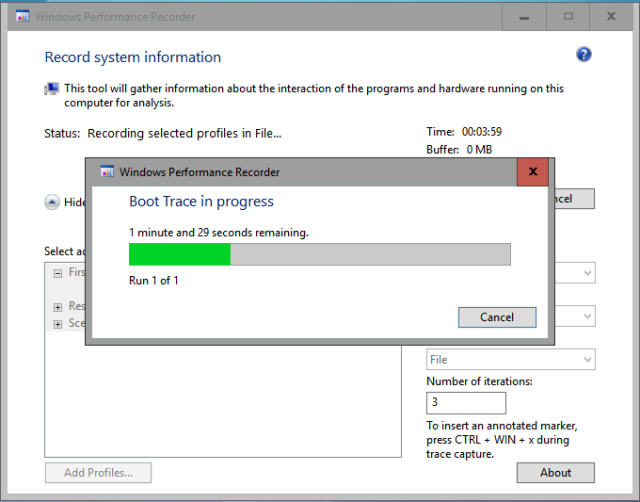
After you click on the OK button, your system will reboot, and “Windows Performance Recorder” will record every boot phase.
After you open your Windows session, WPR will end the trace and save the file in the specified path.
Generally, the trace file will be a hundred Mb to Gigabytes.
So, if you want to share your trace or send it by e-mail, remember to compress the.ETL file and the.NGENPDB folder.
What’s next?
I hope you found this blog helpful. Before you go, I’d like to ask if you’d consider supporting my work. Running this blog requires a lot of time and dedication, and with more people using ad blockers and AI tools, ad revenue has been declining. Your support would allow me to keep creating the content you enjoy. Thank you for considering it..
Related
On the Start screen, click Windows Performance Recorder. To run the default profile, click Start. To learn how to view and use other profiles, refer to Start a Recording. Click Start to begin recording, or click Cancel to end without recording.
How do I get Windows Performance Recorder?
Where to get Windows Performance Recorder. Windows Performance Recorder (WPR) is included in the Windows Assessment and Deployment Kit (Windows ADK) along with other performance tools such as Windows Performance Analyzer and Xperf. You can download WPR by visiting Windows Assessment and Deployment Kit (Windows ADK).
What is Windows Performance Recorder?
WPR is a powerful recording tool that creates Event Tracing for Windows (ETW) recordings. You can run WPR from the user interface (UI) or from the command line. WPR provides built-in profiles that you can use to select the events that are to be recorded.
Where are Windows Performance Recorder files stored?
By default, the resulting files will be saved in a location similar to “C:\Users\User1\Documents\WPR Files\.” There will be an . etl file and a directory full of other … pdb directories.
How do you start performance counters?
You can view performance counters using the Microsoft Windows Reliability and Performance Monitor application. Click Start > Run. In the Open field, enter perfmon , and then click OK.
How to work with Windows Performance Toolkit
How do I enable performance counter in Windows 10?
Open Start, do a search for Performance Monitor, and click the result. Use the Windows key + R keyboard shortcut to open the Run command, type perfmon, and click OK to open. Use the Windows key + X keyboard shortcut to open the Power User menu, select Computer Management, and click on Performance.
What is the command for performance counter?
To view the performance counter output from the job, use the Receive-Job cmdlet. Start-Job uses the ScriptBlock parameter to run a Get-Counter command. Get-Counter uses the Counter parameter to specify the counter path \LogicalDisk(_Total)\% Free Space .
Does Windows 11 have built in screen recorder?
Thankfully, Windows 11 has a built-in application for recording your screen, but there are other methods as well. Snipping Tool comes as part of Windows 11 and is also available via the Microsoft Store.
How do I run Windows Performance Analyzer?
On the Start screen, click Windows Performance Recorder or from start menu search box execute command WPRUi. This will open the following window. 2. To gather CPU and memory related information, select “CPU usage”, “Heap usage” , and “VirtualAlloc usage” from the Resource Analysis options.
Where is recording devices Windows 10?
— Using Windows 10, right click on the speaker icon (right hand side) of the taskbar to show menu choices, left click on Sounds. — Once in the Playback or Recording section, you should see the corresponding devices listed.
Does Windows have a built-in recorder?
Screen recording on Windows FAQ
Windows 11 comes with a built-in screen recorder called Game Bar. Using the steps above, you can start recording your screen with audio in 3 easy steps. Just open the tool, choose your audio devices and screens, and start recording.
Should I use performance mode in Windows?
If your power plan is set to «Balanced» or «Power saver» and you’re experiencing issues like audio crackles, dropouts or other negative performance issues, we recommend switching to the «High performance» power plan.
Does Windows have a built-in audio recorder?
Windows Sound Recorder
To open Sound Recorder, click on the «Start Menu» in the lower left hand corner of your screen. In the search bar, type «Sound Recorder.» 2. Click «Start Recording» to begin recording sound.
Where is Windows Performance Monitor?
Click Start, Settings, Control Panel, Administrative Tools, Performance. The Microsoft Windows Performance Monitor opens.
How do I change Windows Recorder settings?
Adjust background recording settings on Windows
- Select Start , and open Settings .
- Under Gaming , select Captures. Make sure Record what happened is set to On, and (if necessary) select the down arrow for more options.
- Select the Record the last dropdown box to choose the length of the recording.
What happened to Windows Sound Recorder?
But the app vanished altogether in Windows 10, replaced by a totally new app called Voice Recorder, which can record and trim basic sound recordings and save them as m4a files. Sound Recorder is now making a comeback, and Microsoft is currently testing a revamped version for Windows Insiders in the Dev channel.
Does Windows 10 have a performance test?
Use the Performance Monitor and System Diagnostics
The Windows Performance Monitor also lets you view your Windows Experience Index. Here’s how you find the score or perform a system scan if there is no existing score. Type performance into your Start Menu search bar and select Performance Monitor.
Why is screen recording not working on Windows 11?
Make sure Xbox Game Bar is enabled.
If Game Bar is disabled, you can press the keyboard shortcut Win + Alt + R to record your screen, but you won’t find the recorded file afterwards. To enable Game Bar, press Win + i to open Settings, go to Gaming > Xbox Game Bar, and toggle on the feature.
Where is Recorder in Windows 11?
First, press Windows key+Alt+R. The small recording panel appears on the screen. Click the stop button when finished and then open Game Bar. Your new recording now appears in the Gallery window for you to play.
How do I monitor process memory usage in Windows?
1 Answer
- Open Performance Monitor (control panel -> administrative tools)
- Add Counters.
- Expand «Process»
- Select «Private Bytes»
- Select the processes to monitor in the «Instances of selected object» the hit Add, or just hit Add for the entire system.
- Ok.
What is the difference between Performance Monitor and resource monitor?
Performance Monitor provides a quick summary of overall CPU, disk, network, and memory usage. Resource Monitor lets you check the counters for specific system processes and services. Performance Monitor helps access and report information about various computer resources.
How do I turn off Windows Performance Monitor?
In the menu bar in the web-based GUI, go to Home > Performance Monitors. Click the Performance Monitors tab. Locate the performance monitors that you want to start or stop. Select the performance monitor rows and click Actions > Start or Actions > Stop.

In this blog, I will show you how to set up the Windows Performance Recorder and the Windows Performance Analyzer to troubleshoot Autopilot and Intune/MMP-C Enrollments. I will try to explain every single step in the process. Even how to configure the WPR file itself!
1. Introduction
When dealing with Windows Autopilot or Intune/MMP-C Enrollment issues, using Windows Performance Analyzer (WPA) in conjunction with Windows Performance Recorder (WPR) and Procmon can be incredibly effective. WPR allows you to capture detailed data, which can then be analyzed using WPA to diagnose and troubleshoot specific issues. The WPA tool is not only for investigating performance issues but also for troubleshooting other problems as well.
I will focus on why my Endpoint Privilege Management agent wasn’t installed because the corresponding MMP-C Enrollment wasn’t successful. To do so, I will only use the WPA tool to show you how I use that tool to determine where I should focus next.
From there on, you could use that information and timestamp to find out what happens during that timeframe in Procmon
Let’s examine what we must do to troubleshoot the MMP-C enrollment using the WPR and WPA tools. Of course, many more complex examples exist, but let’s start with the basics.
2. The Basics
Let’s start by configuring the Windows Performance Recorder. I will first guide you through the basics before zooming in.
2.1. Setting Up Data Collection with WPR:
Before we could start, we need to create a custom WPR file. We need to create a Custom WPR Profile, to be able to capture relevant data for Autopilot or Intune/MMP-C Enrollment issues. To capture this information, you must create a custom WPR profile with specific ETW providers related to these processes.
But how do we know which providers we need to configure? To identify relevant providers for Autopilot and Intune, you typically include providers who capture events related to device enrollment. If you want to know more about the WPR file, read part 3 of this blog
2.2. Recording Data with WPR:
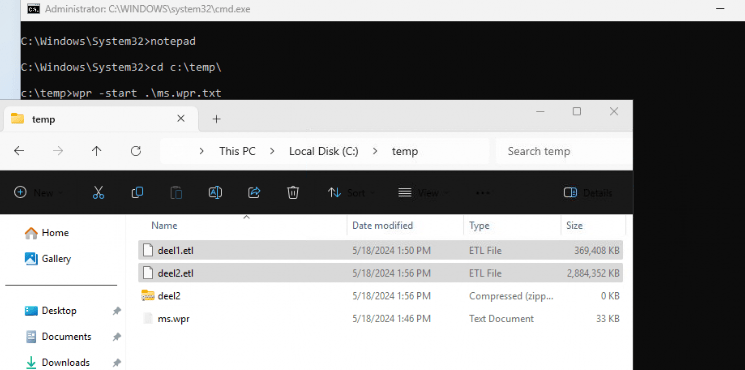
Once we have configured the WPR file, we need to run WPR with the Custom Profile: wpr -start custom.wprp
With the trace running, let’s try to reproduce the Issue. In my example, I needed to kick off the scheduled task
Ensure that the problem occurs while recording is active. Once the issue has been reproduced, stop the recording to save the trace file: wpr -stop output.etl
2.3. Analyzing Data with Windows Performance Analyzer:
Launch the Windows Performance Analyzer and open the generated output.etl file from the previous step.
Filter and Zoom: Use WPA’s filtering and zooming capabilities to narrow the data to the relevant time frame and events. This can help pinpoint the exact cause and timestamp of the problem.
If you want to know more about the WPA tool, read part 4 of this blog
3. The WPR file
Let’s zoom in on the WPR file that we need to create. The WPR file must contain
-The EventProviders (the data sources that need to be captured for Event tracing)
-Buffers, Logging settings
Download this wpr example that I used to troubleshoot this issue:
https://call4cloud.nl/wp-content/uploads/2024/05/autopilotmdm.zip
3.1 Buffers
Let’s start by looking at the first few lines in the WPR file. These lines contain the buffer size configuration.
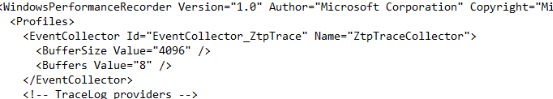
When configuring the buffer size and the number of buffers in a WPR profile, it’s essential to balance capturing enough data to be helpful and not overwhelming the system resources. The buffer settings determine how much data can be held in memory before being written to disk, which affects both the system’s performance during tracing and the comprehensiveness of the captured data.
If you misconfigure the buffers to try to capture everything and not select the proper providers, you could end up with a huge ETL file and, with it, also losing important traces
Considerations for Buffer Configuration
System Resources: Higher buffer sizes and counts consume more memory and disk I/O, which can impact system performance,
Event Volume: If the traced processes generate a high volume of events (authentication attempts or all the nodecache stuff that comes down with Intune), larger and more numerous buffers help ensure no data is lost.
Trace Duration: For long-running traces, more buffers are needed to accommodate the data. Conversely, for short, high-intensity traces, increasing the buffer size might be more beneficial. So, guess what I did to make sure I could capture everything I wanted.
Let’s move on to the ETW providers now we configured the buffers.
3.2 The ETW Providers
We must define the providers we want to capture during the trace, but how do we know which providers we need? Well… Windows comes with tools and documentation to help you discover ETW providers:
Logman Tool: You can use the logman command-line tool to list all available ETW providers on your system.
logman query providers
This command will list all providers registered on the system and their GUIDs. Alternatively, you can use the WEP Explorer to find those providers.
WinTools/WEPExplorer/Binaries/WEPExplore_v1.2.zip at master · 0xeb/WinTools · GitHub
These tools could give you a couple of good ETW providers to capture, but for me, that’s not enough. So, what do I use? This list of ETW providers: ETW providers you never knew existed… · GitHub
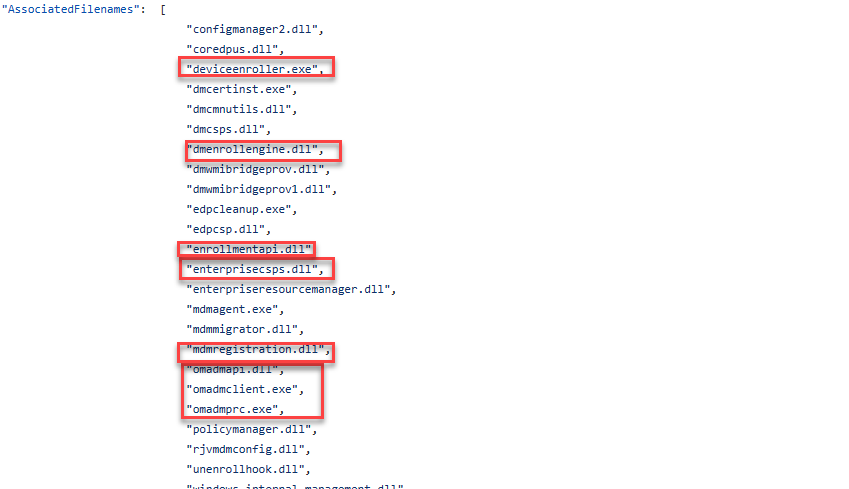
This list contains the ETW providers and their GUIDS, but it also mentions the corresponding DLL files. If the device is being enrolled, three very important DLL files will handle the enrollment task.
Dmenrollengine.exe, mdmregistration.dll, and, of course… the fight club executable: deviceenroller. If we search through that nice big JSON file, one of the providers we want to add is the EMPS.Enrollment one
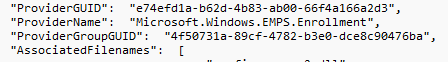
This important event provider is associated with these dll,exe files (again knowing your DLL files, is quite important!)
3.3 Adding the Providers
When looking at the WPR example I gave you, you will notice that at the top of the file, I first added all the providers I want to be able to capture
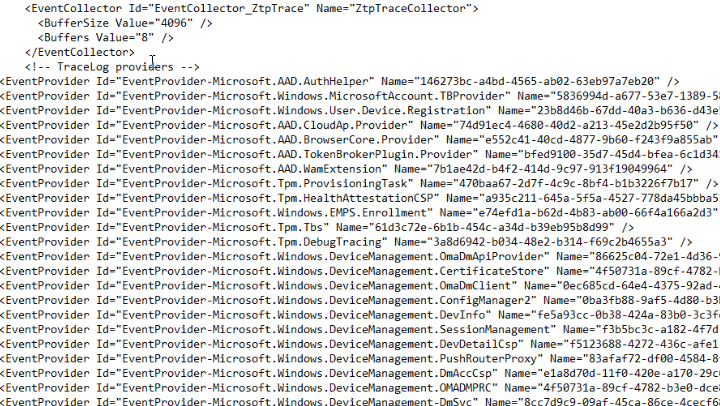
When scrolling down the wpr file, we notice a smaller subset of providers. In this section, I am configuring the providers I want to capture.

In the first few lines of this section, I also configured the detail level to verbose. I guess it’s obvious that I want to capture every single detail. With the detail setting configured, I configured the providers I wanted to capture.
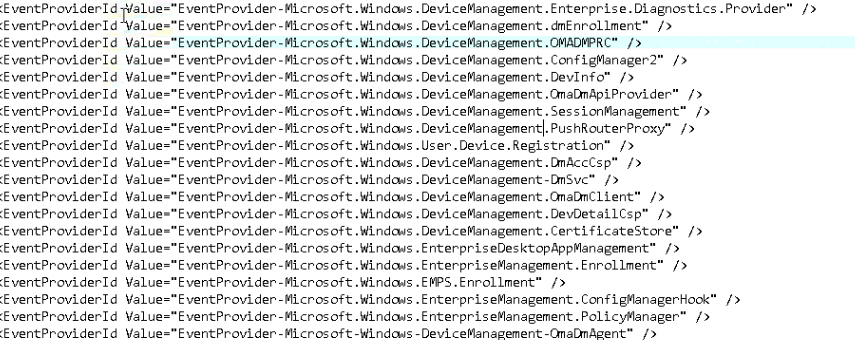
This section needs to be changed depending on what you want to be able to capture. If you need trace logging to troubleshoot some Autopilot errors, you definitely want to add some others.
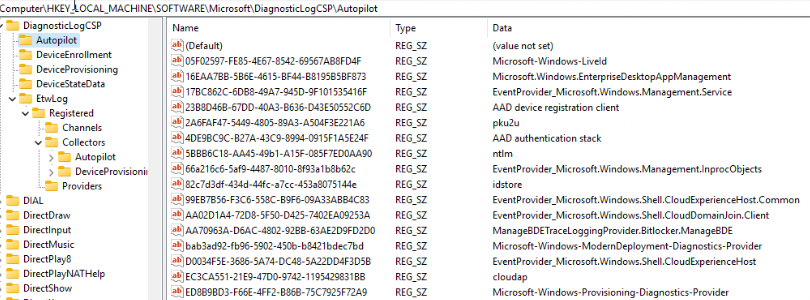
You can find them by querying the DiagnosticLogCSP. This one holds all the event providers Microsoft cares about AKA All the Windows Autopilot event logs.
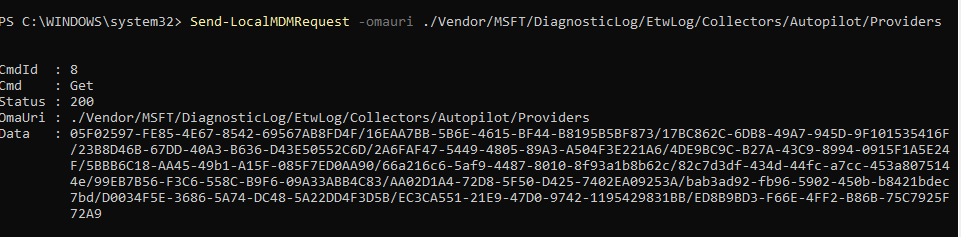
The corresponding data can be found in the registry. Which makes it easier to find the attached name
So, we configured a WPR configuration file. With the WPR file we were able to kick off the wpr trace by using wpr -start configfile.wpr
Once we know that we have reproduced the error, we could stop the trace with wpr -stop logfile.etl
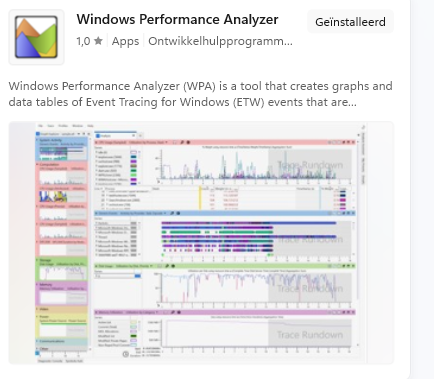
Now, it’s time to examine the etl file. We could use the Onetrace tool or the WPA tool to open it. I am going to use the WPA tool. Open the Microsoft Store and search for Windows Performance Analyzer (yeah, it’s in the store… isn’t that great?).

Install the tool and double-click the ETL file.
Once we opened the etl file, this is what we would get…
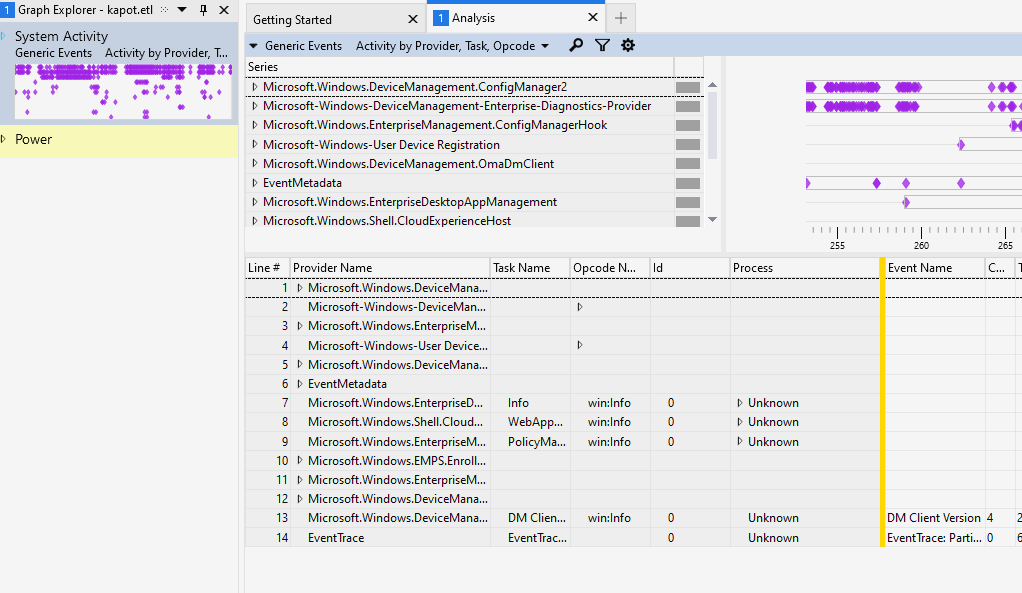
As shown above, all the providers we configured are displayed, and we could expand the provider to find out more. Make sure you project the time as the date. Enabling this functionality makes getting the specific time when it breaks is much easier.
Now, let’s zoom in to the ETL file we got to find out what’s happening. This time, it’s just an easy example, but to point out why using the WPA tool could help you pinpoint the issue.
5. The ETL file
After opening the ETL file, I noticed a lot of essential event providers. I know it is an enrollment issue… so I start with looking at the windows.emps.enrollment

Why? As mentioned earlier, it’s all about knowing the dll files and which provider belongs to them. Finding the proper event providers and getting used to the WPA tool will take some time.
If we look a bit closer to the ETL file we just opened, It’s good to know that when clicking on such a field, the name above changes to the proper name.
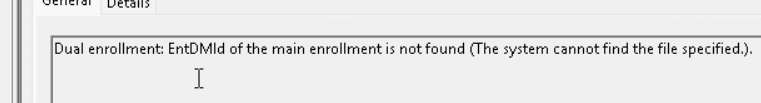
When looking back at the EMPS.Enrollment, and what that particular field shows me, we will notice that the enrollment gave the 0x80004003 error.
Besides this first error, it also showed me the timestamp… A timestamp makes things much easier because I know the exact time it broke. Most of the time, it is all about combining information. Only relying on WPA could sometimes be difficult, but when combining that same information with Procmon makes it way easier to spot something.

The funny thing about this issue is that Microsoft updated its logging capabilities so that the etl trace and the event log now mention the issue!
The WPA tool showed me where I needed to focus and which time frame was important. That
Please read this blog to learn more about my deep dive into the Config Refresh bug that broke everything that needed the Enterprise Device ID.
Config Refresh Bug | Failed to Enroll | EmmDeviceID | Intune (call4cloud.nl)
6. IDA
Cool, right? We spotted the issue, but how could we step it up a notch to come up with a workaround or hand over our findings to Microsoft?
With the WPA tool, we could spot which functions the process uses. Knowing the function name makes understanding what is going in the flow easier.
If I open the dmenrollengine.dll (file responsible for enrollments) with the IDA tool and do a quick search, we will notice the “Logenrolldualdenrollmententdmidnotfound” being mentioned.
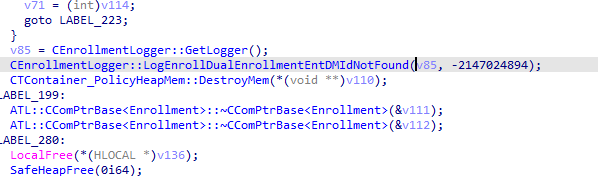
This logger is part of a bigger function. To be precise, the createenrollmessage function. This function is responsible for creating the enrollment message (with details of the device) that will be sent out to the service.
The funny thing is that if you use the graphical view, you can double-click on the green line above the function. This would lead you to the function responsible for fetching the EnrollmentID
That function can also be opened and looked at… and again, down the rabbit hole we go. But I am going to save you that trip. I only wanted to make my point about how the WPA tool is very good at telling you what is going on!
Conclusion
The WPA tool can be handy if you want to know what’s happening during your Enrollment and start troubleshooting. It doesn’t mean that only using the WPA tool and the traces could always tell you what’s going on. BUTTTT if you have the same ETL file from a working enrollment and could compare it with a broken one…. It could give you insights into what is breaking your enrollment and, more importantly, at which step and time stamp!
Want to read more? read my latest blogs here!
by: ,
published: Jul 2, 2013,
updated: Dec 9, 2015, in
In the last five years Xperf has gained popularity as an administrator’s secret weapon for battling all kinds of performance issues. But just when it was on the brink of becoming as mainstream as such a tool can be, Microsoft superseded it by something else: Windows Performance Recorder.
To understand why we need to take a look at the recommended command line for capturing boot traces:
xbootmgr -trace boot -traceflags base+latency+dispatcher -stackwalk profile+cswitch+readythread -notraceflagsinfilename
Hmm, not very intuitive. It turns out Microsoft came to the same conclusion: obtaining traces with Xperf was, at times, very complex. Knowing which providers and stackwalking flags to enable was a struggle all together.
They are right, of course. Selecting the best options for each type of trace is a bit like Alchemy with Xperf. It makes a lot of sense to wrap that into a UI. They did and called it Windows Performance Recorder. It comes as part of the Windows Assessment and Deployment Kit (ADK) for Windows 8, but works on Windows 7 / Server 2008 R2, too. Just as with Xperf and Xperfview there is a separate component for analysing the traces called Windows Performance Analyzer.
The Problem
The problem I was trying to analyze was this: a customer was finding that a laptop, freshly installed with the corporate image, was taking 3.5 minutes to boot to a usable state (by that I mean from the time Windows starts until CPU and hard disk load have dropped so that the system can actually be put to use).
Creating the Trace
I reinstalled Windows on one of the corporate laptops, waited for the full disk encryption to finish and rebooted a few times to give Windows ReadyBoot enough time to do its optimization magic.
Then I prepared the system for WPR by running the following command:
wpr -disablepagingexecutive on
Do not forget to turn it back off when you are done as it can adversely affect performance.
Then I configured the boot trace options in Windows Performance Recorder (wprui.exe):
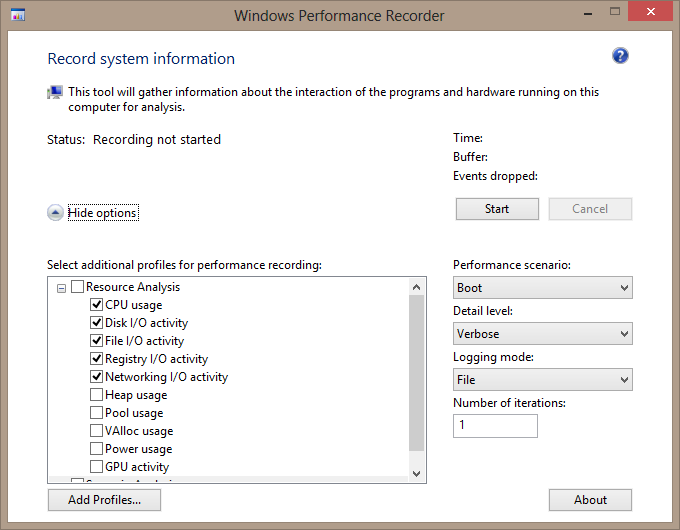
I rebooted to create the trace. Then I ran wprui.exe again to have it stop the trace and save the trace file, which took up a whopping 3 GB on the hard disk.
Analyzing the Trace
When I opened the trace file Windows Performance Analyzer (wpa.exe) displayed CPU, IO and memory loads as well as potential delays in these default graphs:
The storage graph looked most interesting. I took a closer look: by double-clicking the graph it was opened in the main window area:
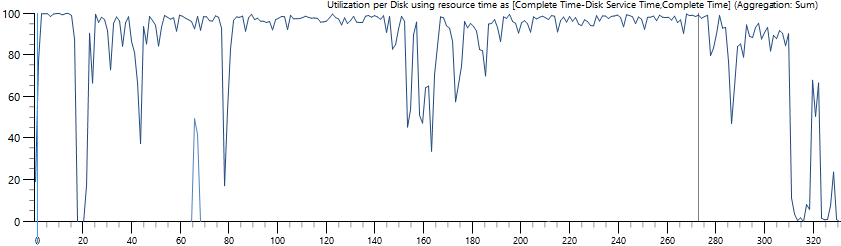
With the disk utilization nearly constantly at 100% it was evident that the hard drive was overloaded. That conclusion was easily confirmed by watching the hard disk LED: during the boot phase it was not flickering, but glowing brightly.
The obvious question was: what was generating all those IOs? To find out I expanded Storage and then Disk Usage, dragged Counts by Process, IO Type to the main window and got this:
It was clear that many different processes contributed to the IO load (each line in the chart represents one process). To confirm this I switched the Disk Usage display mode from graph only to table only and sorted by IO count:
In addition to the system and other OS components we have:
- McAfee antivirus
- various Windows services (notably Offline Files)
- Matrix 42 Empirum (software distribution agent)
- App-V client
- Citrix Receiver
- a component written in-house by the customer
Hypothesis
My hypothesis was this: there was just too much going on for the poor magnetic hard drive. To test it, I replaced the laptop’s disk with an SSD (nothing special, just some boring 160 GB Intel model). Then I reinstalled the machine, performed the same preparatory steps as before and finally measured the boot time: it had dropped from 210 to 50 seconds.
Hypothesis confirmed.
Conclusion, and How to Monitor Boot Times
Windows Performance Recorder & Analyzer are powerful tools for analyzing performance problems. The complexity of creating traces has been reduced a lot compared to Xperf, but the really difficult thing still is the interpretation of the results, of course. If you know how to do that WPR/WPA give you great information about a single system.
Obviously, creating traces with WPR is something you only do when you already know boot time is bad. But how do you find out? Waiting for users to complain is probably not the best technique, you might want to be a bit more proactive.
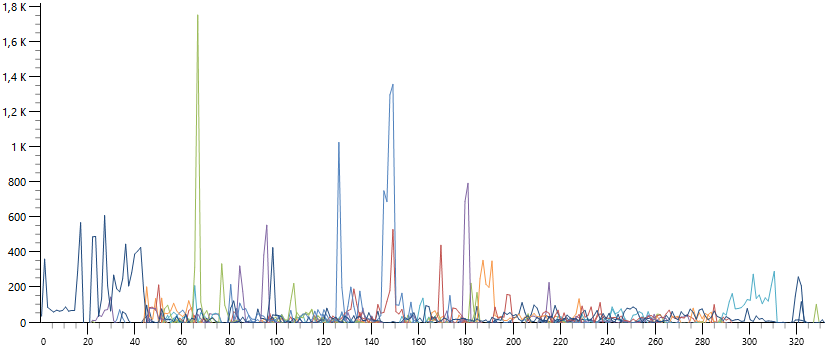
uberAgent for Splunk, our user experience monitoring tool, gives you everything you need to keep boot performance snappy. It reports on boot duration across all machines…
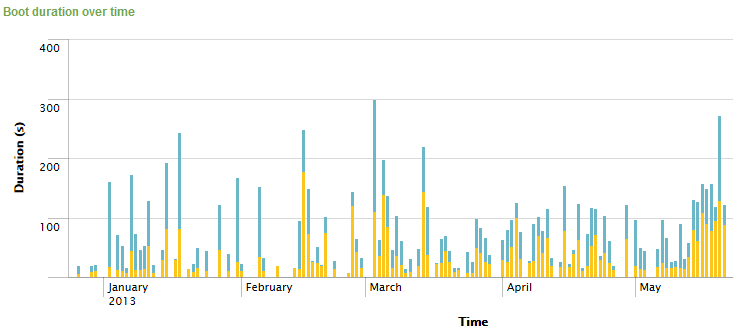
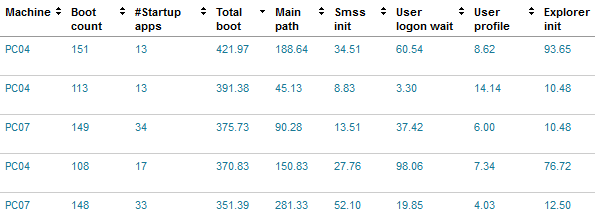
…identifies computers that boot slowly…
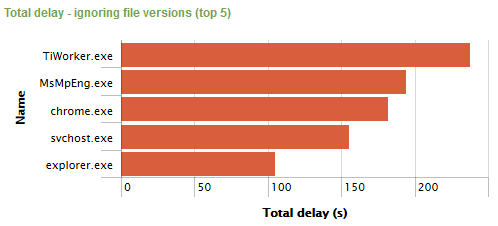
…and even gives you probable causes:
Try it yourself for free!