
Для определения драйверов, программ и служб, из-за которых Windows загружается медленно, нужно включить логирование процесса запуска операционной системы. В этой статье мы рассмотрим, как создать лог загрузки Windows и проанализировать медленные процессы с помощью утилиты Process Monitor.
Системная утилита Process Monitor обычно используется для отслеживания в реальном времени активности запущенных процессов, обращений к файлам и реестру. Также ProcMon позволяет включить логирование всех процессов, которые выполняются при загрузке Windows, получить время выполнения каждого процесса и сохранить лог в файл для дальнейшего анализа.
- Скачайте и распакуйте архив с Process Monitor (http://download.sysinternals.com/files/ProcessMonitor.zip);
- Запустите procmon.exeс правами администратора;
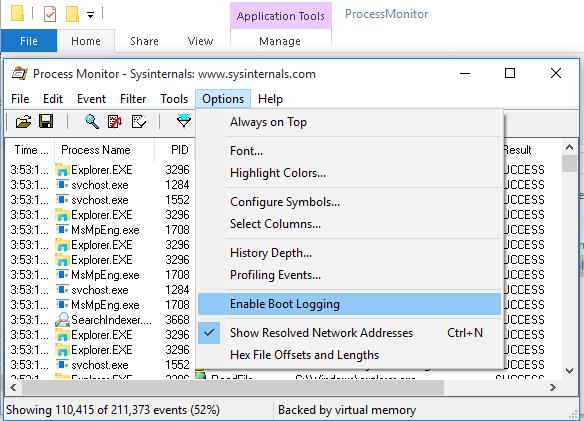
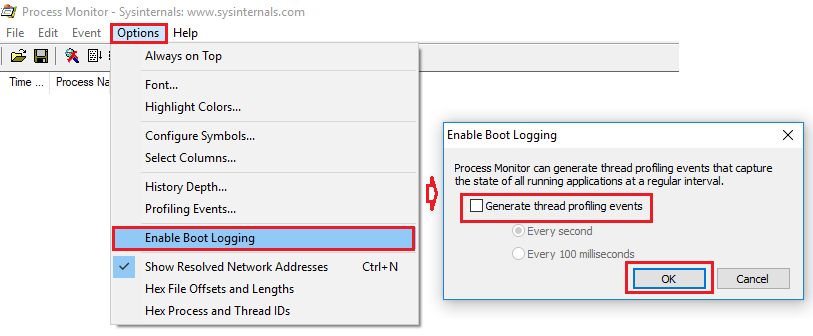
- В меню Options выберите пункт Enable Boot Logging;

- Выберите опцию Generate thread profiling events -> Every second. В этом режиме драйвер procmon будет записывать состояние всех процессов каждую секунду.
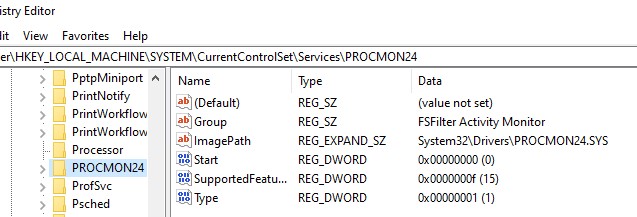
- Сохраните изменения. ProcMon скопирует драйвер procmon23.sys в каталог
%SystemRoot%\System32\Drivers
и создаст отдельную службу (в ветке HKLM\SYSTEM\CurrentControlSet\Services). Эта служба будет запускаться после запуска Winload.exe и будет записывать в лог активность всех процесс, которые выполняются при загрузке Windows и входе пользователя;Чтобы отключить режим протоколирования загрузки, выполните команду:
procmon.exe /noconnect
- Перезагрузите компьютер и дождитесь появления рабочего стола;
- Драйвер procmon23.sys будет писать лог событий до тех пор, пока пользователь вручную не запустит утилиту Process Monitor. После этого режим протоколирования загрузки отключается;
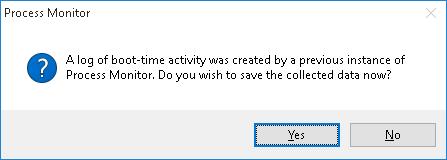
- В окне Process Monitor соглашаемся с предложение сохранить собранные данные в файл bootlog.pml.

Примечание. Если не остановить работу Process Monitor, то временный файл журнала %windir%\procmon.pmb со временем может занять все свободное место на системном диске.
- В моем случае размер файла bootlog.pml около 500 Мб. Откройте этот файл в ProcMon;
- Щелкните по заголовку таблицы в окне ProcMon, выберите Select Columns и включите отображение столбца Duration;
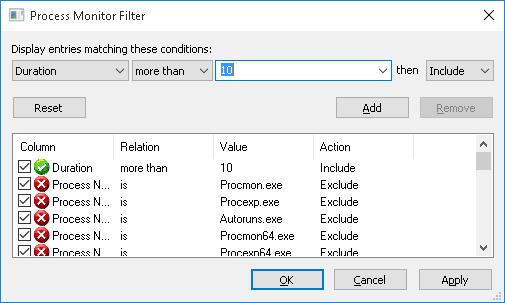
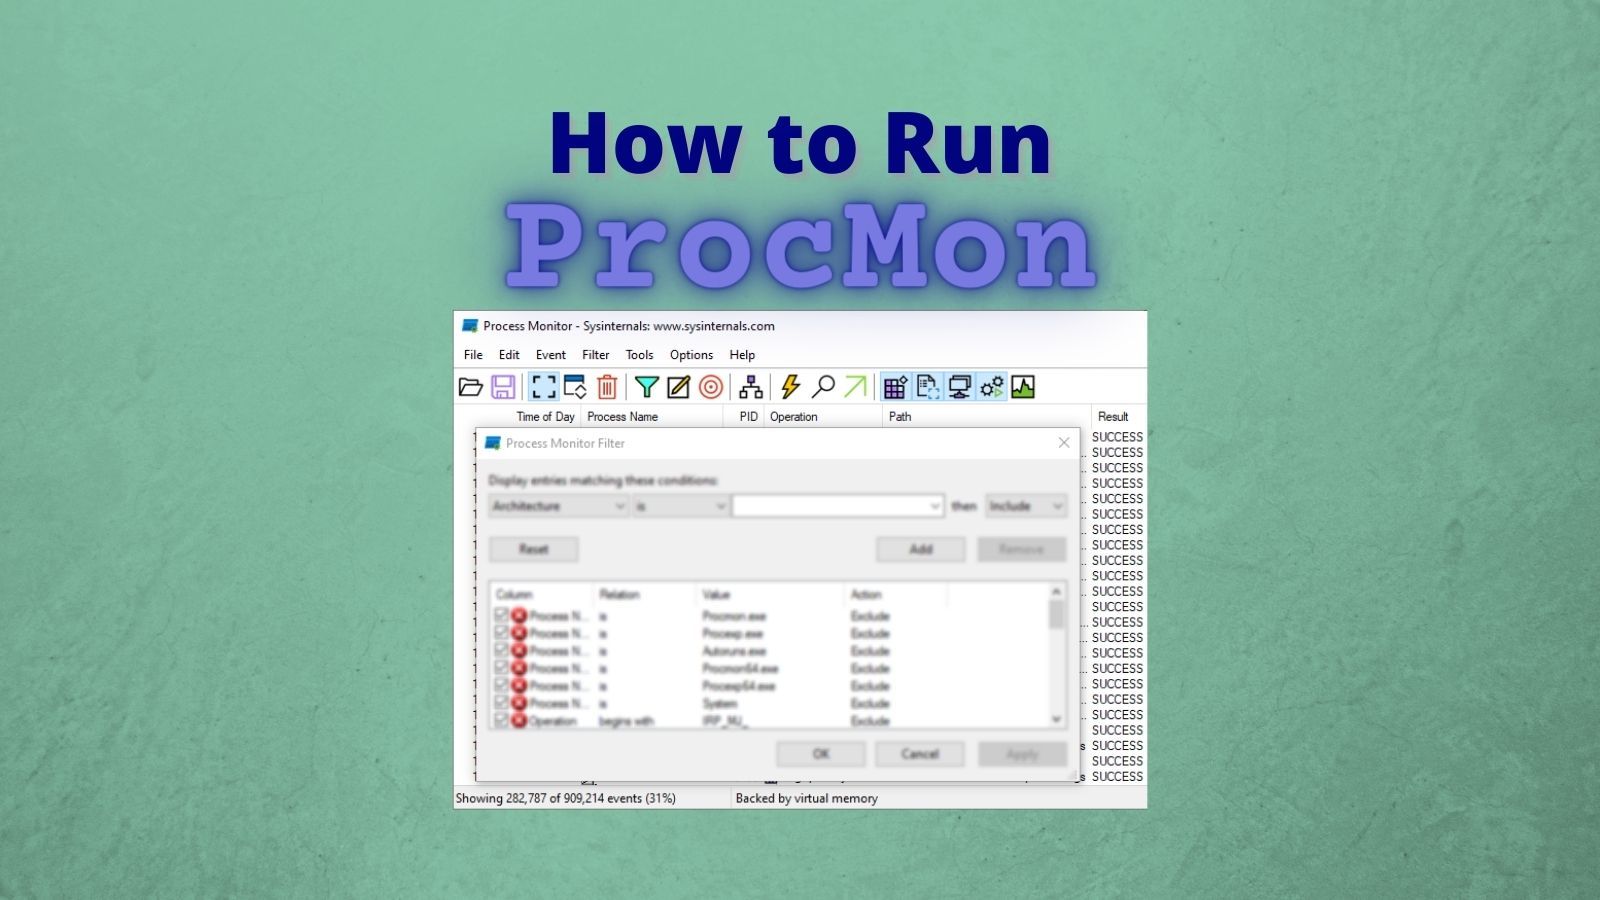
- Теперь нужно изменить параметры фильтрации процессов в меню Filter;
- В качестве параметра фильтрации выберите Duration, условие more than и значение 5. Нажмите Add и ОК.

- В списке процессов останутся только те действия, на которых ушло больше 5секунд (5 секунд я выбрал для наглядности);

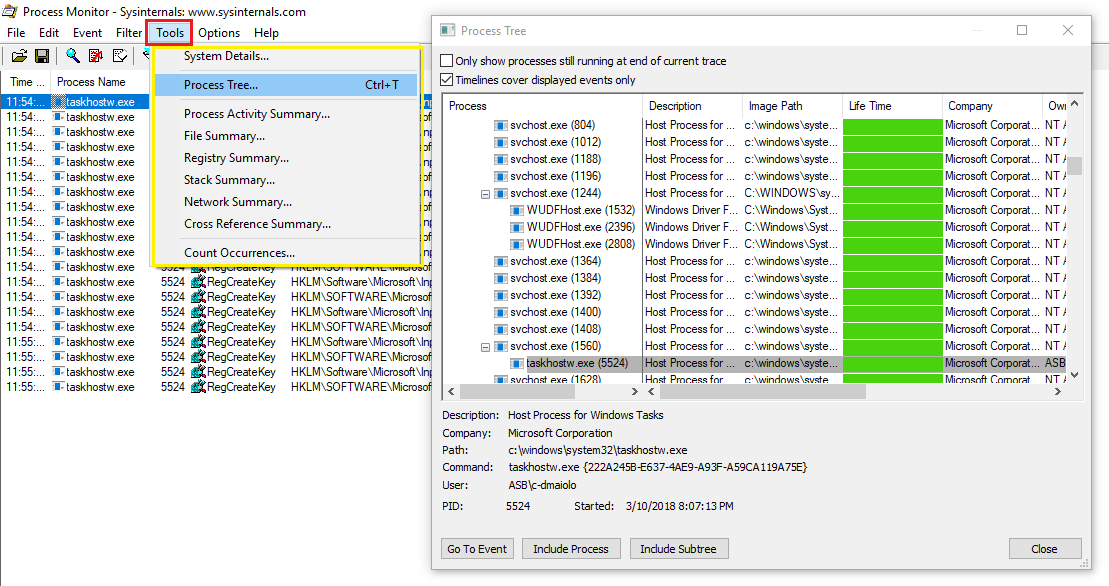
- Также для анализа процесса загрузки можно воспользоваться функцией в меню Tools -> Process Tree, позволяющей отобразить все процессы в виде графического дерева с информацией о начале, завершении и длительности процесса;


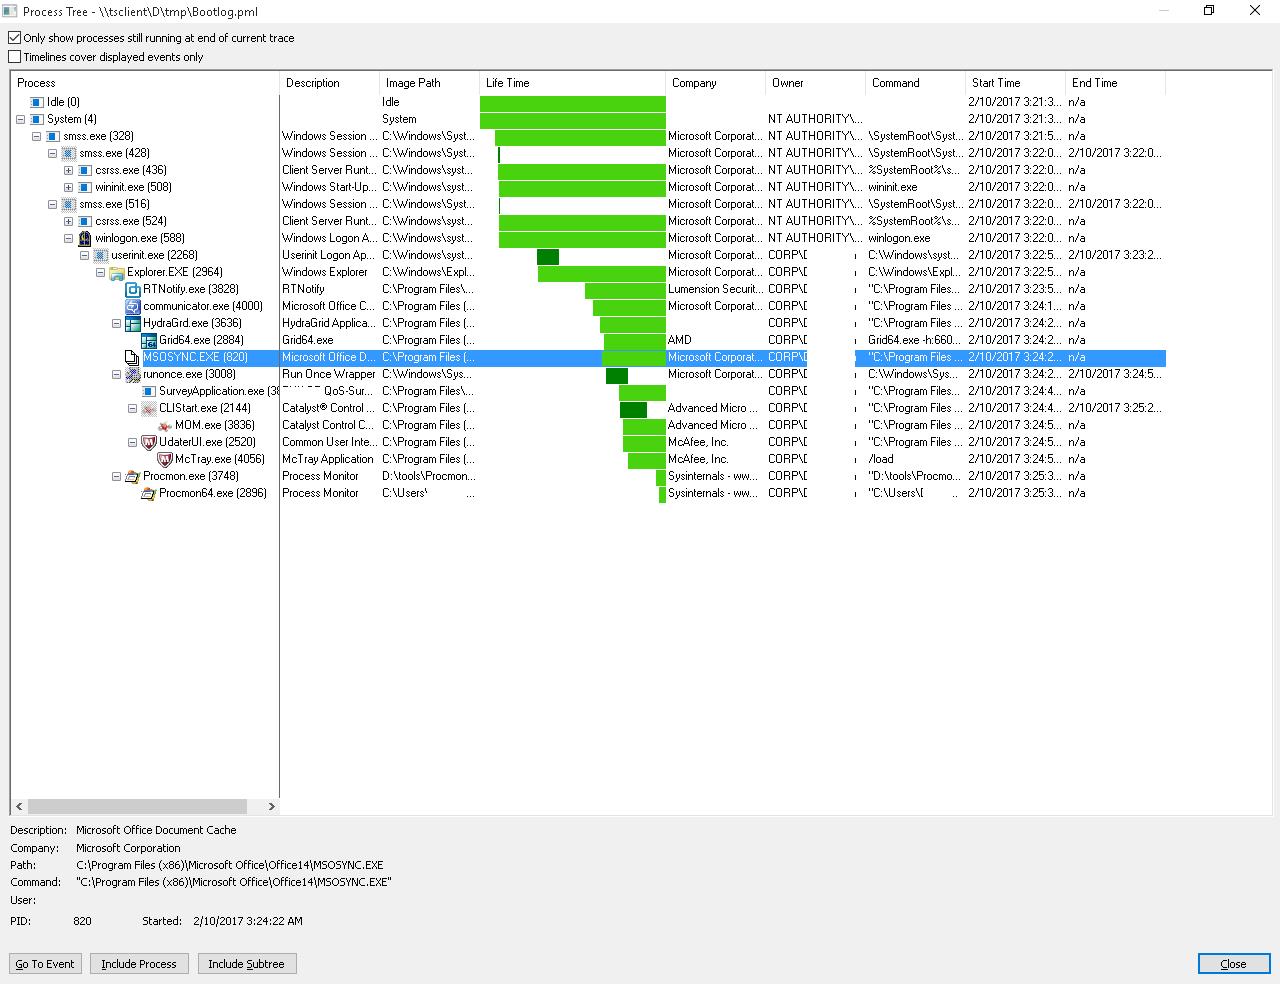
Проанализируйте список процессов при загрузке, соотнесите процессы со службами, программами и драйверами. Чаще всего в этом списке оказываются антивирусы и другое «тяжелое» ПО.
Например, в этом примере при загрузке компьютер был запущен процесс обновления браузера Edge, который занял почти 4 минуты.
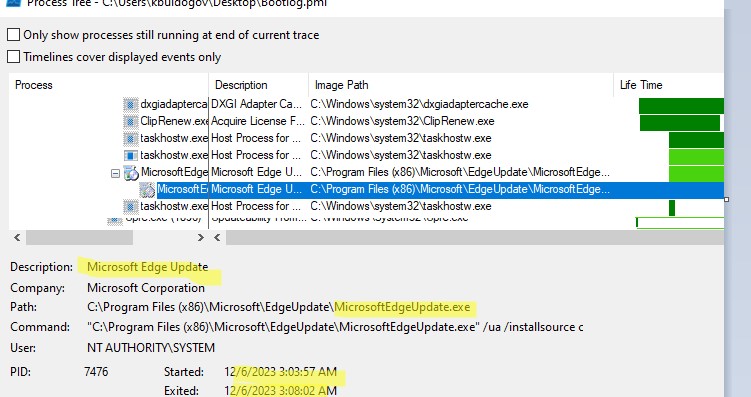
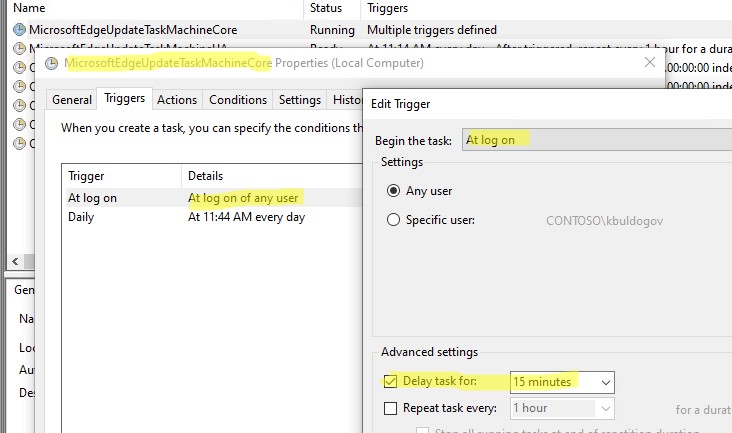
Обновление Edge выполняется отдельным заданием планировщика MicrosoftEdgeUpdateTaskMachineCore, которое выполняется при входе каждого пользователя. Если эта проблема возникает часто, можно отложить выполнение задания, добавив задержку в его расписание.
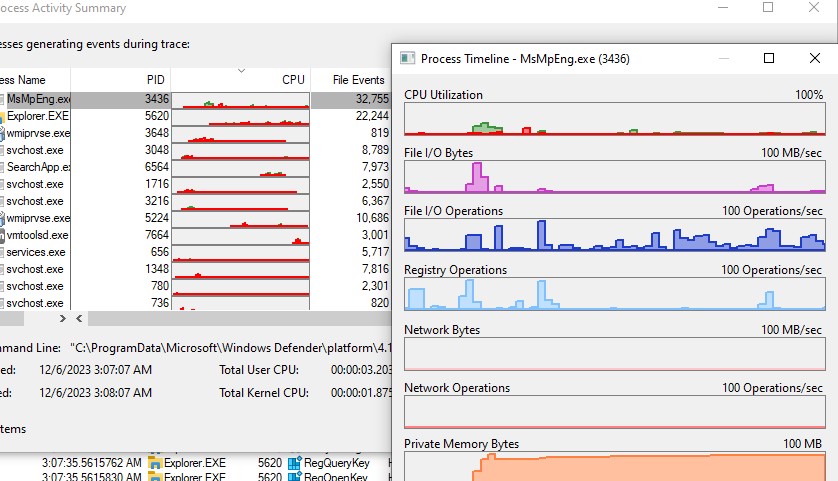
Также вы можете получить информацию об использовании CPU, RAM и дисков процессами при загрузке. Для этого выберите в меню ProcMon опцию Process Activity Summary.
Здесь вы можете отсортировать процессы и найти наиболее прожорливые процессы, которые используют много процессорного времени или памяти при загрузке.
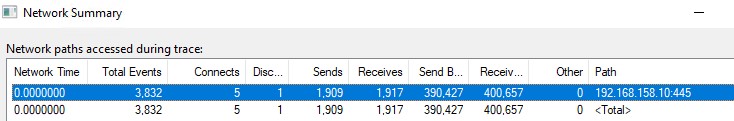
С помощью Network Summary можно отследить медленные сетевые обращения и процессы, которые загружают/отправляют по сети большие порции данных при загрузке Windows. Например, на скриншоте видно, что при запуске компьютеру пришлось получить около 0.5 Мб данных с контроллера домена.
Выполните анализ всех процессов, которые тормозят загрузку Windows (в первую очередь нужно анализировать дочерние процессы Winlogon.exe). На основании полученной информации нужно выполните оптимизацию системы: удалить/обновить проблемные программы или драйвера, отключить некоторые службы или изменить тип их запуска (отложенный запуск или ручной по запросу), убрать программы из автозагрузки и т.д.
A surprising number of thorny Access performance issues can be resolved with this venerable tool. Here’s how to get started with Process Monitor.
• 5 min read
My favorite low-level debugging tool is Process Monitor (aka, procmon). It’s a part of the Sysinternals Utilities suite written by Mark Russinovich.
Getting Started
If you’ve never used Process Monitor before, it can be very overwhelming at first. To get started, I recommend watching one or more videos from Mark Russinovich himself.
Mark’s Webcasts are a series of 75-minute presentations from 2010 through 2015. The structure of all six talks is the same, but the examples he uses are different each time.
I scanned through the Process Monitor portion of each talk to save you from having to watch seven and a half hours of video.
To get the best bang for your buck, I recommend you watch Mark’s 2015 talk. The section on Process Monitor starts at the 31:30 mark.
Running Process Monitor
One nice thing about the Sysinternals Utilities is that they do not need to be installed. Everything you need is packed into a tiny little .exe file.
There are at least three ways to install Process Monitor. All three options support downloading the entire Sysinternals suite of utilities or a standalone copy of Process Monitor.
Traditional download site
The official download site for the Sysinternals utilities is here: https://docs.microsoft.com/en-us/sysinternals/downloads/
Chocolatey
I mentioned the chocolatey Windows package manager in a previous article.
Here’s the command to install the standalone Process Monitor utility:
choco install procmonHere’s the command to install the entire Sysinternals suite (this is what I use):
choco install sysinternalsSysinternals Live
I just learned about this option while putting together this article.
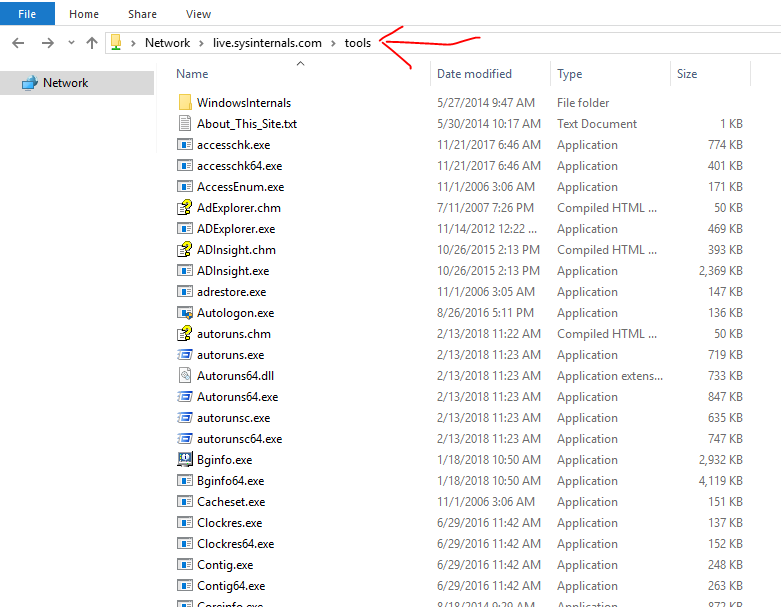
Sysinternals Live is a service that enables you to execute Sysinternals tools directly from the Web without hunting for and manually downloading them. Simply enter a tool’s Sysinternals Live path into Windows Explorer or a command prompt as live.sysinternals.com/<toolname> or \\live.sysinternals.com\tools\<toolname>.
You can view the entire Sysinternals Live tools directory in a browser at https://live.sysinternals.com/.
This sounded so cool I had to try it for myself.
Via File Explorer
Honestly, I was more than a little underwhelmed when I ran it from File Explorer. It amounted to little more than an easy to remember URL.
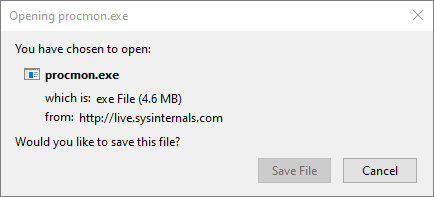
The usual web browser dialog box asking to save or run the executable popped up.
I typed the following into the File Explorer address bar:
live.sysinternals.com/procmon.exe
When I pressed enter, Windows simply downloaded the file via my default web browser (currently Firefox):
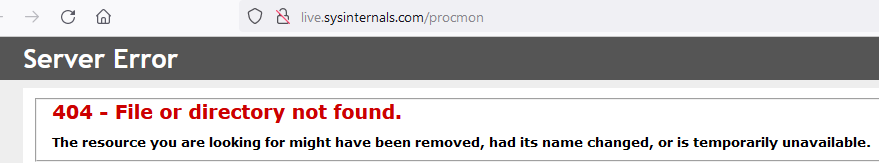
The URL is case-insensitive, but I got a 404 file not found error if I left off the «.exe» extension:
The File Explorer integration was nice, but it was nothing special.
Via Cmd Window
OK, now this really was cool. I opened a non-admin cmd window and entered several commands to open a series of Sysinternals utilities:
- Process Monitor:
\\live.sysinternals.com\tools\procmon - Process Explorer:
\\live.sysinternals.com\tools\procexp - Autoruns:
\\live.sysinternals.com\tools\autoruns - RAMMap:
\\live.sysinternals.com\tools\rammap - Handle:
\\live.sysinternals.com\tools\handle {locked file name}
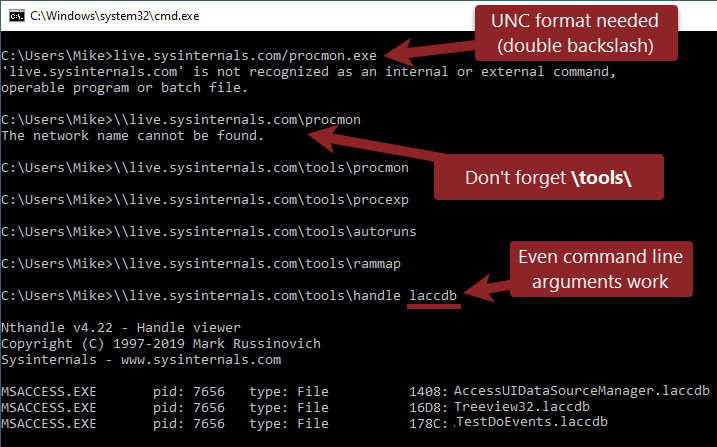
Some quick notes about the cmd window usage:
- You need the leading double backslashes (not used with File Explorer).
- You need the tools folder (optional with File Explorer).
- You can pass command line arguments to tools that accept them, like the Handle utility.
External links
Windows Sysinternals — Windows Sysinternals
Library, learning resources, downloads, support, and community. Evaluate and find out how to install, deploy, and maintain Windows with Sysinternals utilities.
Microsoft Docsmarkruss
Mark’s Webcasts — Windows Sysinternals
Mark’s webcasts
Microsoft Docsmarkruss
The Case of the Unexplained: Windows Troubleshooting
Database Migrations could range from a very easy migration project to lengthy cross platform migrations. Many times, DBAs and Database…
Channel 9Mark Russinovich
Sysinternals Utilities — Windows Sysinternals
Evaluate and find out how to install, deploy, and maintain Windows with Sysinternals utilities.
Microsoft Docsmarkruss
Chocolatey — The package manager for Windows
Chocolatey is software management automation for Windows that wraps installers, executables, zips, and scripts into compiled packages. Chocolatey integrates w/SCCM, Puppet, Chef, etc. Chocolatey is trusted by businesses to manage software deployments.
Chocolatey Software

Sysinternals Utilities
Process Monitor — Windows Sysinternals
Monitor file system, Registry, process, thread and DLL activity in real-time.
Microsoft Docsmarkruss
Process Explorer — Windows Sysinternals
Find out what files, registry keys and other objects processes have open, which DLLs they have loaded, and more.
Microsoft Docsmarkruss
Autoruns for Windows — Windows Sysinternals
See what programs are configured to startup automatically when your system boots and you login.
Microsoft Docsmarkruss
RAMMap — Windows Sysinternals
An advanced physical memory usage analysis utility that presents usage information in different ways on its several different tabs.
Microsoft Docsmarkruss
Handle — Windows Sysinternals
This handy command-line utility will show you what files are open by which processes, and much more.
Microsoft Docsmarkruss
Referenced articles
My Favorite Things
Here is a list of my favorite utilities, add-ins, OCX controls, and applications that I use when developing Microsoft Access applications.
No Longer SetMike Wolfe

UPDATE [2023-07-31]: Fix broken link to Mark Russinovich’s 2015 video.
In this tutorial, I provide an overview of Process Monitor (ProcMon), a powerful Windows monitoring tool. I explain how to start and filter ProcMon, find changed values, enable boot logging, and run ProcMon against a remote machine. I created this tutorial to practice key concepts for my upcoming interview for the Senior Solutions Architect position at Microsoft. By mastering ProcMon and other tools in the Windows Sysinternals suite, I was able to showcase my troubleshooting and diagnostic skills to the Microsoft hiring team.
Process Monitor (ProcMon) Overview
Process Monitor is a monitoring tool for Windows that shows live file, Registry and process/thread activity. It is a combination of two older Sysinternals utilities, Filemon and Regmon.
Process Monitor is a part of Windows Sysinternals which is a set of utilities to manage, diagnose, troubleshoot, and monitor Windows. Sysinternals was originally created in 1996 by Winternals Software and was started by Bryce Cogswell and Mark Russinovich. Microsoft acquired Winternals on July 18, 2006, which included Sysinternals and the utilities within it.
The set of tools is now available on any Windows computer by opening \\live.sysinternals.com\tools\ in file explorer. This UNC path is a service provided by Microsoft and is referred to as Sysinternals Live.
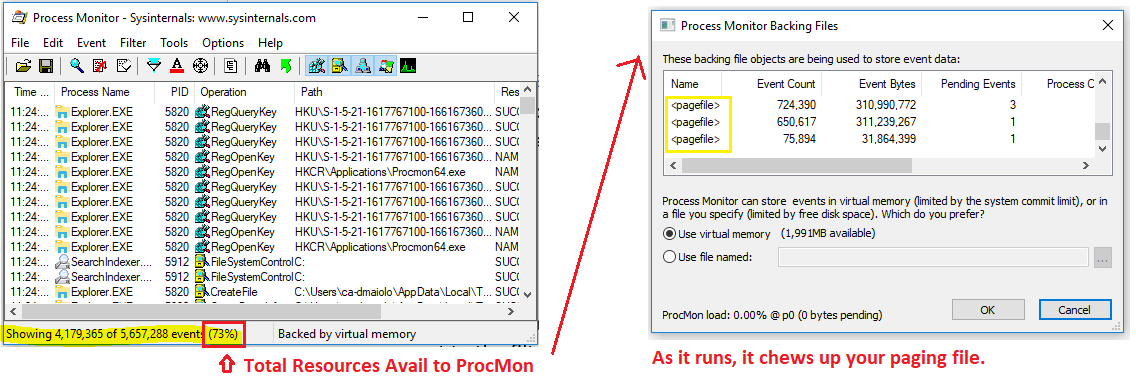
Starting Process Monitor
You must run ProcMon.exe from an elevated command prompt, so that it opens in administrative mode as it needs to install Filter Drivers. As soon as you start it, it will begin capturing, and quite quickly will start taking space from your paging file. Therefore, only run it for the necessary time as leaving it running will likely cause your computer to crash unless you run it to Drop Filtered Events against a certain filter. More on this under Filter Process Monitor
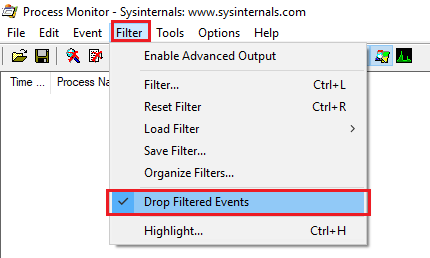
Filtering with Process Monitor
ProcMon can be run for days if you chose to have it filter for a certain type of event. Start by selecting Filter -> Drop Filtered Events.
Choosing this option means that only what is filtered will be saved to the log file, as opposed to only filtering will filter what you see, but will log all to the log file. Now, filter to only view processes where the result is Access Denied by opening Filter -> Filter:
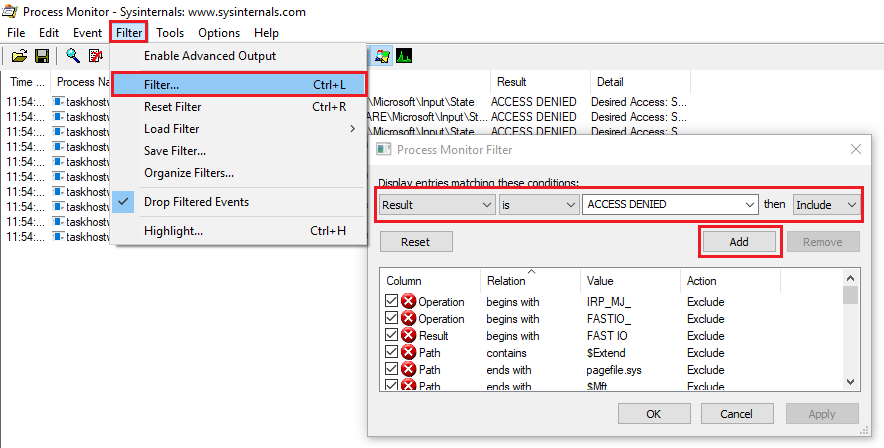
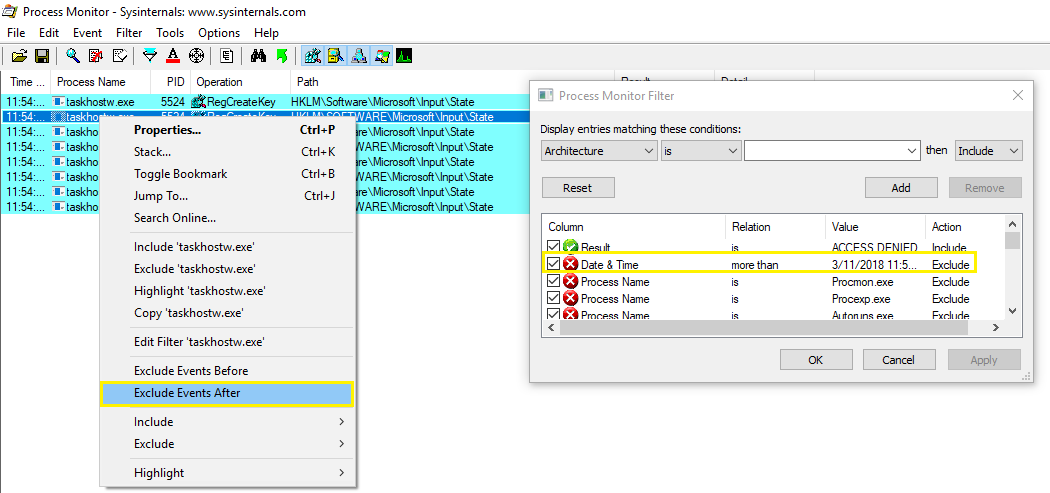
You can also filter right from the main console by selecting a Process, right clickign and choosing one of the filtering options. For example, if we choose to Exclude Events After this event, we can also see that it automatically creates a filter for this choice which we can choose to remove later.
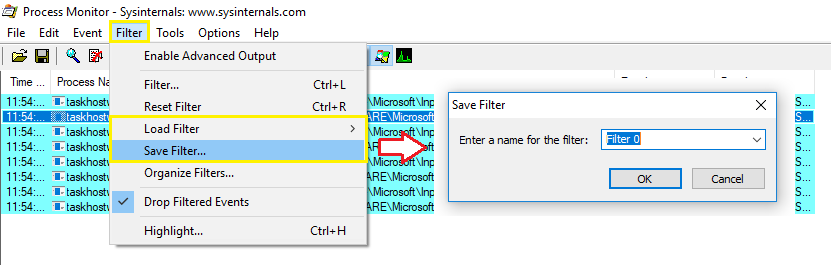
Once you have a specific filter set that might be useful for a certain troubleshooting task, you can choose to Save or Load the filters under the Filter menu:
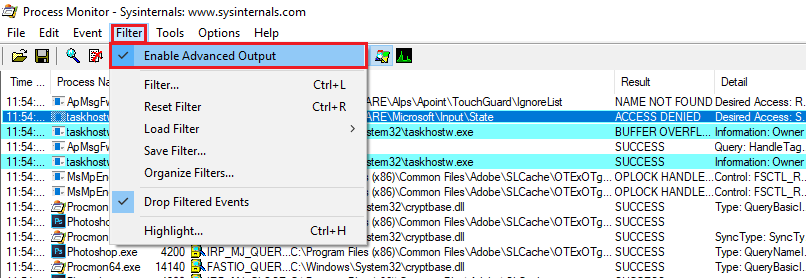
Advanced Filtering with Process Monitor
In some instances, you may want to view all events, including those by default that are filtered out of ProcMon. You could opt to manually remove all of the built in filters, but an easier way to do this is to simply select Filter -> Enabled Advanced Output
How to Find Changed Values
Some people will use ProcMon to try and see what changes a process makes, but it can become daunting. An easier method is to try and utilize ProcMon in a way where you can filter for events happening. Let’s say for example we want to see what registry values are set when we disable Automatic Restart on system failure. To do this, first stop and clear the trace, then filter ProcMon to only show RegSetValue Operations:
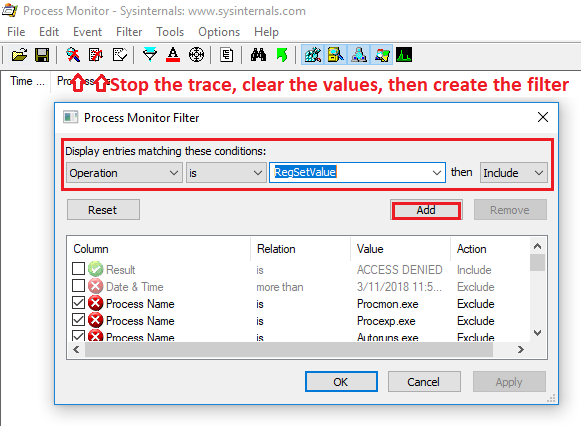
Now, begin the capture and make the desired change:
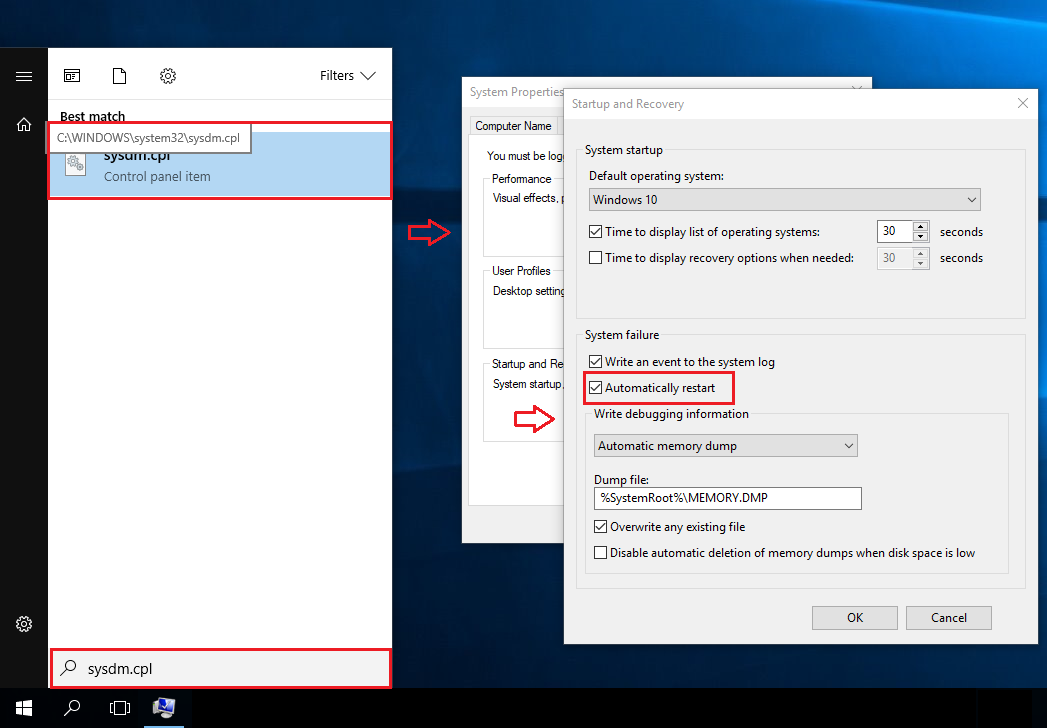
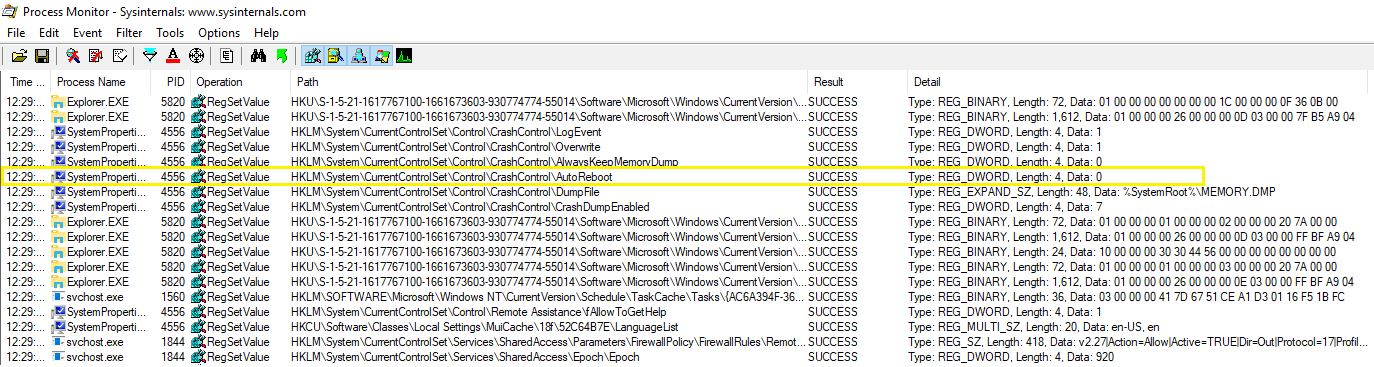
Stop the capture once the change has been made. Now, we can easily see the registry value change that was required to make this change:
Enable Boot Logging
A very useful feature of process monitor is to trace events during logoff, shutdown, startup and login. There is a special feature to do this ProcMon to do this under the Options menu. Select Enable Boot Logging and then reboot your system. The next time you open ProcMon, you’ll be prompted to save the boot log events to a file.
ProcMon Tools: Process Tree
ProcMon has several tools available by selecting Tools from the menu. For example the Process Tree shows you the processes lifetime and how long they lived during the trace.
Running ProcMon against a Remote Machine
Utilizing psexec, 23 can run ProcMon against a remote machine if we do not or cannot be at a remote site for monitoring.
To start the trace on a remote computer run:
Psexec \\ /s /d procmon.exe /accepteula /quiet /backingfile c:\hostname_trace.pml
Now, to stop the trace on the remote computer run:
Psexec \\ /s /d procmon.exe /accepteula /terminate
Finally, copy the log file to your remote machine for viewing:
xcopy \\\c$\hostname_trace.pml c:\TEMP
You can then view the log file in ProcMon locally by running:
Procmon /openlog c:\temp\hostname_trace.pml
ProcMon Filter Drivers
If ProcMon has some issue connecting to the filter driver and gets stuck opening, you can run it to not connect to the filter driver:
Procmon /noconnection
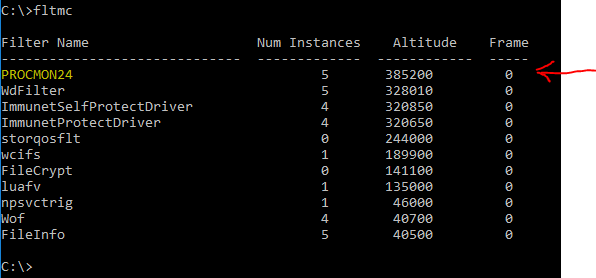
To view the filter driver that is associated to Procmon, run
fltmc
Introduction
This is a Part 1 to my Series How to use Process Monitor.
Sometimes when you are troubleshooting an issue on windows, you want to look into things like when the process created, who created the process and what is the stack with which the process is running. To look into these things we use a Sysinternals tool named ProcMon (Process Monitor).
Now in this article, I will only be covering the very basics of the Process Monitor tool, I will be posting few more articles on this topic just so that we can have a clear understanding of the software and its functioning.
Location to download:
You can download the tool from https://docs.microsoft.com/en-us/sysinternals/downloads/procmon
Once you have downloaded it you can just open the Exe file
Once you will open it, you are going will be flooded with a lot of information. Now all this information is nothing but processes and threads that are running on your system. Now you will think that we have a task manager who does the same thing “Show Processes”.
But there is a Big Difference in a way these two tools shows the running processes. One is a tool which is made for a user, however, the other tool is made for experts as there is a lot you can do with this tool which you cannot do with Task Manager.
Once you have the tool in front, you need to look for the row with options like below:
This is very important for you to have a good understanding of some of the options that are placed here.
Capture: If you Capture icon looks like the one below. This means that the ProcMon (Process Monitor) is currently running and is capturing all the information.
If you capture Icon looks like the one below, it means that you have paused the capture.
This is sometimes that you can use it while you want to capture a process for a certain period and don’t want your logs to get clouded with garbage. You can start a Task and just before starting it you can click the capture icon to start the capture and once the task finished you can just stop it.
Clear: If you want to clear the captured information you can just click the button below:
Filter: This is a Filter Icon. This is the most important option that we have in this tool and you will be needing it a lot while working on it. I will be explaining this tool in a moment.
Highlight: This option can be used to highlight certain rows. It’s very important when you are working on tracking a service/thread from this Tool:
Show Process tree: We can use this option to display the hierarchy of the process and how it was initiated along with all the processes that are involved in starting the service.
Find: You can search for anything specific like Process ID or Name. You can also use the good old CTRL+F to open the search window.
Saving your captured File.
Now the ProcMon (Process Monitor) by default runs from the Memory. I.e. It captures the information and saves it in the Page File, which contains the Page table and the Pages which requires to be shuffled in and out of Physical memory.
You can save this file easily by going into File > Save:

Now you can either save all the entries that you have captured or you can only capture the filtered content.

It can also get an option of saving this file as CSV which is very very important as you can easily open it in Microsoft Excel and use it for reporting.
Once selected you can just save it to the desired location:

Running this tool under this mode is fine if you are running it for 5 or 10 minutes. However if you are going anyway beyond 10, 15 minutes. This tool might take all you Pagefile memory and cause hang or your Application/System.
So for issues where you need to run this tool for a longer duration, you can follow the below steps and save the logs on a file, which you can save on any storage where we have enough space.
Select File > Backing Files…
This should look something like this:

If you will see by default its using the Virtual Memory, which is your Pagefile.
You can change by selecting Use File named:
And give it the location on any storage:
If you noticed this file is going as a .PML Format file.

Now some people might be thinking that what if I want to assign a specific size to this file and I don’t want it to grow beyond that.
Well, we have an option for your right here. After you selected the file as a Backing File, you can go to the option below:
Options > History Depth…

Here you can specify the Number of Events you want to capture:
Now don’t be shocked, but you specify the Number of Events in Millions. Yes! Millions

This is how powerful this tool is and how confusing it can be if you don’t know the right ways to capture what you want.
I think this should be it for the First Article on this tool, We will be continuing studying this tool in our next pages as well.
If you want to learn more about some very interesting tools and application: follow the link: https://knowitlikepro.com/category/tools-and-software/
Вы тут: Главная → Popular → Как с помощью Process Monitor или аудита отследить приложение, изменяющее параметры реестра
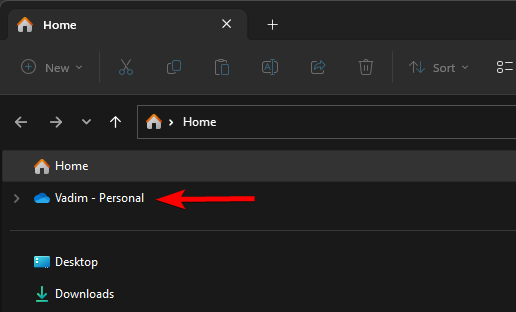
Это сиквел статьи про отслеживание приложения, записывающего непонятные файлы на диск. На этот раз у меня вверху области навигации проводника появились значки Home и OneDrive. Это началось после установки накопительного обновления для Windows 11 22H2, добавившего вкладки к проводнику.
[+] Сегодня в программе
Проблема: нежелательный значок OneDrive
Значок Home я решил не трогать, а OneDrive мне там не нужен. Потому что у меня и так уже закреплены конкретные облачные папки.
Я уже рассказывал в канале Telegram, как убирать значки или менять их порядок. Поэтому от значка OneDrive я избавился легко. Однако спустя несколько дней он появился снова. Я повторно поменял значение параметра System.IsPinnedToNameSpaceTree с 1 на 0, но вскоре значок опять вернулся. Стало понятно, что это не случайность, а решение разработчиков. Но каких?
Строго говоря, OneDrive – стороннее ПО для Windows. Хотя он внедрен в систему, и есть интеграция в оболочку. Новый значок Home вверху – точно от команды проводника. Наверное, OneDrive сам прикрепляет свой значок. Но зачем гадать, когда можно выяснить доподлинно!
Способы мониторинга изменений в реестре
Я покажу два способа, каждый со своими плюсами и минусами:
- Process Monitor – просто, но не очень хорошо подходит для длительного мониторинга. Например, все время потребляются ресурсы ЦП. Кроме того, надо перезапускать отслеживание после перезагрузки ОС.
- Аудит реестра – мощно, хорошо масштабируется, но сложнее настраивается и недоступно в домашних изданиях.
Отслеживание записи в реестр с Process Monitor
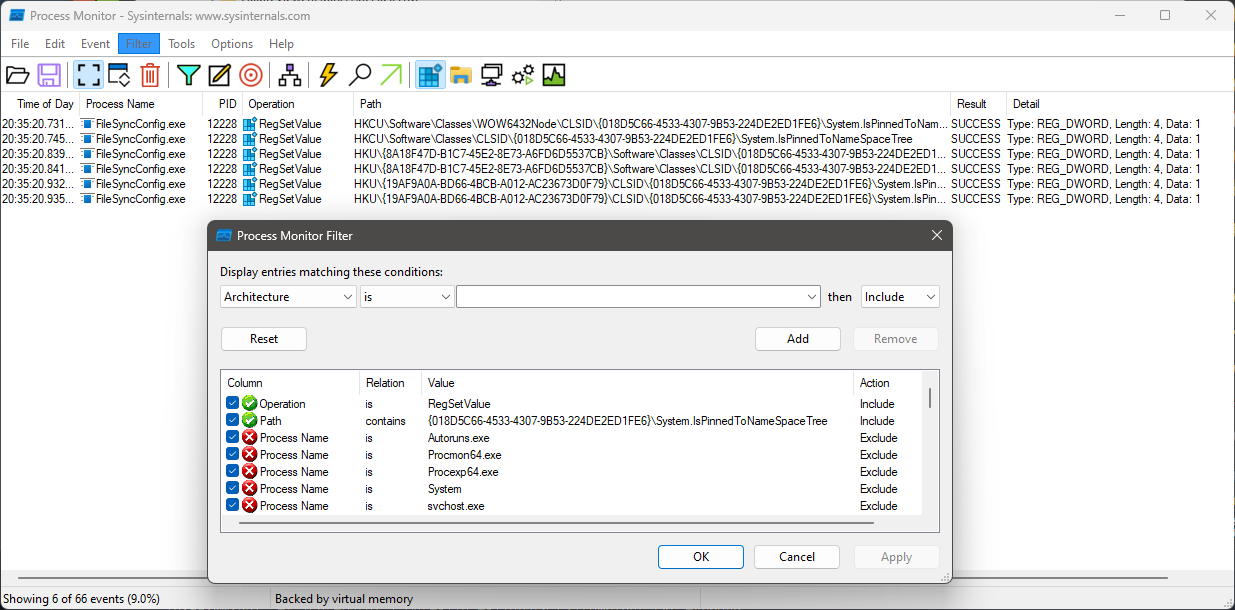
Нужно всего два фильтра:
Здесь
- Path contains
{018D5C66-4533-4307-9B53-224DE2ED1FE6}\System.IsPinnedToNameSpaceTree– путь содержит конечную часть пути к разделу реестра и сам параметр - Operation is RegSetValue – операция, задающая значение параметра в реестре
В меню Filter выберите Drop filtered events, чтобы не собирать ненужные события. Иначе за несколько дней ожидания память может закончиться.
Процесс FileSyncConfig.exe попался в расставленные сети в начале второй недели мониторинга.
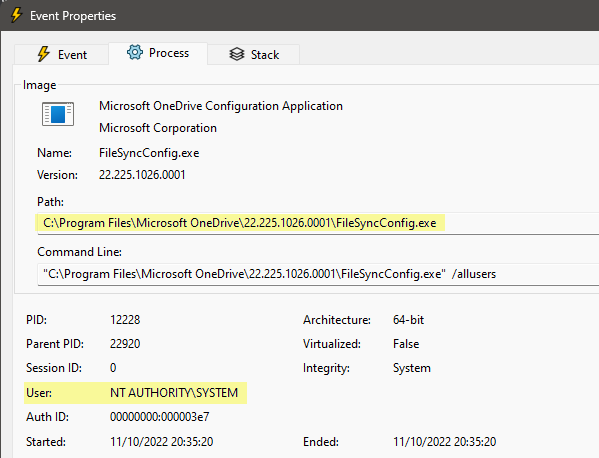
Получается, этот исполняемый файл конфигурирует не только OneDrive, но и проводник. Но как выяснилось, FileSyncConfig — не единственный игрок! Я исключил его из уравнения, но значок снова вернулся.
Гонять Process Monitor неделями было нецелесообразно, поэтому я настроил аудит изменений в реестре.
Отслеживание записи в реестр с помощью аудита
Поскольку мы отслеживаем разовое изменение всего одного параметра, с точки зрения производительности на длинной дистанции рациональнее включить аудит реестра.
Эта политика безопасности доступна в изданиях Pro и выше.
Задача решается в три шага.
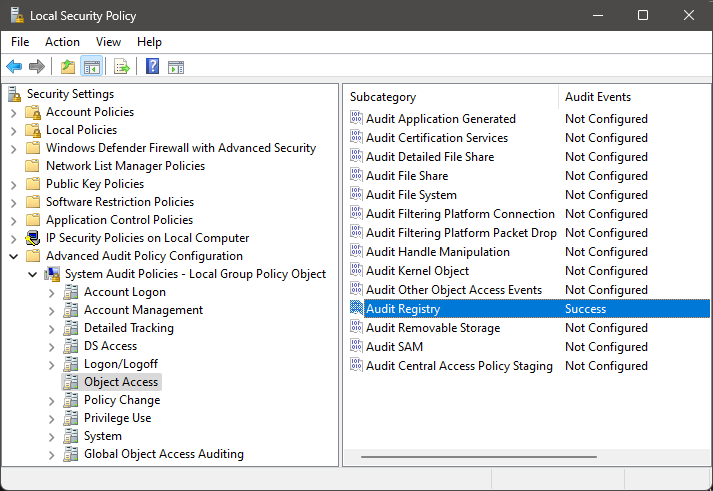
Шаг 1 – Включите политику аудита объектов реестра
- Откройте Win + R – secpol.msc – Advanced audit policy configuration – System audit policies – Object access.
- Для политики Audit Registry включите аудит событий успеха (Success).
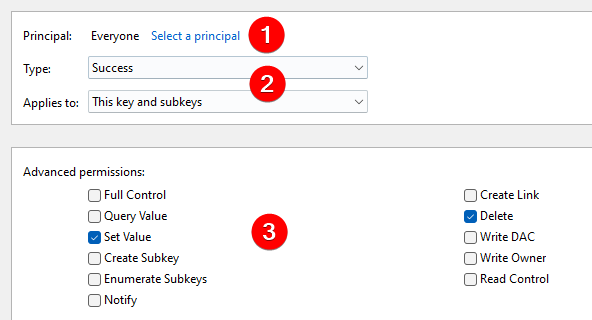
Шаг 2 – Настройте аудит конкретного раздела реестра
В реестре перейдите к разделу, щелкните ПКМ – Permissions – Advanced — Auditing. Далее:
- Выберите субъект Everyone в английской ОС или Все в русской.
- Убедитесь что указаны события успеха для раздела и подразделов.
- Выберите Set Value (Задание значения). (На картинке также отслеживается удаление, т.к. это один из способов обнулить заданное значение).
Шаг 3 – Найдите событие 4657 в журнале безопасности Windows
- Для теста поменяйте значение параметра в разделе, для которого настроили аудит.
- Откройте Win + R — eventvwr.msc – Security (Безопасность) и найдите событие 4657.
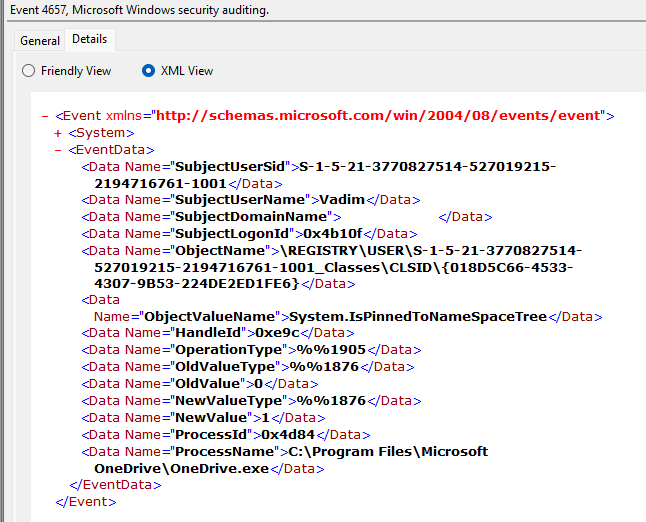
Видно, что в сети аудита на сей раз попался другой процесс — OneDrive.exe!
Бонус: скрипт PowerShell для анализа событий аудита
Чтобы не открывать журнал, я набросал скрипт PowerShell (скачать audit-script.zip и разблокировать!) для извлечения ключевых данных из событий аудита реестра и процессов. Этот скрипт несложно приспособить для обработки любых данных из узла EventData на картинке↑ Заметьте, что в PowerShell Core можно ускорить фильтрацию — в данном случае по имени параметра реестра, которое аудит пишет в журнал.
В скрипте используется синтаксис XPath для поиска и вывода конкретных элементов XML. Я применял этот прием еще для анализа события 100 в утилите CheckBootSpeed, однако не демонстрировал его в блоге. Выглядит непривлекательно, но работает безотказно.
Код скрипта не публикую на странице из-за некорректного отображения в блоге. Ниже фрагмент вывода скрипта с выборкой восьми элементов события, представляющих интерес.
EventTime       : 2022-12-05T22:08:33.3566298Z
SubjectUserName : Vadim
SubjectUserSid  : S-1-5-21-3770827514-527019215-2194716761-1001
ObjectName      : \REGISTRY\USER\S-1-5-21-3770827514-527019215-2194716761-1001_Classes\CLSID\{018D5C66-4533-4307-9B53-224D
                  E2ED1FE6}
ObjectValueName : System.IsPinnedToNameSpaceTree
NewValue        : 1
OldValue        : 0
ProcessName     : C:\Program Files\Microsoft OneDrive\OneDrive.exe
Заключение
Мониторинг реестра – несложная задача. Аудит звучит по-взрослому, но по большому счету тоже тыкание в кнопки. В любом случае – это сбор сведений, которые еще нужно проанализировать для решения задачи.
В следующей статье я разберу, почему параметр реестра меняют разные процессы. Я также объясню, как воспрепятствовать закреплению значка OneDrive в панели навигации. На Boosty статья уже доступна подписчикам и посредством разовой оплаты! Вы можете 🤝стать постоянным подписчиком и получить ранний доступ ко всем новым статьям блога.