
Все способы:
- Способ 1: Меню «Пуск»
- Способ 2: Диалоговое окно «Выполнить»
- Способ 3: «Диспетчер задач»
- Способ 4: «Проводник»
- Способ 5: «Панель управления»
- Способ 6: «Командная строка»
- Вопросы и ответы: 0
Способ 1: Меню «Пуск»
Самый простой способ открыть «Монитор ресурсов» в Windows 10 – это использовать поиск в «Пуске». Достаточно вызвать это меню, затем начать вводить запрос «Монитор ресурсов». В процессе набора отобразится совпадение, которое и выберите.
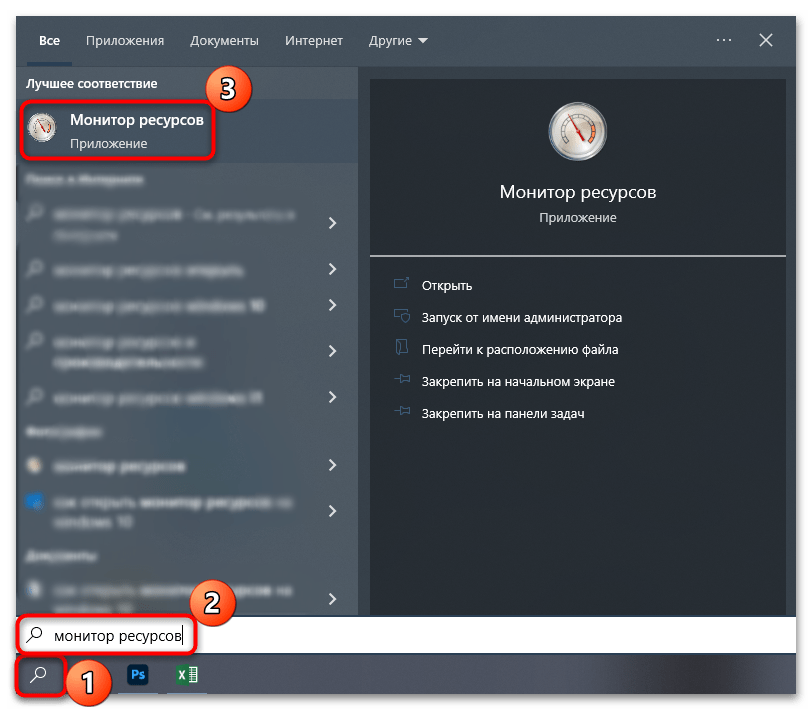
Когда надо запустить средство с расширенными правами, в окне справа выберите пункт «Запуск от имени администратора».
Все средства администрирования располагаются в соответствующем разделе главного меню. Найти «Монитор ресурсов» там не слишком сложно — достаточно нажать на кнопку «Пуск» на нижней рабочей панели, отобразить «Все приложения», затем отыскать папку «Средства администрирования Windows» и развернуть ее. Появится список инструментов, где есть и искомый.
Способ 2: Диалоговое окно «Выполнить»
Открытие «Монитора ресурсов» доступно и через диалоговое окно «Выполнить». Для этого нужно знать специальную команду, которая запускает окно встроенного средства.
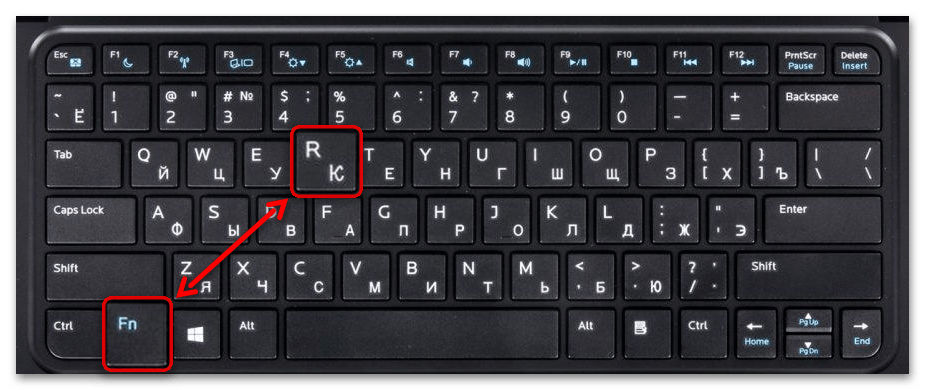
- Одновременно зажмите клавиши «Win + R».
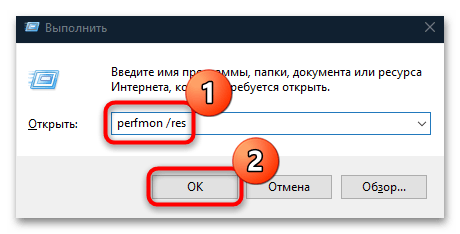
- Появится окно «Выполнить» — в строку «Открыть» вставьте команду
perfmon /resи нажмите на клавишу «Enter».
Также можно использовать и команду resmon.exe, аналогичным образом прописав ее в строке окна «Выполнить». Эту же команду можно написать и в «Пуске», вместо названия приложения.
Способ 3: «Диспетчер задач»
Перейти в «Монитор ресурсов» в Windows 10 можно напрямую из интерфейса «Диспетчера задач», представляющего собой информационную утилиту, которая визуализирует сведения о работающих службах и процессах, а также потреблении ресурсов, производительности и другой информации.
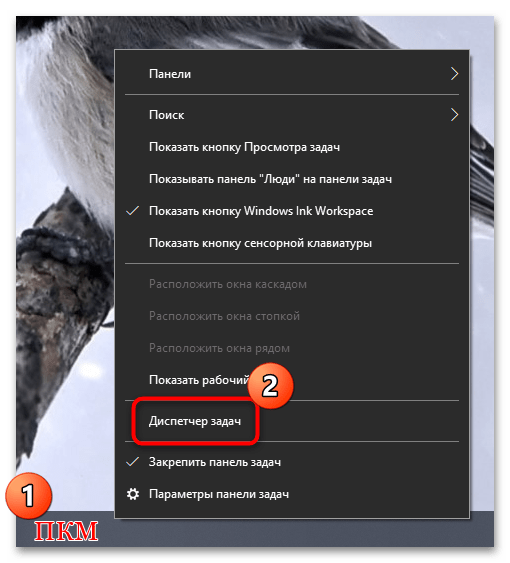
- Кликните по рабочей панели правой кнопкой мыши и из меню выберите пункт «Диспетчер задач».
- Перейдите на вкладку «Производительность» и кликните по ссылке «Открыть монитор ресурсов», расположенной внизу.
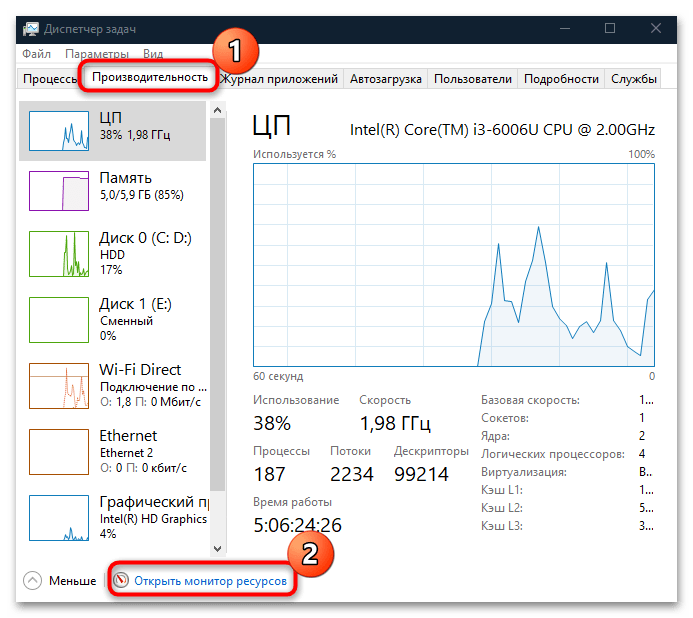
Если «Диспетчер задач» изначально открылся в свернутом виде, нажмите на кнопку «Подробнее», чтобы отобразились все вкладки утилиты.
Читайте также: Методы запуска «Диспетчера задач» в Windows 10
Способ 4: «Проводник»
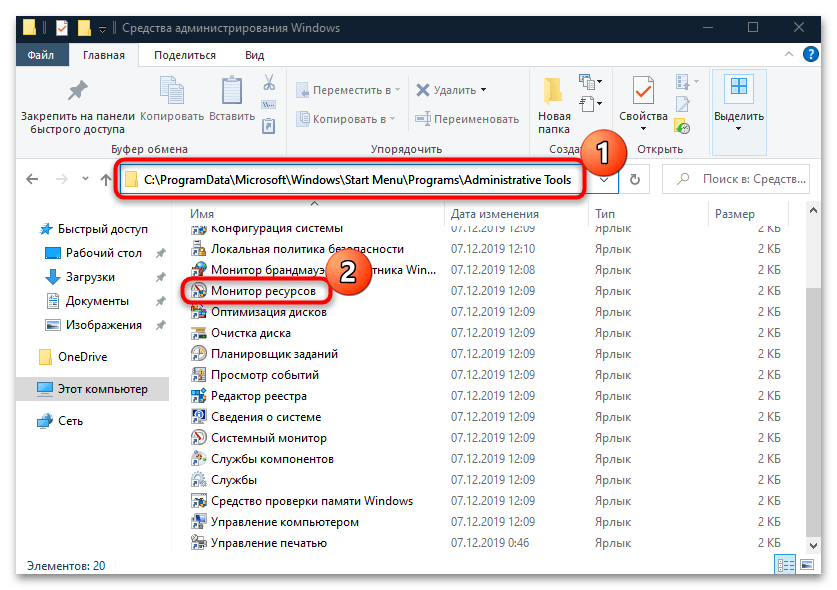
Исполняемые файлы сторонних и встроенных средств Windows 10, а также некоторых их ярлыков располагаются в папках на локальных дисках. Системные средства – в разделе, на котором установлена система, чаще всего это «Локальный диск (C:)». Средства администрирования, в том числе «Монитор ресурсов» — не исключение.
Запустите «Проводник», вставьте в адресную строку путь C:\ProgramData\Microsoft\Windows\Start Menu\Programs\Administrative Tools и нажмите клавишу «Enter». Отобразится список ярлыков средств администрирования, где отыщите «Монитор ресурсов» и запустите его двойным нажатием левой кнопкой мыши.
Способ 5: «Панель управления»
Следующий способ открыть «Монитор ресурсов» на Windows 10 – это «Панель управления», в которой собраны средства настройки операционной системы. Через ее интерфейс можно совершить быстрый переход в папку, которая была рассмотрена в предыдущем способе.
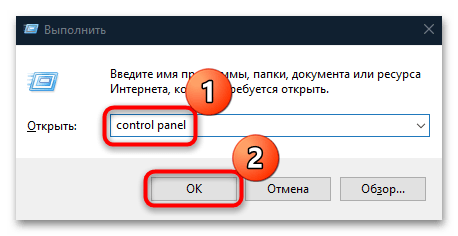
- Вызовите диалоговое окно «Выполнить» с помощью сочетания клавиш «Win + R». В строке напишите
control panelи кликните по «ОК». - Вверху разверните меню «Просмотр», чтобы выбрать формат отображения и задайте крупные или мелкие значки. В появившемся перечне щелкните по разделу «Администрирование».
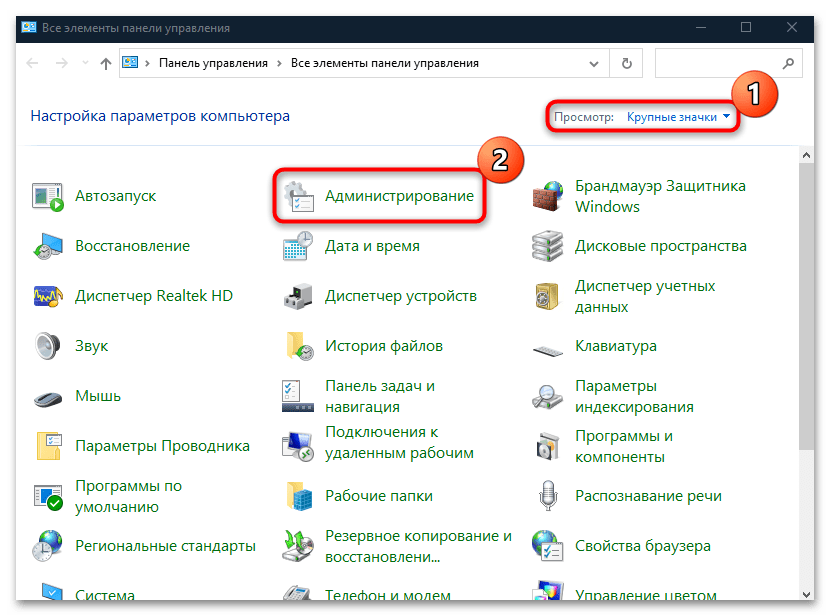
После выбора раздела откроется окно «Проводника» с инструментами Windows 10. Найдите «Монитор ресурсов» и запустите его.
Читайте также: Открытие «Панели управления» на компьютере с Windows 10
Способ 6: «Командная строка»
Если ни один способ не подошел (например, в работе «Проводника» или рабочей панели произошли системные ошибки), можете воспользоваться функциями консоли «Командная строка», через которую доступен запуск приложений и различных штатных средств. Чтобы открыть «Монитор ресурсов» таким образом, нужно знать только команду:
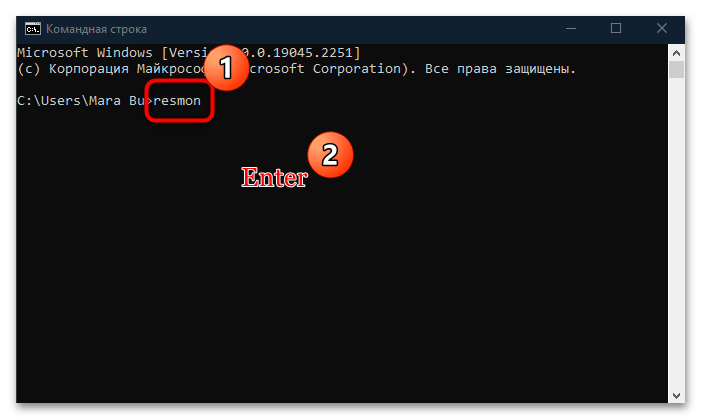
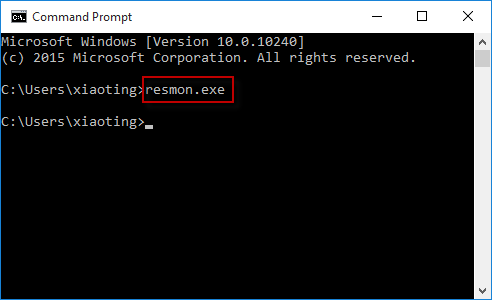
- Откройте «Командную строку», отыскав ее в «Пуске» по названию.
- В строку введите
resmonи нажмите на клавишу «Enter» для подтверждения.

Если вы запускаете консоль от имени администратора, то и все средства, открытые через нее, будут с расширенными правами.
После этого отобразится окно «Монитор ресурсов». В Windows 10 вместо «Командной строки» также можно использовать и аналогичную консоль – Windows PowerShell, где принцип запуска утилиты такой же.
Читайте также: Открытие «Командной строки» в Windows 10
Наша группа в TelegramПолезные советы и помощь
The Resource Monitor is a useful utility built in Windows, which allows you to check information about the use of hardware (CPU, memory, disk, and network) and software resource on your computer. If you wonder how to open the Resource Monitor in Windows 10, you can follow any of the six ways introduced in this page.
Way 1: by Cortana search
Start typing resource monitor in the search box on the left side of the taskbar, so the Resource Monitor will appear in the search results. In fact, when you finish typing resource in the search box, the Resource Monitor would appear. Click on the Resource Monitor to open it.
Way 2: using the Run command
First, bring up the Run dialog in Windows 10 using the Win + R on your keyboard. Next, type resmon.exe in the plain text field, and then click OK. This will run the Resource Monitor immediately.
Tips: This way won’t work for you if the Run dialog in your Windows 10 is disabled.
Way 3: from Start menu
First, bring up the Start menu, and then click All apps. In the All apps list, scroll down to look for the ”Windows Administrative Tools” folder, and then click this folder to expand it, if found. Continue to scroll down to look for the Resource Monitor, and then click it, once found, to open it.
Tips: This way won’t work for you if the All apps list is removed from your Start menu.
Way 4: from Task Manager
Step 1: Open the Task Manager.
Step 2: In the Task Manager window, select the Performance tab, so you can see an ”Open Resource Monitor” button at the bottom. Click this button to open the Resource Monitor.
Way 5: using Command Prompt or Windows PowerShell
Step 1: Open a Command Prompt window, or open a Windows PowerShell window.
Step 2: Type in resmon.exe, and then hit Enter key.
Way 6: from Performance Monitor
After you open the Performance Monitor, select the Performance at the top of the left-side panel, so you can see an ”Open Resource Monitor” button in the right-side pane. You can click this button to open the Resource Monitor.
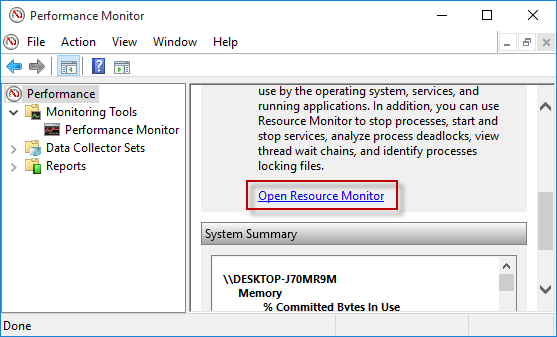
Table of contents
- Why Use Resource Monitor on Windows 10?
- How to Open the Resource Monitor on Windows 10
- The Start Menu
- The Run dialog box
- The Command Prompt
- Windows PowerShell
- Explaining the Resource Monitor’s Interface
- The Overview Tab
- CPU
- Disk
- Network
- Memory
- Studying CPU Usage in the Resource Monitor
- Analyzing System Memory Usage
- Checking Disk Usage
- The Network Tab
- The Start Menu
- Conclusion
Microsoft is very open about its dedication to making Windows 10 the best performing operating system. While numerous updates have yielded positive results, system slow-downs are still a thing. You can do many things on your end to boost your computer’s performance, and one of them involves checking the processes that consume your system’s resources and killing them off.
Windows has many built-in resources that you can use to review resource usage. The Task Manager is probably the most well-known. It shows how individual processes use system resources and allows system administrators to kill whichever they choose to end. Almost everyone, including novices, knows how to use the Task Manager. The legendary CTRL + ALT + DEL shortcut is engraved into the memory of nearly every Windows user as the go-to combination whenever their OS hangs.
However, utilities such as the Performance Monitor and Resource Monitor can offer you more information about CPU, disk, memory, and network usage. The Resource Monitor is the best utility for analyzing and investigating performance issues concisely and simply. We’ll show you how to use the program to study your system’s resource usage.
Why Use Resource Monitor on Windows 10?
Indeed, the Task Manager gives you an overview of how individual processes use your system’s resources. However, the Resource Monitor allows you to go in-depth to get information that the Task Manager can’t display. You can also use the tool to find out how programs have been using your resources over time.
How to Open the Resource Monitor on Windows 10
There are several ways to open the Resource Monitor on Windows 10. We’ll walk you through the different processes, and you can choose the most convenient.
This should be the easiest way to launch the tool. Tap the Windows logo key on your keyboard or click on the Start button in the taskbar. After the Start menu opens, type “resource monitor” or “resmon” (no quotes) and click on the first search result you see.
You can also go to the All Apps category in the Start menu, scroll down to Windows Administrative Tools, expand it, and then click on Resource Monitor.
The Run dialog box
- Right-click the Start button and click Run or press the Windows and R keyboard buttons together.
- Once Run opens, type “resmon” (no quotes) into the text box and click on OK or press the Enter key.
The Command Prompt
- Open the Run dialog box.
- Type “CMD” (no quotes) into the text box and hit Enter.
- After the Command Prompt opens, type “resmon.exe” (no quotes) and then click on OK.
Windows PowerShell
- Right-click on the Start button or tap the Windows and X keyboard buttons together.
- Select Windows PowerShell in the menu that appears.
- After Windows PowerShell opens, type “resmon” (no quotes) and hit Enter.
Explaining the Resource Monitor’s Interface
The Resource Monitor interface looks the same in Windows 10, Windows 8.1, and Windows 7. The window has different tabs that it uses to separate data. They include:
- Overview
- CPU
- Memory
- Disk
- Network
The Resource Monitor window normally opens in a floating window, but you can expand it to full-screen mode. Each tab has subtabs to expand or collapse by clicking on the arrow in its title bar.
The right pane contains graphical representations of each element’s resource usage. You can increase each pane’s size by placing your mouse pointer over the dividers in the middle and dragging it sideways once the arrow appears. For example, if you want to view more graphical data, you have to place your mouse cursor over the navigation bar in the middle and move it to the left.
You can completely hide the graph section (the right pane) by clicking on the arrow at the top of the pane. Use the View drop-down menu at the top of the right pane to change the graphs’ size.
Now let’s look at each tab.
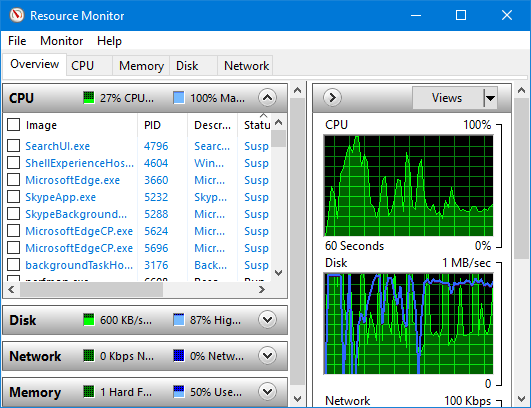
The Overview Tab
This is the first view of the Resource Monitor. It shows a glance at how processes use your system’s resources, just as its name suggests. There are four sections on the Overview page: CPU, Disk, Network, Memory.
The CPU section is expanded by default, while others are collapsed. You can expand or collapse each section by clicking on the arrow in their title bar.
Each section contains information about every process listed under it. Let’s give you a rundown.
CPU
PID: Process ID
Description: Brief background info of the process
Status: If the process is running or not
Threads: How many active CPU threads are being used by the process
CPU: Current percent of CPU resources consumed by the process
Average [Average percent of CPU resources consumed by the process]
Disk
PID: Process ID
File: Name of the file in use by the process
Read (B/sec): How many bytes per second on average have been read from the file at the last minute
Write (B/sec): How many bytes per second on average have been written to the file in the last minute
Total (B/sec): How many bytes per second on average have been written to and read from the file in the last minute
I/O Priority: Priority of I/O transfers
Response Time (ms): Disk response time in milliseconds
Network
PID: Process ID
Address: Address that the process connects to
Send (B/sec): How many bytes per second on average have been sent in the last minute
Receive (B/sec): How many bytes per second on average have been received in the last minute
Total (B/sec): How many bytes per second on average have been sent and received in the last minute
Memory
PID: Process ID
Hard faults: How many hard page faults per seconds on average the process has triggered in the last minute
Commit (KB): Amount of virtual memory in kilobytes that the OS has reserved for the process
Working set (KB): Current amount of physical memory in kilobytes used by the process
Shareable (KB): Current amount of physical memory in kilobytes used by the process that can be shared with other processes
Private (KB): Current amount of physical memory in kilobytes used by the process that cannot be shared with other processes
You can use the CPU section to filter the processes you want to see throughout the Overview tab. For example, if you tick the box beside one process under CPU, that process alone will be displayed in the Network, Memory, and Disk sections. This cannot happen in the Task Manager.
There are graphs in the right pane for each section. They show an overview of CPU, Disk, Memory, and Network activity.
Studying CPU Usage in the Resource Monitor
You need to navigate to the CPU tab if you want to view CPU usage in detail. There are three different sections under the CPU tab:
- The Processes section – This is basically what you’ll see in the CPU section of the Overview tab.
- The Services section – This is a list of running Windows services.
- The Associated Handles section – This lists system resources such as Registry values and system file.
- The Associated modules section — This lists special files such as dynamic link libraries that a process might be using.
You can click on a process in the Processes section to see its link with one or more services, associated handles, and associated modules. The Resource Monitor also allows you to stop and start services. Right-click on a service and choose an option in the context menu.
Analyzing System Memory Usage
The Memory tab lists processes just like you’ll see in the Memory section of the Overview tab. You can right-click on each process to end it, end its tree, suspend and resume it, analyze its wait chain, and search for it online. Under the Processes tab, you’ll see a visual representation of physical memory reserved, amount of memory in use, amount of memory modified, amount of standby memory, and amount of free memory.
The right pane is the graphical representation of used physical memory, commit charge, and hard faults.
Checking Disk Usage
When you switch to the Disk tab, you’ll find the Processes with Disk Activity, Disk Activity, and Storage sections. The Processes section is a list of processes currently using your hard drive. They’re the same as the processes you saw in the Disk section of the Overview tab.
You can check the box for a single process under Processes with Disk Activity to find details of how it uses your hard drive under Disk Activity.
The Storage section shows your hard drives and the available and total space on each drive. It also details the percentage of time the disk is running and its queue length.
The right pane shows graphical representations of the disk and its queue length.
The Network Tab
The Network tab shows Processes with Network Activity, Network Activity, TCP Connections, and Listening Ports.
The Processes with Network Activity section shows you the processes currently using your system internet connection and the data they send out and receive.
The Network Activity section shows you those processes, including their addresses.
The TCP Connections section shows connection details of the processes such as Local Address and Port, Remote Address and Port, Packet Loss, and Latency.
The Listening Ports section shows details of the addresses and ports on which each process is listening, each process’ protocol, and each process’ status.
Conclusion
Now you know how to use the Resource Monitor to check how programs are using your system’s resources in more detail.
Expert tip: You won’t have to worry much about your system’s performance if you use Auslogics BoostSpeed. The tool will do the heavy lifting for you by stopping unnecessary processes, removing junk files that might burden your disk and CPU, and safely getting rid of problematic registry keys.
Resource Monitor is a quintessential built-in tool in Windows 10, including its predecessors 8 and 7. A graphical representation of the utilization of resources by your system over a period of time comes into view when you access it. Also known as Resmon, it lets you analyze the usage of CPU and memory along with Disk, Network Activity and much more. So, here we will show quite a few ways to Launch Resource Monitor in Windows 10 so that you can keep track on many things from a single interface.
Multiple Ways to Launch Resource Monitor in Windows 10
Way-1: Through Cortana Search
Way-2: Via Start Menu
Way-3: By Run dialog
Way-4: From Task Manager
Way-5: Using Classic Control Panel
Way-6: With the assistance of Command Prompt
Way-7: by dint of Windows PowerShell
Way-8: Applying Performance Monitor
Given its utility, there is a decent range of ways to launch the Resource Monitor in Windows 10. In the below section, we will discuss all those methods to access this app.
Way-1: Through Cortana Search
a) To open this built-in monitor tool, type the command resmon in the Cortana search box and press Enter. Moreover, typing monitor in the search bar also lets you access the utility.
b) As the app launches, you will see various tabs and you can navigate to the ones you want.
Way-2: Access Via Start Menu
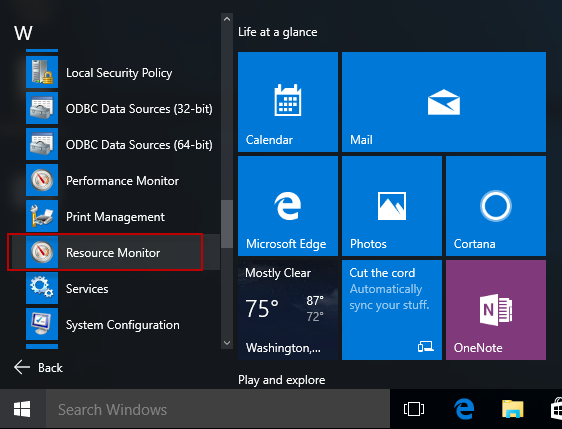
Step #1: Hit the Start button on the desktop and navigate to W section. Here, find out and expand Windows Administrative Tools.
Step #2: Locate Resource Monitor and click on it to open.
Way-3: By Run Dialog
• Open Run dialog box by simultaneously hitting “Win+R” hotkeys. Moreover, you can also access it from Power user menu.
• Once the Run dialog appears, type resmon.exe and click OK as shown in the given image to Launch Resource Monitor in Windows 10.
Way-4: From Task Manager
I. First of all, open Task Manager by combinedly hitting Ctrl + Alt + Del hotkeys. Instead, you can also perform a right-click on the taskbar and from the list, click “Task Manager“.
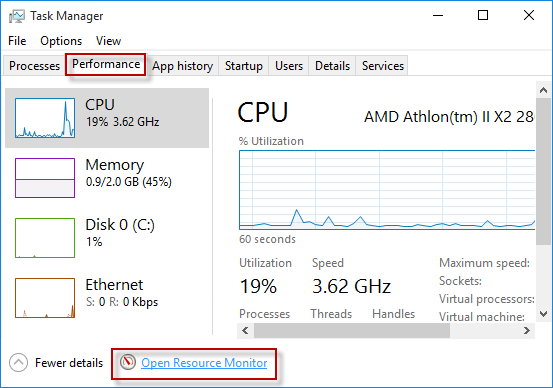
II. Once the Task Manager shows up, switch to the Performance tab.
III. Here, hit the Open Resource Monitor link at the bottom to proceed further (see screenshot).
Way-5: Using Classic Control Panel
A. Type cp in the Cortana bar and press Enter to instantly open Control Panel. Make a click on Administrative Tools.
B. Now, find out Resource Monitor and click on it to access.
Way-6: Through Command Prompt
# Type cmd on Cortana search text box and press Enter when Command Prompt Desktop app appears as the Best match.
## Once the black window comes into view, type in the below-given command. Press Enter to run it.
resmon.exe
Way-7: By dint of Windows PowerShell
By using “Windows PowerShell” also you can Launch Resource Monitor in Windows 10 pretty easily.
01. Open Power User Menu by pressing “Win+X” keys altogether or by right-clicking Start. When the menu appears, locate and click Windows PowerShell.
02. Now, type the given command and hit the Enter key to launch Resource Monitor in Windows 10.
resmon
Way-8: Applying Performance Monitor
i. Another interesting way to access this built-in monitor is through Performance Monitor. So, first, type perfmon on Cortana text field and press Enter.
ii. On the main interface of “Performance Monitor”, you will notice Open Resource Monitor link, click on it.
The tool has a set of 5 tabs involving Overview, CPU, MEMORY, DISK, and NETWORK to chart their individual performances.
Overview: This tab provides the basic system usage information.
CPU: It displays the active processes that are engaged in the system along with the average percentage of CPU capacity used by each process.
Memory: Gives a view of the usage of physical memory with individual usage of each process. One can view the total memory and the amount allocated to hardware and Windows.
Disk: It displays the processes that are involved in Disk activity. One can find the extensive activities and have an option to decide the end of the process or a complete process tree.
Network: Showcases the programs that access the network and the IP address they are connected to.
The single interface of the resource monitor which combines the functionality of many tools; system monitor, Performance logs and server performance, makes it one of the most efficient utility tools offered by Microsoft.
If the system seems to slow down or bogged down by a program, one can easily navigate through the Resource Monitor to pinpoint at the cause of concern and direct a course of action to improve the overall performance of the system.
Монитор ресурсов — инструмент, позволяющий оценить использование процессора, оперативной памяти, сети и дисков в Windows. Часть его функций присутствуют и в привычном диспетчере задач, но если вам требуется более подробная информация и статистика, лучше воспользоваться описываемой здесь утилитой.
В этой инструкции подробно рассмотрим возможности монитора ресурсов и на конкретных примерах посмотрим, какую информацию с помощью него можно получить. См. также: Встроенные системные утилиты Windows, о которых полезно знать.
Другие статьи на тему администрирования Windows
- Администрирование Windows для начинающих
- Редактор реестра
- Редактор локальной групповой политики
- Работа со службами Windows
- Управление дисками
- Диспетчер задач
- Просмотр событий
- Планировщик заданий
- Монитор стабильности системы
- Системный монитор
- Монитор ресурсов (эта статья)
- Брандмауэр Windows в режиме повышенной безопасности
Запуск монитора ресурсов
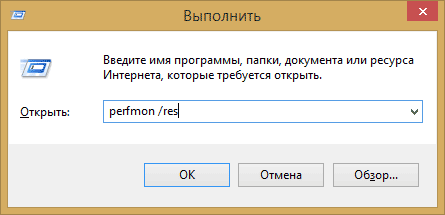
Способ запуска, который одинаково будет работать и в Windows 10 и в Windows 7, 8 (8.1): нажмите клавиши Win + R на клавиатуре и введите команду perfmon /res
Еще один способ, который так же подойдет для всех последних версий ОС — зайти в Панель управления — Администрирование, и выбрать там «Монитор ресурсов».
В Windows 8 и 8.1 вы можете использовать поиск на начальном экране для запуска утилиты.
Просмотр активности на компьютере с помощью монитора ресурсов
Многие, даже начинающие пользователи, сносно ориентируются в диспетчере задач Windows и умеют найти процесс, который тормозит систему, или который выглядит подозрительным. Монитор ресурсов Windows позволяет увидеть еще больше подробностей, которые могут потребоваться для решения возникших с компьютером проблем.
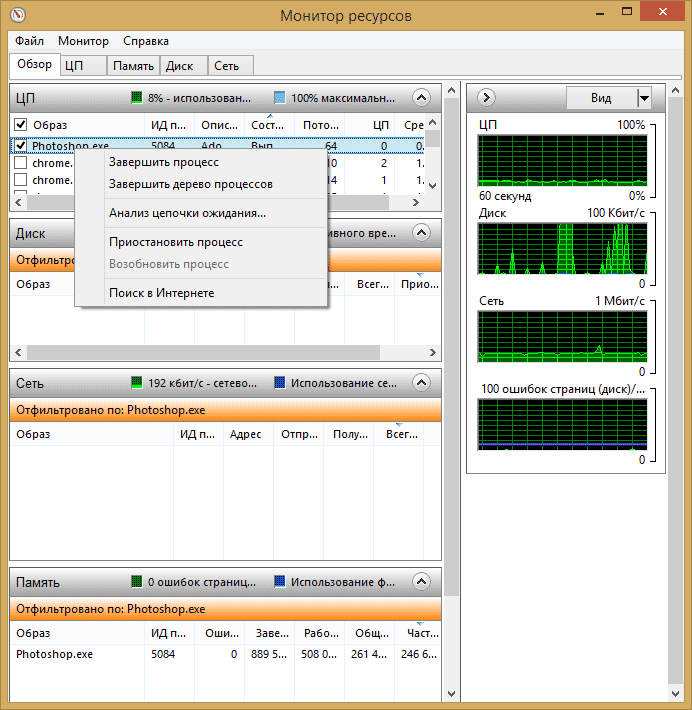
На главном экране вы увидите список запущенных процессов. Если отметить любой из них, внизу, в разделах «Диск», «Сеть» и «Память» отобразятся активности только выбранных процессов (используйте кнопку со стрелкой для того, чтобы открыть или свернуть любую из панелей в утилите). В правой части находится графическое отображение использования ресурсов компьютера, хотя на мой взгляд, лучше свернуть эти графики и опираться на цифры в таблицах.
Нажатие правой кнопкой мыши по любому процессу позволяет завершить его, а также все связанные процессы, приостановить или же найти информацию о данном файле в Интернете.
Использование центрального процессора
На вкладке «ЦП» вы можете получить более подробную информацию об использовании процессора компьютера.

Также, как и в главном окне, вы можете получить полные сведения только об интересующей вас запущенной программе — например, в разделе «Связанные дескрипторы» отображается информация об элементах системы, которые использует выбранный процесс. И, если к примеру, файл на компьютере не удаляется, так как занят каким-либо процессом, вы можете отметить все процессы в мониторе ресурсов, ввести имя файла в поле «Поиск дескрипторов» и узнать, какой именно процесс его использует.
Использование оперативной памяти компьютера
На вкладке «Память» в нижней части вы увидите график, отображающий использование оперативной памяти RAM на вашем компьютере. Обратите внимание, что если вы увидите «Свободно 0 мегабайт», не стоит переживать по этому поводу — это нормальная ситуация и в действительности, память, отображенная на графике в графе «Ожидание» — это тоже своего рода свободная память.

В верхней части — все тот же список процессов с подробной информацией по использованию ими памятью:
- Ошибки — под ними понимаются ошибки, когда процесс обращается к оперативной памяти, но не находит там чего-то, что нужно, так как информация была перемещена в файл подкачки из-за недостатка RAM. Это не страшно, но если вы видите много таких ошибок, следует задуматься об увеличении количества оперативной памяти на компьютере, это поможет оптимизировать скорость работы.
- Завершено — эта колонка показывает, какой объем файла подкачки был использован процессом за все время его работы после текущего запуска. Цифры там будут достаточно большие при любом количестве установленной памяти.
- Рабочий набор — количество памяти, используемое процессом в настоящий момент времени.
- Частный набор и общий набор — под общим объемом подразумевается тот, который может быть освобожден для другого процесса, если ему станет не хватать RAM. Частный набор — память, строго отведенная конкретному процессу и которая не будет передана другому.
Вкладка Диск
На данной вкладке вы можете просмотреть скорость операций чтения записи каждого процесса (и суммарный поток), а также увидеть список всех запоминающих устройств, а также свободного места на них.

Использование сети

С помощью вкладки «Сеть» монитора ресурсов вы можете просмотреть открытые порты различных процессов и программ, адреса, по которым они обращаются, а также узнать, разрешено ли данное соединение брандмауэром. Если вам кажется, что какая-то программа вызывает подозрительную сетевую активность, кое-какую полезную информацию можно почерпнуть именно на этой вкладке.
Видео об использовании монитора ресурсов
На этом завершаю статью. Надеюсь, для тех, кто не знал о существовании данного инструмента в Windows, статья будет полезной.