
Iperf – кроссплатформенная консольная утилита с открытым исходным кодом, предназначенная для тестирования пропускной способности сети между двумя узлами. Утилита iperf позволяет генерировать нагрузочный TCP и UDP трафик между хостами. С помощью iperf вы можете быстро измерить максимальную пропускную способность сети между сервером и клиентом, провести нагрузочное тестирование канала связи, маршрутизатора, сетевого шлюза (файервола), вашей Ethernet или Wi-Fi сети.
В этой статье мы покажем, как установить и использовать утилиту iPerf для проверки скорости сети в Windows, Linux и VMware ESXi (есть версии iperf для Android, MacOS, RouterOS от MikroTik и других платформ).
Содержание:
- Установка и использование iPerf в Windows
- Установка iPerf в Linux
- Запуск iPerf в VMware ESXi
- Проверка пропускной способности сети с помощью iPerf
Утилита iPerf является кроссплатформенной и не требует установки, достаточно скопировать и запустить ее на двух устройствах, пропускную способность сети между которыми нужно оценить. iPerf работает в режиме клиент-сервер. На первом компьютере утилита iPerf запускается в режиме сервера (ожидает трафик от клиента). На втором компьютере iPerf запускается в режиме клиента, начинает генерировать TCP/UDP трафик и выполнять измерение максимальной скорости передачи данных. В большинстве случаев сейчас используется версия iPerf3 (поддерживает высокоскоростное UDP тестирование, по умолчанию используется порт 5201 TCP/UDP).
Установка и использование iPerf в Windows
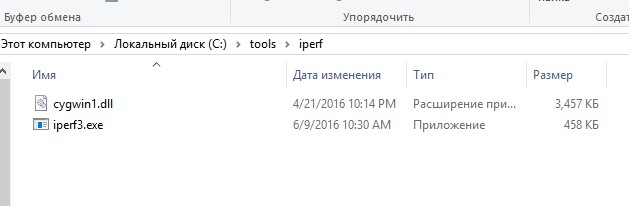
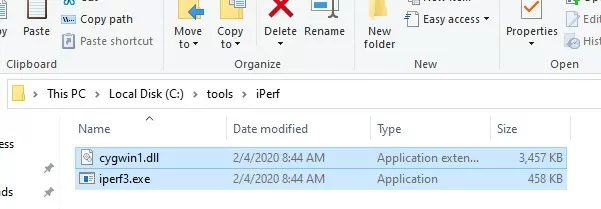
Вы можете скачать iperf 3.1 для Windows по ссылке https://iperf.fr/iperf-download.php или версию iperf2. Достаточно скачать архив iperf и распаковать в локальный каталог на диске. Установка утилиты не требуется. В архиве всего два файла: cygwin1.dll и iperf3.exe.
Вы можете скачать архив iPerf и распаковать его на диск с помощью команд PowerShell:
$iPerfZip = "https://iperf.fr/download/windows/iperf-3.1.3-win64.zip"
$TargetFolder = Join-Path $env:TEMP "iperf.zip"$iPerfPath = Join-Path $env:TEMP "iperf"
if (!(Test-Path $iPerfPath))
{ Invoke-WebRequest -Uri $iPerfZip -OutFile $TargetFolder
Expand-Archive -Path $TargetFolder -DestinationPath $iPerfPath
}
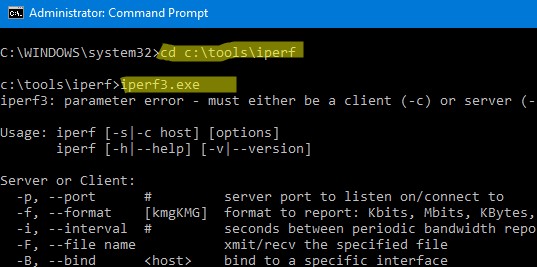
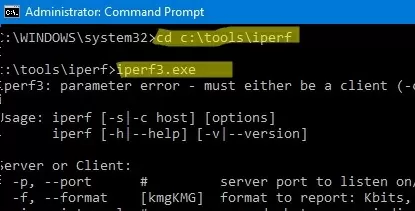
Iperf это консольная утилита и для ее запуска нужно использовать командную строку. Откройте командную строку (cmd.exe) и перейдите в каталог с утилитой. Например:
cd c:\tools\iperf
Если вы запустить программу iperf3.exe без параметров, она выведет список доступных опций.
Утилита iPerf может работать в режиме сервера (параметр -s) или клиента (-c). Если вы запускаете iPerf сервер на Windows, нужно открыть входящие порт 5201 для протоколов TCP и UDP. Можно открыть порты через графический интерфейс Windows Defender Firewall или с помощью команд PowerShell. Создайте и включите правила файервола так:
New-NetFirewallRule -DisplayName 'iPerf-Server-Inbound-TCP' -Direction Inbound -Protocol TCP -LocalPort 5201 -Action Allow | Enable-NetFirewallRule
New-NetFirewallRule -DisplayName 'iPerf-Server-Inbound-UDP' -Direction Inbound -Protocol UDP -LocalPort 5201 -Action Allow | Enable-NetFirewallRule

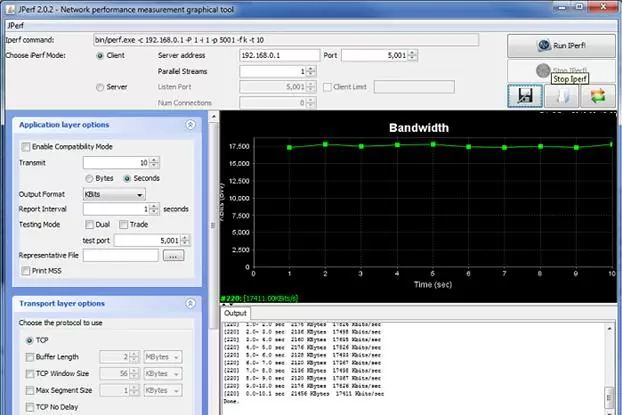
Для Windows есть несколько реализаций графического интерфейса. Например, Iperf3-Cygwin-GUI и jperf.
Утилита jperf написана на Java (для работы на компьютере должна быть установлена Java-машина). Помимо графических рюшечек к CLI интерфейсу, Jperf умеет в реальном времени строить графики пропускной способности канала связи.
Для использования достаточно указать адрес сервера iPerf и запустить проверку.

В галерее скриптов PowerShell есть отдельный модуль iPerfAutomate, который можно использовать для получения данных измерения производительности сети из скриптов PowerShell. Вы можете установить модуль так:
Install-Module -Name iPerfAutomate
Установка iPerf в Linux
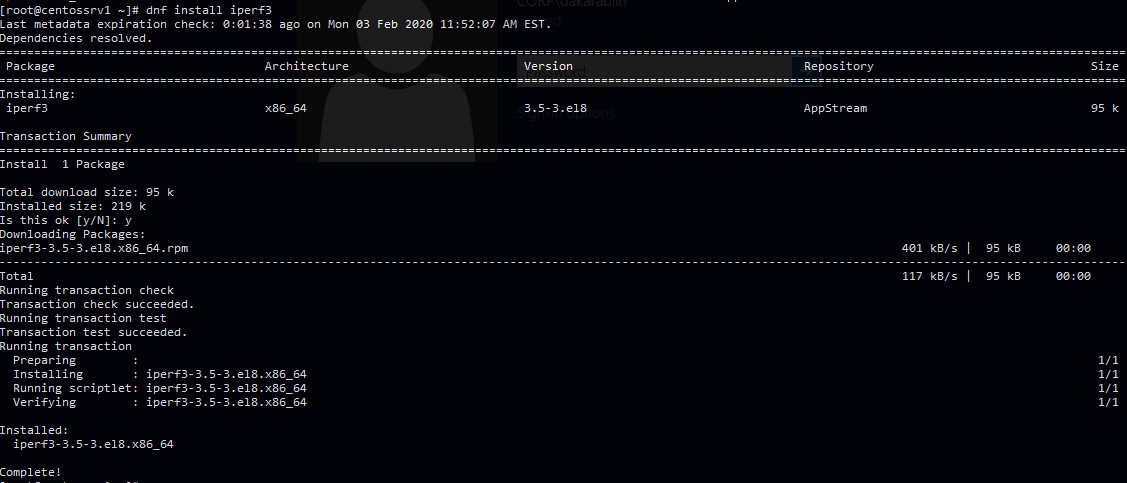
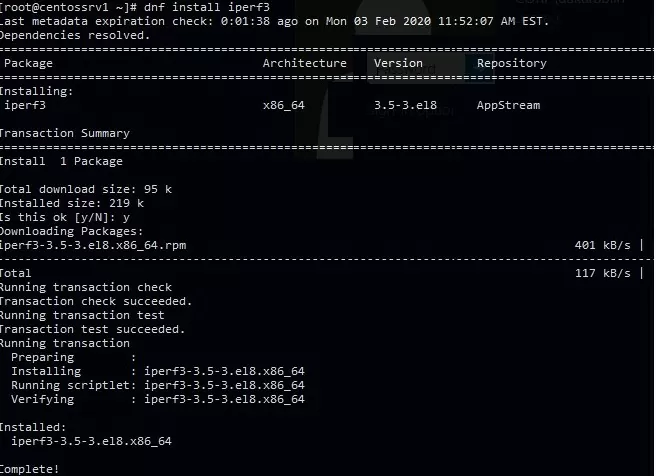
В дистрибутивах CentOS/RHEL/Fedora 8 пакет iperf3 включен в состав базового репозитория AppStream (в CentOS 7 iperf3 есть в EPEL). Вы можете установить его стандартной командой yum/dnf:
# dnf install iperf3
В дистрибутивах Debian/Ubuntu вы можете установить утилиту iperf3 командой:
$ sudo apt install iperf3
Если данный Linux сервер планируется использовать в качестве сервере iperf3, нужно открыть порт 5201 в firewalld (или iptables):
# firewall-cmd --permanent --add-port=5201/tcp
# firewall-cmd --permanent --add-port=5201/udp
# firewall-cmd --reload
Запуск iPerf в VMware ESXi
VMware удалила утилиту iPerf в ESXi 6.7, но вернула его в 6.7U1. Проверьте, что на вашем хосте ESXi установлен iPerf. Подключитесь к консоли ESXi по SSH, перейдите в каталог
/usr/lib/vmware/vsan/bin
и проверьте, есть ли в нем файл iperf или iperf3.
Если iPerf не установлен, вы можете вручную скачать offline bundle с iperf здесь (http://vibsdepot.v-front.de/depot/bundles/iperf-2.0.5-1-offline_bundle.zip), скопируйте его на ESXi хост и установить командой:
# esxcli software vib install -d /iperf-2.0.5-1-offline_bundle.zip –no-sig-check
Утилита будет установлена в каталог /opt/iperf/bin и для ее запуска нужно указывать команду:
# /opt/iperf/bin/iperf3
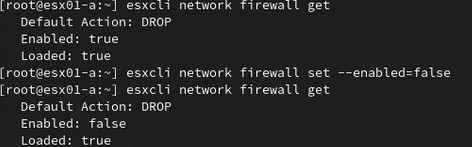
Если вы запускаете iPerf сервер на хосте ESXi, нужно открыть порты 5201. По умолчанию эти порты запрещены в файерволе ESXi. Чтобы открыть их, можно временно отключить файервол:
# esxcli network firewall get# esxcli network firewall set --enabled=false
# esxcli network firewall get
Не забудьте включить файервол ESXi после окончания проверки пропускной способности сети:
# esxcli network firewall set --enabled true
При запуске iPerf в ESXi его нужно привязывать к интерфейсу vmkernel:
# esxcli network ip interface ipv4 get
Проверку доступности между хостами ESXi можно выполнить с помощью:
# vmkping IP address
Запускайте iPerf на полученном IP адресе:
# iperf -s -B 192.168.31.50
Проверка пропускной способности сети с помощью iPerf
Рассмотрим теперь несколько примеров использования iperf для тестирования пропускной способности сети. В этом примере мы будем использовать сервер с CentOS в качестве сервера iperf. Запустим утилиту iperf в серверном режиме:
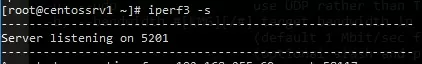
# iperf3 –s
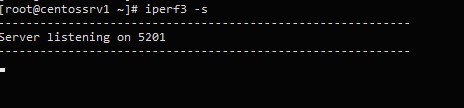
Сервер iperf запущен, он ожидает соединения на порту TCP/5201.
Server listening on 5201
Важно. Аргументы утилиты iperf регистрозависимы!
Можно запустить iperf сервер с большим размером TCP окна и на другом порту:
# iperf3 -s -w 32768 –p 5203
-w 32768 – зададим размер окна TCP в 32 KB (по умолчанию около 8 Кб)
–p 5203 – порт, на котором ожидает подключения iperf (напоминаю, что iperf2 по умолчанию слушает на порту 5001).
Можно запустить сервер iPerf в режиме службы Windows с помощью ключа -D.
В качестве клиента iperf я использую компьютер с Windows 10. Запустите командную строку и перейдите в каталог с исполняемым файлом iperf:
cd c:\tools\iperf
Чтобы запустить проверку сети со стороны клиента, укажите адрес (имя) хоста, где запущен сервер iperf:
iperf3.exe -c 192.168.1.202
Клиент начнет генерировать сетевой трафик и выполнит тестирование канала в течении 10 секунд и выведет примерно такую таблицу:
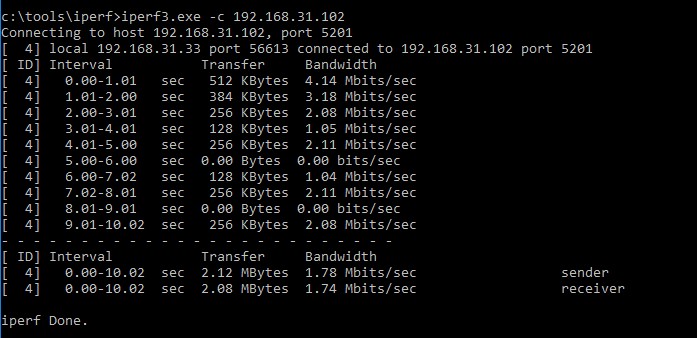
- Interval – промежуток тестирования (в сек.);
- Transfer – размер переданных данных за это время;
- Bandwidth – средняя скорость передачи данных.
Если вы запустили сервер iperf с увеличенным размером TCP окна, вы можете использовать следующую команду для получения максимальной нагрузки на сеть:
iperf3.exe -c 192.168.1.202 -P 8 -t 30 -w 32768 -i 5 -f g
- -c 192.168.1.202 – IP адрес сервера iperf;
- -w 32768 — увеличиваем размер TCP окна;
- -t 30 – время в секундах, в течении которого выполняется тестирование (по умолчанию 10 секунд);
- -P 8 — число параллельных потоков (подключений), используется для получения максимальной нагрузки на канал;
- -i 5 – выводить статистику на экран каждые 5 секунд. Параметр удобно использовать при продолжительных тестах (несколько минут, часов);
- -f m — выводить результаты в Мбит/с. Здесь можно использовать атрибуты kmgKMG (килобиты, мегабиты, мегабайты и т.д.).
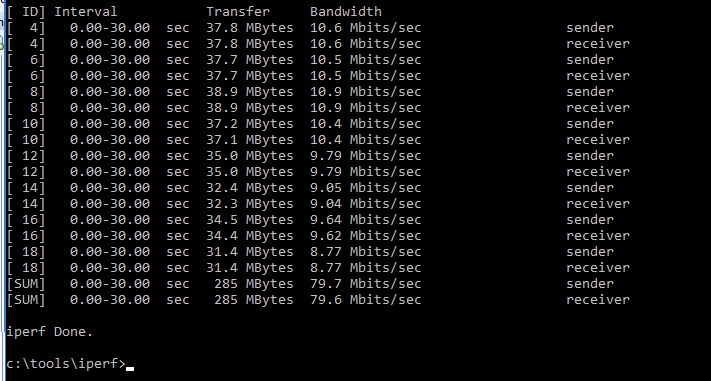
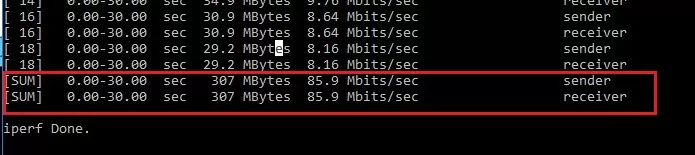
В нашем примере тестирование длилось 30 секунд. В итоговом отчете нас интересует значения столбца Bandwidth в последней строке [SUM]. Здесь указаны средняя скорость отправки (sender) и получения данных по сети (receiver).
В нашем случае средняя пропускная способность сети между двумя узлами – 79,7 Мбит/с. Было передано 285 Мб данных (столбец Transfer).
Можно запустить iperf в обратном режиме (сервер отправляет данные, а клиент принимает), для этого на клиенте указывается опция –R.
По-умолчанию утилита генерирует TCP трафик, если вам нужно проверить скорость сети для UDP пакетов, необходимо использовать ключ –u (сервер при этом запускается командой:
iperf3 -s –u
).
Если вам нужно проверить ваш интернет-канал (предоставляемый провайдером), можно воспользоваться одним из публичных iperf серверов (список доступен здесь):
iperf3 -c iperf.it-north.net
Обратите внимание, что iperf3 не поддерживает несколько одновременных тестов. Если сервер iperf сейчас выполняет тестирование с одним клиентов, то при попытке подключиться к нему с другого вы получите ошибку: iperf3: error — the server is busy running a test. try again later.
Если нужно оценить пропускную способность сети в обоих направлениях (в дуплексном режиме), дополнительно на клиенте нужно указать опцию –d:
iperf3.exe -c IP -P 8 -t 30 -w 32768 -d

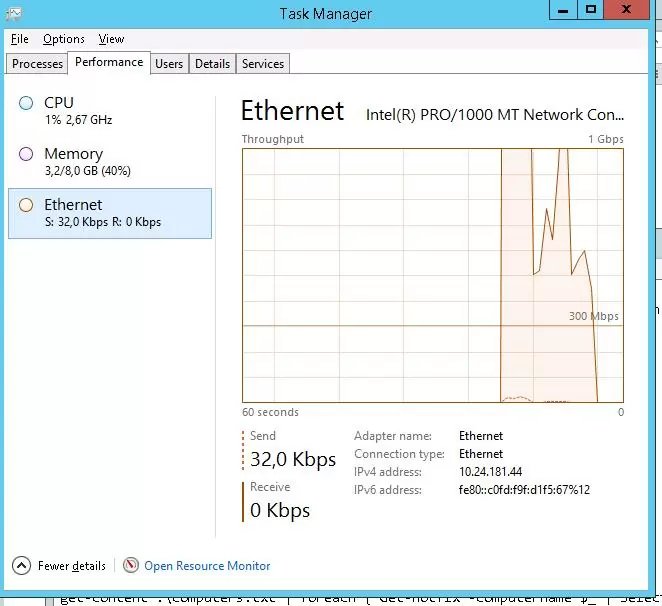
Во время выполнения теста сете с помощью iperf вы можете следить за нагрузкой на сетевой интерфейс компьютера через Task Manager.
Важно отметить, что при тестировании Iperf используем всю доступную пропускную способность канала связи между клиентом и сервером, что может негативно повлиять на продуктивные приложения и пользователей.

Полный список опций утилиты iperf можно получить так:
iperf3 –help
Iperf – простая и удобная сетевая утилита, которая поможет вам измерить производительность сетевого подключения и максимальную скорость передачи данных между двумя устройствами.
In this tutorial you will learn how to use iPerf3 to measure throughput and simulate network loads on your networking infrastructure. iPerf3 is a useful, simple command-line tool for testing network throughput and performance. We will provide step-by-step instructions as well as a few common examples and use cases of ways to effectively use iPerf in your environment.
Install iPerf on Windows
iPerf can be installed on and ran from any windows based machine including Windows 10, Windows 11, and Windows Server.
Step 1. Download the latest iPerf3 package for your operating system from https://iperf.fr/iperf-download.php

Step 2. Extract the zip file.
Step 3. Copy the iperf3 executable and any required DLLs to the computers you want to use for testing. One computer will act as the server and the other the client. Here I created a folder named ‘TEMP’ on each machine.

Install iPerf on Linux (Ubuntu in this Case)
Step 1. Update the package repository:
sudo apt update
Step 2. Install iperf3 package:
sudo apt install iperf3
Step 3. Verify iperf3 is installed:
iperf3 -v
You should see output like:
iperf 3.1.3
Step 4. To start iperf3 in server mode:
iperf3 -s
Step 5. To start iperf3 in client mode, connect to a server IP:
iperf3 -c SERVER_IP
Replace SERVER_IP with the IP address of your iperf3 server.
Fun fact, you can even run iperf directly on some networking equipment such as Cisco’s Cat9k series switches.
Run iPerf
To test network throughput between two computers using iPerf, you will need to set up one computer as the iPerf server and the other as the iPerf client. You do this by specifying command-line parameters to indicate which system will assume the role of the server and which will become the client.

On the iPerf Server:
Step 1. Open a command prompt or terminal and navigate to the folder containing iperf3.exe.
C:\Users\Chase>cd C:\TEMP\

C:\TEMP>dir
 Volume in drive C has no label.
 Volume Serial Number is C44B-B620

 Directory of c:\TEMP

08/23/2023  03:08 PM    <DIR>          .
08/23/2023  03:08 PM         3,539,372 cygwin1.dll
08/23/2023  03:08 PM           468,748 iperf3.exe
               2 File(s)      4,008,120 bytes
               1 Dir(s)  567,597,051,904 bytes free

C:\TEMP>
Step 2. Type the command iperf3 -s to start the iPerf server.
C:\TEMP\iperf3 -s
-------------------------------------------------------------------
Server listening on 5201
-------------------------------------------------------------------
Step 3. The server will display “server listening on 5201” when ready.
On the iPerf Client:
Step 1. Open a command prompt or terminal and navigate to the iperf3 executable.
Step 2. Type iperf3 -c SERVER-IP-OR-NAME to start the iPerf client, replacing SERVER-IP-OR-NAME with the IP address or hostname of the iPerf server.
C:\TEMP\iperf3 -c 10.2.0.10
Connecting to host 10.2.0.10, port 5201
[  4] local 10.2.0.89 port 32777 connected to 10.2.0.10 port 5201
[ ID]  Interval           Transfer     Bandwidth
[  4]   0.00-1.00   sec   109 MBytes   916 Mbits/sec
The test will run for 10 seconds by default and display results when finished. If you’re on a windows machine you can open Task Manager and see the bandwidth utilization on the performance tab.

Interpreting iPerf Test Results
The iPerf output will display report intervals and throughput information. Key stats:
- Interval – The periodic reporting interval.
- Transfer – The bytes transferred during this interval.
- Bandwidth – The throughput measured over this interval.
- Transfer Total – Total bytes transferred and the average bandwidth over the whole test.
- Bandwidth Average – Average throughput throughout the duration of the test.

Useful iPerf Options
iPerf comes with multiple command switches you can use for adjusting settings and performing various tests. Here are some common iPerf options to tweak your throughput tests:
- -i – Sets the interval time between periodic bandwidth reports in seconds. Useful for longer tests.
- -t – Sets the total time in seconds to transmit for. Default is 10 seconds.
- -p – Changes the listening port on the server..
- -u – Use UDP instead of TCP.
- -b – Limit bandwidth to a specified amount. Useful for not saturating a network.
- -R – Reverse direction – server sends data, client receives.
- -bidir – Bidirectional – data transmitted from both server and client in the same test.
See the official documentation or ‘iperf3 –help‘ for the complete list of options.
C:\TEMP> iperf3 --help
Usage: iperf [-s|-c host] [options]
       iperf [-h|--help] [-v|--version]


Server or Client:
  -p, --port      #         server port to listen on/connect to
  -f, --format    [kmgKMG]  format to report: Kbits, Mbits, KBytes, MBytes
  -i, --interval  #         seconds between periodic bandwidth reports
  -F, --file name           xmit/recv the specified file
  -B, --bind      <host>    bind to a specific interface
  -V, --verbose             more detailed output
  -J, --json                output in JSON format
  --logfile f               send output to a log file
  -d, --debug               emit debugging output
  -v, --version             show version information and quit
  -h, --help                show this message and quit
Server specific:
  -s, --server              run in server mode
  -D, --daemon              run the server as a daemon
  -I, --pidfile file        write PID file
  -1, --one-off             handle one client connection then exit
Client specific:
  -c, --client    <host>    run in client mode, connecting to <host>
  -u, --udp                 use UDP rather than TCP
  -b, --bandwidth #[KMG][/#] target bandwidth in bits/sec (0 for unlimited)
                            (default 1 Mbit/sec for UDP, unlimited for TCP)
                            (optional slash and packet count for burst mode)
  -t, --time      #         time in seconds to transmit for (default 10 secs)
  -n, --bytes     #[KMG]    number of bytes to transmit (instead of -t)
  -k, --blockcount #[KMG]   number of blocks (packets) to transmit (instead of -t or -n)
  -l, --len       #[KMG]    length of buffer to read or write
                            (default 128 KB for TCP, 8 KB for UDP)
  --cport         <port>    bind to a specific client port (TCP and UDP, default: ephemeral port)
  -P, --parallel  #         number of parallel client streams to run
  -R, --reverse             run in reverse mode (server sends, client receives)
  -w, --window    #[KMG]    set window size / socket buffer size
  -M, --set-mss   #         set TCP/SCTP maximum segment size (MTU - 40 bytes)
  -N, --no-delay            set TCP/SCTP no delay, disabling Nagle's Algorithm
  -4, --version4            only use IPv4
  -6, --version6            only use IPv6
  -S, --tos N               set the IP 'type of service'
  -Z, --zerocopy            use a 'zero copy' method of sending data
  -O, --omit N              omit the first n seconds
  -T, --title str           prefix every output line with this string
  --get-server-output       get results from server
  --udp-counters-64bit      use 64-bit counters in UDP test packets


[KMG] indicates options that support a K/M/G suffix for kilo-, mega-, or giga-
Now, let’s step through a few common examples of using iPerf to test network bandwidth.
Practical iPerf Examples
Here are a few examples that provide a mix of TCP and UDP tests, with options to adjust duration, direction, bandwidth, ports, and parallel streams.
Example 1. Basic iperf3 TCP test
Run a simple 10 second TCP test between iperf3 server and client.
Command:
Server: iperf3 -s
Client: iperf3 -c SERVER_IP
Example 2. 60 second TCP test
Extend the test duration to 60 seconds.
Command:
Server: iperf3 -s
Client: iperf3 -c SERVER_IP -t 60
Example 3. UDP test
Switch to UDP instead of TCP.
Command:
Server: iperf3 -s
Client: iperf3 -c SERVER_IP -u
Once the server receives a udp packet from the client it will switch to listening on udp.
Example 4. Reverse direction
Reverse the direction so the server sends and client receives data.
Command:
Server: iperf3 -s
Client: iperf3 -c SERVER_IP -R
Example 5. Limit bandwidth
Limit bandwidth to 50 megabits per second.
Command:
Server: iperf3 -s
Client: iperf3 -c SERVER_IP -b 50M
By default iPerf target bandwidth for UDP connections is 1Mbps, and the default target bandwidth for TCP connections is unlimited. It’s a good idea to set a custom bandwidth limit when testing so you don’t saturate the links and bring down the network (unless that’s your intention).
Example 6. Change port
Use port 5002 instead of default 5201.
Command:
Server: iperf3 -s -p 5002
Client: iperf3 -c SERVER_IP -p 5002
Notice that the port needs to be changed on both the server and the client for the connection to work.
Example 7. Parallel streams
Use 5 parallel streams.
Command:
Server: iperf3 -s
Client: iperf3 -c SERVER_IP -P 5
Example 8. Change interval
Set the test interval to 5 seconds.
Command:
Server: iperf3 -s
Client: iperf3 -c SERVER_IP -i 5
When changing the interval, it’s a good idea to change the test time as well if you want to get much data.
Use cases for using iPerf
iPerf has come in handy numerous times for me as a Network Engineer. Off the top of my head some of the things I’ve used iPerf for that were particular handy have been:
- Running iPerf between VMs or systems in different data centers to test latency and throughput
- Verifying I was getting the bandwidth we were paying for from our ISP
- Testing the speed between wireless clients and access points
- Benchmarking NAS and SAN performance
- Generate TCP and UDP traffic to load test applications and infrastructure
- Checking the impact of network or firewall changes
- Troubleshooting slow networks
- Checking for packet loss ( UDP tests will show packet loss percentage if there is any)
- Showing clients actual measured throughput during a site visit
What about you? Have any interesting use cases where iPerf has come in handy for you?
Recommended Tool: ManageEngine OpManager

- Multi-vendor Network Monitoring
- Simple Installation & Setup
- Intuitive UI
- Complete Visibility
- Intelligent Detections
- Easy Resolutions
Network Engineer III
I am a Senior Network Engineer who has spent the last decade elbow deep in enterprise System Administration and Networking in the local government and energy sectors. I can usually be found trying to warm up behind the storage arrays in the datacenter.
Обновлено:
Опубликовано:
Тематические термины: iPerf, Linux, CentOS, Windows
iPerf является кроссплатформенным приложением и может быть установлен на любую популярную операционную систему. В данной инструкции будет рассмотрена установка сервера на Linux CentOS и клиента как на последнем, так и Microsoft Windows.
Установка и запуск
Запуск клиента и проверка сервера
Ключи
Автозапуск
Примеры
Версия для Windows
iPerf и iPerf3
Публичные сервера
Свой публичный сервер
Возможные проблемы
Установка сервера/клиента
По сути, нет отдельного iPerf для сервера или клиента — это один и тот же программный продукт, который может запускаться в режиме сервера или выполнять клиентские команды.
Для начала выполняем установку расширенного репозитория:
yum install epel-release
Устанавливаем iPerf:
yum install iperf3
Открываем порт в брандмауэре:
firewall-cmd —permanent —add-port=5201/tcp
firewall-cmd —permanent —add-port=5201/udp
firewall-cmd —reload
* в данном примере мы открыли порт 5201 (для iPerf по умолчанию) для пакетов TCP и UDP.
Запускаем сервер:
iperf3 -s
На экране появится:
————————————————————
Server listening on 5201
————————————————————
Сервер ждет запросов.
Клиентские запросы и проверка сервера
Напомню, что клиент может быть установлен на любую систему. Также, как в первом случае, выполняем установку клиента на другой компьютер в сети.
После можно сразу выполнить команду:
iperf3 -c 192.168.0.15
* где 192.168.0.15 — iPerf сервер.
На клиенте мы увидим что-то подобное:
[ 4] local 192.168.0.20 port 47068 connected to 192.168.0.15 port 5201
[ ID] Interval Transfer Bandwidth Retr Cwnd
[ 4] 0.00-1.00 sec 104 MBytes 873 Mbits/sec 10 391 KBytes
[ 4] 1.00-2.00 sec 110 MBytes 921 Mbits/sec 4 393 KBytes
[ 4] 2.00-3.00 sec 111 MBytes 928 Mbits/sec 1 478 KBytes
[ 4] 3.00-4.00 sec 104 MBytes 875 Mbits/sec 5 423 KBytes
* где:
- 192.168.0.20 — адрес клиента
- 192.168.0.15 — адрес сервера
- ID — идентификатор запросов, нужен для ориентирования, если к серверу идет несколько обращений.
- Interval — промежуток времени в секундах, на протяжении которого выполнялась передача данных.
- Transfer — сколько было передано данных за интервал времени.
- Bandwidth — средняя скорость передачи данных за интервал времени.
- Retr — количество повторно отправленных TCP-сегментов.
- Cwnd — одновременно переданных данных.
Все ключи запуска iPerf
Общие для сервера и клиента:
| Ключ | Описание |
|---|---|
| -p | Определить порт, на котором будет слушать сервер или отправлять запросы клиент |
| -f | Формат отчетов — kmgKMG (Kbits, Mbits, KBytes, MBytes, …) |
| -i | Задать интервал, в течение которого выполняется одна проверка |
| -F | Указать файл, из которого будут взяты входные данные для запуска |
| -A | Степень нагрузки на процессор |
| -B | Указать, через какой сетевой интерфейс работать |
| -V | Детализированные сообщения в консоли |
| -J | Вывод в формате json |
| —logfile | Весь вывод в отдельный лог-файл |
| -d | Режим отладки (много сообщений) |
| -v | Показать версию программы |
| -h | Вызвать справку по работе с программой |
Для сервера:
| Ключ | Описание |
|---|---|
| -s | Запустить iPerf в режиме сервера |
| -D | Запустить как демона (как службу) |
| -I | Указать pid-файл |
| -1 | Принять запрос от одного клиента и завершить работу |
Для клиента:
| Ключ | Описание |
|---|---|
| -c | Запустить iPerf в режиме клиента |
| -u | Отправлять UDP-пакеты |
| -b | Формат отчетов для bandwidth (средней скорости) |
| -t | Количество секунд, в течение которых будет идти проверка скорости |
| -n | Объем данных для проверки (применяется вместо времени -t) |
| -k | Количество пакетов для проверки (вместо -t или -n) |
| -l | Длина буфера записи/чтения |
| -P | Число параллельных запросов |
| -R | Обратный режим — сервер отправляет, клиент принимает |
| -w | Размер сетевого окна |
| -C | Установить алгоритм управления перегрузкой TCP |
| -M | Задать максимальный размер MTU |
| -4 | Работать только для IPv4 |
| -6 | Работать только для IPv6 |
| -Z | Использовать метод «нулевой копии» для отправки данных |
| -O | Опустить первые n секунд |
| -T | Задать префикс для каждой строки вывода |
Также самый свежий список ключей можно получить командой:
man iperf3
Автозапуск сервера (создание сервиса в systemd)
По умолчанию, программу нужно запускать вручную. Если мы хотим, чтобы сервер запускался автоматически и работал как служба systemd, выполняем инструкцию ниже.
Создаем юнит в systemd со следующим содержимым:
vi /etc/systemd/system/iperfd.service
[Unit]
Description=iPerf Service
After=network.target
[Service]
Type=forking
PIDFile=/run/iperf3.pid
ExecStart=-/bin/iperf3 -s -D -I /run/iperf3.pid
ExecReload=/bin/kill -HUP $MAINPID
Restart=always
[Install]
WantedBy=multi-user.target
* где
- Description — описание юнита;
- After указывает на юнит, после которого может загружаться наш сервис;
- Type — тип службы;
- PIDFile — путь к pid файлу, в котором хранится номер процесса;
- ExecStart — команда, которую нужно выполнить при старте сервиса (в данном примере запускается iPerf в режиме сервера как демон и создает pid-файл);
- ExecReload — команда для перезапуска службы;
- Restart=always — опция, позволяющая автоматически перезапускать сервис, если он перестанет работать;
- опция WantedBy=multi-user.target позволяет установить для автозапуска службу в обычном многопользовательском режиме.
Перезапускаем systemd:
systemctl daemon-reload
Разрешаем созданный сервис:
systemctl enable iperfd
Запускаем его:
systemctl start iperfd
Проверяем:
systemctl status iperfd
Примеры использования iPerf
Рассмотрим некоторые команды запросов к серверу для проверки скорости соединения.
Использование UDP
iperf3 -c 192.168.0.15 -u
* сам сервер не нужно запускать в UDP-режиме, так как он принимает любые запросы.
Альтернативные порты
Для этого необходимо сначала запустить сервер на нужном порту:
iperf3 -s -p 443
* кстати, можно запустить несколько процессов iperf одновременно, которые будут слушать на разных портах.
* стоит не забывать по настройки брандмауэра. В данном примере понадобиться ввести команды firewall-cmd —permanent —add-port=443/tcp и firewall-cmd —reload.
Теперь можно запускать клиента:
iperf3 -c 192.168.0.15 -p 443
Проверка скорости в течение 30 секунд с интервалами по 2 секунды
iperf3 -c 192.168.0.15 -t 30 -i 2
Несколько параллельных запросов
iperf3 -c 192.168.0.15 -P 3
Отправляем на проверку 3 Гб данных
iperf3 -c 192.168.0.15 -n 3G
Клиент/сервер для Windows
Скачиваем iPerf под Windows с официального сайта. Распаковываем архив и запускаем командную строку (cmd). Переходим в распакованную папку (команда cd).
Можем работать с iperf. Команды такие же, как для Linux, например:
iperf3.exe -c 192.168.0.15
GUI
Для работы с iPerf в графическом интерфейсе есть различные утилиты, например Iperf3-Cygwin-GUI. Скачиваем архив, распаковываем его и запускаем iperf3cygwingui.bat.
В открывшемся окне для простой проверки нужно только прописать адрес iPerf-сервера и нажать кнопку Run Iperf3:

Однако, на моей практике, программа не заработала, а после запуска зависала (или не запускался iperf3.exe). Проблему удалось решить с помощью скачанного с официального сайта клиента (файлов iperf3.exe и cygwin1.dll), которыми я заменил одноименные файлы в папке bin.
При желании, программу можно также запустить в режиме сервера:

jPerf
Для работы в графическом интерфейсе также есть популярная программа jperf. Ее можно скачать с сайта sourceforge. Однако, она создана с использованием старой версии iperf, поэтому я не стал уделять ей много внимания. В целом, процесс и внешний вид не сильно отличается от Iperf3-Cygwin-GUI.
Совместимость iPerf и iPerf3
Клиент и сервер совместимы, но нужно знать, что по умолчанию, рабочий порт для iPerf — 5001, для iPerf3 — 5201.
Поэтому либо необходимо запускать сервер:
iperf3 -s -p 5001
* также не забываем настроить брандмауэр.
Либо запускаем клиентские запросы командой:
iperf -c 192.168.0.15 -p 5201
Публичные сервера iPerf
Актуальные публичные сервера iPerf можно найти на официальном сайте программы. Внимательно смотрите на описания серверов и рабочие порты.
Пример проверки с использованием сервера во Франции:
iperf3 -c bouygues.testdebit.info -p 5200
или в Индонезии:
iperf3 -c iperf.biznetnetworks.com
Свой публичный сервер
Сервер iPerf может обрабатывать только одно подключение одновременно на порту. Поэтому, в условиях публичного использования необходим его запуск на множестве портов одновременно.
Мы настроим сервер при помощи systemd. Ранее мы уже создавали один юнит для запуска iperf. Повторяем процедуру с небольшими изменениями.
Создаем юнит со следующим содержимым:
vi /etc/systemd/system/iperfd5205.service
[Unit]
Description=iPerfService on port %i
After=network.target
[Service]
Type=forking
PIDFile=/var/run/iperf3.5205.pid
ExecStart=-/bin/iperf3 -s -p 5205 -D -I /var/run/iperf3.5205.pid
ExecReload=/bin/kill -HUP $MAINPID
Restart=always
RuntimeMaxSec=3600
[Install]
WantedBy=multi-user.target
* если сравнить с ранее созданным юнитом, мы добавили запуск сервера на порту 5205.
Перезапускаем systemd:
systemctl daemon-reload
Разрешаем юнит и запускаем сервис:
systemctl enable iperfd5205
systemctl start iperfd5205
Повторяем шаги для других портов — создаем для каждого отдельный юнит в systemd. Для публичного сервера лучше создать побольше.
Возможные ошибки
the server is busy running a test. try again later
В данный момент сервер обрабатывает другой запрос или он завис. Если мы являемся администратором сервера, перезагружаем его, в противном случае, ждем.
IPerf is an open-source command line tool designed to test network throughput between two network hosts. The iPerf allows to generate TCP and UDP traffic (load) between two hosts. You can use iPerf to quickly measure the maximum network bandwidth (throughput) between a server and a client, and conduct stress testing of the ISP link, router, network gateway (firewall), your Ethernet, or Wi-Fi network performance.
In this article, we will show you how to install and use the iPerf tool to test the network speed (throughput) on Windows. Linux and VMware ESXi (there are iPerf versions for Android, macOS, RouterOS from MikroTik, and other platforms).
Contents:
- How to Install and Use iPerf on Windows?
- Installing iPerf on Linux
- Using iPerf on VMware ESXi
- Use iPerf Tool to Test Network Speed/Bandwidth
IPerf is a cross-platform tool and doesn’t require installation in Windows. Just download the executable and run it on two devices, the network throughput between which needs to be tested. IPerf works in a client-server mode. On the first device, the iPerf starts in server mode (it is waiting for traffic from the iPerf client). On the second computer, the iPerf starts in client mode, generates TCP or UDP traffic, and measures the maximum data transfer rate.
In most cases, the iPerf3 version is used now (it supports high-speed UDP testing, port 5201 TCP/UDP is used by default).
How to Install and Use iPerf on Windows?
You can download iPerf 3.1.3 for Windows by the following link https://iperf.fr/iperf-download.php. If you want to use iPerf 2.0, you can get it here. You don’t need to install the iPerf on Windows, it is enough to download the iPerf archive and extract it to a local directory on the drive. There are only two files in the archive: cygwin1.dll and iperf3.exe.
You can download the iPerf archive and extract it to a local drive using PowerShell script:
$iPerfZip = "https://iperf.fr/download/windows/iperf-3.1.3-win64.zip"
 $TargetFolder = Join-Path $env:TEMP "iperf.zip"$iPerfPath = Join-Path $env:TEMP "iperf"
 if (!(Test-Path $iPerfPath))
 { Invoke-WebRequest -Uri $iPerfZip -OutFile $TargetFolder
 Expand-Archive -Path $TargetFolder -DestinationPath $iPerfPath
 }
Iperf is a console tool and you need to run it in the command line. Open a command prompt (cmd.exe) and go to the directory with the utility. For example:
cd c:\tools\iperf
If you run the iperf3.exe program without parameters, it will list the available options.
The iPerf utility can run in server mode (-s option) or client mode (-c). If you are running an iPerf server on Windows, you need to open inbound port 5201 for TCP and UDP protocols. You can open ports using the Windows Defender Firewall GUI or with PowerShell commands. Create and enable firewall rules like this:
New-NetFirewallRule -DisplayName 'iPerf-Server-Inbound-TCP' -Direction Inbound -Protocol TCP -LocalPort 5201 -Action Allow | Enable-NetFirewallRule
 New-NetFirewallRule -DisplayName 'iPerf-Server-Inbound-UDP' -Direction Inbound -Protocol UDP -LocalPort 5201 -Action Allow | Enable-NetFirewallRule
There are several iPerf GUI implementations for Windows. For example, Iperf3-Cygwin-GUI or jperf.
The jperf is written on Java (in order to run jperf, the Java VM must be installed on the computer). In addition to graphical form for the CLI interface, Jperf can build real-time graph bandwidth charts of the communication channel load. To use it, just specify the iPerf server address and start the network throughput test.
There is a separate iPerfAutomate module in the PowerShell Script Gallery that can be used to get network performance metrics in your PowerShell scripts. You can install the module with the command:
Install-Module -Name iPerfAutomate
Installing iPerf on Linux
On CentOS/RHEL/Fedora/Rocky Linux/Oracle Linux 8, the iperf3 package is available in the base AppStream repository (in CentOS 7 you can find iperf3 in the EPEL repo).
You can install it with the dnf (yum) command:
# dnf install iperf3
On Debian/Ubuntu/Mint distros you can install the iperf3 with the command:
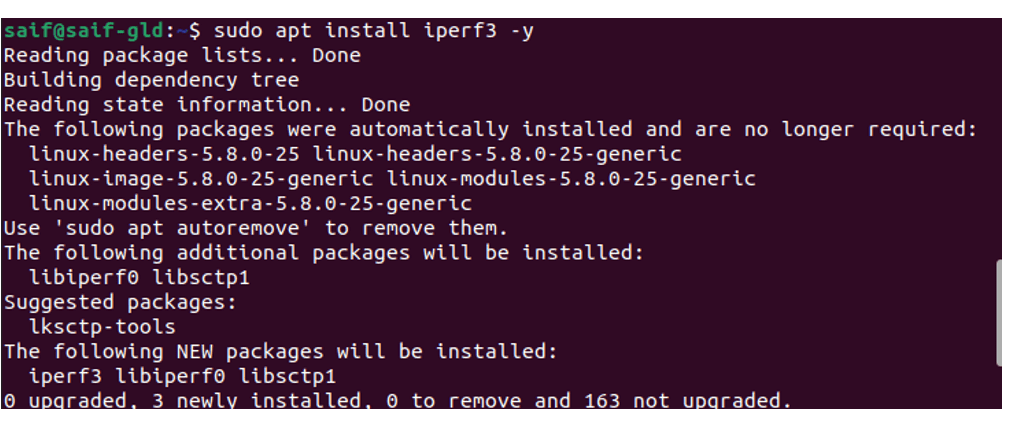
$ sudo apt install iperf3
If you want to use your Linux host as the iperf3 server, you need to open the TCP/UDP ports 5201 in firewalld (or iptables):
# firewall-cmd --permanent --add-port=5201/udp
 # firewall-cmd --permanent --add-port=5201/tcp
 # firewall-cmd --reload
Using iPerf on VMware ESXi
VMware removed the iPerf tool in ESXi 6.7 but brought it back in 6.7U1. Make sure you have iPerf installed on your ESXi host. Connect to the ESXi console via SSH, go to the /usr/lib/vmware/vsan/bin directory and check if it contains the iperf or iperf3 binary file.
If iPerf is not installed, you can manually download the iperf offline bundle here (http://vibsdepot.v-front.de/depot/bundles/iperf-2.0.5-1-offline_bundle.zip). Copy it to the ESXi host and install with the command:
# esxcli software vib install -d /iperf-2.0.5-1-offline_bundle.zip –no-sig-check
The tool will be installed to the /opt/iperf/bin directory. Use the following command to run iPerf on VMware ESXi:
# /opt/iperf/bin/iperf3
On the v-front website you can find a large number of community drivers and tools for ESXi. Scripts to add drivers to the ESXi installation image are also available here.
If you are running an iPerf server on an ESXi host, you need to open port 5201. This port is disabled by default in the ESXi firewall. To open them, you can temporarily disable the ESXi firewall:
# esxcli network firewall get
 # esxcli network firewall set --enabled=false
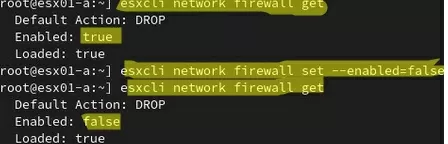
Don’t forget to enable the ESXi firewall after completing the network throughput test:
# esxcli network firewall set --enabled true
When running iPerf on ESXi, it must be bound to the vmkernel interface:
# esxcli network ip interface ipv4 get
You can check availability between ESXi hosts with vmkping command:
# vmkping IP_address
Run iPerf on the vmkernel IP address:
# iperf -s -B 192.168.31.50
Use iPerf Tool to Test Network Speed/Bandwidth
Let’s now look at some examples of using iPerf to test network throughput. In this example, we will use a Linux host as the iperf server. Let’s run the iperf in server mode:
# iperf3 –s
The iPerf server is running, it is waiting for connections on the 5201 TCP port.
Server listening on 5201.
Hint. iPerf arguments are case sensitive!
Depending on the firewall settings between the client and the server, you can change the listening port using the argument -p [port_number]. You can run the iPerf server with a large TCP window size and on a different TCP port. Use the command:
# iperf3 -s -w 32768 –p 5200
- -w 32768 – change the TCP windows size to 32 kB (by default it is about 8 kB);
- –p 5200 – the port on which iPerf is waiting for connections (note that iperf2 listens on port 5001 by default and iperf3 listens on port 5201).
You can run the iPerf server as a Windows Service using the -D argument.
I am using a computer with Windows 10 as an iPerf client. Open the command prompt and change to the directory with the iPerf executable:
cd c:\tools\iperf
In order to run a network bandwidth test from the client, specify the iPerf server address (or DNS name):
iperf3.exe -c 192.168.1.200
The client will start generating network traffic, test the connection for 10 seconds, and display the following table of results.
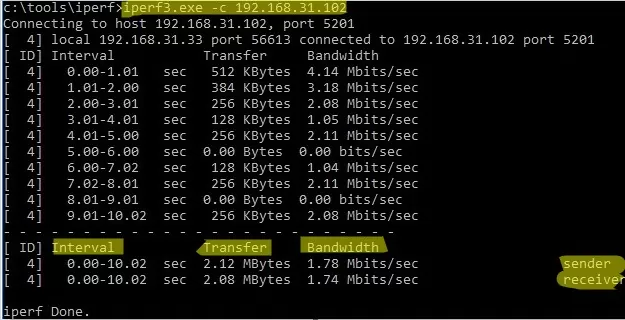
- Interval – testing interval (in sec.);
- Transfer – the size of the transferred data;
- Bandwidth – average data transfer rate.
If you started the iPerf server with an increased TCP window size, you can use the following command to get the maximum network load:
iperf3.exe -c 192.168.1.200 -P 8 -t 30 -w 32768 -i 5 -f g
- -c 192.168.1.200 – IP address of the iPerf server;
- -w 32768 – increase the TCP window size;
- -t 30 – test duration in seconds (10 seconds by default);
- -P 8 – is the number of parallel threads to get the maximum channel load;
- -i 5 – display iPerf statistics every 5 seconds. The parameter is convenient to use for long tests (several minutes, hours);
- -f m — display results in Mbps. Here you can use the kmgKMG values (kilobits, megabits, megabytes, gigabits, etc.).
In my example, the test lasted 30 seconds. In the final report, we are interested in the values of the Bandwidth column listed in the last [SUM] line. This shows the average speed of sending and receiving data over the network. In our case, the average network bandwidth between two hosts is 85.9 Mbit/s. 307 MB of data has been transferred (Transfer column) with the symmetric speed (sender=receiver).
You can run iPerf in reverse mode (the server sends data, and the client receives it). Use the -R option on the client for this.
By default, the iPerf generates TCP traffic, if you need to check your network bandwidth for UDP packets, you must use the –u option. In this case, you should start the iPerf server with the command: iperf3 -s –u).
If you need to test your Internet service provider bandwidth, you can use one of the public iPerf servers (the iPerf public host list is available here):
iperf3 -c iperf.scottlinux.com
Note that the iPerf3 server only accepts a single client connection simultaneously (multiple simultaneous client tests are allowed in iPerf2). If the iPerf server is currently servicing a client connection, you will receive an error: iperf3: error — the server is busy running a test. try again later.
If you need to measure the maximum network speed in both directions (in a duplex mode), use the –d option on the client:
iperf3.exe -c IP -P 8 -t 30 -w 32768 –d
While running a network test using iPerf, you can monitor your network connection throughput chart through the Task Manager.
It is important to note that, during the test, iPerf uses all available bandwidth of the communication channel between the client and server, which can negatively affect productive apps and users.
You can display the full list of the options as follows:
iperf3 –help
Iperf is an easy-to-use and handy network tool that helps you to measure network connection performance and maximum data transfer speed between two devices.
As a network engineer, most of the issues you may have to deal with are related to the performance of a network. There are multiple tools that we can use to troubleshoot performance issues. One among them is the iPerf, which can help you identify a given link bandwidth capacity.
You can have a server sitting on a remote location, be it Windows or Linux, and make your local machine act as an iPerf client.
Start sending the traffic by defining various parameters, and you would notice the traffic is sending back and forth between the iPerf client and the server. On both sides, it will tell you the exact throughput of the link; you are using to communicate with the remote location.
The most commonly used iPerf version is iPerf 2, and there is a recent release that is iPerf3 and the cool part about this tool because it is available on most operating systems.
We will be using iPerf3 to make the windows host the iPerf client and the Ubuntu Linux as the server. Regardless of the version and the operating systems, the iPerf commands will be the same.
How to install iPerf on a windows machine?
For a windows user, whether it is windows 10/11, or a server, you go to the iPerf site here. And in the download section, you can download the latest iperf windows release.
The downloaded file will be in a zip format, and you will have to extract them to your machine.
I would recommend you to either choose Desktop or C drive to keep them in a separate folder.
Right-click on the download file and click on Extract all.
In the destination, choose the location where you want to keep the iPerf files.
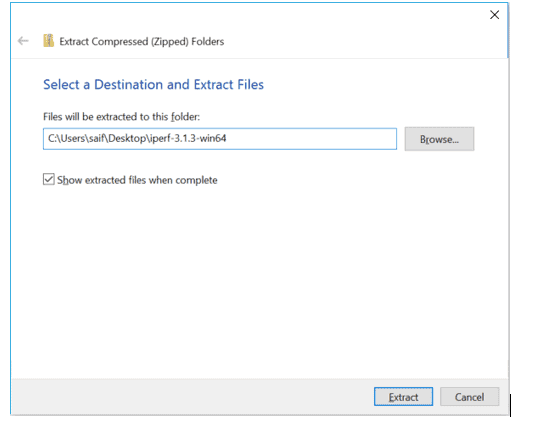
The iPerf files are extracted to my desktop folder in windows.
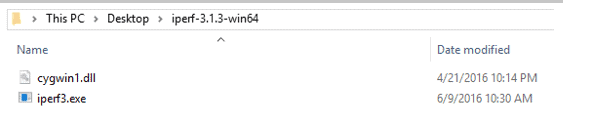
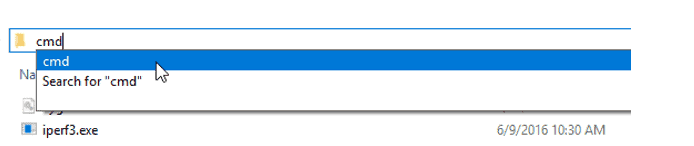
The iPerf software is not GUI based, and you will have to use the command utility to use the iPerf.
When you are in the iPerf folder, type the cmd and enter to open up the cmd in that specific location.
And while you are in the folder, you can type the dir command to list the same files in the iPerf folder.
C:\Users\saifudhe\Desktop\iPerf-3.1.3-win64>dir
 Volume in drive C is PC COE
 Volume Serial Number is 12CB-7D45
 Directory of C:\Users\saifudhe\Desktop\iPerf-3.1.3-win64
05/29/2021  08:25 PM    <DIR>          .
05/29/2021  08:25 PM    <DIR>          ..
04/21/2016  10:14 PM         3,539,372 cygwin1.dll
06/09/2016  10:30 AM           468,748 iPerf3.exe
               2 File(s)      4,008,120 bytes
               2 Dir(s)  28,996,456,448 bytes free
C:\Users\saifudhe\Desktop\iPerf-3.1.3-win64>
You now should be able to run iPerf commands on the windows machine from here.
How to install iPerf on Ubuntu?
The installation of iPerf on Ubuntu is pretty straightforward.
There are two packages available in Ubuntu; one is iPerf, version 2, and the other iPerf3 is version 3.
We will install version 3; enter the below commands to install the iPerf3 on the ubuntu machine.
sudo apt updatesudo apt install iPerf3 -y
Check the bandwidth from your Windows machine to ubuntu.
There are numerous commands under the iPerf program, and one can get confused at any time.
You can type the command iPerf3 -h to get the commands supported by the iPerf3.
-h stands for help.
Enable iPerf3 server.
First, we need to note the IP address of our iPerf server, and we will use one of the Ubuntu machines for that.
Type ip addr in the terminal to get the ip address of the Ubuntu machine.
saif@saif-gld:~$ ip addr | grep inet
    inet 127.0.0.1/8 scope host lo
    inet6 ::1/128 scope host
    inet 192.168.0.193/24 brd 192.168.0.255 scope global dynamic noprefixroute enp0s3
saif@saif-gld:~$
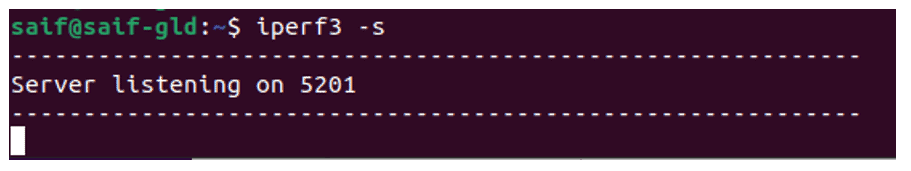
My IP address of the machine is 192.168.0.193, and we have already installed iPerf3 on the ubuntu machine. To enable the iPerf3 as a server on Ubuntu, you can enter the command below.
iperf3 -s
-s stands for server.
After you enter the command, you should see the server started to listen on port 5201
Initiate iPerf communication to the server.
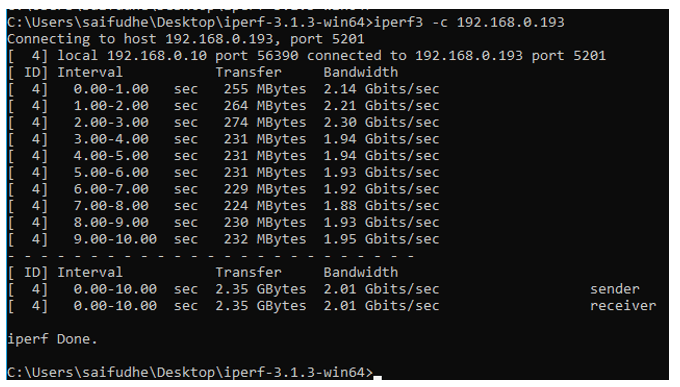
Now that we have the server running with iPerf, go to the windows machine and type the command iPerf3 -c <Server-IPaddress>
-c stands for the client; we already know the IP address of the server so that the command would be iperf3 -c 192.168.0.193
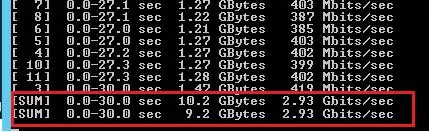
You should see the overall bandwidth from the windows machine to the ubuntu machine, which is 2Gbps.
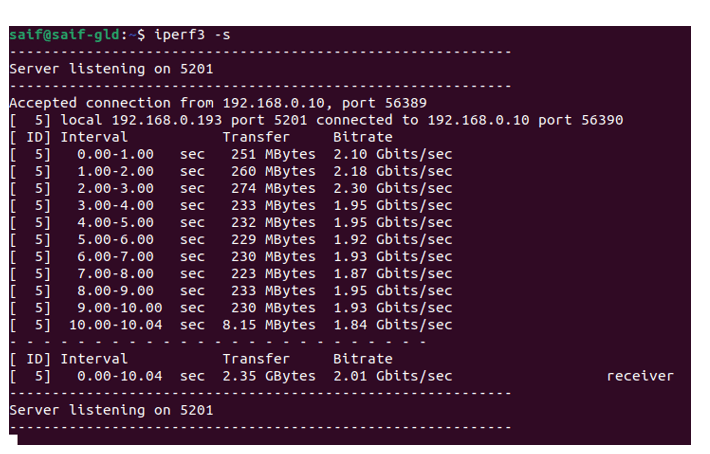
You will also get the same output from the iPerf server as well.
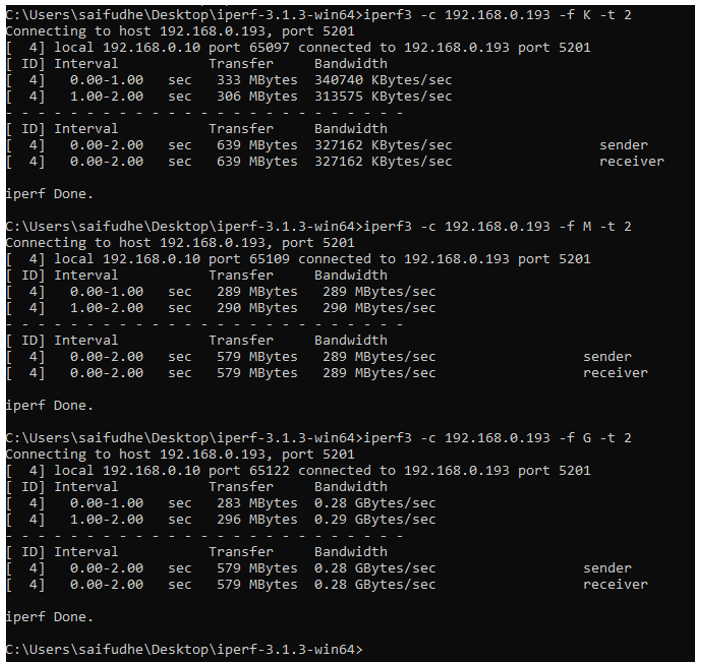
Change the bits to bytes.
The output above showed the bits per seconds, and if you wanted to change it to bytes per second, you could do so by using the format option which -f.
-f, –format [kmgKMG] format to report: Kbits, Mbits, KBytes, Mbytes
To show the output for all the format, I can use the time to 2 seconds (-t 2) instead of the default 10 seconds.
iPerf listens to different port numbers.
When you work on some network policies or advanced QoS policies, you might want to see how the packet behave before and after; the iPerf is very useful for that.
While enabling certain protocols, you need to make sure that the server is not using those specific services.
For example, if you try to Enable iPerf on the webserver that listens to Http / Https with port 80/443, you will get the error port is already in use.
iPerf3: error - unable to start listener for connections: Address already in useiperf3: exiting
You will have to shut the services if it is a lab and then try to run the iPerf, and it should work just fine.
You can enable the server to listen to the port number by typing -p and the port number.
Let’s see how we can enable the Http and Https traffic on the IPerf server, and we will test the same from the client machine.
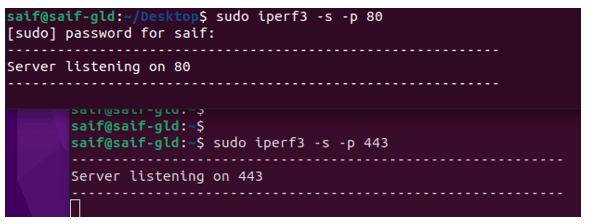
To enable the Http service port on iPerf, you can use the -p and the port number.
iperf3 -s -p 80
While iPerf is listening on port 80, you can also open another terminal and listen to another protocol, for example, Https.
iperf3 -s -p 443
On the iPerf client, our windows machine, we can now talk to the iPerf server on port 80 and 443.
You have to enter the command as follows.
iPerf3 -c 192.168.0.193 -p 80 -t 2
iPerf3 -c 192.168.0.193 -p 443 -t 2
Below is the output for the Http service.
C:\Users\saifudhe\Desktop\iPerf-3.1.3-win64>iPerf3 -c 192.168.0.193 -p 80 -t 2
Connecting to host 192.168.0.193, port 80
[  4] local 192.168.0.10 port 56428 connected to 192.168.0.193 port 80
[ ID] Interval           Transfer     Bandwidth
[  4]   0.00-1.00   sec   330 MBytes  2.77 Gbits/sec
[  4]   1.00-2.00   sec   316 MBytes  2.65 Gbits/sec
- - - - - - - - - - - - - - - - - - - - - - - - -
[ ID] Interval           Transfer     Bandwidth
[  4]   0.00-2.00   sec   646 MBytes  2.71 Gbits/sec                  sender
[  4]   0.00-2.00   sec   646 MBytes  2.71 Gbits/sec                  receiver
iPerf Done.
Here is the https traffic generated using iperf.
C:\Users\saifudhe\Desktop\iPerf-3.1.3-win64>
This is how the https service looks like.
C:\Users\saifudhe\Desktop\iPerf-3.1.3-win64>iPerf3 -c 192.168.0.193 -p 443 -t 2
Connecting to host 192.168.0.193, port 443
[  4] local 192.168.0.10 port 51598 connected to 192.168.0.193 port 443
[ ID] Interval           Transfer     Bandwidth
[  4]   0.00-1.00   sec   304 MBytes  2.55 Gbits/sec
[  4]   1.00-2.00   sec   271 MBytes  2.27 Gbits/sec
- - - - - - - - - - - - - - - - - - - - - - - - -
[ ID] Interval           Transfer     Bandwidth
[  4]   0.00-2.00   sec   576 MBytes  2.41 Gbits/sec                  sender
[  4]   0.00-2.00   sec   576 MBytes  2.41 Gbits/sec                  receiver
iPerf Done.
C:\Users\saifudhe\Desktop\iPerf-3.1.3-win64>
Simulate multiple connections from the iPerf.
When you have certain services running on a server, and you want to test them. You can do multiple user sessions in iPerf by using the parallel option. What does it do? It creates a separate session based on how much you specify.
For example, if you want to see how the Https traffic bandwidth shared when 10, users try to access it at the same time, you can do that by using parallel (-P)
I am going to run 10, iPerf sessions parallel to the Https service on default port 443.
You can see the source machine initiated the traffic with a random port number.
C:\Users\saifudhe\Desktop\iPerf-3.1.3-win64>iPerf3 -c 192.168.0.193 -p 443 -t 2 -P 10
Connecting to host 192.168.0.193, port 443
[  4] local 192.168.0.10 port 57280 connected to 192.168.0.193 port 443
[  6] local 192.168.0.10 port 57281 connected to 192.168.0.193 port 443
[  8] local 192.168.0.10 port 57282 connected to 192.168.0.193 port 443
[ 10] local 192.168.0.10 port 57283 connected to 192.168.0.193 port 443
[ 12] local 192.168.0.10 port 57284 connected to 192.168.0.193 port 443
[ 14] local 192.168.0.10 port 57285 connected to 192.168.0.193 port 443
[ 16] local 192.168.0.10 port 57286 connected to 192.168.0.193 port 443
[ 18] local 192.168.0.10 port 57287 connected to 192.168.0.193 port 443
[ 20] local 192.168.0.10 port 57288 connected to 192.168.0.193 port 443
[ 22] local 192.168.0.10 port 57289 connected to 192.168.0.193 port 443
[ ID] Interval           Transfer     Bandwidth
[  4]   0.00-1.00   sec  20.0 MBytes   168 Mbits/sec
[  6]   0.00-1.00   sec  44.8 MBytes   375 Mbits/sec
[  8]   0.00-1.00   sec  39.1 MBytes   328 Mbits/sec
[ 10]   0.00-1.00   sec  13.1 MBytes   110 Mbits/sec
[ 12]   0.00-1.00   sec  12.6 MBytes   106 Mbits/sec
[ 14]   0.00-1.00   sec  21.1 MBytes   177 Mbits/sec
[ 16]   0.00-1.00   sec  10.8 MBytes  90.1 Mbits/sec
[ 18]   0.00-1.00   sec  3.25 MBytes  27.2 Mbits/sec
[ 20]   0.00-1.00   sec  38.8 MBytes   325 Mbits/sec
[ 22]   0.00-1.00   sec  20.6 MBytes   173 Mbits/sec
[SUM]   0.00-1.00   sec   224 MBytes  1.88 Gbits/sec
- - - - - - - - - - - - - - - - - - - - - - - - -
[  4]   1.00-2.00   sec  21.1 MBytes   177 Mbits/sec
[  6]   1.00-2.00   sec  4.62 MBytes  38.8 Mbits/sec
[  8]   1.00-2.00   sec  19.2 MBytes   162 Mbits/sec
[ 10]   1.00-2.00   sec  16.0 MBytes   134 Mbits/sec
[ 12]   1.00-2.00   sec  18.9 MBytes   158 Mbits/sec
[ 14]   1.00-2.00   sec  30.5 MBytes   256 Mbits/sec
[ 16]   1.00-2.00   sec  18.1 MBytes   152 Mbits/sec
[ 18]   1.00-2.00   sec  15.5 MBytes   130 Mbits/sec
[ 20]   1.00-2.00   sec  11.2 MBytes  94.4 Mbits/sec
[ 22]   1.00-2.00   sec  31.1 MBytes   261 Mbits/sec
[SUM]   1.00-2.00   sec   186 MBytes  1.56 Gbits/sec
- - - - - - - - - - - - - - - - - - - - - - - - -
[ ID] Interval           Transfer     Bandwidth
[  4]   0.00-2.00   sec  41.1 MBytes   172 Mbits/sec                  sender
[  4]   0.00-2.00   sec  40.9 MBytes   172 Mbits/sec                  receiver
[  6]   0.00-2.00   sec  49.4 MBytes   207 Mbits/sec                  sender
[  6]   0.00-2.00   sec  49.1 MBytes   206 Mbits/sec                  receiver
[  8]   0.00-2.00   sec  58.4 MBytes   245 Mbits/sec                  sender
[  8]   0.00-2.00   sec  58.2 MBytes   244 Mbits/sec                  receiver
[ 10]   0.00-2.00   sec  29.1 MBytes   122 Mbits/sec                  sender
[ 10]   0.00-2.00   sec  28.9 MBytes   121 Mbits/sec                  receiver
[ 12]   0.00-2.00   sec  31.5 MBytes   132 Mbits/sec                  sender
[ 12]   0.00-2.00   sec  31.3 MBytes   131 Mbits/sec                  receiver
[ 14]   0.00-2.00   sec  51.6 MBytes   217 Mbits/sec                  sender
[ 14]   0.00-2.00   sec  51.5 MBytes   216 Mbits/sec                  receiver
[ 16]   0.00-2.00   sec  28.9 MBytes   121 Mbits/sec                  sender
[ 16]   0.00-2.00   sec  28.8 MBytes   121 Mbits/sec                  receiver
[ 18]   0.00-2.00   sec  18.8 MBytes  78.6 Mbits/sec                  sender
[ 18]   0.00-2.00   sec  18.6 MBytes  78.2 Mbits/sec                  receiver
[ 20]   0.00-2.00   sec  50.0 MBytes   210 Mbits/sec                  sender
[ 20]   0.00-2.00   sec  49.8 MBytes   209 Mbits/sec                  receiver
[ 22]   0.00-2.00   sec  51.8 MBytes   217 Mbits/sec                  sender
[ 22]   0.00-2.00   sec  51.6 MBytes   216 Mbits/sec                  receiver
[SUM]   0.00-2.00   sec   410 MBytes  1.72 Gbits/sec                  sender
[SUM]   0.00-2.00   sec   409 MBytes  1.71 Gbits/sec                  receiver
iPerf Done.
C:\Users\saifudhe\Desktop\iPerf-3.1.3-win64>
Though I have added the timer as 2, the output was still long.