Температура процессора — один из ключевых показателей, влияющих на производительность и долговечность вашего компьютера. Перегрев может привести к снижению скорости работы, неожиданным перезагрузкам и даже к поломке компонентов.
Зачем знать
Какой должна быть
Как узнать
На Linux
На macOS
Как снизить
Чек-лист
Зачем знать
Какой должна быть
Как узнать
На Linux
На macOS
Как снизить
Чек-лист
В этом руководстве мы расскажем, как посмотреть температуру процессора на ноутбуке или ПК с операционными системами Windows 7, 10, 11, Linux или macOS. Вы узнаете, как проверить температуру процессора с помощью специализированных программ, через командную строку или BIOS.
Зачем знать температуру процессора

Контроль температуры процессора важен по нескольким причинам:
- Предотвращение перегрева и поломок. Высокая температура может привести к перегреву процессора, что в свою очередь может вызвать аварийное отключение компьютера или его зависание. Постоянный перегрев также ускоряет износ компонентов.
- Оптимизация производительности. При перегреве процессор может автоматически снижать свою тактовую частоту, чтобы уменьшить выделение тепла. Это явление называется троттлингом и приводит к снижению производительности системы.
- Удлинение срока службы компонентов. Поддержание оптимальной температуры помогает продлить срок службы процессора и других компонентов компьютера. Высокие температуры могут повредить не только процессор, но и другие важные элементы системы.
Какой должна быть температура процессора

Температура процессора является важным показателем его работоспособности и долговечности. В целом, в норме температура процессора должна быть в пределах 30−40°C в состоянии простоя и до 70−80 °C под нагрузкой. Однако эти значения могут варьироваться в зависимости от модели процессора и условий эксплуатации.
- В состоянии простоя, когда компьютер не выполняет интенсивные задачи, температура процессора обычно находится в диапазоне от 30 до 45 . Это нормальный уровень, который не вызывает беспокойства и не требует дополнительных мер по охлаждению.
- При выполнении ресурсоемких задач, таких, как игры, рендеринг видео или работа с большими объемами данных, температура процессора может повышаться до 70−80 °C. Это допустимый уровень, но важно следить за тем, чтобы температура не превышала эти значения, так как это может привести к перегреву и снижению производительности.
- Максимальная допустимая температура для большинства современных процессоров составляет около 90−100 °C. При достижении этих значений процессор может автоматически снижать свою тактовую частоту (троттлинг) или даже отключаться, чтобы предотвратить повреждение.
Способы узнать температуру процессора на ПК с Windows
Существует несколько способов узнать температуру процессора на ПК с Windows. Одни предполагают использование специализированного софта, другие позволяют обойтись и без них. Рассмотрим все способы подробнее.
Без программ
Для того, чтобы посмотреть текущую температуру ЦП, необязательно даже устанавливать специальные утилиты. Достаточно воспользоваться командной строкой или зайти в BIOS.
Через командную строку
- Нажмите комбинацию клавиш Win+R, введите cmd и нажмите Enter.
- Введите следующую команду и нажмите Enter:
wmic /namespace:\\root\wmi PATH MSAcpi_ThermalZoneTemperature get CurrentTemperature
Температура будет отображена в градусах Кельвина. Для перевода в Цельсий используйте формулу: t°C = t°K — 273,15
Через UEFI (BIOS)
- Сразу после включения компьютера нажмите клавишу для входа в UEFI (обычно это Del, F2, Esc или F10).
- В UEFI найдите раздел Hardware Monitor или System Health, где будет отображена температура процессора в реальном времени.
С помощью программ
Среди утилит для мониторинга состояния «железа» наиболее популярны три: AIDA 64, MSI Afterburner и SpeedFan.
AIDA64
- Скачайте программу с официального сайта и установите ее.
- Перейдите в раздел «Компьютер» > «Датчики».
- В разделе датчиков будет указана температура процессора и других компонентов в реальном времени.
MSI Afterburner
- Скачайте программу с официального сайта и установите ее.
- В настройках программы включите отображение температуры процессора.
- Температура будет отображена на панели задач.
SpeedFan
- Скачайте программу с официального сайта и установите ее.
- Перейдите в раздел «Температуры».
- В разделе температур будет указана температура процессора и других компонентов.
Методы проверки температуры процессора на Linux

На Linux существует несколько способов проверки температуры процессора, включая использование командной строки и графических приложений. Рассмотрим их подробнее.
Использование командной строки
- Откройте терминал и введите команду для установки необходимых пакетов: sudo apt install lm-sensors hddtemp.
- Запустите сканирование датчиков. Введите команду: sudo sensors-detect.
- Ответьте Yes на все запросы для завершения сканирования.
Чтобы посмотреть температуру, введите команду sensors. Эта команда отобразит текущую температуру процессора и других компонентов.
Для постоянного мониторинга используйте команду watch sensors. Эта команда будет обновлять данные каждые две секунды.
Использование Psensor
- Введите команду для установки приложения: sudo apt install psensor.
- После установки запустите приложение Psensor.
В настройках Psensor можно включить отображение температуры процессора в панели задач.
Как посмотреть температуру процессора на macOS

На macOS существует несколько способов проверки температуры процессора, включая использование встроенных инструментов и сторонних приложений. Рассмотрим их подробнее.
Использование Terminal
- Найдите Terminal через Spotlight или в папке «Программы» > «Утилиты».
- Введите следующую команду и нажмите Enter: sudo powermetrics —samplers smc |grep -i «CPU die temperature».
- Введите пароль администратора, когда будет запрошено.
Температура процессора будет отображена в списке значений.
Использование приложения Hot
- Скачайте приложение Hot с сайта разработчика iMazing.
- Запустите приложение Hot, и его иконка появится в меню.
Температура процессора будет отображена рядом с иконкой в меню. Вы также можете настроить отображение температуры в градусах Цельсия или Фаренгейта.
Как можно снизить температуру процессора

Снижение температуры процессора важно для поддержания его производительности и долговечности. Рассмотрим несколько эффективных методов.
1. Очистка системы охлаждения
Регулярная очистка вентиляторов и радиаторов от пыли помогает улучшить охлаждение. Пыль может замедлять вращение вентиляторов и снижать эффективность охлаждения. Используйте баллончик со сжатым воздухом для очистки вентиляторов и радиаторов.
2. Замена термопасты
Термопаста помогает улучшить теплопередачу между процессором и радиатором. Со временем она может высыхать и терять свои свойства. Рекомендуется менять термопасту каждые пару лет.
3. Улучшение вентиляции корпуса
Обеспечьте хорошую циркуляцию воздуха внутри корпуса. Убедитесь, что кабели не препятствуют продуваемости, и установите дополнительные вентиляторы, если это необходимо. Также важно, чтобы корпус компьютера находился в хорошо вентилируемом месте.
4. Оптимизация настроек питания
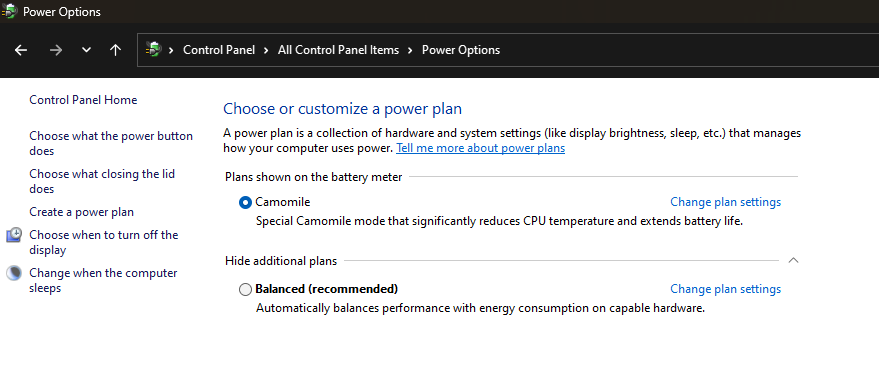
Снижение максимальной мощности процессора может помочь уменьшить его температуру. В Windows это можно сделать через настройки питания:
- Откройте «Панель управления» и выберите «Электропитание».
- Измените план питания на «Сбалансированный».
- Если это не поможет, то выберите план «Экономия энергии».
5. Использование качественного кулера
Инвестиции в качественный процессорный кулер могут значительно снизить температуру процессора. Существуют различные модели кулеров, которые обеспечивают более эффективное охлаждение по сравнению со стандартными. В первую очередь стоит присмотреться к башенным разновидностям.
Чек-лист: как посмотреть температуру процессора
Для удобства и быстроты проверки температуры процессора, следуйте следующему чек-листу:
- Используйте приложение SpeedFan для Windows, Psensor для Linux или Hot для macOS.
- Чтобы перевести температуру в кельвинах в градусы Цельсия, используйте формулу t°C = t°K — 273,15.
- В общем случае нормальной считается температура ЦП в пределах 30−40 °C в состоянии простоя и до 70−80 °C под нагрузкой.
- Если температура вашего процессора превышает вышеназванные пределы, то, скорее всего, есть проблемы с охлаждением.
- Чтобы снизить температуру процессора, замените кулер и улучшите вентиляцию корпуса.
Загляните в BIOS/UEFI, используйте стороннее приложение или утилиту для настройки процессора
Что нужно знать
В Windows 11 нет встроенного прибора для измерения температуры процессора, но ее можно проверить в UEFI или с помощью сторонних приложений.
Использование UEFI: «Настройки» > «Система» > «Восстановление» > «Перезагрузить сейчас». Нажмите «Устранение неполадок» > «Дополнительные параметры» > «Параметры прошивки UEFI», затем перезагрузите.
В этой статье мы расскажем, как проверить температуру процессора в Windows 11.
Как посмотреть температуру процессора в Windows 11
В Windows 11 нет встроенного прибора для проверки температуры процессора, но ее можно проверить в UEFI или BIOS перед запуском Windows. Если необходимо отслеживать температуру процессора во время работы Windows 11, можно воспользоваться сторонним приложением, например Speccy, или утилитой от производителя процессора, графического процессора или периферийного устройства.
Некоторые периферийные устройства, например игровые мыши и гарнитуры, содержат программное обеспечение, позволяющее проверять и отслеживать температуру процессора и графического процессора в режиме реального времени. Такое ПО обычно предназначено для управления конкретным периферийным устройством, но оно может быть полезно и для проверки температуры процессора без установки дополнительного ПО. Intel и AMD также предоставляют инструменты для проверки температуры процессора, которые обычно поставляются в комплекте с утилитами для разгона. Например, вы можете проверить температуру процессора с помощью утилиты Extreme Tuning Utility от Intel и приложения Ryzen Master от AMD.
Проверка температуры процессора с помощью UEFI
UEFI и BIOS – это типы микропрограмм, которые отвечают за запуск компьютера перед началом работы Windows 11. Каждый компьютер имеет либо UEFI, либо BIOS, и обычно в них можно проверить температуру процессора, поэтому этот способ подойдет вам, если вы не хотите устанавливать дополнительное программное обеспечение и у вас нет приложения, способного отображать температуру процессора.
Недостатком этого метода является то, что доступ к UEFI или BIOS возможен только в процессе загрузки, до запуска Windows 11, поэтому с его помощью нельзя узнать температуру процессора во время работы, игры или выполнения других ресурсоемких задач, которые могут привести к нагреву процессора.
Внимание: Температура процессора не всегда отображается в BIOS или UEFI. Если в вашем случае она не отображается, необходимо перезапустить Windows 11 и проверить температуру с помощью стороннего приложения.
Вот как проверить температуру процессора с помощью UEFI или BIOS:
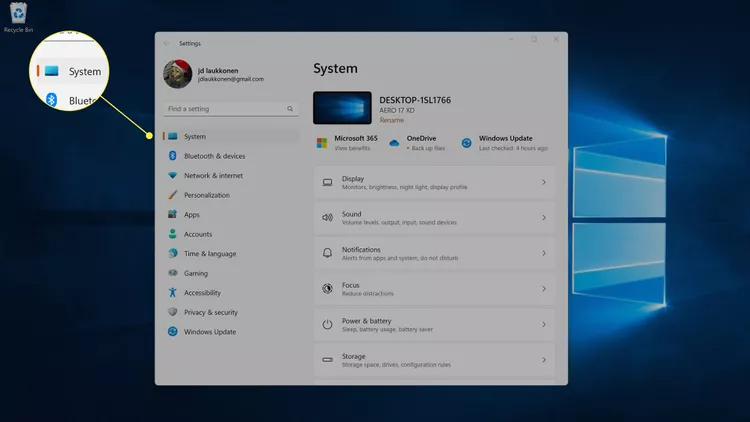
1. Откройте «Настройки» и нажмите «Система».
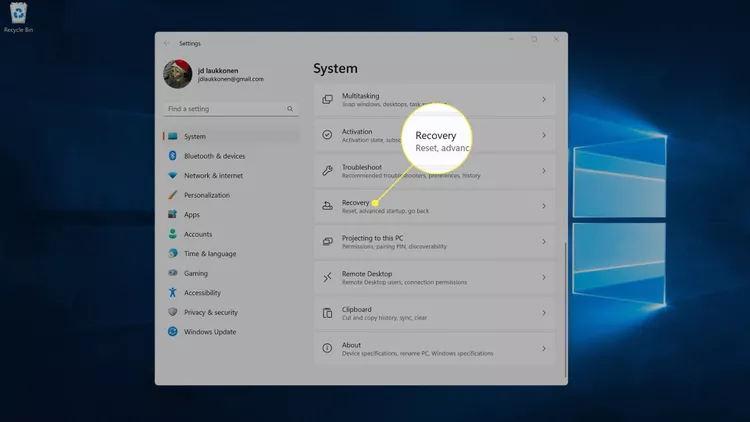
2. Нажмите «Восстановление».
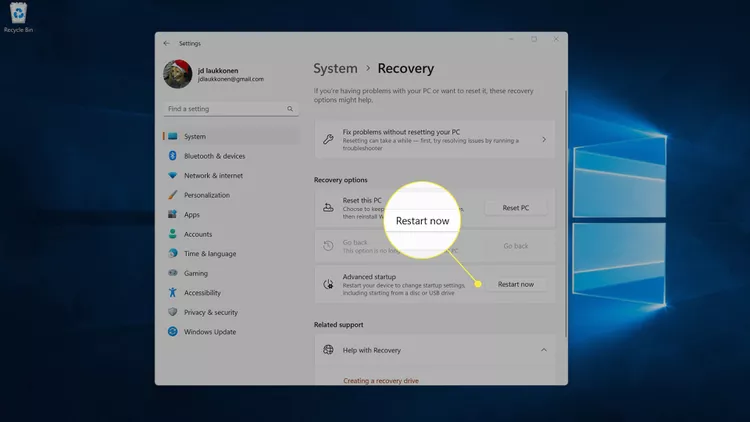
3. В параметрах восстановления нажмите «Перезагрузить сейчас».
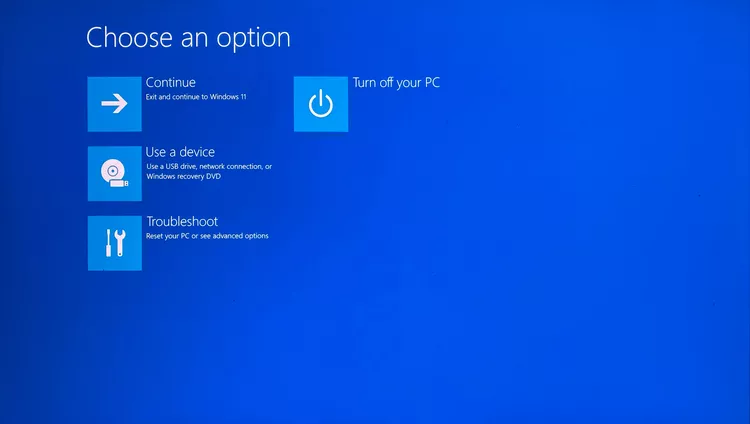
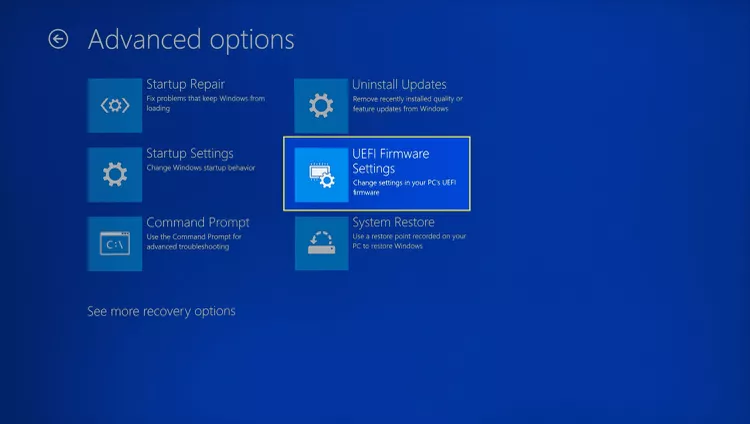
4. Компьютер перезагрузится. При появлении экрана параметров запуска нажмите «Устранение неполадок».
5. Щелкните «Дополнительные параметры».

6. Щелкните «Параметры прошивки UEFI».
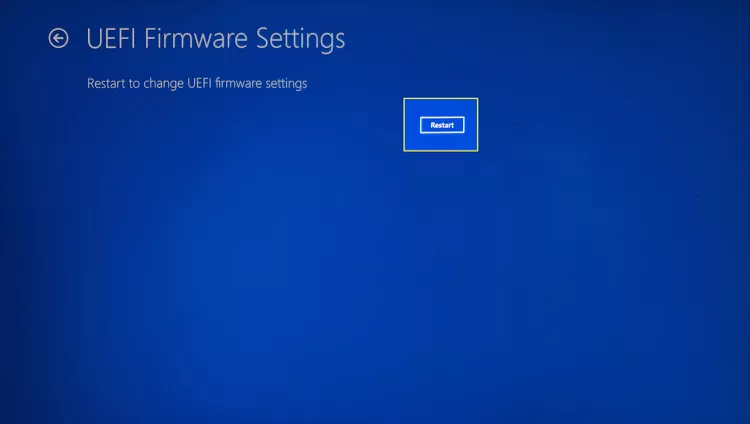
7. Нажмите кнопку «Перезагрузка».
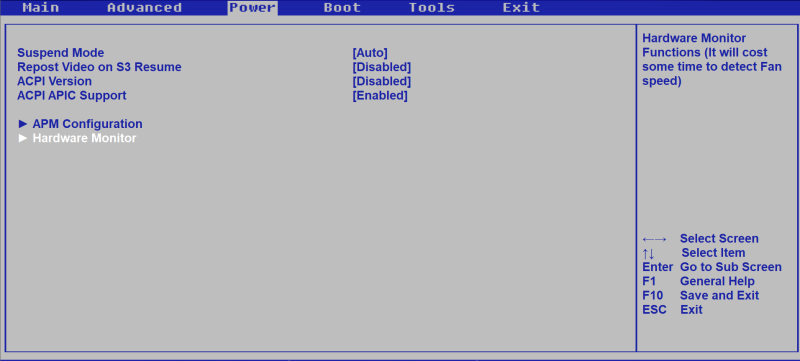
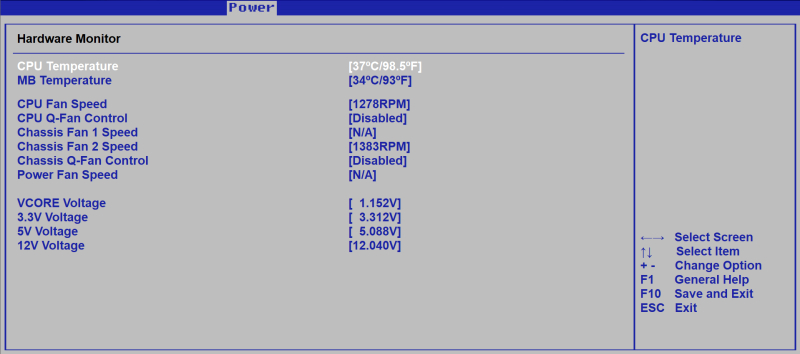
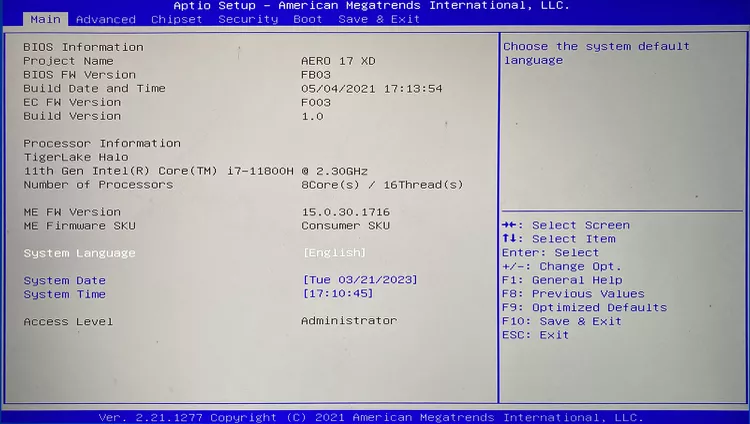
8. Когда компьютер перезагрузится и загрузится главный экран UEFI, найдите пункт CPU Core Temperature. Если температура процессора не отображается на главном экране, перейдите к пункту меню «Advanced», «Power» или «H/W Monitor» с помощью клавиш со стрелками и выберите его, нажав клавишу Enter.
Как посмотреть температуру процессора в Windows 11 с помощью Speccy
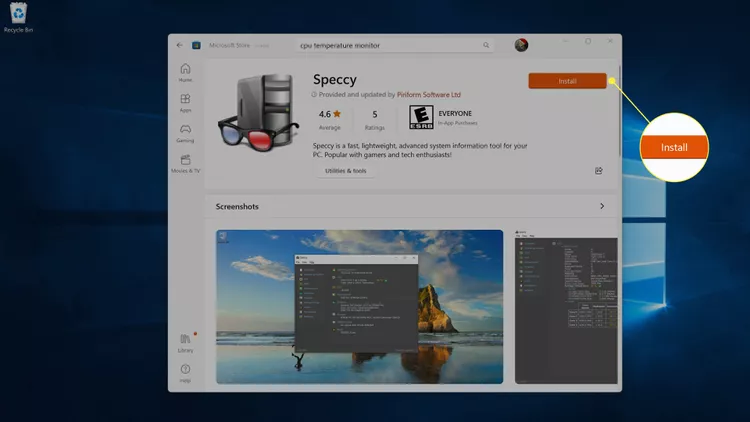
Существует множество приложений, которые могут отображать температуру процессора в Windows 11, но Speccy – это популярный вариант с высоким рейтингом, доступный прямо в Microsoft Store.
Вот как проверить температуру процессора в Windows 11 с помощью Speccy:
1. Загрузите и установите Speccy из Магазина Windows.
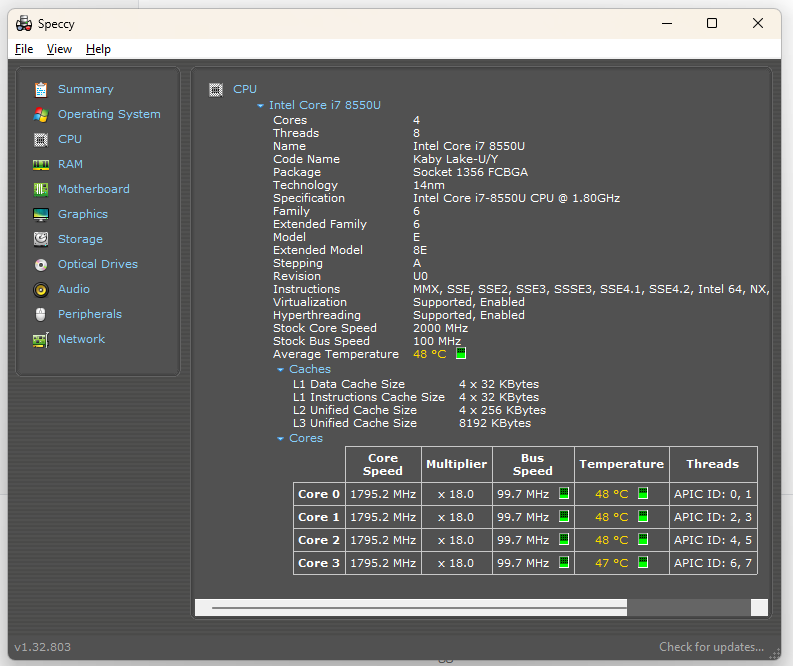
2. Откройте Speccy и нажмите «CPU» в меню слева для получения дополнительной информации.
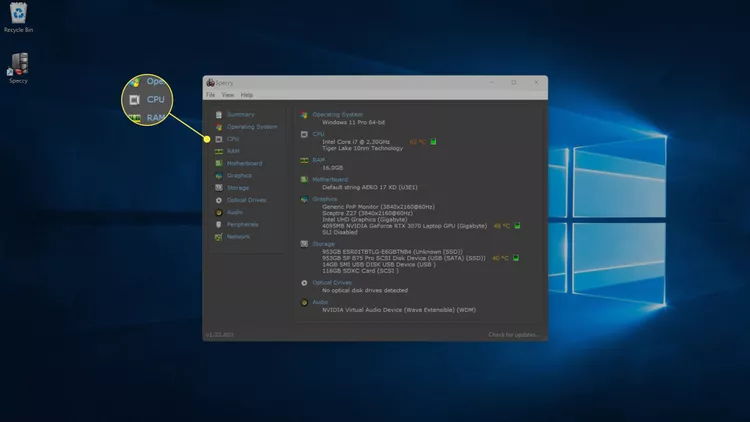
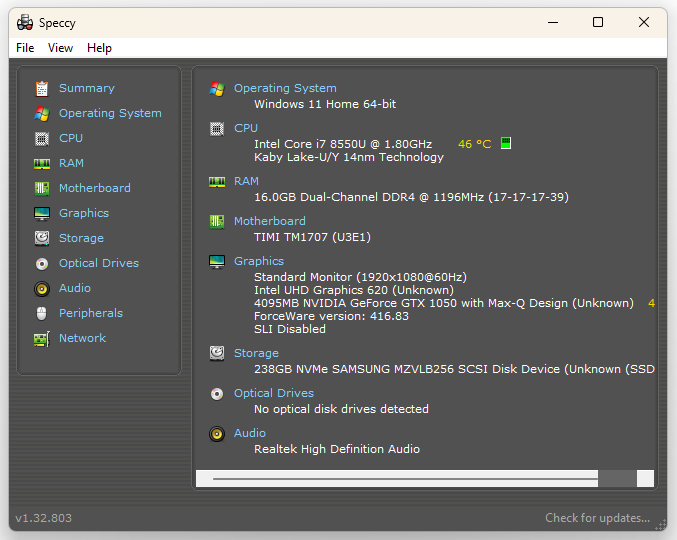
Примечание: Вы также можете посмотреть общую температуру процессора, отметив раздел «CPU» на вкладке «Summary».
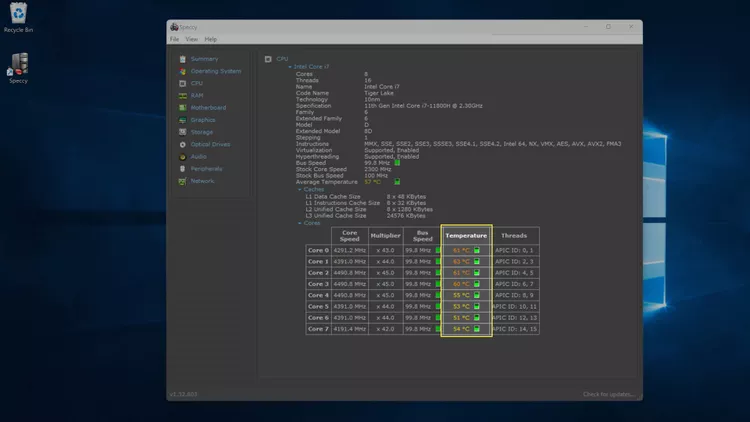
3. На вкладке CPU можно увидеть температуру каждого отдельного ядра процессора.
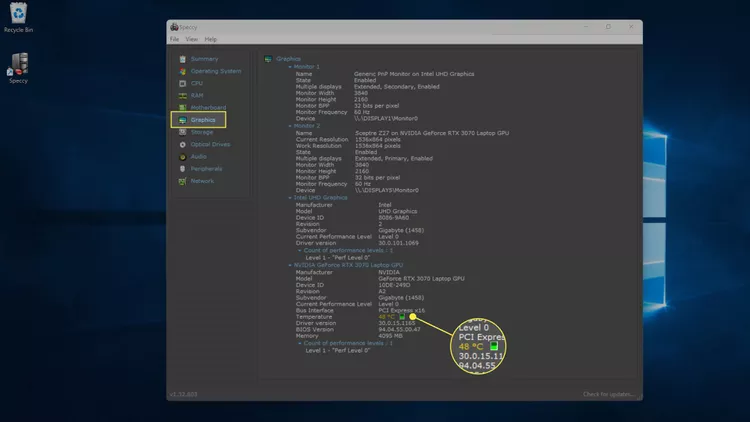
4. Для просмотра температуры графического процессора можно также перейти на вкладку «Graphics».
Как посмотреть температуру процессора в Windows 11 с помощью других приложений
Если у вас есть игровая мышь, клавиатура или гарнитура с приложением для настройки или мониторинга, оно может отображать температуру процессора. У компаний Intel и AMD есть приложения, используемые для разгона процессора, и они могут отображать температуру процессора.
Примечание: В следующих примерах показано, как посмотреть температуру процессора в Windows 11 с помощью Extreme Tuning Utility от Intel и iCue от Corsair. Если у вас процессор AMD или игровая периферия другого производителя, то приложения будут выглядеть иначе.
Вот как определить температуру процессора в программах Extreme Tuning Utility от Intel и iCue от Corsair:
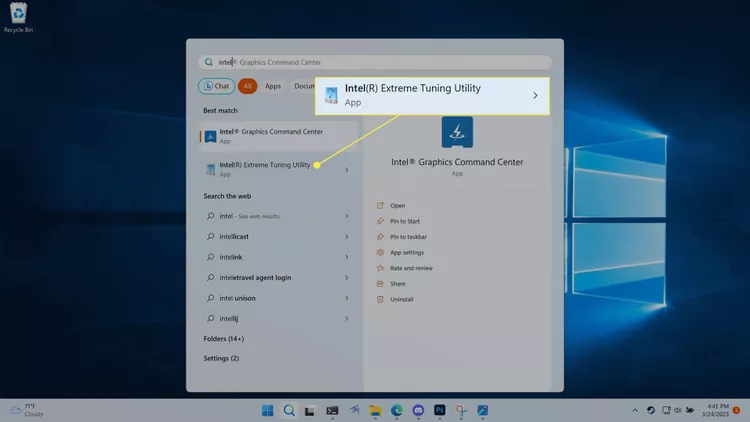
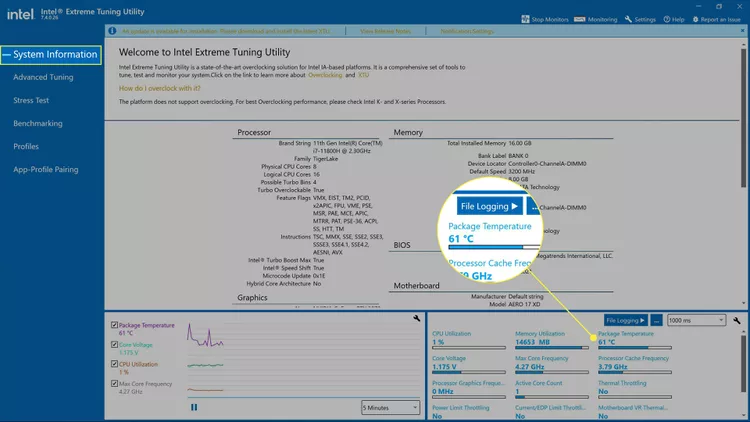
1. Щелкните лупу на панели задач и введите «Intel». Затем в появившихся результатах поиска выберите «Intel Extreme Tuning Utility».
2. Щелкните «System Information» и найдите в правом нижнем углу пункт «Package Temperature» (Температура корпуса). Можно также щелкнуть «Monitoring», чтобы получить список всех мониторов.
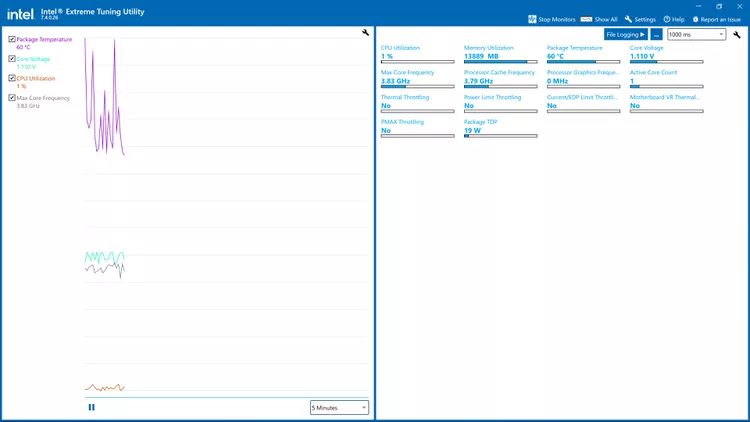
3. На экране «Monitoring» представлен список всех доступных мониторов, а также температура процессора.
4. В других приложениях сторонних разработчиков, включая iCue, необходимо открыть приложение, а затем выбрать пункт «Dashboard» или «Monitors».
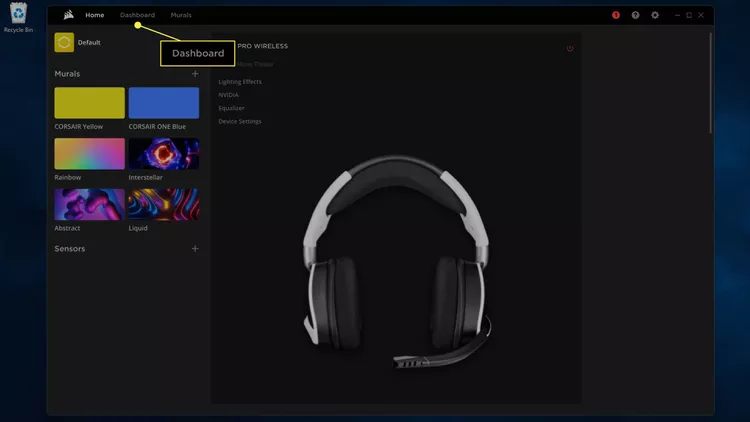
5. Здесь можно увидеть температуру каждого отдельного ядра и температуру графического процессора.
FAQ
Какова оптимальная температура для процессора?
Температура процессора зависит от его типа, но можно ожидать, что температура простоя (без работающих ресурсоемких приложений) будет составлять около 38°C. Многие процессоры после определенной отметки, например, 100°C запускают тепловое регулирование, что может повлиять на производительность компьютера. Проверьте характеристики вашего процессора, чтобы узнать его обычную рабочую температуру.
Как снизить температуру процессора?
Для предотвращения перегрева процессора можно воспользоваться недорогими способами: убедиться, что вентиляционные отверстия в корпусе не засорены, и выключить неиспользуемые программы. В качестве альтернативы можно установить что-то вроде системы водяного охлаждения.
Download Article
Keep an eye on processor temperatures with these simple methods
Download Article
- Core Temp
- UEFI / BIOS
- Afterburner
- Speccy
- Ryzen Master
- Extreme Tuning Utility
- Temperature Ranges
- Reduce CPU Temps
|
|
|
|
|
|
|
If you’re worried your Windows 11 PC might be getting too hot, it’s easy to check its temperature. There are plenty of free apps that make monitoring CPU temperatures easy, including Core Temp, Speccy, and Afterburner. If you don’t want to install software, you can typically find the current CPU temp in the UEFI or BIOS. This wikiHow article will teach you simple ways to check the CPU temp in Windows 11. We’ll also help you determine which processor temperatures are normal and help you lower your CPU temp in general.
Things You Should Know
- To monitor your CPU temp while gaming, install MSI Afterburner, which should work with any discrete graphics card.
- Install Core Temp for a free, lightweight CPU monitoring tool, or try Speccy if you also want to monitor other hardware.
- While gaming in Windows 11, you can expect CPU temps of about 55-65 C (131-149 F).
-

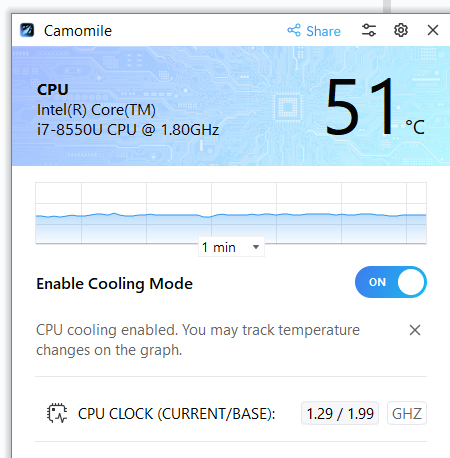
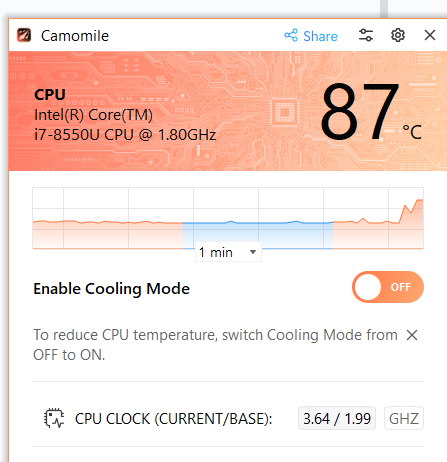
Download Core Temp from https://www.alcpu.com/CoreTemp. This free tool offers quick and easy access to your CPU temp from within Windows 11. Because Core Temp shows CPU temperature changes in real time, it’s a handy tool for checking CPU temp during gameplay, video editing, and other CPU-intensive tasks.
- Core Temp’s installer comes with extra software that helps keep the app free. When installing, you can uncheck the extra software options on the «Select Additional Tasks» screen to skip installing those titles.
-
Once installed, you’ll find the app in your Start menu. As soon as the app launches, you’ll see your processor details, number of cores, and the temperature of each core.
Advertisement
-
Check your CPU temp when you’re doing CPU-intensive tasks to make sure it’s not overheating. You can also enable Overheat Protection, which alerts you if your CPU reaches a critical heat level. To view Overheat Protection settings, go to Options > Overheat Protection.


Advertisement
-
If you want to see the current CPU temperature, you may be able to find this information in the UEFI, depending on your motherboard. This typically won’t display historical CPU stats, but it is a handy way to see the current operating temperature. Here’s an easy way to get to the BIOS or UEFI from Windows 11:[1]
- If you know your PC’s BIOS/UEFI startup key, you can enter the BIOS by rebooting your PC and tapping the setup key repeatedly as soon as it switches back on. If not, continue with this method.
- Type advanced startup into the Windows search bar.
- Click Change advanced startup options.
- Click Restart Now in the right panel. Your PC will reboot to a blue «Choose an option» screen.
- Click Troubleshoot on the blue screen.
- Select Advanced Options.
- Click UEFI Firmware Settings.
- Click Restart.
-
The location of the CPU temperature will vary by model, but it should be visible in most UEFI and BIOS environments.
- You may also find other temperature statistics, such as the GPU and ambient motherboard temperature.


Advertisement
-
This GPU monitoring tool for gamers also makes it easy to monitor your CPU temperature in real time. You can even overlay your CPU temperature information when full-screen gaming so you don’t have to tab back and forth to check your CPU temp. You don’t need an MSI graphics card to use Afterburner, but your Windows 11 PC will need a separate graphics card.
- To install, go to https://www.msi.com/Landing/Afterburner/graphics-cards and click Download Afterburner.
- Unzip the downloader, then double-click the installer.
- When prompted, install both Afterburner and the Statistics Server. The Statistics Server installer will launch as soon as Afterburner is installed.
-
You’ll see the gear on the left side of the tool.
-
This displays a list of properties you can monitor using the gaming overlay.[2]
-
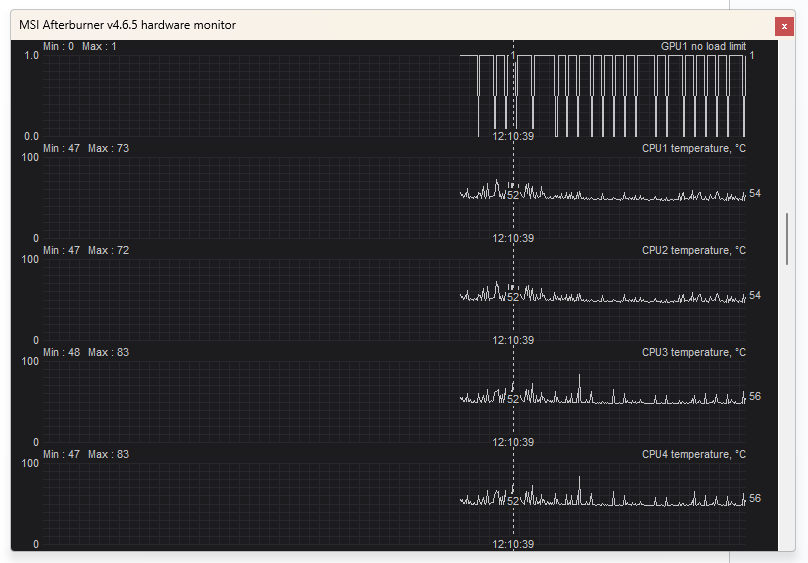
Afterburner reports the temperature for each of your CPU’s threads. You can also add your overall CPU temperature to the overlay. Here’s how:
- Each CPU thread temperature (e.g., CPU1 temperature, CPU2 temperature, etc.) should be selected by default. If you only want to monitor CPU temperature, you can uncheck other options now, though monitoring RAM usage and framerates can also be helpful.
- Add a checkmark to «CPU temperature» if not already selected. This ensures that your overall CPU temp is reported on the overlay.
- Click each CPU temperature item you checked, then check the box next to «Show in On-Screen Display.» Do this for each CPU thread and any other details you want to appear on the overlay.
- Click Apply and then OK.
-
Once open, you should now see Afterburner’s on-screen display. As you play, you’ll be able to monitor your CPU temperature over time.


Advertisement
-
-
Once installed, you’ll find it in the Start menu or by searching. The first time you launch the app, it’ll take a few moments to survey your system specs. Once the process is complete, you’ll see some general system information.
-
You’ll see this option in the left panel.
-
At the top, you’ll see your CPU’s general temperature, which is an average from each CPU core. You can see temperatures by core in the «Cores» section a little further down the panel.


Advertisement
-
-
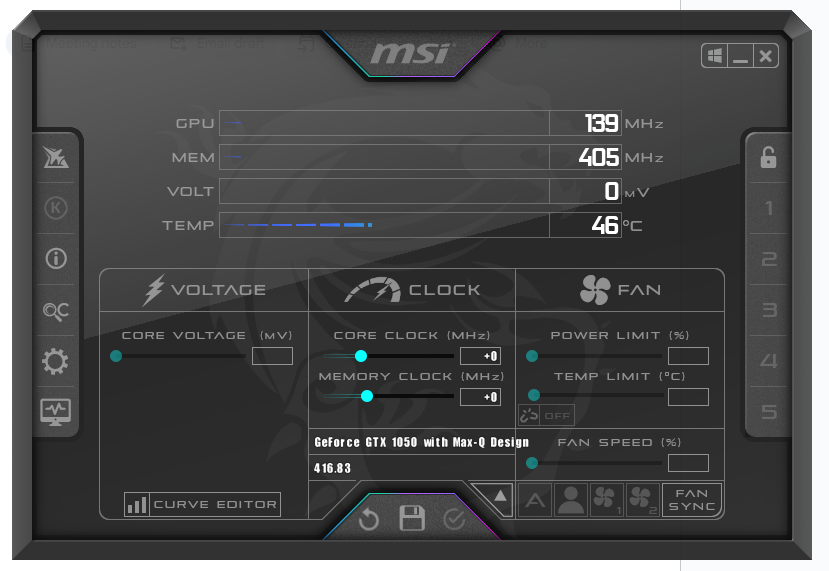
When you launch the app, you’ll immediately see your current CPU temperature, the maximum allowable temperature, clock speed, voltage, and other details in Basic view.[4]
-
Here, you’ll find a better breakdown of the CPU temperature by core.


Advertisement
-
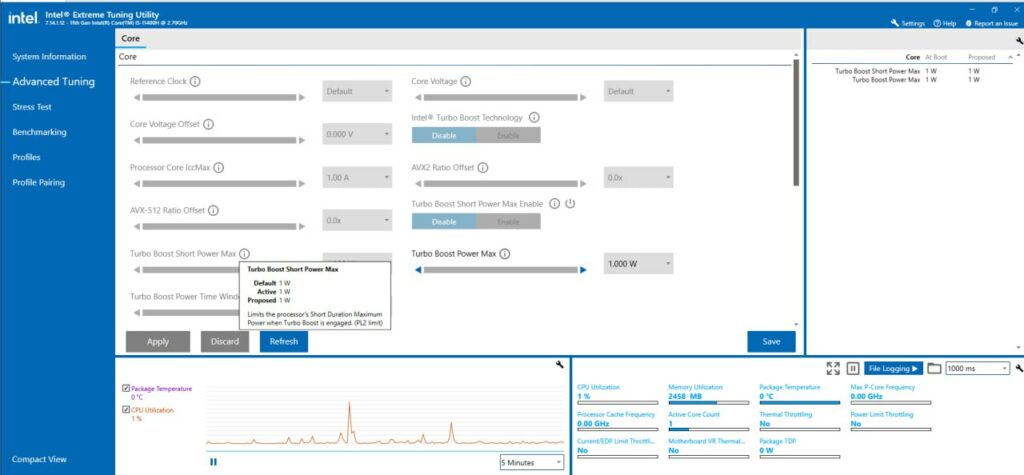
If you have an Intel K or X series processor, you can use Extreme Tuning Utility to monitor CPU temperatures in Windows 11. This tool will show your CPU temperatures over time on a handy graph.
- Go to https://www.intel.com/content/www/us/en/download/17881/29183/intel-extreme-tuning-utility-intel-xtu.html
- Look for your CPU model in the list at the bottom of the page to make sure the tool will work for you. To check your CPU model, type msinfo32 into the Windows Search bar, press Enter, and look at the «Processor» entry.
- If supported, click the Download XTUSetup.exe button to download the installer.
-
You’ll need to run the installer as an administrator. Here’s how:
- Open your Downloads folder.
- Right-click XTUSetup.exe and select Run as administrator.
- Click Yes.
- Agree to the terms and follow the on-screen instructions.
- Once installed, click Restart when prompted to restart your PC.
-
Once installed, you’ll find this app in your Windows 11 Start menu. You’ll then see the Advanced Tuning option in the left panel.[5]
-
By default, your overall CPU temperature is monitored and represented by the purple line. You can monitor individual CPU core temperatures, memory utilization, and other options by clicking the wrench icon, selecting your preferences, and clicking Save.[6]


Advertisement
-
During normal use, such as web browsing, word processing, and social media activity, expect temps of about 40-65 degrees C (104-149 F). For heavy gaming and other CPU-intensive tasks, the temp will usually go up to about 55-65 C (131-149 F). If temps exceed 70-90 degrees C (160-195 F), it’s time to investigate.[7]

-
If you’re trying to do too many CPU-intensive things at once, your CPU core temperatures can rise. To see what’s running, press Ctrl + Shift + Esc. You can then click the CPU column at the top of Task Manager to sort processes in order of CPU usage.
-
Keep your computer out of direct sunlight, away from heating vents, and free from anything that can block its air vents. If you’re using a desktop PC, don’t put it right up against the wall, as that can trap heat. If you’re using a laptop, place it on a flat surface or consider a cooling mat.
-
Over time, dust and debris can find their way into your PC and clog its fans, heat sink, and vents. You can use a can of compressed air to remove dust from the inside of your PC, or opt for a small vacuum. Just be really careful not to damage the fans by spraying them too hard with air or vacuuming at too high of power.[8]
-
Depending on your PC model, you may be able to add a better fan to your setup. You can also install case fans to improve airflow.[9]
-
A PC water cooling kit can reduce CPU temperatures without sacrificing CPU power.[10]
Manufacturers like CORSAIR, ASUS, Thermaltake, and others offer plenty to choose from. -
If your CPU keeps overheating, turn it off until it cools down completely. When you start it back up at a normal ambient temperature, it should stop overheating.
-
If your PC continues to overheat (and you’ve already tried the other suggestions), your hardware may not be powerful enough for the applications you run. If your CPU is upgradable, you may be able to install a new processor. If not, it may be time for a new motherboard or a whole new PC.


Advertisement
Ask a Question
200 characters left
Include your email address to get a message when this question is answered.
Submit
Advertisement
Thanks for submitting a tip for review!
About This Article
Thanks to all authors for creating a page that has been read 82,720 times.
Is this article up to date?
Quick Links
-
Using Speccy to Check CPU Temperature
-
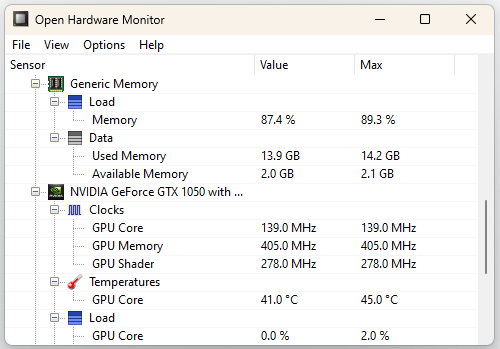
Using Open Hardware Monitor
-
Check Your CPU Temp in Windows 11 with HWiNFO
-
Frequently Asked Questions
Summary
To check your CPU’s temperature on Windows 11 without a third-party tool, access your BIOS/UEFI and look for a «CPU Core Temperature» value. Alternatively, you can find your CPU temp using free apps like Core Temp, Speccy, and Open Hardware Monitor.
Think your PC’s CPU gets too hot, but not sure exactly what temperature it reaches? Using a built-in method and a few free third-party apps, you can quickly and easily find out the processor temp of your Windows 11 PC. Here’s how.
Using BIOS/UEFI
One built-in method to find your CPU’s temp on some computers is by using your machine’s UEFI menu, often referred to as the BIOS. This menu displays various information about your system, sometimes including your processor’s temperature.
Note that there’s a minor drawback of this method: this method shows your CPU temp when Windows 11 isn’t loaded. Which means, if you’re trying to find out if a particular app or game is causing your CPU to heat up, you won’t be able to investigate that issue with this method. Additionally, not all BIOS menus provide CPU temperatures, so depending on your device you may not find anything useful.
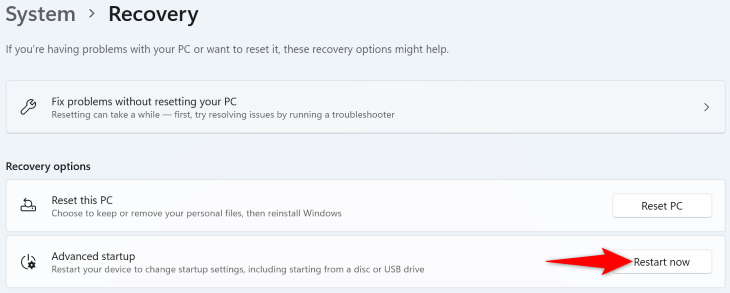
That said, if you’d like to try using this method, open your Windows 11 PC’s Settings app by pressing Windows+i. From the left sidebar, select «System.» On the right pane, choose «Recovery.»
On the «Recovery» page, next to «Advanced Startup,» click «Restart Now.» Then, in the open prompt, select «Restart Now.»
When your PC turns back on, in the open menu, navigate to Troubleshoot > UEFI Firmware Settings and click «Restart.» You’ll enter the BIOS/UEFI menu.
Here, you might find your CPU’s current temperature next to the «CPU Core Temperature» or a similar option. If you don’t find this option on your BIOS/UEFI’s main page, check out the other tabs, like «Advanced.» If you can’t find any temperatures, use one of the third-party tools demonstrated below.
Using Core Temp
Core Temp app is a free app that lets you check your CPU’s temp from both the app’s main screen as well as from your system tray. It also displays the temperature for each core of your CPU, which is handy in some cases.
To use the app, visit the Core Temp site in your web browser and download and install the app on your PC. While installing, make sure to deselect the «Build Your Kingdom» option that installs junkware on your computer.

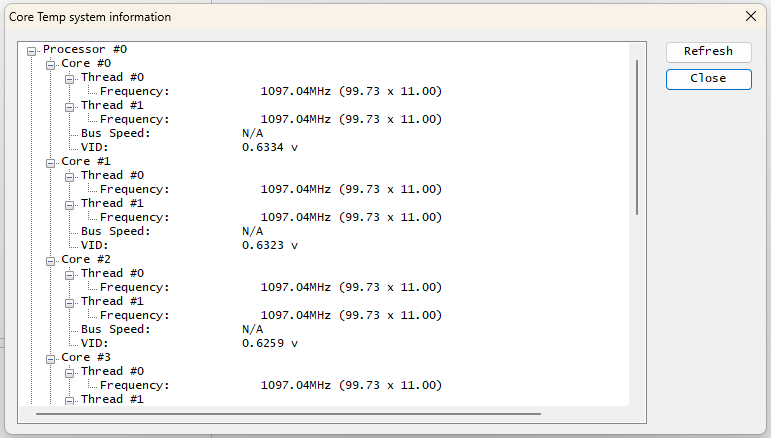
Run the Core Temp app. In the app’s «Temperature Readings» section, you’ll see your current CPU temp.
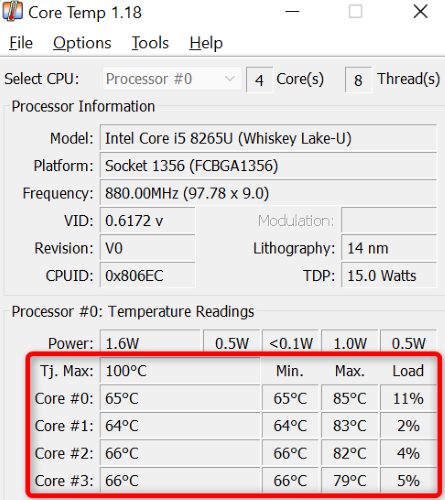
The temp numbers are constantly updating, as your CPU’s temp keeps fluctuating.
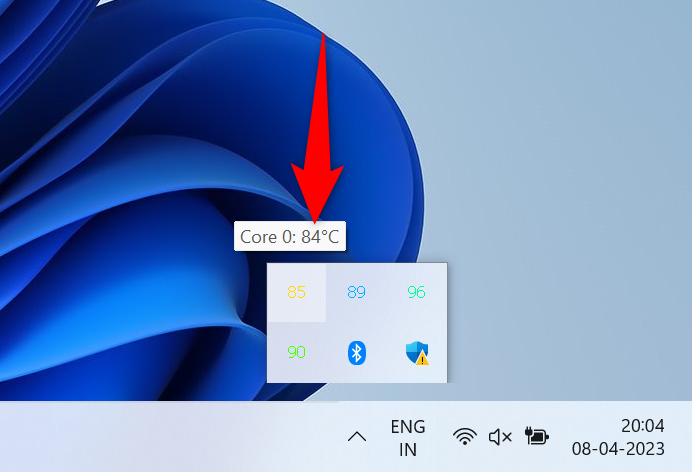
A quick way to see your CPU temp without opening the app interface is by clicking the app in your system tray. You’ll see each core’s temp right in your system tray.
Using Speccy to Check CPU Temperature
Another popular and free app you can use to find your CPU’s temp in Windows 11 is Speccy. This app lets you check your CPU temp as well as find other insights of your PC.
To use it, open your web browser and head to the Speccy site. Download and install the app on your PC.
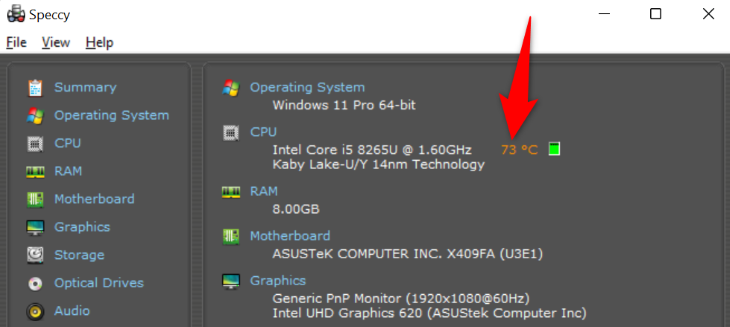
Launch the newly-installed app. On the app’s main page, in the «CPU» section, you’ll see your CPU’s overall temperature.
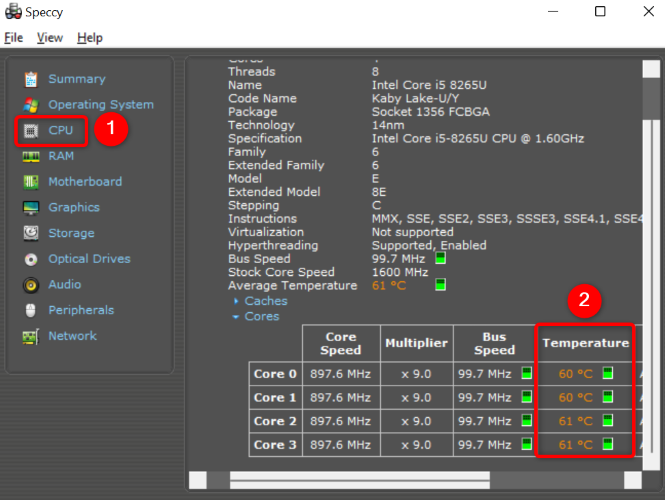
To find each core’s temp, then in the app’s left sidebar, click «CPU.» On the right pane, in the «Cores» section, you’ll see the temperature of each CPU core.
Using Open Hardware Monitor
Open Hardware Monitor is a free and open-source app that you can use to check your CPU’s temperature as well as find other information about your PC components.
To use this app, head to the Open Hardware Monitor’s site and download the app. Extract the app’s ZIP file on your PC.
Open the folder where you’ve extracted the ZIP, right-click the «OpenHardwareMonitor.exe» file, and select «Run as Administrator.» You need to run the app with admin rights because using the temp and other sensors requires admin access.
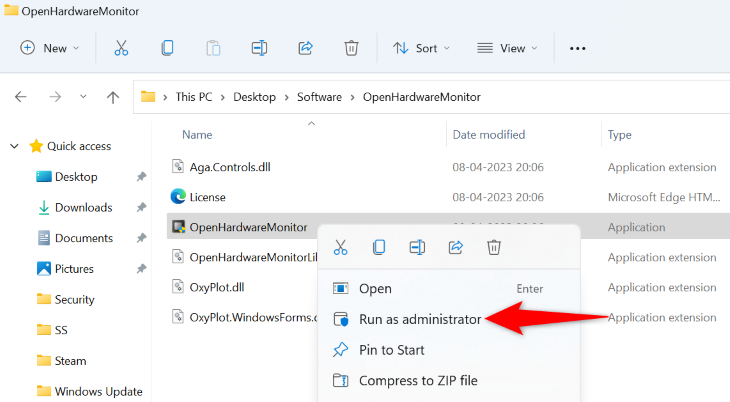
In the «User Account Control» prompt, select «Yes.»
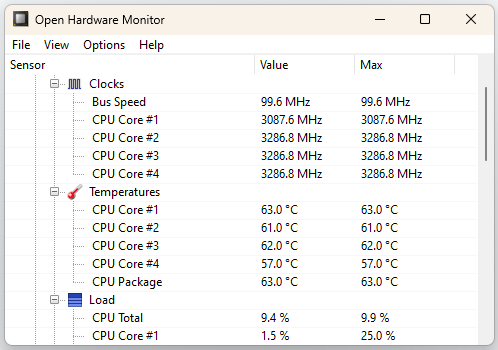
On the app screen, in the «Temperatures» section, you’ll find the temp of each core of your CPU.
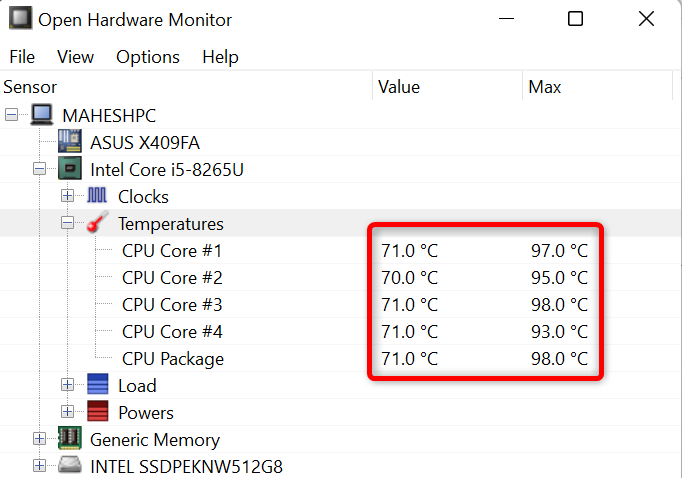
The app also displays other useful information, like the temperature of your hard drive or SSD drive.
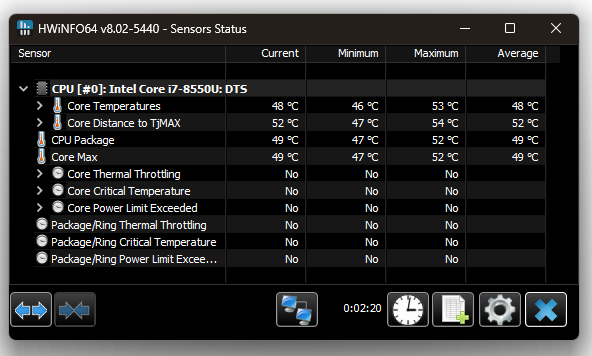
Check Your CPU Temp in Windows 11 with HWiNFO
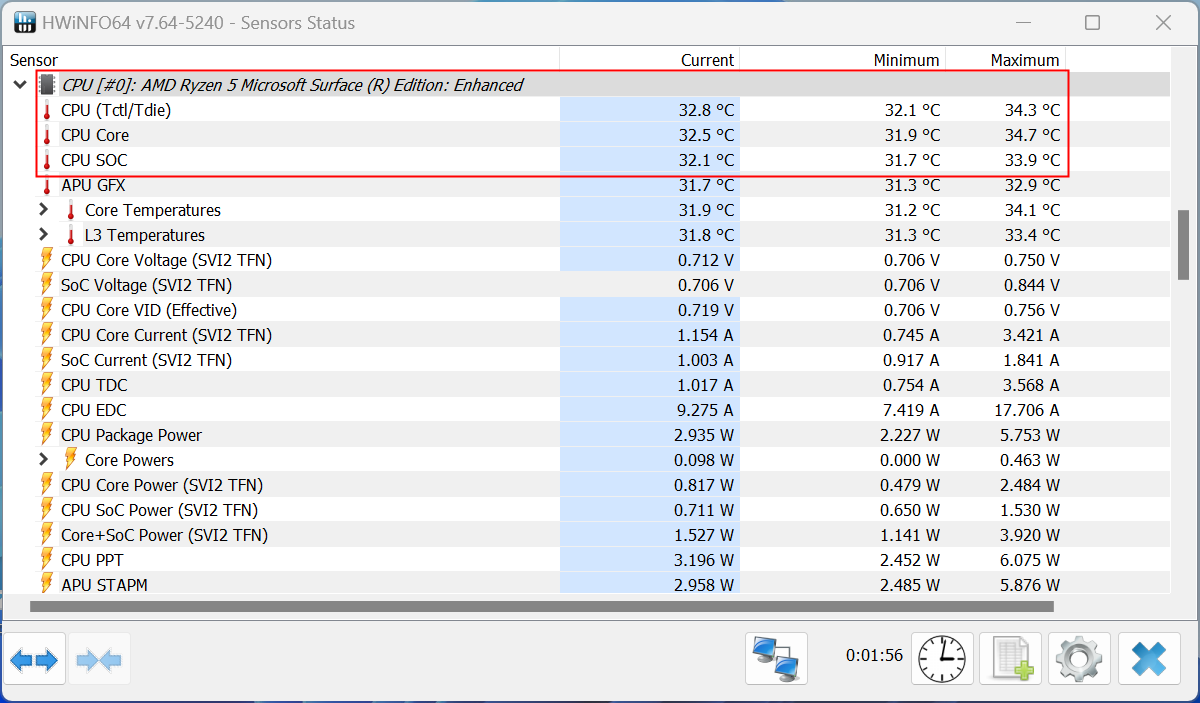
HWiNFO is another good program that lets you view your CPU temperature, in addition to specs about every component in your PC. You can install HWiNFO or use the portable version. Once you launch the program, select «Sensors-only» and then click «Start.»

Scroll through the list of the devices until you see «CPU» related terms. It’ll show you the current temperature in addition to the minimum and maximum temperature.
Frequently Asked Questions
What’s a normal temp for my CPU?
The normal temp for your CPU varies by what you’re doing on your PC. If you’re running a processor-intensive app or game, your CPU temp naturally will rise. It’s ideal, however, if your CPU’s temp stays around 75 degrees Celsius (167 degrees Fahrenheit).
What’s the maximum temperature for a CPU?
The maximum CPU temperature varies by the CPU model you have. You can use a free app like Speccy to find out the maximum recommended temp for your specific processor. Generally speaking, Intel CPUs max out around 100 degrees Celsius, and AMD CPUs at 90 degrees Celsius.
How do you reduce a CPU’s temperature?
Some ways to reduce your CPU’s temperature include closing CPU-intensive apps or games if you don’t use them, cleaning your PC so there’s good airflow inside, and using a CPU cooling gadget. These can include fans, liquid cooling, and AIO coolers.