Уровень сложностиПростой
Время на прочтение5 мин
Количество просмотров43K
Немного расскажу про установку Grafana на windows и настройку базовых метрик системы.
Пару слов о самой Grafana и для чего она нужна.
Grafana – это платформа для мониторинга, анализа данных и визуализации собранных данных с открытым исходным кодом. По сути она используется для визуального представления собранных метрик для более комфортного слежения за состоянием системы.
В данной статье буду использовать:
-
Grafana
-
Prometheus
-
Windows_exporter
-
Blackbox_exporter
Для начала скачаем актуальный дистрибутив самой Grafana и установим его (Для скачивания, может потребоваться VPN).
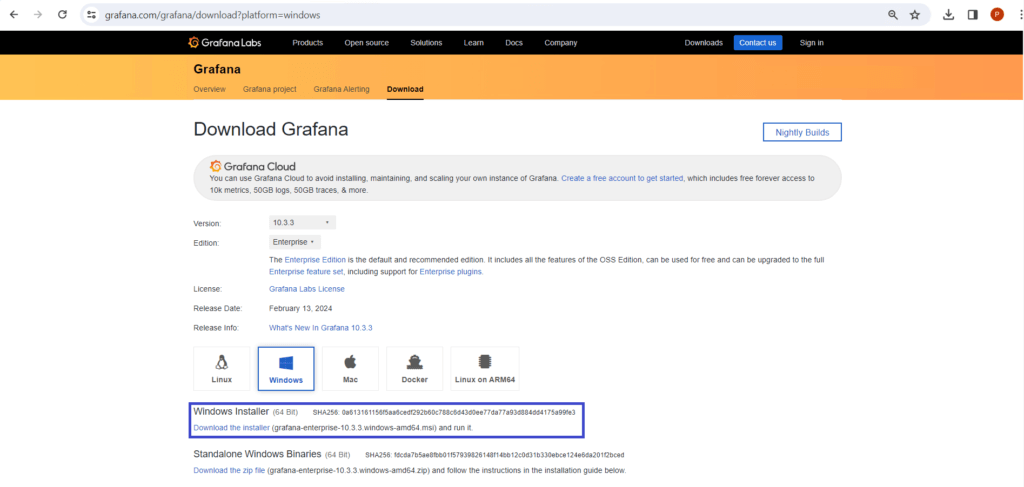
Переходим по ссылке: https://grafana.com/grafana/download и выбираем необходимую версию для скачивания.

Затем скачаем и установим Prometheus.
Prometheus по сути является сборщиком метрик. Установив на один пк, который будет выступать в качестве сервера для Grafana, достаточно будет только запускать сбор метрик с других машин (вносить соответствующий блок в файл конфигурации Prometheus), а Prometheus в свою очередь подготовит метрики уже для самой Grafana.
Prometheus: https://prometheus.io/download
Для установки потребуется NSSM — это сервисный помощник, который помогает установить служебные вспомогательные программы.
Ссылка NSSM: https://www.nssm.cc/download
Приступим к установке Prometheus.
Переходим в CMD и вводим следующие команды (запускаем CMD от админа):
-
Переходим в директорию с пакетом NSSM:
cd C:\GrafanaSetup\nssm-2.24\win64 -
Выполняем установку сервиса Prometheus:
nssm.exe install prometheus C:\GrafanaSetup\prometheus-2.43.0.windows-amd64\prometheus.exe

На данном этапе служба Prometheus должны быть установлена, Далее установим службы для сбора метрик.
Установим Windows_exporter – сборщик метрик, который как раз собирает статистику с системы и составляет своего рода «логи».
Ссылка для скачивания Windows exporter: https://github.com/prometheus-community/windows_exporter/releases
Выбираем подходящую нам версию и устанавливаем

После установки, так же проверяем в службах, что установка прошла успешно и служба запущена (название службы по умолчанию windows_exporter).
Теперь можно проверить сбор метрик по ссылке к порту службы: http://localhost:9182/metrics

На данном этапе можем установить Blackbock exporter — используется для мониторинга статуса доступности URL-ов. Переходим по ссылка и скачиваем нужную нам версию Blackbox: https://prometheus.io/download/ и устанавливаем.

Теперь приступим к настройке установленных сервисов.
Начинаем с Grafana:
Переходим в папку C:\Program Files\GrafanaLabs\grafana\conf и открываем файл defaults.ini при помощи текстового редактора и меняем значение в блоке smtp в поле enabled на true и сохраняем изменения. Запускаем службу Grafana, если она уже запущена, просто делаем перезапуск для вступления изменений в силу.

Перейдя по ссылке: http://localhost:3000 увидим активный интерфейс Grafana. Для входа по умолчанию используется комбинация admin / admin, затем попопросит Вас изменить пароль и направит на домашнюю страницу управления Grafana.
Далее приступаем к настройке Prometheus:Нам необходимо внести изменения в конфигурацию, включив метрики в конфиг. Для этого переходим в каталог prometheus») и открываем файл prometheus.yml и вносим следующие изменения:
Добавляем блок для подключения windows_exporter:
- job_name: "Любое комфортное имя"

      static_configs:

            #IP-адрес и порт, где собираются метрики window_exporter\

            - targets: ["localhost:9182”]
При добавлении нескольких машин, можно добавить блок lables, который изменит отображаемый IP-адрес на свое описание:
  static_configs:

      - targets: ["localhost:9182"]

        labels:

            instance: Server-1

      - targets: ["192.168.0.254:9182"]

        labels:

            instance: Server-2
Сразу добавим блок для blackbox_exporter:
- job_name: 'blackbox'

      metrics_path: /probe

      params:

            module: [http_2xx]  # Look for a HTTP 200 response.

    static_configs:

      - targets:

            -https://youtube.com

            -https://google.com

    relabel_configs:

      - source_labels: [__address__]

            target_label: __param_target

      - source_labels: [__param_target]

            target_label: instance

      - target_label: __address__

            replacement: localhost:9115  # The blackbox exporter's real hostname:port
В блоке targets перечисляем необходимые URL-адреса.
Только обратите внимание, для того, что бы блок корректно заработал и не было ошибок при запуске службы, необходимо строго соблюдать табуляцию строк.
Добавив необходимые блоки можем запускать prometheus.
Затем убедитесь, что все службы запущены:
-
Grafana
-
Prometheus
-
Windows_ exporter
-
Blackbox_exporter
и теперь проверяем статус сервисов по ссылке: http://localhost:9090/targets

В целом мы настроили базовые метрики, осталось включить отображение метрик в Grafana.
Переходим на главную страницу grafana ( По умолчанию: http://localhost:3000 ).
Подключаем источник данных Prometheus:
На главной странице, переходим в меню Data sources
Выбираем наш Prometheus

И указываем наш URL. В нашем случае, всё находится на одной локальной машине и можем прописывать через формат: http://localhost:port/

И нажимаем кнопку: Save & test
Теперь необходимо настроить панели мониторинга для метрик windows exporter. Для настройки переходим на главную страницу и добавляем панель:

На момент написания статьи, нашёл два наиболее охватывающих Dashboard`а:
-
14510
-
14694
Можете использовать их или же настроить всё самостоятельно.
Для добавления Dashboard`а указываем в поле ID и нажимаем на кнопку Load.

Затем нас направляет на панель настроек, где мы указываем источник данных Prometheus и можем изменить имя самой панели. Затем жмём кнопку Import
И у нас уже готовая, настроенная панель мониторинга, которую уже можно добавлять необходимым функционалом. Не нужные графики можно удалить или расставить в нужном для себя порядке.

При добавлении новых пк для мониторинга, достаточно внести строки в конфигурационный файл Prometheus.yml и перезапустить службу Prometheus. Служба самостоятельно разберёт метрики и добавить новый пк к мониторингу на уже готовый dashboard, где уже не составит труда переключаться между пк.
Далее уже можно поиграть с конкретными метриками, и отображением конкретных служб с различных машин. К примеру: На главном экране нажимаем ADD > Visualization и попадаем в меню создания панели. В поле Metrics browser вносим выбранную метрику и указываем параметры, которые хотим получить (ну или отобразить). Сделаем на примере службы windows:
-
Name — имя службы
-
State — вид статуса, который относится к метрике windows_service_state
-
Instance — с какой конкретной машины брать метрику.
windows_service_state{name="нужная служба", state="running", instance="Server-1"}
и в правом верхнем углу выбираем нужный вид панели, в моем случае это Stat:

В параметрах панели в меню Value mappings и меняем цифровые значения метрик на удобные для восприятия слова, к примеру: Ok/Bad Up/Down.

Сохраняем и получаем такую панель :
Ну и настроим метрику для получения статусов HTTP:
Используем метрику: probe_http_status_code и настроим Value mapping:
probe_http_status_code{instance="https://youtube.com"}

И в итоге получаем такую панель:
Далее можно самостоятельно зайти в http://localhost:9090/targets выбрать нужные для своих задач метрики и настроить нужные под свои задачи.
Думаю, на этом можно закончить. Базовая настройка не так сложна, но когда ты сталкиваешься с этим в первый раз, могут возникнуть трудности, поэтому хотел поделиться пошаговой настройкой. Надеюсь, кому-то это поможет и сократить достаточно времени на поиске информации и первичной настройки.
1. Download Grafana for Windows
- Open your web browser and go to https://grafana.com/grafana/download.
- Grafana will detect your operating system automatically, but if not:
- Choose Windows as your platform.
- Click Download the Installer (you’ll get a
.msifile). You are downloading a file like:grafana-<version>.windows-amd64.msi
2. Install Grafana Using the MSI Installer
- Once the
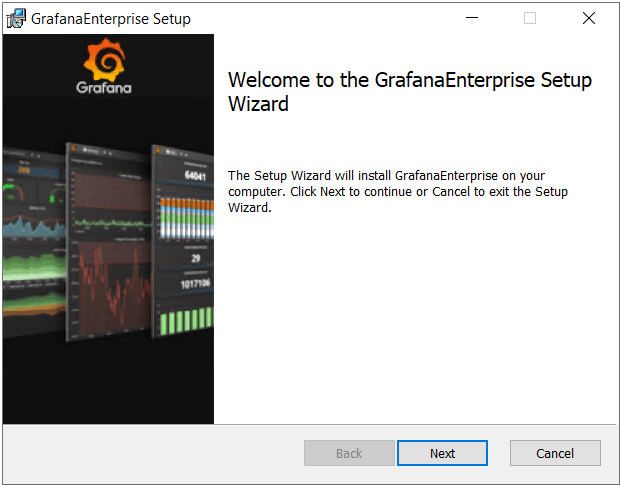
.msifile is downloaded, double-click it to start the installation. - The installer will guide you:
- Click Next.
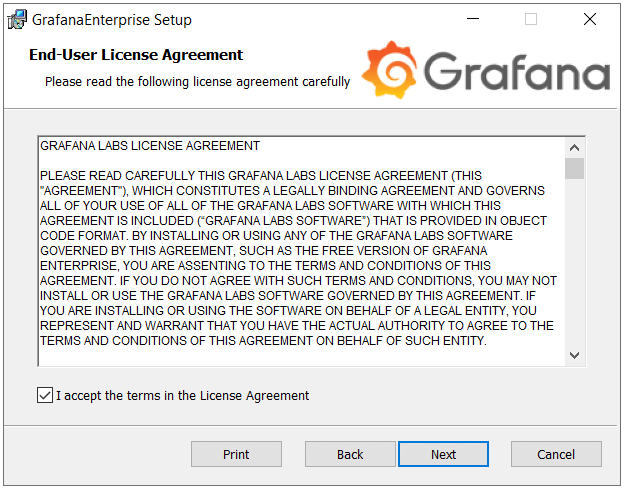
- Accept the License Agreement.
- Choose your installation location (default is fine:
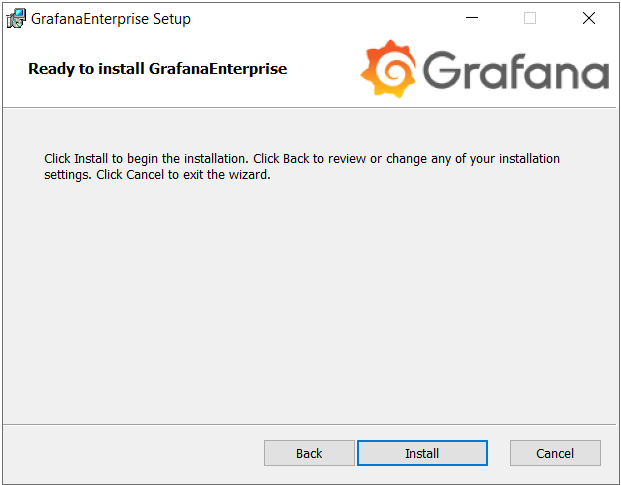
C:\Program Files\GrafanaLabs\grafana). - Click Install.
- Finally, click Finish.
This will:
- Install Grafana as a Windows service (it will automatically start with Windows).
- Open TCP port 3000 (by default) for Grafana web access.
3. Start the Grafana Server
Normally, after installation:
- Grafana starts automatically as a service.
If you need to manually start or stop it:
- Press
Windows Key + R→ Typeservices.msc→ Press Enter. - In the Services window, find Grafana.
- Right-click → Start or Restart.
4. Access Grafana Web UI
Open the browser and go to:
http://localhost:3000
You will see the Grafana login page.
Default login credentials:
- Username:
admin - Password:
admin
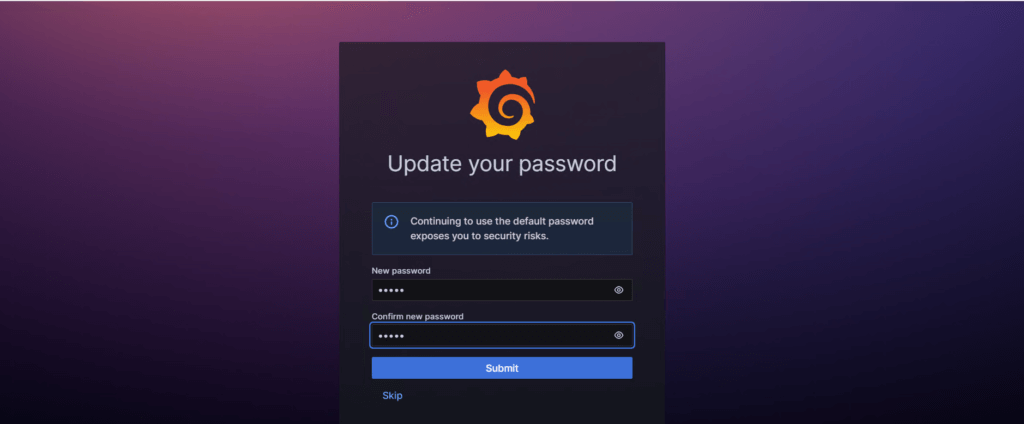
After your first login, you will be forced to change your password for security reasons. Choose a new password.
5. Connect Grafana to Prometheus
Now that Grafana is running, let’s add Prometheus as a data source.
Before that, make sure your Prometheus server is running on your machine!
(Usually Prometheus runs at http://localhost:9090.)
Add Prometheus as a Data Source
- After you log into Grafana:
- Click on the gear icon (⚙️) on the left sidebar → Click Data Sources.
- Click + Add data source.
- From the list, select Prometheus.
2.2 Configure Prometheus
- In the HTTP URL field, enter the URL where Prometheus is running:
http://localhost:9090
- Scroll down and click Save & Test.
If everything is correct, you’ll see a green success message:
“Data source is working”.
This means Grafana can now read all the metrics stored in Prometheus!
In this article, How to Install Grafana on Windows | we’ll guide you through the straightforward process of installing Grafana on a Windows system, unlocking its powerful data visualization capabilities.
Table of Contents
What is Grafana?
Grafana is an open source tool for performing data analytics, retrieving metrics that make sense of large amounts of data, and monitoring our apps using nice configurable dashboards.
Grafana integrates with a wide range of data sources, including Graphite, Prometheus, Influx DB, ElasticSearch, MySQL, PostgreSQL, and others. When connected to supported data sources, it provides web-based charts, graphs, and alerts.
Prerequisites
- Windows EC2 instance running.
- A Windows computer with special permission to make changes (like an admin).
- A file to install Grafana that fits your computer (it might be 32-bit or 64-bit).
Step #1:Download Grafana on Windows Server
First, go to the Grafana website and get the right version for Windows. You can choose either the 32-bit or 64-bit one. Once you pick, download the file to your computer. We’ll be downloading the enterprise edition.
Step#2:Install Grafana on Windows Server
Find the file you downloaded and open it. This will start the installation process. Just follow what the computer tells you to do. Click on the “Next”.
Accept the terms in the license agreement by clicking the checkbox.
Step#3:Choose Installation Location
While it’s installing, you’ll be asked where you want to put Grafana. Usually, the computer knows where to put it, but if you want to put it somewhere else, you can choose a different spot.

Step#4:Select the components to Install
Next, you can pick what parts of Grafana you want to put on your computer. The default choices are usually fine, so you can just click “Next.”
Step#5:Install Grafana on Windows
Once you’ve chosen everything, click “Install” to start putting Grafana on your computer.
Step#6: Complete the Installation
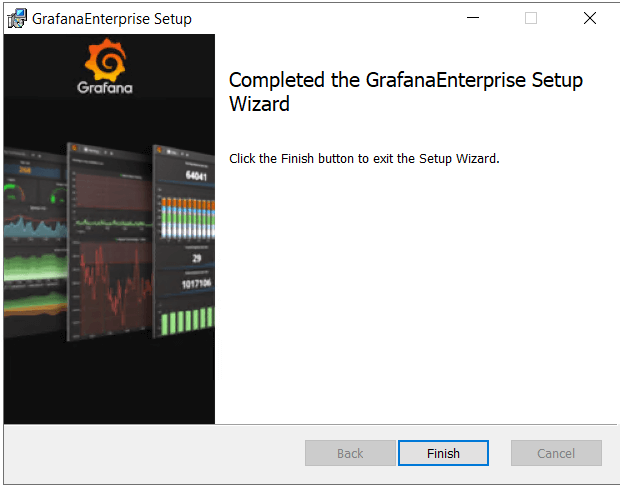
After it’s done, you’ll see a message that says Grafana is installed. You can choose to start it up right away. Just click “Finish” when you’re ready.
Step#7:Access Grafana on Browser
Then, open your web browser and type in “server IP or localhost:3000 to get to Grafana.
http://server_ip:3000When you open Grafana in your web browser, you’ll need to log in. The default username and password are both “admin.” It’s a good idea to change these to something else for safety.
Change the default security credentials for enhanced security or you can just skip it.
Now that Grafana is set up, you can start making charts and graphs with your data. You can configure data sources and create dashboards to visualize your data. Grafana supports various data sources, including databases, cloud services, and monitoring systems.
Conclusion:
We’ve successfully installed Grafana on our Windows machine. Grafana’s intuitive interface and powerful visualization capabilities empower to create insightful dashboards for monitoring and analyzing data. Explore Grafana’s features and create visualizations that help to gain valuable insights from metrics and time-series data.
Related Articles:
Secure Grafana with Nginx, Reverse Proxy and Certbot
Reference:
Grafana Installation official page
Why Installing Grafana Matters
Grafana, if you haven’t heard, is a powerhouse in the world of data visualization and monitoring. It’s an open-source platform that allows you to query, visualize, alert on, and understand your metrics no matter where they are stored. Whether you’re a seasoned DevOps engineer or a curious data enthusiast, Grafana can transform how you interact with your data.
I remember the first time I installed Grafana. It was a game-changer. Suddenly, I could see all my metrics in one place, beautifully visualized and easily accessible. But let’s be real, the installation process can be a bit daunting if you’re not familiar with it. So, let’s dive in and make this as painless as possible.
Main Content
Understanding Grafana
Before we get into the nitty-gritty of installation, let’s understand what Grafana is all about. Grafana is a multi-platform open-source analytics and interactive visualization web application. It provides charts, graphs, and alerts for the web when connected to supported data sources. It’s incredibly versatile and can be used for a wide range of applications, from monitoring server metrics to visualizing business data.
One of the standout features of Grafana is its flexibility. It supports a vast array of data sources, including Prometheus, Graphite, InfluxDB, Elasticsearch, MySQL, and many more. This means you can pull data from virtually any source and visualize it in a way that makes sense to you.
System Requirements
Before you start the installation process, it’s crucial to ensure your system meets the necessary requirements. Grafana is relatively lightweight, but you’ll still need to make sure you have the following:
- A modern web browser (Chrome, Firefox, Safari, etc.)
- A server or local machine with at least 256MB of RAM (though 1GB or more is recommended)
- A compatible operating system (Linux, Windows, or macOS)
Additionally, you’ll need to have a data source ready to connect to Grafana. This could be anything from a simple SQL database to a complex monitoring system like Prometheus.
Installing Grafana on Linux
Let’s start with the most common scenario: installing Grafana on a Linux server. We’ll use Ubuntu for this example, but the process is similar for other distributions.
First, update your package list and install the necessary dependencies:
sudo apt-get update
sudo apt-get install -y software-properties-common wget apt-transport-https
sudo apt-get install -y adduser libfontconfig1
Next, add the Grafana repository to your system:
wget -q -O - https://packages.grafana.com/gpg.key | sudo apt-key add -
sudo add-apt-repository "deb https://packages.grafana.com/oss/deb stable main"
Now, install Grafana:
sudo apt-get update
sudo apt-get install grafana
Once the installation is complete, start the Grafana server:
sudo systemctl start grafana-server
sudo systemctl status grafana-server
If everything is set up correctly, you should see that the Grafana server is active and running. You can now access Grafana by navigating to http://localhost:3000 in your web browser. The default login credentials are admin/admin.
Installing Grafana on Windows
If you’re on a Windows machine, the process is a bit different but just as straightforward. First, download the Grafana installer from the official Grafana website. Once downloaded, run the installer and follow the on-screen instructions.
After the installation is complete, you can start the Grafana server from the command line:
grafana-server --config=C:\Program Files\GrafanaLabs\grafana\conf\defaults.ini cfg:default.paths.logs=C:\Program Files\GrafanaLabs\grafana\data\log cfg:default.paths.data=C:\Program Files\GrafanaLabs\grafana\data cfg:default.paths.plugins=C:\Program Files\GrafanaLabs\grafana\data\pluginsYou can now access Grafana by navigating to http://localhost:3000 in your web browser. The default login credentials are admin/admin.
Installing Grafana on macOS
For macOS users, the installation process is similar to Linux. First, install Homebrew if you haven’t already:
/bin/bash -c "$(curl -fsSL https://raw.githubusercontent.com/Homebrew/install/HEAD/install.sh)"Once Homebrew is installed, add the Grafana repository and install Grafana:
brew update
brew install grafana
Start the Grafana server:
brew services start grafanaYou can now access Grafana by navigating to http://localhost:3000 in your web browser. The default login credentials are admin/admin.
Configuring Grafana
Now that you have Grafana installed and running, it’s time to configure it to suit your needs. The first thing you’ll want to do is change the default admin password. You can do this by logging in and navigating to the Configuration section.
Next, you’ll want to add your data sources. This is where Grafana really shines. You can add multiple data sources and visualize them all in one place. To add a data source, navigate to the Configuration section and select Data Sources. From here, you can add any compatible data source.
Once your data sources are added, you can start creating dashboards. Dashboards are where you’ll visualize your data. You can create graphs, charts, and even alerts based on your data. The possibilities are endless.
Creating Your First Dashboard
Creating a dashboard in Grafana is straightforward. Here’s a step-by-step guide to get you started:
- Log in to Grafana and navigate to the Dashboards section.
- Click on the + icon and select Dashboard.
- Click on Add new panel.
- Select your data source and configure your query.
- Choose a visualization type (e.g., graph, chart, etc.) and customize it to your liking.
- Save your dashboard.
That’s it! You’ve created your first dashboard. You can add as many panels as you like and customize them to visualize your data in the most effective way.
Setting Up Alerts
One of the most powerful features of Grafana is its alerting system. You can set up alerts to notify you when certain conditions are met. For example, you can set up an alert to notify you if your server’s CPU usage exceeds a certain threshold.
To set up an alert, follow these steps:
- Navigate to the Alerting section in Grafana.
- Click on Create alert rule.
- Configure your alert conditions and notifications.
- Save your alert rule.
Now, you’ll receive notifications whenever your alert conditions are met. This can be incredibly useful for monitoring server health, application performance, and more.
Optimizing Performance
While Grafana is quite efficient out of the box, there are a few things you can do to optimize its performance. Here are some tips:
- Use a reverse proxy like Nginx to handle SSL termination and load balancing.
- Enable caching to reduce the load on your data sources.
- Optimize your queries to reduce the amount of data being processed.
- Regularly monitor Grafana’s performance and adjust settings as needed.
By following these tips, you can ensure that Grafana runs smoothly and efficiently, even under heavy load.
Troubleshooting Common Issues
Even with the best planning, things can go wrong. Here are some common issues you might encounter when installing and configuring Grafana, along with solutions:
- Grafana server not starting: Check the logs for any error messages. Common issues include misconfigured data sources or insufficient permissions.
- Dashboards not loading: Ensure that your data sources are correctly configured and that Grafana has access to the necessary data.
- Alerts not triggering: Double-check your alert conditions and ensure that your notification settings are correctly configured.
If you encounter an issue that you can’t resolve, don’t hesitate to reach out to the Grafana community for help. There are plenty of resources available, including forums, documentation, and tutorials.
Advanced Configuration
For those looking to take their Grafana setup to the next level, there are plenty of advanced configuration options available. Here are a few things you might consider:
- Custom plugins: Grafana supports a wide range of plugins that can extend its functionality. You can find plugins for everything from new visualization types to advanced alerting systems.
- Integration with other tools: Grafana can be integrated with a variety of other tools, including Slack, PagerDuty, and more. This can help you create a comprehensive monitoring and alerting system.
- Scaling Grafana: If you’re running Grafana in a large-scale environment, you might need to consider scaling it horizontally. This can involve setting up multiple Grafana instances and using a load balancer to distribute traffic.
These advanced configurations can help you get the most out of Grafana and tailor it to your specific needs.
Wrapping Up
Installing and configuring Grafana can seem like a daunting task, but with the right guidance, it’s actually quite straightforward. Whether you’re monitoring server metrics, visualizing business data, or setting up advanced alerting systems, Grafana has you covered.
So, what are you waiting for? Give Grafana a try and see how it can transform your data visualization and monitoring capabilities. And remember, the Grafana community is always there to help if you run into any issues.
FAQ
Q: What are the system requirements for installing Grafana?
A: Grafana requires a modern web browser, a server or local machine with at least 256MB of RAM (1GB or more recommended), and a compatible operating system (Linux, Windows, or macOS).
Q: How do I change the default admin password in Grafana?
A: You can change the default admin password by logging in to Grafana and navigating to the Configuration section.
Q: Can I integrate Grafana with other tools?
A: Yes, Grafana can be integrated with a variety of other tools, including Slack, PagerDuty, and more.
Q: How do I set up alerts in Grafana?
A: To set up alerts in Grafana, navigate to the Alerting section, click on Create alert rule, configure your alert conditions and notifications, and save your alert rule.
Grafana is an advanced, web-based data analysis program for Windows, Linux, and other platforms. In this guide, we’ll show you how to install Grafana on your Windows Server system.
Downloading Grafana on Windows Server
To get started with Grafana on your Windows Server, you need first to download the software. To download it, head over to the official download page. Once there, find “Windows,” and select it with the mouse.
Upon selecting “Windows,” find “Windows Installer (64-bit)” and download it to your Windows Server. Alternatively, if you wish to use a standalone Grafana binary, you can download a ZIP file. However, the standalone binaries are not recommended if you are not an expert, and we will not be covering this method of Grafana on Windows Server in this guide.
Once you’ve downloaded the Grafana EXE file to your computer, open up Windows Explorer, and select the “Downloads” folder. Once there, find the Grafana MSI file and double-click on it to start up the installation wizard.
With the Grafana installation wizard open, you’ll see “Welcome to GrafanaEnterprise Setup Wizard.” Read the welcome message, and then select the “Next” button to move to the next page in the installation tool.
After selecting the “Next” button, you will be presented with the “End-User License Agreement.” This is a long legal agreement. Read it. When you’ve finished reading it, check the “I accept the terms in the License Agreement” box. Click the “Next” button to continue when done.
With the EULA accepted, you’ll be presented with the “Custom Setup” page. On this page, select the components of Granfana you wish to install on Windows Server. By default, everything is selected. Customize the installation to suit your needs. Click the “Next” button when done to continue.
On the next page, the installation tool says it is “Ready to install GrafanaEnterprise.” Find the “Install” button, and click on it with the mouse. When you select this button, it’ll start the installation process.
When you select the “Install” button, Grafana will install itself to your computer. This process should be quick. When the installation is finished, find the “Finish” button, and click it to close the installation tool.
Accessing Grafana
Now that the Grafana application is installed on your Windows Server device, you’ll need to access it. To access Grafana on your Windows Server, start by launching a web browser on the Windows Server desktop. Once it is open, navigate to the following URL in Microsoft Edge, or whichever web browser you prefer to use on the Windows Server Desktop Experience.
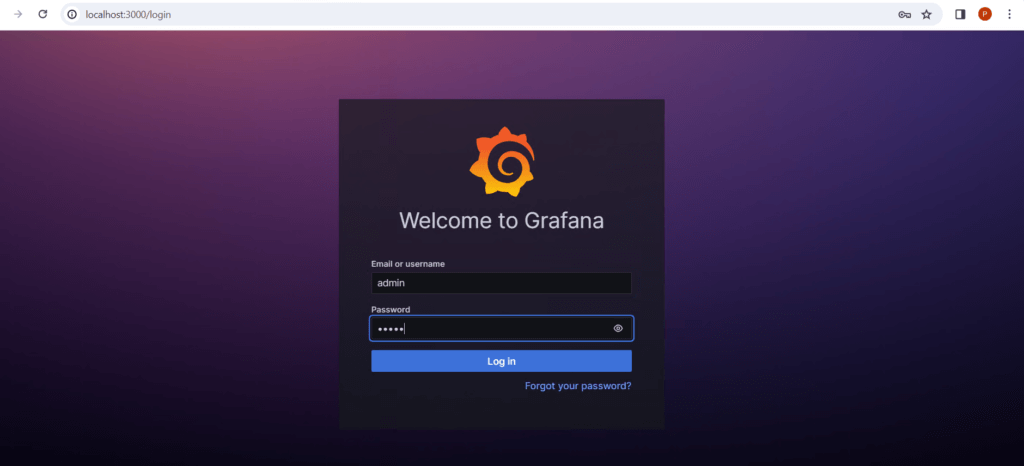
http://localhost:3000/login
Alternatively, if you wish to access Grafana from other computers on your network, you’ll need to use the local IP address of your Windows Server.
http://windows-server-ip-address:3000/login
If you do not know your Windows Server’s local IP address, you can open up a PowerShell window and enter the command below. Note that this command assumes your server’s network device is “Ethernet”. If it isn’t, you’ll need to replace it.
(Get-NetIPAddress -AddressFamily IPv4 -InterfaceAlias 'Ethernet' | Where-Object {$_.PrefixOrigin -eq 'DHCP'}).IPAddress
After accessing the Grafana URL in your browser, you’ll need to log in. By default, Grafana is set so that users log in with admin for a username and admin for the password. Enter this information to log into Grafana.
When you enter the default username and password, Grafana will immediately prompt you to change your password from the default. Enter a memorable, and secure password. If you’re having trouble thinking of a good password, try the BitWarden password generator.
Getting started with Grafana
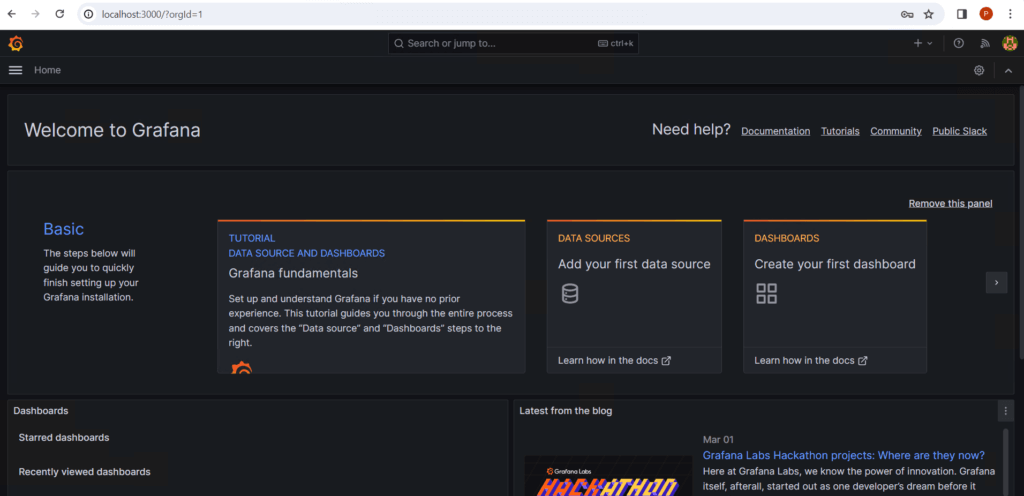
Grafana is an incredibly complex data visualization app. As a result, it would take a lot of words to cover how to master it in this article. Thankfully, when you log into Grafana for the first time, you’ll be met with the “Basic” area.
In the “Basic” area, locate “TUTORIAL DATA SOURCE AND DASHBOARDS” and click on it using the mouse. This in-depth tutorial, provided by the developers of Grafana, can quickly get you up and running with the app, helping you set up dashboards, data sources, and more.
For more information on getting started with Grafana on your Windows Server, check out the official documentation. This documentation is in-depth and covers just about everything you need to know about it.