
Температура процессора — один из ключевых показателей, влияющих на производительность и долговечность вашего компьютера. Перегрев может привести к снижению скорости работы, неожиданным перезагрузкам и даже к поломке компонентов.
Зачем знать
Какой должна быть
Как узнать
На Linux
На macOS
Как снизить
Чек-лист
Зачем знать
Какой должна быть
Как узнать
На Linux
На macOS
Как снизить
Чек-лист
В этом руководстве мы расскажем, как посмотреть температуру процессора на ноутбуке или ПК с операционными системами Windows 7, 10, 11, Linux или macOS. Вы узнаете, как проверить температуру процессора с помощью специализированных программ, через командную строку или BIOS.
Зачем знать температуру процессора

Контроль температуры процессора важен по нескольким причинам:
- Предотвращение перегрева и поломок. Высокая температура может привести к перегреву процессора, что в свою очередь может вызвать аварийное отключение компьютера или его зависание. Постоянный перегрев также ускоряет износ компонентов.
- Оптимизация производительности. При перегреве процессор может автоматически снижать свою тактовую частоту, чтобы уменьшить выделение тепла. Это явление называется троттлингом и приводит к снижению производительности системы.
- Удлинение срока службы компонентов. Поддержание оптимальной температуры помогает продлить срок службы процессора и других компонентов компьютера. Высокие температуры могут повредить не только процессор, но и другие важные элементы системы.
Какой должна быть температура процессора

Температура процессора является важным показателем его работоспособности и долговечности. В целом, в норме температура процессора должна быть в пределах 30−40°C в состоянии простоя и до 70−80 °C под нагрузкой. Однако эти значения могут варьироваться в зависимости от модели процессора и условий эксплуатации.
- В состоянии простоя, когда компьютер не выполняет интенсивные задачи, температура процессора обычно находится в диапазоне от 30 до 45 . Это нормальный уровень, который не вызывает беспокойства и не требует дополнительных мер по охлаждению.
- При выполнении ресурсоемких задач, таких, как игры, рендеринг видео или работа с большими объемами данных, температура процессора может повышаться до 70−80 °C. Это допустимый уровень, но важно следить за тем, чтобы температура не превышала эти значения, так как это может привести к перегреву и снижению производительности.
- Максимальная допустимая температура для большинства современных процессоров составляет около 90−100 °C. При достижении этих значений процессор может автоматически снижать свою тактовую частоту (троттлинг) или даже отключаться, чтобы предотвратить повреждение.
Способы узнать температуру процессора на ПК с Windows
Существует несколько способов узнать температуру процессора на ПК с Windows. Одни предполагают использование специализированного софта, другие позволяют обойтись и без них. Рассмотрим все способы подробнее.
Без программ
Для того, чтобы посмотреть текущую температуру ЦП, необязательно даже устанавливать специальные утилиты. Достаточно воспользоваться командной строкой или зайти в BIOS.
Через командную строку
- Нажмите комбинацию клавиш Win+R, введите cmd и нажмите Enter.
- Введите следующую команду и нажмите Enter:
wmic /namespace:\\root\wmi PATH MSAcpi_ThermalZoneTemperature get CurrentTemperature
Температура будет отображена в градусах Кельвина. Для перевода в Цельсий используйте формулу: t°C = t°K — 273,15
Через UEFI (BIOS)
- Сразу после включения компьютера нажмите клавишу для входа в UEFI (обычно это Del, F2, Esc или F10).
- В UEFI найдите раздел Hardware Monitor или System Health, где будет отображена температура процессора в реальном времени.
С помощью программ
Среди утилит для мониторинга состояния «железа» наиболее популярны три: AIDA 64, MSI Afterburner и SpeedFan.
AIDA64
- Скачайте программу с официального сайта и установите ее.
- Перейдите в раздел «Компьютер» > «Датчики».
- В разделе датчиков будет указана температура процессора и других компонентов в реальном времени.
MSI Afterburner
- Скачайте программу с официального сайта и установите ее.
- В настройках программы включите отображение температуры процессора.
- Температура будет отображена на панели задач.
SpeedFan
- Скачайте программу с официального сайта и установите ее.
- Перейдите в раздел «Температуры».
- В разделе температур будет указана температура процессора и других компонентов.
Методы проверки температуры процессора на Linux

На Linux существует несколько способов проверки температуры процессора, включая использование командной строки и графических приложений. Рассмотрим их подробнее.
Использование командной строки
- Откройте терминал и введите команду для установки необходимых пакетов: sudo apt install lm-sensors hddtemp.
- Запустите сканирование датчиков. Введите команду: sudo sensors-detect.
- Ответьте Yes на все запросы для завершения сканирования.
Чтобы посмотреть температуру, введите команду sensors. Эта команда отобразит текущую температуру процессора и других компонентов.
Для постоянного мониторинга используйте команду watch sensors. Эта команда будет обновлять данные каждые две секунды.
Использование Psensor
- Введите команду для установки приложения: sudo apt install psensor.
- После установки запустите приложение Psensor.
В настройках Psensor можно включить отображение температуры процессора в панели задач.
Как посмотреть температуру процессора на macOS

На macOS существует несколько способов проверки температуры процессора, включая использование встроенных инструментов и сторонних приложений. Рассмотрим их подробнее.
Использование Terminal
- Найдите Terminal через Spotlight или в папке «Программы» > «Утилиты».
- Введите следующую команду и нажмите Enter: sudo powermetrics —samplers smc |grep -i «CPU die temperature».
- Введите пароль администратора, когда будет запрошено.
Температура процессора будет отображена в списке значений.
Использование приложения Hot
- Скачайте приложение Hot с сайта разработчика iMazing.
- Запустите приложение Hot, и его иконка появится в меню.
Температура процессора будет отображена рядом с иконкой в меню. Вы также можете настроить отображение температуры в градусах Цельсия или Фаренгейта.
Как можно снизить температуру процессора

Снижение температуры процессора важно для поддержания его производительности и долговечности. Рассмотрим несколько эффективных методов.
1. Очистка системы охлаждения
Регулярная очистка вентиляторов и радиаторов от пыли помогает улучшить охлаждение. Пыль может замедлять вращение вентиляторов и снижать эффективность охлаждения. Используйте баллончик со сжатым воздухом для очистки вентиляторов и радиаторов.
2. Замена термопасты
Термопаста помогает улучшить теплопередачу между процессором и радиатором. Со временем она может высыхать и терять свои свойства. Рекомендуется менять термопасту каждые пару лет.
3. Улучшение вентиляции корпуса
Обеспечьте хорошую циркуляцию воздуха внутри корпуса. Убедитесь, что кабели не препятствуют продуваемости, и установите дополнительные вентиляторы, если это необходимо. Также важно, чтобы корпус компьютера находился в хорошо вентилируемом месте.
4. Оптимизация настроек питания
Снижение максимальной мощности процессора может помочь уменьшить его температуру. В Windows это можно сделать через настройки питания:
- Откройте «Панель управления» и выберите «Электропитание».
- Измените план питания на «Сбалансированный».
- Если это не поможет, то выберите план «Экономия энергии».
5. Использование качественного кулера
Инвестиции в качественный процессорный кулер могут значительно снизить температуру процессора. Существуют различные модели кулеров, которые обеспечивают более эффективное охлаждение по сравнению со стандартными. В первую очередь стоит присмотреться к башенным разновидностям.
Чек-лист: как посмотреть температуру процессора
Для удобства и быстроты проверки температуры процессора, следуйте следующему чек-листу:
- Используйте приложение SpeedFan для Windows, Psensor для Linux или Hot для macOS.
- Чтобы перевести температуру в кельвинах в градусы Цельсия, используйте формулу t°C = t°K — 273,15.
- В общем случае нормальной считается температура ЦП в пределах 30−40 °C в состоянии простоя и до 70−80 °C под нагрузкой.
- Если температура вашего процессора превышает вышеназванные пределы, то, скорее всего, есть проблемы с охлаждением.
- Чтобы снизить температуру процессора, замените кулер и улучшите вентиляцию корпуса.
Всем привет!
Вопрос к знатокам. Требуется узнать температуру процессоров на сервере. Все возможные программы (Hardware monitor, CPU-Z, Speedfan) не показывают температуру, так же не работают wmic в командной строке (wmic /namespace:\\root\wmi PATH MSAcpi_ThermalZoneTemperature get CriticalTripPoint, CurrentTemperature) и powershell (get-wmiobject msacpi_thermalzonetemperature -namespace «root/wmi»).
Единственное ПО которое обнаружило температуру является AIDA64, но она не подходит, так как требуется вывод в консоль\командую строку, да и AIDA платная.
Так вот вопрос, есть ли какие то варианты узнать температуру процессоров, как это делает AIDA через любой язык программирования или стандартными средствами?
ОС: Windows 2012 R2 Standart
CPU’s: Intel Xeon e5-2670
Материнская карта (Видел где то нужна): IBM y8362
Всем заранее спасибо
-
Вопрос задан
-
953 просмотра
Реализация DI в PHP
Jason-Webb 13.05.2025
Когда я начинал писать свой первый крупный PHP-проект, моя архитектура напоминала запутаный клубок спагетти. Классы создавали другие классы внутри себя, зависимости жостко прописывались в коде, а о. . .
Обработка изображений в реальном времени на C# с OpenCV
stackOverflow 13.05.2025
Объединение библиотеки компьютерного зрения OpenCV с современным языком программирования C# создаёт симбиоз, который открывает доступ к впечатляющему набору возможностей. Ключевое преимущество этого. . .
POCO, ACE, Loki и другие продвинутые C++ библиотеки
NullReferenced 13.05.2025
В C++ разработки существует такое обилие библиотек, что порой кажется, будто ты заблудился в дремучем лесу. И среди этого многообразия POCO (Portable Components) – как маяк для тех, кто ищет. . .
Паттерны проектирования GoF на C#
UnmanagedCoder 13.05.2025
Вы наверняка сталкивались с ситуациями, когда код разрастается до неприличных размеров, а его поддержка становится настоящим испытанием. Именно в такие моменты на помощь приходят паттерны Gang of. . .
Создаем CLI приложение на Python с Prompt Toolkit
py-thonny 13.05.2025
Современные командные интерфейсы давно перестали быть черно-белыми текстовыми программами, которые многие помнят по старым операционным системам. CLI сегодня – это мощные, интуитивные и даже. . .
Конвейеры ETL с Apache Airflow и Python
AI_Generated 13.05.2025
ETL-конвейеры – это набор процессов, отвечающих за извлечение данных из различных источников (Extract), их преобразование в нужный формат (Transform) и загрузку в целевое хранилище (Load). . . .
Выполнение асинхронных задач в Python с asyncio
py-thonny 12.05.2025
Современный мир программирования похож на оживлённый мегаполис – тысячи процессов одновременно требуют внимания, ресурсов и времени. В этих джунглях операций возникают ситуации, когда программа. . .
Работа с gRPC сервисами на C#
UnmanagedCoder 12.05.2025
gRPC (Google Remote Procedure Call) — открытый высокопроизводительный RPC-фреймворк, изначально разработанный компанией Google. Он отличается от традиционых REST-сервисов как минимум тем, что. . .
CQRS (Command Query Responsibility Segregation) на Java
Javaican 12.05.2025
CQRS — Command Query Responsibility Segregation, или разделение ответственности команд и запросов. Суть этого архитектурного паттерна проста: операции чтения данных (запросы) отделяются от операций. . .
Шаблоны и приёмы реализации DDD на C#
stackOverflow 12.05.2025
Когда я впервые погрузился в мир Domain-Driven Design, мне показалось, что это очередная модная методология, которая скоро канет в лету. Однако годы практики убедили меня в обратном. DDD — не просто. . .
Getting CPU temperature using Powershell is a straightforward process. It is safer than using third-party apps for CPU temperature monitoring.
You would have noticed that most recommendations for CPU temperature monitoring on Windows 11 systems ask you to install third-party apps or applications on the computer to monitor CPU temperatures. Installing third-party apps is fraught with unintended consequences. Plus, in most corporate networks, you may have a hard time in getting these apps installed on Windows 11 systems.
So, we look at alternatives that can check CPU temperature on a Windows 11 computer through Powershell. With a single command line directive, we can get the temperature value of the CPU on the Powershell command prompt.
However, there are a few caveats that need to be aware of:
- This Powershell command directive’s output generates a CPU temperature value in Kelvin.
- Once you know the Kelvin temperature, you can convert it to Celsius by subtracting 273 from the Kelvin temperature
- An alternative is to use the Powershell script shared below.
Before starting the process of finding the CPU temperature on a Windows 11 computer, we need to start Powershell with administrative privileges on the computer.
To do so, you can type ‘pwsh’ in the search box of Windows 11 computer and then choose to ‘Run it as administrator’. The screenshot displays the exact command and the administrative option to check.

Get CPU temperature using WMI Object
We will make use of the WMI Object method to find the three values of temperature of the CPU on a Windows 11 computer.
For this exercise, we will use the in-build class of Win32_PerfFormattedData_Counters_ThermalZoneInformation.
The command directive below needs to be used to get the CPU temperature values on a Windows 11 computer:
Get-WMIObject -Query “SELECT * FROM Win32_PerfFormattedData_Counters_ThermalZoneInformation” -Namespace “root/CIMV2” | Select-object Temperature
The WMI-object command output is piped to the Select-object qualifier to get the temperature values in Kelvin.
The command and the output we get can be seen in the screenshot shared below:
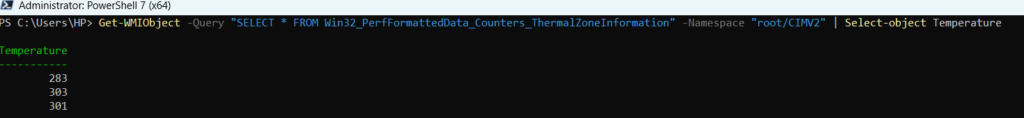
- 283 Kelvin is equivalent to 10 degree Celsius
- 303 Kelvin is equivalent to 30 degree Celsius
- 301 Kelvin is equivalent to 28 degree Celsius
This is a quick and easy way to get an idea about the CPU temperature on a Windows 11 computer in Kelvin.
Similar to the WMI Object method, you can use the CIM Instance command below to find the temperature values in Kelvin. The command output is identical to what we have seen above.
Get-CIMInstance -Query “SELECT * FROM Win32_PerfFormattedData_Counters_ThermalZoneInformation” -Namespace “root/CIMV2” | Select-object Temperature
Get CPU temperature in Celsius using the Powershell function
You can use a Powershell script or function to get the temperature values of the CPU in Celsius directly. The function below will bring out the three temperature values of CPU temperature in Celsius.
function Get-Temperature {
$t = Get-WmiObject MSAcpi_ThermalZoneTemperature -Namespace “root/wmi”
$returntemp = @()
foreach ($temp in $t.CurrentTemperature) { $currentTempKelvin = $temp / 10 $currentTempCelsius = $currentTempKelvin – 273.15 $currentTempFahrenheit = (9/5) * $currentTempCelsius + 32 $returntemp += $currentTempCelsius.ToString() + ” C : ” + $currentTempFahrenheit.ToString() + ” F : ” + $currentTempKelvin + “K” } return $returntemp
}
Get-Temperature
You can use this function on the Powershell prompt. Or, you can save it as a PS file and execute it on the system.
I chose to put the function on the Powershell prompt directly and got the temperature values in Kelvin, Fahrenheit, and Celsius as displayed in the command output screenshot below.

Summary
Both these methods shared above will help you fetch the CPU temperature of a local or remote computer using Powershell. You can use these cmdlets on Windows 11, Windows 10, and Windows servers as well.
The good thing about getting temperature values through Powershell is that we do not need to install any third-party applications on your desktop or servers.
Rajesh Dhawan is a technology professional who loves to write about Cyber-security events and stories, Cloud computing and Microsoft technologies. He loves to break complex problems into manageable chunks of meaningful information.
Introduction
Monitor the CPU temperature of your Windows or Linux computer to keep it running smoothly. You can help with this by using contemporary CPU temperature monitoring software.
Why do you require it?
The fact is, every PC produces heat. It can only withstand so much heat before the hardware starts to malfunction. The PC has numerous components, including a motherboard, hard drive, and more, and while operating, it generates heat. Before a threshold, the heat is normal, but it might seriously harm the CPU if it isn’t controlled.
So, if the temperature rises unusually, you can face a sudden system shutdown. While working, you or the other employees can notice a slowdown in their performance. In the worst instance, heat could harm the CPU’s motherboard, essential chips, or other components.
You must use a CPU temperature monitoring program to monitor your computer CPU to prevent all of these and safeguard your system and its performance.
What is a tool for monitoring CPU temperature?
CPU temperature monitors are software tools that provide precise information while checking the temperature of your CPU, voltage, fan speed, battery, and other components. You can take steps to protect your CPU by collecting these metrics from sensors.
These tools have a lot of beneficial characteristics, including:
- enabling high levels of customization
- supplying thorough information on the computer’s hardware
- displaying the CPU temperature in real-time
- the ability to measure bandwidth and usage
Who Needs to Monitor CPU Temperature?
CPU temperature monitors can be helpful for everyone, from casual computer users to busy professionals. The CPU temperature can increase for a variety of reasons, including:
In particular, CPU temperature monitoring is helpful for:
Gamers: They play expensive video games that need potent computers. So the temperature may rise while kids play video games. Gamers also upgrade their computers’ components and overclock them to improve online gaming performance. The CPU temperature may increase as a result of these.
Graphic designers: Just like gamers, graphic designers need fast computers to complete their work quickly.
Professionals: People working on computers for long periods often notice their PCs getting warm. They might also come across worms from the internet, networks, or emails, Trojans like Rootkit and backdoors, and viruses like file and system infectors and macros. Any of these can cause the CPU to become hotter.
What is the normal CPU temperature?
CPU must operate at the right temperature to function at its peak. When working under light loads, most CPUs function at a relatively low temperature; as workloads increase and more processing power is required, the temperature rises.
A temperature that is too high may cause components to malfunction or operate poorly. The performance of modern CPUs can be throttled if the CPU becomes too hot, thanks to built-in thermal protection. The PC may occasionally shut down due to a hot CPU. Consistently high temperatures can cause damage to components or hasten normal degradation.
You can place CPU temps in one of three categories:
Normal: When your computer isn’t in use, it may be 45 to 50 degrees Celsius.
Average: When using the computer for demanding operations like playing videos, manipulating graphics, processing videos, and other things, the temperature can reach an average of 70 to 80 degrees Celsius.
High: If you undertake more demanding duties, raising the temperature and load, the temperature can reach 80 to 100 degrees Celsius. This temperature causes a decrease in clock speed. Therefore, it is essential to examine and lower this temperature.
Laptops: Laptops operate at a higher temperature than PCs because they have more tightly packed components and less airflow. With a light load, a laptop’s permissible temperature range is roughly 160 to 170 degrees Fahrenheit (71 to 80 degrees Celsius). Temperatures on a laptop, while it is playing games, can get as high as 190 degrees Fahrenheit (88 degrees Celsius).
But what if the temperature is higher than 80 degrees Celsius?
Do this:
- Please verify that your computer’s fan spins when the specified load is applied and that it is dust-free.
- Ensure the computer is kept in a cool atmosphere because too much heat and humidity in a room can damage it.
- Stop overclocking or boost the Windows/Linux CPU’s speed. Because overclocking improves computer speed while also producing more heat
- You can also use thermal paste between the CPU and its cooler in a three-year interval.
Why should you use a CPU temperature monitor tool?
increases the performance of computers
The performance of the computer is impacted by increased CPU heat. While working, you can suffer slower speed, which can kill your productivity. Thus, a CPU temperature monitor enables you to ensure that your computer operates at peak efficiency.
Prevents the PC from heat damage
Extreme heat can seriously harm your CPU and its components. It will consequently begin to malfunction and shut off suddenly. This temperature can be detected by the CPU temperature monitor, allowing you to take timely precautions to avoid potential harm.
increases the computer’s durability
Suppose you can use the CPU temperature monitor to protect the CPU from extreme heat, humidity, and other harmful elements. In that instance, your computer system’s lifespan is being extended.
Ensure the data center’s dependability and uptime
Optimal environmental conditions for the computer are required in a data center to achieve the highest levels of uptime and dependability. It offers suggested settings for things like humidity, electricity, and temperature. It would help if you used internal and external sensors to monitor your server rooms.
So, let’s look at some of the top Windows CPU temperature monitors to see how they may help you control the heat generated by your computer’s CPU for optimum performance, dependability, and longevity.
Windows CPU temperature monitors tool
Core Temp
Try Core Temp’s most recent version to monitor the temperature if you are worried about your computer’s CPU. The program is easy to use and has a small, lightweight footprint while being robust enough to track CPU temperature and other data.
It shows the temperature of each processor core in the system individually. Real-time temperature changes will correspond to the changing workloads. In each central processor, there is a Digital Thermal Sensor that is independent of the motherboard.
Compared to conventional thermal sensors, the D.T.S. provides greater resolution temperature measurements that are also more precise. Recent x86 CPUs from AMD, VIA, and Intel include D.T.S. Core Temp is straightforward to use, enabling high-level customization and expandability.
With the help of additional capabilities, add-ons and plugins can expand the capability of Core Temp. The CPU’s temperature can be checked from the outside in both Windows and Android phone devices. The most recent version includes a graph view, memory usage, and a CPU load/temperature listing.
To enhance text color, size, and information, download CoreTempMC and Core Temp Gadget. The latest version includes compatibility for AMD Zen 2 and Zen 3 APUs, Intel Rocket Lake, Preliminary Alder Lake, and Meteor Lake.
Download the app to access a wealth of important data while on the go. Windows 10, 8, 7, Vista, XP, 2016, 2012, 2008, and 2003 servers are all supported. It supports Intel, AMD, and VIA x86 processors.
NZXT CAM
The NZXT CAM temperature monitor is the finest for gaming PCs. From a single app, it can control the temperature, gadgets, and performance. It is a quick, simple, and effective tool that allows you to access and manage every aspect of the computer.
You may view every internal computer activity using NZXT CAM, from processor load to bandwidth usage. Additionally, you may monitor how each machine’s applications are doing and find problems fast to improve computer performance.
Track temps, bandwidth, frame rates, and more while playing games with an extremely steady, less disruptive, in-game overlay. Time played, current frame rate, GPU/CPU temperature, battery level, GPU/CPU load, and many other variables are supported by NZXT CAM.
You can manage fan speeds, P.S.U. Voltages, case lighting, and more using its stunning and simple U.I. Start by downloading the latest C.A.M. software and monitoring the CPU temperature.
Speccy
You may save time by finding all the information you need to acquire stats on your motherboard, CPU, graphics cards, RAM, and other components in a single interface. By monitoring the temperatures of the vital components, you can become an expert at resolving issues before they arise.
It allows you to share your results by allowing you to save them as an XML, text file, or snapshot. Check your computer’s specifications to see if any problems need to be diagnosed. The tool enables you to increase PC performance without replacing their hardware. For advanced PC insights, download the free edition. To unlock additional capabilities, purchase the tool.
SolarWinds CPU Load Monitor
SolarWinds CPU Load Monitor is the best tool for simultaneously monitoring and charting the load on several Cisco routers.
An engineer’s toolkit is included with SolarWinds CPU Load Monitor. Business networks are frequently susceptible to viruses, raising the routers’ traffic load and CPU stress. This program allows it to simultaneously monitor and graph the load on several Cisco routers. This will enable you to stay one step ahead of issues.
Features:
- You may adjust each device’s warning and alert thresholds with SolarWinds CPU Load Monitor.
- It can concurrently track and graph the load on several Cisco routers.
- It supports SNMP version 3 and IPv6.
- The user-defined threshold for the warning will be indicated by the yellow load bar, and the user-defined critical level will be indicated by the red load bar.
- You will access over 60 network management tools with Engineer’s Toolset.
Open Hardware Monitor
Open Hardware Monitor is free software that monitors a computer’s temperature sensors, clock speeds, load, and fan speeds. It supports a wide variety of mainboard-mounted hardware monitoring chips.
The software scans the core temperature sensors of AMD and Intel processors to determine the CPU temperature. It displays the sensors for the Nvidia and A.T.I. video cards in addition to the hard drive’s temperature and SMART.
The values are shown on a desktop gadget that you can customize and in the system tray’s main window. Without installation, Open Hardware Monitor works with Linux and x86-based 64- and 32-bit versions of Microsoft Windows XP, Vista, 7, 8, 8.1, and 10.
Additionally, it develops new features and addresses bugs. It has improved its AMD GPU support, AMD GPU, and CPU labels and can now recognize ITE IT8655E, IT8686E, and IT8665E super I/O chips. It also improves fan R.P.M. calculations made by the Nuvoton NCT679XD super I/O.
The program utilizes the 4.5 version of the.NET framework and Microsoft Windows. Install the software by unzipping the downloaded Zip file, then start monitoring.
HWMonitor
Do you need to monitor your computer’s voltages, fans’ speeds, and temperatures?
Try the hardware monitoring application HWMonitor and give it access to the PC’s health sensors. It manages common sensor chips such as the ITE IT87 series, Winbond I.C.s, and others. The hard drive’s temperature, the chip’s CPU, and the visual card’s GPU may all be read via SMART.
Voltages, temps, and fan speed may all be tracked with HWMonitor. The application is compatible with most Winbond I.C.s, common sensor chips, etc. Hard drive temperatures, video card GPU temperatures, and on-die thermal sensors for CPUs may all be accessed using HWMonitor. S.M.A.R.T. is used to read the hard disk temperatures.
HWMonitor Pro adds features to the original HWMonitor. It also offers a more user-friendly U.I.
HWiNFO
Access detailed reporting by interacting with numerous reports, add-ons, tools, and status logging. It supports AMD and Intel families’ chipsets, graphics cards, and processors. Furthermore, it aids in the detection of overload, performance loss, and overheating.
The program also keeps track of many hardware and system metrics, including motherboards, drives, peripherals, CPUs, and GPUs. The output can be exported as reports in CSV, HTML, and XML. Additionally, it will display the results in various forms, including tables, O.S.D.s, tray icons, etc. Start examining what’s happening within your PC after downloading the software.
AIDA64
Are you looking for market-leading system information, diagnostic, and benchmarking solutions for engineers and corporate I.T. technicians?
Choose AIDA64. It contains a hardware identification engine that offers detailed information about the software and functions for overclocking and diagnostic support. Additionally, it keeps an eye on the sensors to record precise values for voltage, temperature, and fan speed, and its diagnostic feature aids in identifying and averting hardware problems.
The program provides benchmarks for assessing both system-wide and individual hardware performance. Additionally, Windows Server 2019 and Windows 10 64-bit and 32-bit variants are compatible with AIDA64 Engineer.
How to check CPU temperature on Ubuntu Linux
You must set up the lm sensor utility for Linux hardware monitoring. This program offers certain command-line utilities for Linux systems that incorporate hardware health monitoring gear, such as CPU and fan speed. The steps below are compatible with CentOS/R.H.E.L. versions 7 and 8.
sensors
Launch the terminal.
Type:
sudo apt install lm-sensorsType the following command:
sudo sensors-detectThen it would help if you found any hardware monitoring chips that have been put in your computer. Start by detecting the hardware sensors on your laptop that will give you information about:
CPUs and other powerful I/O processors contain sensors.
I/O ports and the SMBus/I2C bus on your system provide access to hardware monitoring chips.
Type the following command:
sensorsThe sensors command can be run repeatedly using the watch command, with the results shown on screen:
watch sensorsInstall sensors package on CentOS or RHEL 7 / 8
Type the yum command:
sudo yum install lm_sensorsRun the following command:
sensorsGlances
Glances is a cross-platform, sophisticated, and well-liked real-time system monitoring program that collects data from multiple system resources using the psutil library.
The psutil and/or hddtemp utilities can be used to display data from sensors. The webserver mode, which lets you access it using a web browser to monitor your Linux server remotely, is one of its unique features.
There are several ways to install Glances on your system, but utilizing an auto-install script, which will install the most recent production-ready version, is the recommended technique.
Use the curl or wget command as directed to install Glances on your PC.
curl -L https://bit.ly/glances | /bin/bashOR
wget -O- https://bit.ly/glances | /bin/bashAfter installation, launch Glances and hit the f key to access sensor data.
glancesHardinfo
The system profiler and benchmark program Hardinfo is compact and built for hardware analysis and report creation. It offers thorough data on system hardware and enables the creation of HTML reports on your system’s hardware.
Run the following command to install the hardinfo package on your Ubuntu Linux machine.
sudo apt install hardinfoYou can use the following command to launch hardinfo after the installation is finished and display device details.
hardinfo -rma devices.soi7z
A little command-line tool called i7z provides information about Intel Core i7, i5, and i3 CPUs, including temperatures. By executing the following command, you can install it on your Ubuntu machine.
sudo apt install i7zAfter installation, type:
sudo i7zConclusion
Your PC might suffer serious damage from high temperatures. Dust, infections, playing expensive video games, or other time-consuming tasks could all be blamed. Whatever the situation, take care of your computer using the finest CPU temperature monitoring tool to keep the CPU from overheating, enhancing its functionality, dependability, and lifespan.