
При возникновении синих экранов BSoD Windows 11, 10 и другие версии системы создают дамп (снимок состояния) оперативной памяти, содержащий отладочную информацию, которую можно использовать для диагностики и определения причин сбоя. Функция обычно включена по умолчанию, но если дампы памяти не создаются, их можно включить: Как включить создание дампов памяти в Windows.
Подробным анализом дампов памяти занимаются разработчики, но и для рядового пользователя, столкнувшегося с синими экранами в Windows это может оказаться полезным: адреса в памяти ему ничего не дадут, но часто можно обнаружить имя файла приложения или драйвера, вызывающее сбой. Здесь помогут специальные программы для анализа дампов памяти, о которых и пойдёт речь далее.
WinDbg

У Майкрософт имеется собственный инструмент отладки и анализа дампов памяти — WinDbg (пока Preview). Скачать его для Windows 11 и Windows 10 можно из Microsoft Store, используя поиск в магазине приложений или прямую ссылку.
Пример простого анализа дампа памяти для обычного пользователя с целью выявления процесса, вызвавшего BSoD с помощью WinDbg:
- Запустите WinDbg от имени Администратора (правый клик по ярлыку в меню «Пуск» — «Запуск от имени администратора»).
- В главном меню программы выберите «Файл» — «Open dump File» и укажите путь к нужному мини-дампу, обычно находящемуся в папке C:\Windows\Minidump, нажмите кнопку «Open».

- Введите команду
!analyze -v
в поле ввода команд (либо нажмите по ссылке с командой в верхней панели WinDbg) и дождитесь завершения анализа.

- В панели «Command» в верхней части окна программы будет отображен результат анализа, где, при удаче, вы сможете найти информацию о том, каким процессом был инициирован сбой (PROCESS_NAME).
- Может быть информация о файле драйвера (.sys) в поле IMAGE_NAME и другая информация, позволяющая найти источник проблемы.


Далее полученную информацию можно использовать для того, чтобы найти, каким устройствам соответствуют драйверы в Интернете, выяснить назначение процессов вызвавших сбой, предпринять те или иные действия с целью их устранения.
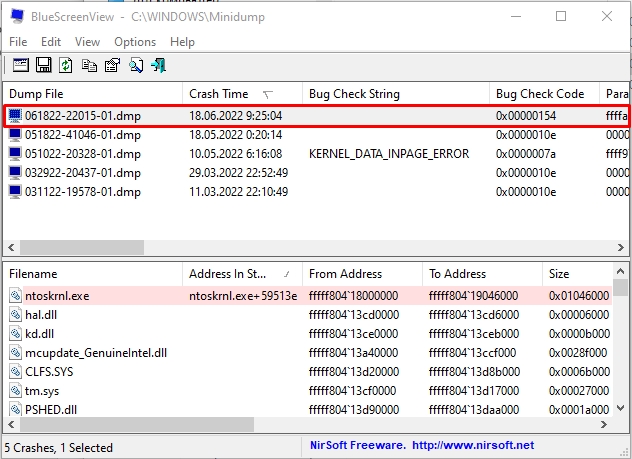
BlueScreenView
BlueScreenView — очень простая утилита, которая позволяет выбрать файла дампа памяти в списке и посмотреть, какие файлы драйвера и процессы привели к сбою: в окне программы они будут выделены красным цветом.

Скачать BlueScreenView можно с официального сайта разработчика https://www.nirsoft.net/utils/blue_screen_view.html
WhoCrashed
Ещё одна программа для анализа дампов памяти — WhoCrashed. В бесплатной версии предоставляет не так много информации.
После нажатия кнопки «Analyze» имеющиеся дампы памяти анализируются, и на вкладке «Report» выводятся коды ошибок, а также текстовое описание на английском языке о том, что означает этот код и о возможных причинах сбоя.

Официальный сайт WhoCrashed https://www.resplendence.com/whocrashed, судя по всему, не открывается из РФ, но утилиту легко найти и скачать из сторонних источников.
Статья обновлена: 07 июля 2022
ID: 3055
Статья неприменима к Windows Vista SP1 и ниже.
После установки продукта «Лаборатории Касперского» могут возникнуть ситуации, при которых операционная система «зависает». Например, при загрузке компьютера или при запуске сторонней программы. Причиной может быть конфликт программы «Лаборатории Касперского» со сторонним программным обеспечением, либо с драйверами комплектующих вашего компьютера.
При возникновении такой проблемы:
- Настройте запись полного дампа памяти в операционной системе.
- Получите полный дамп памяти.
- Отправьте полный дамп памяти в «Лабораторию Касперского».
Как настроить запись полного дампа памяти в Windows 7, 8, 8.1, 10
Как настроить запись полного дампа памяти в Windows 11
Как получить полный дамп памяти
Как отправить дамп в техническую поддержку «Лаборатории Касперского»
Спасибо за ваш отзыв, вы помогаете нам становиться лучше!
Спасибо за ваш отзыв, вы помогаете нам становиться лучше!
Windows 11 dump file is a file that stores a copy of your computer’s memory at the time of a system crash or a BSoD (Blue Screen of Death). It accumulates all the memory information during the crash into a file. These dump files are crucial to help diagnose and debug the problem that caused the crash.
If you are looking for the memory dump file location for diagnosing purposes or if you simply want to clear the dump files, this guide will show you where you can find the dump files in Windows 11, as well as how to clear the dump files or change the dump file location.
Also see: How to Startup Repair Windows 10/11 using Command Prompt
Where is the memory dump file in Windows 11
Dump File Location in Windows 11
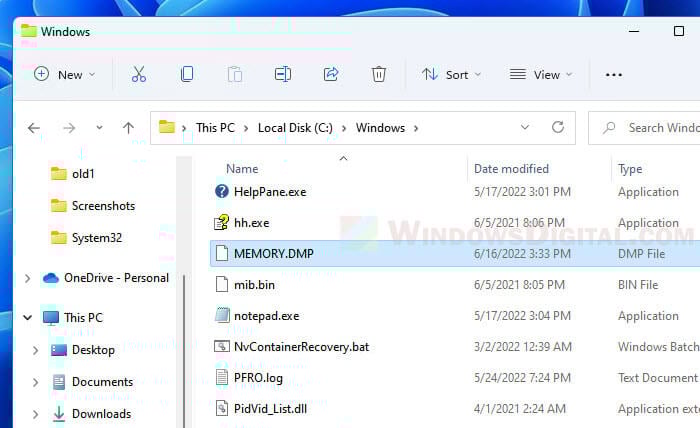
The memory dump file in Windows 11 is a single file called MEMORY.DMP which can be found in the system root folder – “C:\Windows”.
The full path to the memory dump file would be “C:\Windows\memory.dmp“, whereas “C:” is the drive of your Windows installation. Replace “C:” if your Windows was installed on a different drive.
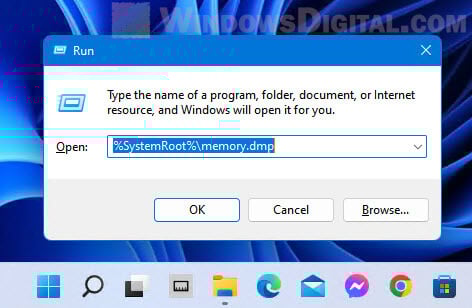
Alternatively, you can access the folder by first pressing Win + R keys to open the Run dialog box. Then, enter %SystemRoot% to the Open field and click OK to open the system root folder. From there, look for a file called “MEMORY.DMP” and that will be the dump file you are looking for. To open the dump file directly, enter %SystemRoot%\memory.dmp instead.
If you can’t find the memory.dmp dump file in the system root, it just means that there was no crash recorded, or you have recently cleared the dump file through disk cleanup recently after the system crash.
Related: How to Fix Blue Screen With Sad Face on Windows 11/10
Minidump files location
In Windows 11, dump files can also be stored as smaller memory dump files called Minidump. You can find these minidump.dmp dump files in C:\Windows\Minidump.dmp. Some minidump files will have their own names, usually numbers such as the date and time of the crash incident.
These are the default path to the memory dump files in Windows 11. To learn how to change the default dump file location in Windows 11, see the next section of this guide.
How to clear dump files in Windows 11
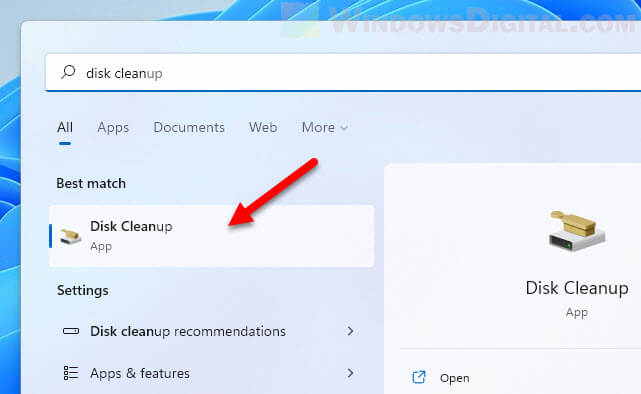
To clear the dump files in Windows 11, the better way to do it other than deleting the MEMORY.DMP in the system root folder is to clear it via the Disk Cleanup tool. To learn how to do so, follow the steps below.
Suggested Guide: How to Clean C: Drive in Windows 11
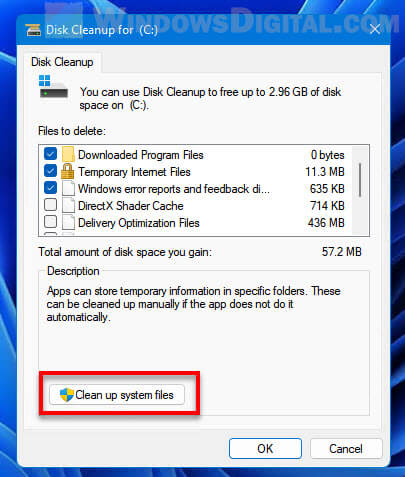
- In Windows 11, search for and open “Disk Cleanup” via Start.

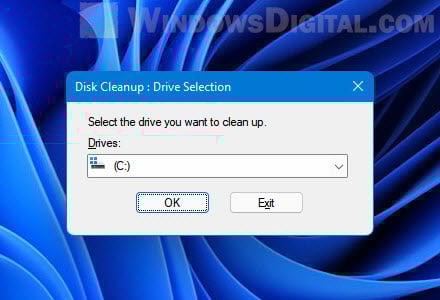
- When prompted to select drive, choose the system drive where your Windows installation is located, usually the C: drive.

- After the initial load, in the Disk Cleanup window, click “Clean up system files” under Description.

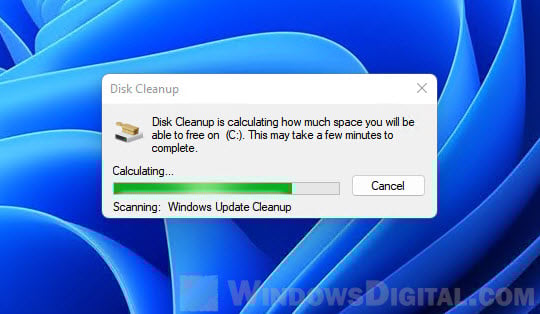
- Disk cleanup will then calculate what system files can be cleared and how much space you will be able to free on the drive. This may take a while to complete.

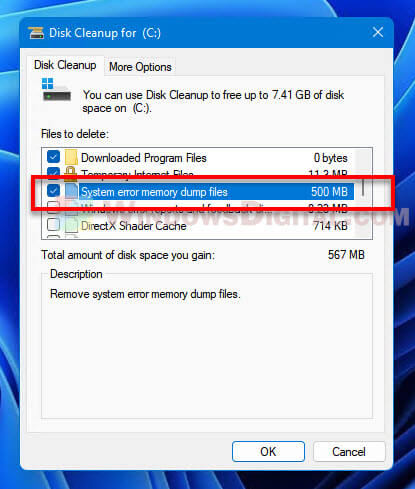
- On the next window, select “System error memory dump files” along with any other files you want to clear, and then click OK to begin clearing the unwanted files.
How to change default dump file location in Windows 11
The dump file location is defaulted to the system root folder – “C:\Windows”. You can change where Windows should save the dump file to a different location instead of the system root folder.
The most common reason users would want to change the default dump file location is when the dump file is taking up too much disk space on the system drive. This is especially the case when they choose the “Complete memory dump” option (a type of dump file) which will require significantly larger disk space as it writes the complete memory equals to the amount of RAM.
To change the default dump file location in Windows 11, follow the steps below.
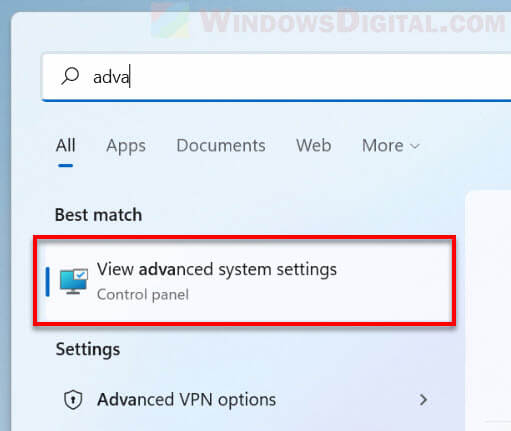
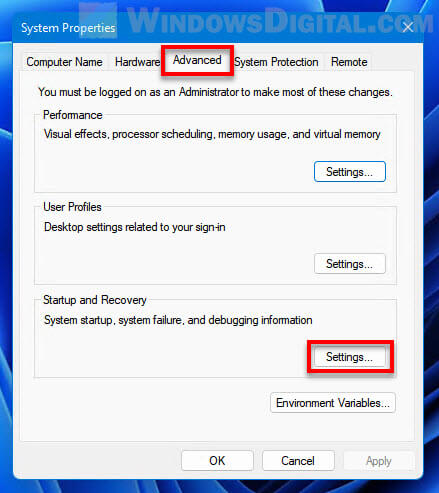
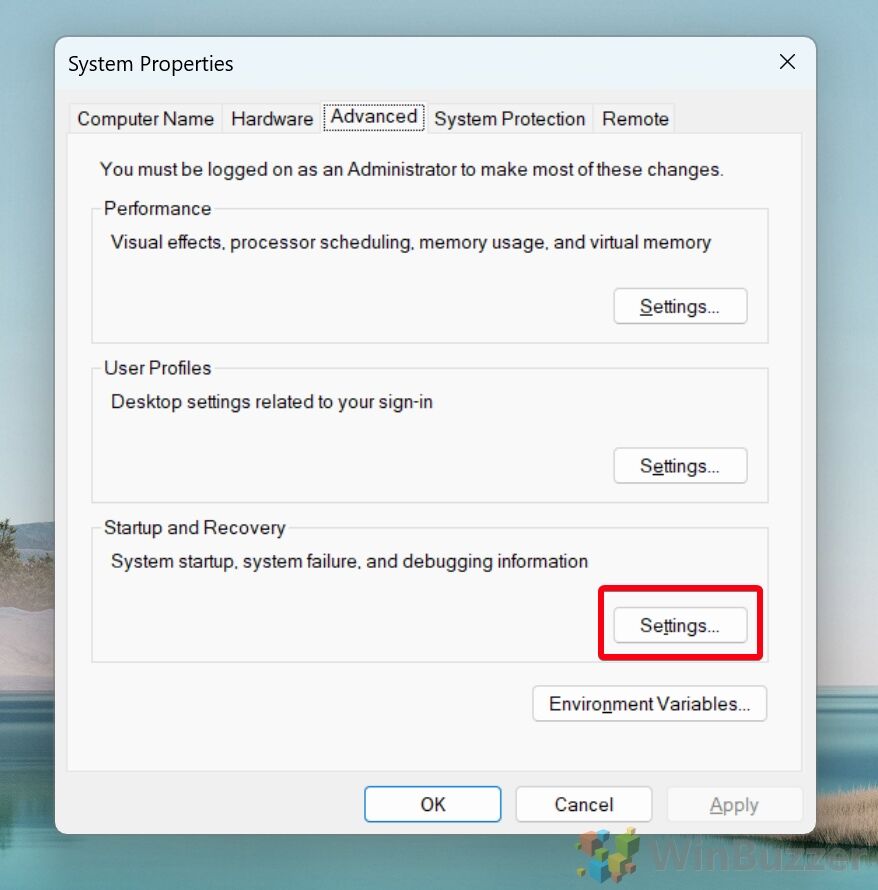
- Search for and open “View advanced system settings” via Start.

- In the System Properties window, select Advanced tab, and then click the Settings button under “Startup and Recovery“.

- In the “Dump file” text field, enter the new location you would like Windows to save the dump file to.
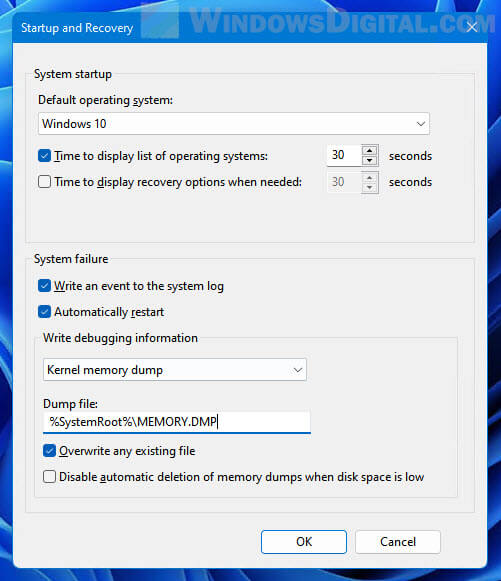
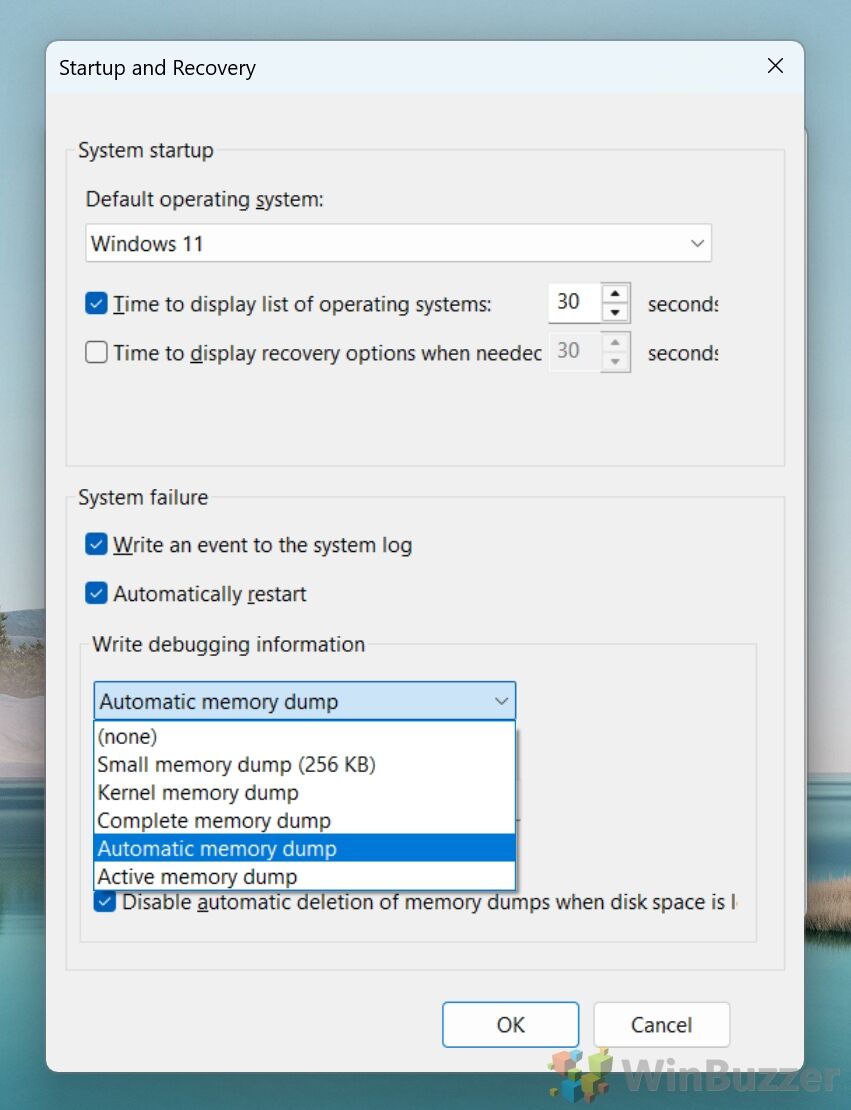
How to change the type of memory dump file
Windows can generate different types of memory dump file. The debugging information and details are written in different format in each type of memory dump file. The size of the dump file also depends on the type of the dump file. Some types of dump file will store more information, while some store lesser.
You can change the type of memory dump file in Windows 11 by first follow the exact same steps in the instructions above to open the “Startup and Recover” window. In the window, click the drop-down menu under “Write debugging information”, and then select the type of memory dump file you want Windows to generate in the event of system crash.
If you choose (none), Windows 11 will not generate any memory dump file in any system crash or blue screen event.
How to read dump file in Windows 11
Dump files are not designed to be understandable by the average users. Memory dump files are designed for technicians and developers who can make use of the data to fix the issues and improve the system so that these crashes don’t happen again.
If you want to read the dump file in Windows 11, you will need a debugging tool specializes in reading dump files. You can use an app called WinDbg Preview by Microsoft which can be installed via Microsoft Store.
Всем привет! В статье ниже я расскажу про аварийный дамп памяти – что это такое в Windows, как его посмотреть, включить создание и для чего он вообще нужен. Вы можете задавать дополнительные вопросы или дополнить статью в комментариях.
Содержание
- Что такое дамп памяти в Windows?
- Просмотр дампа
- Как включить создание дампов памяти в Windows?
- Видео
- Задать вопрос автору статьи
Что такое дамп памяти в Windows?

Дамп памяти – это специальный файл, который создается операционной системой во время критической ошибки BSoD, когда система зависает и выкидывает «синий экран смерти». Обычно на экране отображается код ошибки и файл, который его мог вызвать. И тут человек сталкивается с двумя проблемами:
- Экран пропадает очень быстро – через 3-5 секунд. Обычно пользователь даже не успевает взять телефон, чтобы сделать фотографию для дальнейшего анализа.
- Иногда на синем экране отсутствует код или название файла.
Но переживать не стоит, сам файл можно посмотреть – об этом мы поговорим в следующее главе.
Просмотр дампа
Давайте я расскажу – как посмотреть дамп памяти Windows 10, 11, 7 или 8. Тут все зависит от того – грузится ли у вас операционная система. Если Виндовс не погружается, а при каждой попытке, вылезает синий экран, то нам нужно сначала восстановить загрузчик ОС. Если вы столкнулись с подобным – то переходим сюда и читаем рекомендации (ссылка).
Если система грузится, то для просмотра дампов памяти, нам понадобится специальная программа BlueScreenView. Качаем и запускаем её.
Скачать BlueScreenView
ВНИМАНИЕ! Обратите внимание на дату и время создания дампа. Если вы не видите вообще свежих дампов, то надо включить их создание – об этом поговорим в следующей главе.
Нас интересуют две строчки. Первая – это «Bug Check String», в которой хранится конкретная ошибка. Вторая – это «Bug Check Code». Уже по ним нужно гуглить – что именно вызывает ошибку и от этого отталкиваться.
Еще можно попробовать проанализировать – что вызывает ошибку? Может это какая-то программа или игра. Это может быть какая-то системная служба или драйвер, который недавно установился на ПК. В некоторых случаях синий экран может появляться, если был установлен неподходящий драйвер. Я с таким сталкивался, когда на Windows 7 был установлен драйвер для Windows 10.
Читаем – как переустановить драйвера в системе.
Еще одна из самых частых причин – это проблема с оперативной памятью, когда в ОЗУ появляются битые сектора. В таком случае синий экран появляется постоянно, но он указывает на разные файлы и имеет различные коды. Советую полностью проверить RAM.
Читаем – как проверить оперативную память.
В некоторых случаях понять на 100%, что именно вызывает ошибку – очень сложно. Иногда это связано в целом с проблемой в работе ОС, какими-то программами или драйверами. Поэтому вылечить это можно треями способами:
- Первый – выполнить общий комплекс очистки системы и переустановке драйверов. Можно даже попробовать откатить драйвера на старые версии (иногда это помогает).
- Второй – откат системы до заводской конфигурации. У нас на сайте есть инструкции на эту тему для Windows 10 и Windows 11.
- Третий – полная переустановка ОС.
Как включить создание дампов памяти в Windows?
Если BlueScreenView не видит дампы Windows 10 или 11, то нужно включить их создание в системе:
- Зажимаем:
+ R
- Вводим:
sysdm.cpl

- На вкладке «Дополнительно» в разделе «Загрузка и восстановление» кликаем по «Параметрам».

- Установите галочки, как у меня в подразделе «Отказ системы». В конце нажмите «ОК».

Статья подошла к концу и надеюсь она ответила на все ваши вопросы. Вы всегда можете написать нам в комментариях, и специалисты портала WiFiGiD.RU вам помогут.
Видео
Opening and analyzing crash dump files on Windows 11 can be a vital step in diagnosing and fixing system errors. Crash dump files, also known as .dmp files, are generated when the system experiences a crash, capturing a snapshot of the system’s memory at the time of the error. This guide will walk you through the process of opening and analyzing these files using WinDbg, a powerful debugging tool provided by Microsoft.
What Are Crash Dump Files?
Crash dump files contain detailed information about the state of the system at the time of a crash. They typically include the stop message (error code), a list of loaded drivers, processor context, process and kernel context for the stopped thread, and a kernel-mode call stack for the thread that stopped. These files can be essential for diagnosing the root cause of system crashes, helping you identify problematic drivers or software.
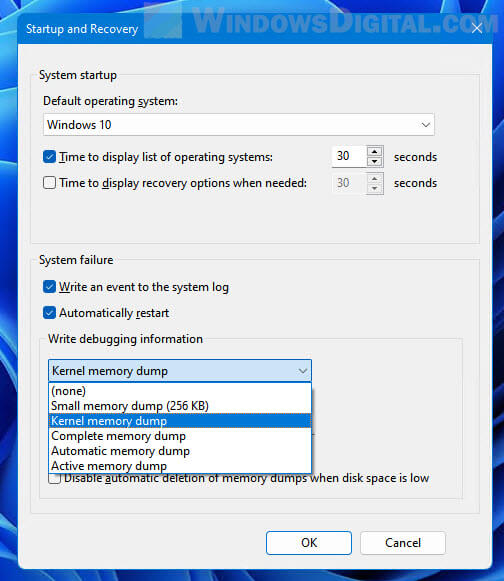
Types of Dump Files
Windows 11 can generate several types of dump files:
- Complete Memory Dump: Contains the entire contents of system memory.
- Kernel Memory Dump: Includes only the kernel memory, excluding user-mode memory.
- Small Memory Dump (Minidump): The smallest dump file, containing essential information to determine the cause of the crash.
How to Set Up Windows 11 to Generate Dump Files
Before you can analyze crash dump files, you need to ensure that your system is configured to generate them. This can be done through the System Properties settings:
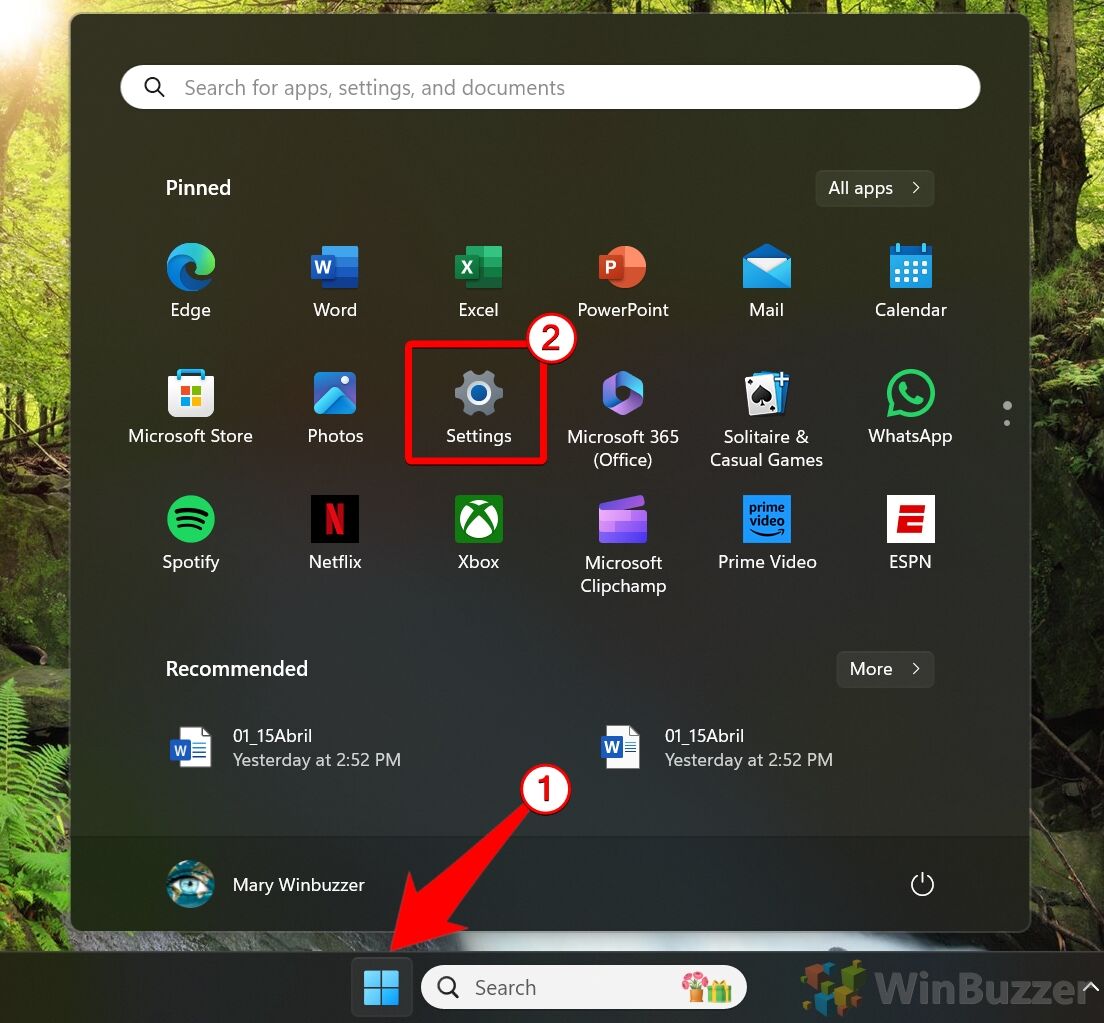
- Open SettingsOpen Windows 11 Settings via the hotkey “Windows + I” or the Start menu.

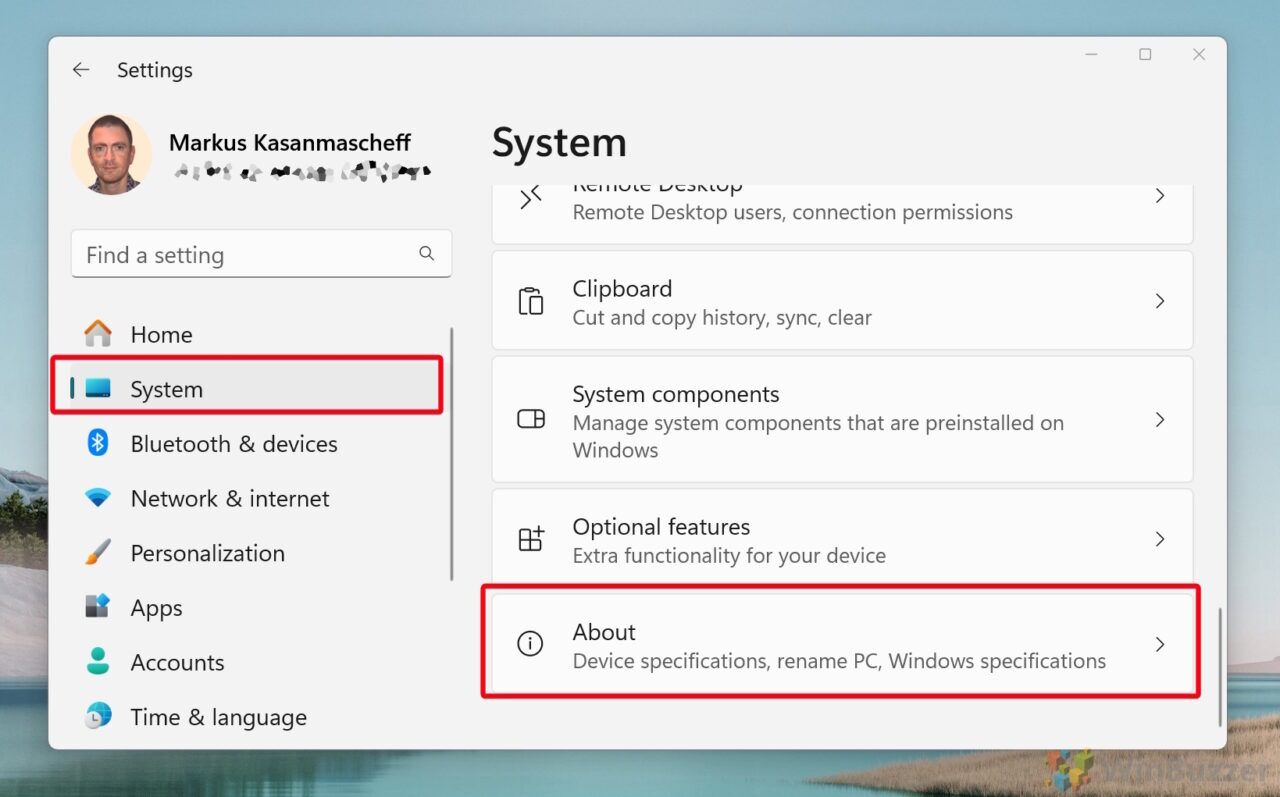
- Go to “About”Click on “System” and then “About” at the end on the right side.

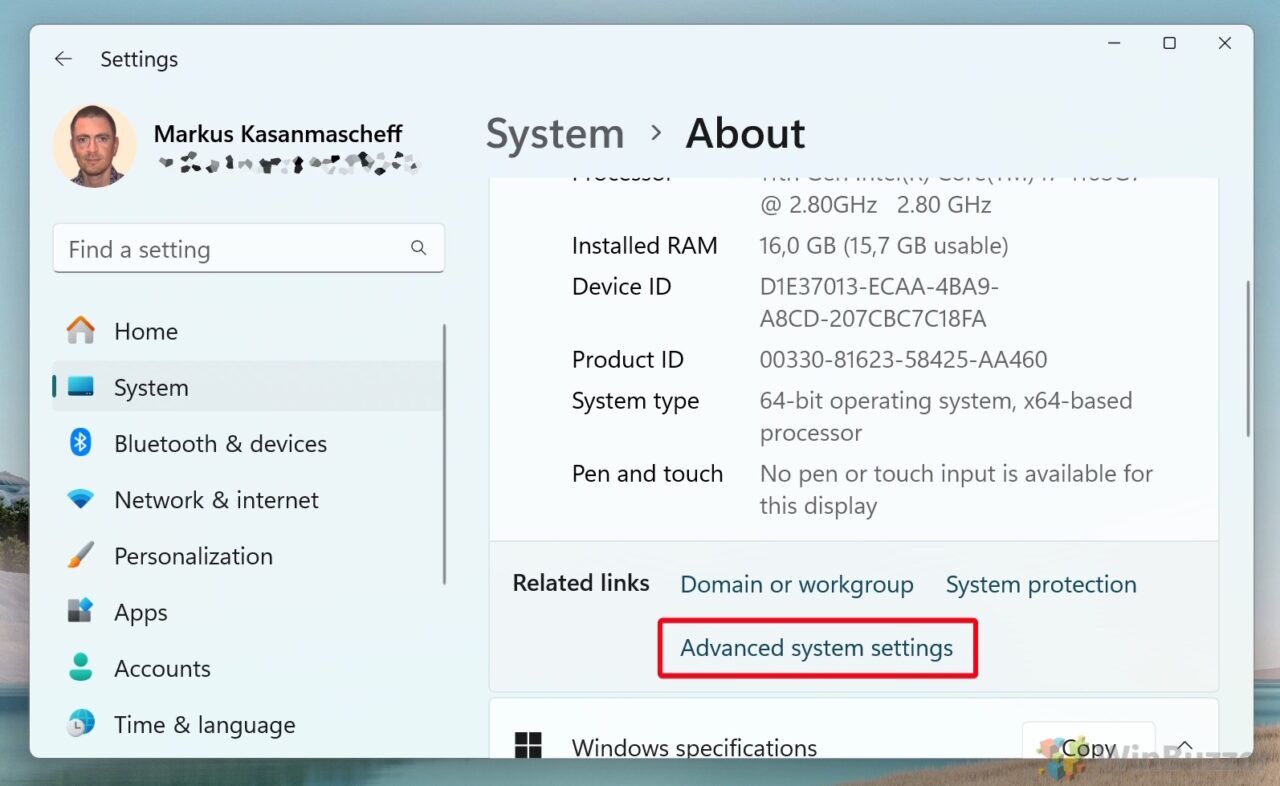
- Open “Advanced System Settings“
Scroll to “Related Links” and click on “Advanced System Settings“.

- Open Startup Recovery SettingsClick on “Settings” in “Startup and Recovery“.

- Select the memory dump formatThe “Write debugging information” section in the Startup and Recovery settings in Windows 11 provides several options for creating memory dumps. Ensure that the Write debugging information dropdown is set to generate the type of dump file you prefer:
None: No memory dump is created during a crash.
Use Case: When diagnostics are not needed or to save disk space.
Small memory dump (256 KB): Records basic crash information.
Use Case: Quick diagnostics, limited disk space.
Kernel memory dump: Records only kernel memory (Windows kernel, drivers).
Use Case: Detailed enough for most debugging, moderate disk space usage.
Complete memory dump: Captures all system memory.
Use Case: In-depth analysis, requires large disk space.
Automatic memory dump: Adjusts paging file size to capture kernel memory.
Use Case: Reliable dumps with minimal manual setup.
Active memory dump: Focuses on the most relevant sections of memory.
Use Case: Comprehensive data, but less disk space than Complete memory dump.

How To Open and Analyze Crash Dump Files with WinDbg
This method involves using WinDbg, a powerful tool provided by Microsoft for debugging and analyzing crash dump files.
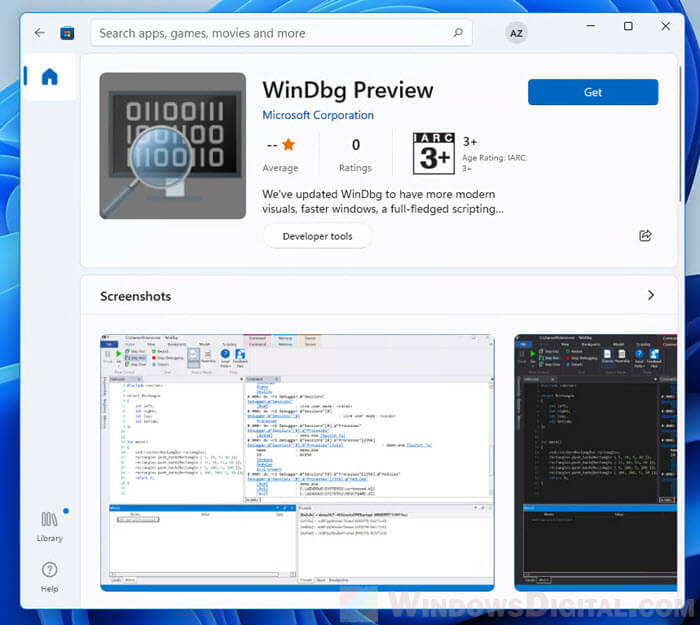
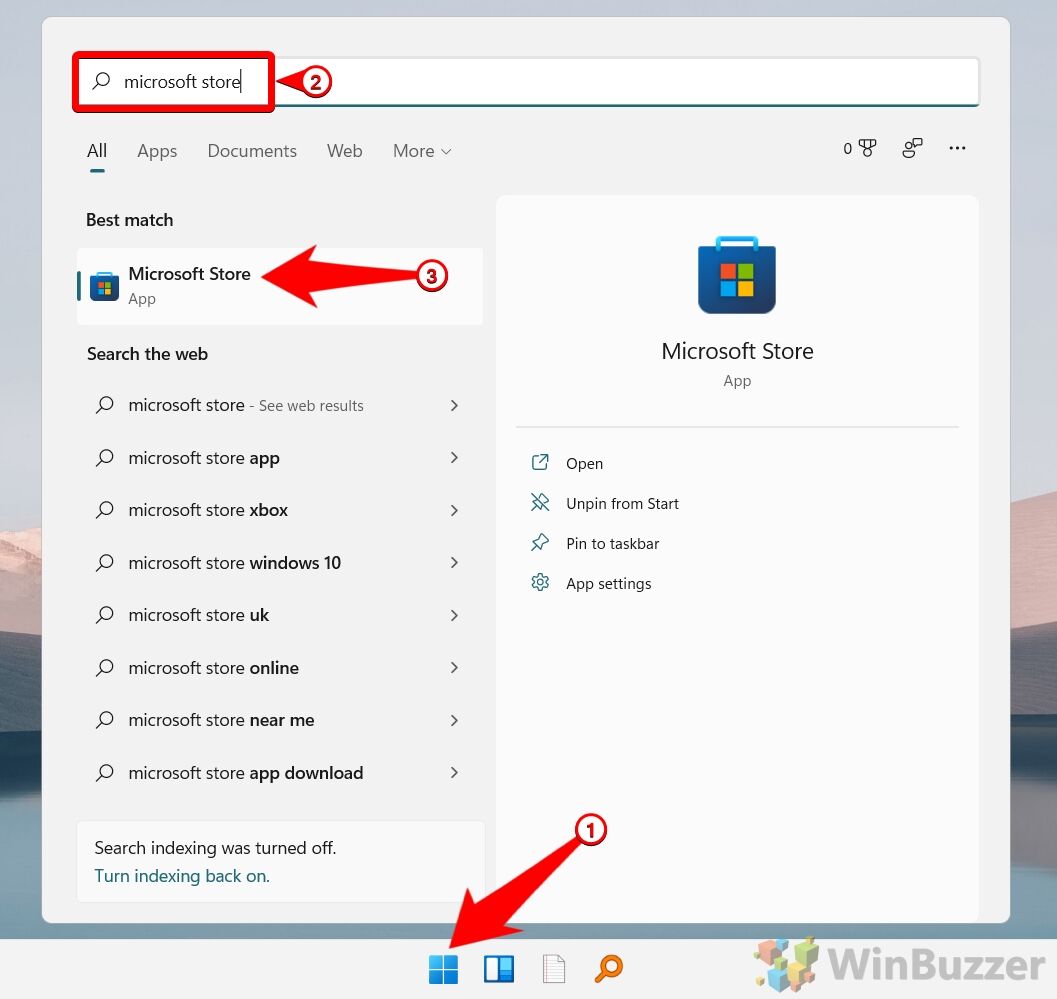
- Open the Microsoft Store AppLaunch the Microsoft Store from the Start menu.

- Install WinDbgUse the search bar in the Microsoft Store to find WinDbg. Click “Install” to download and install the tool.

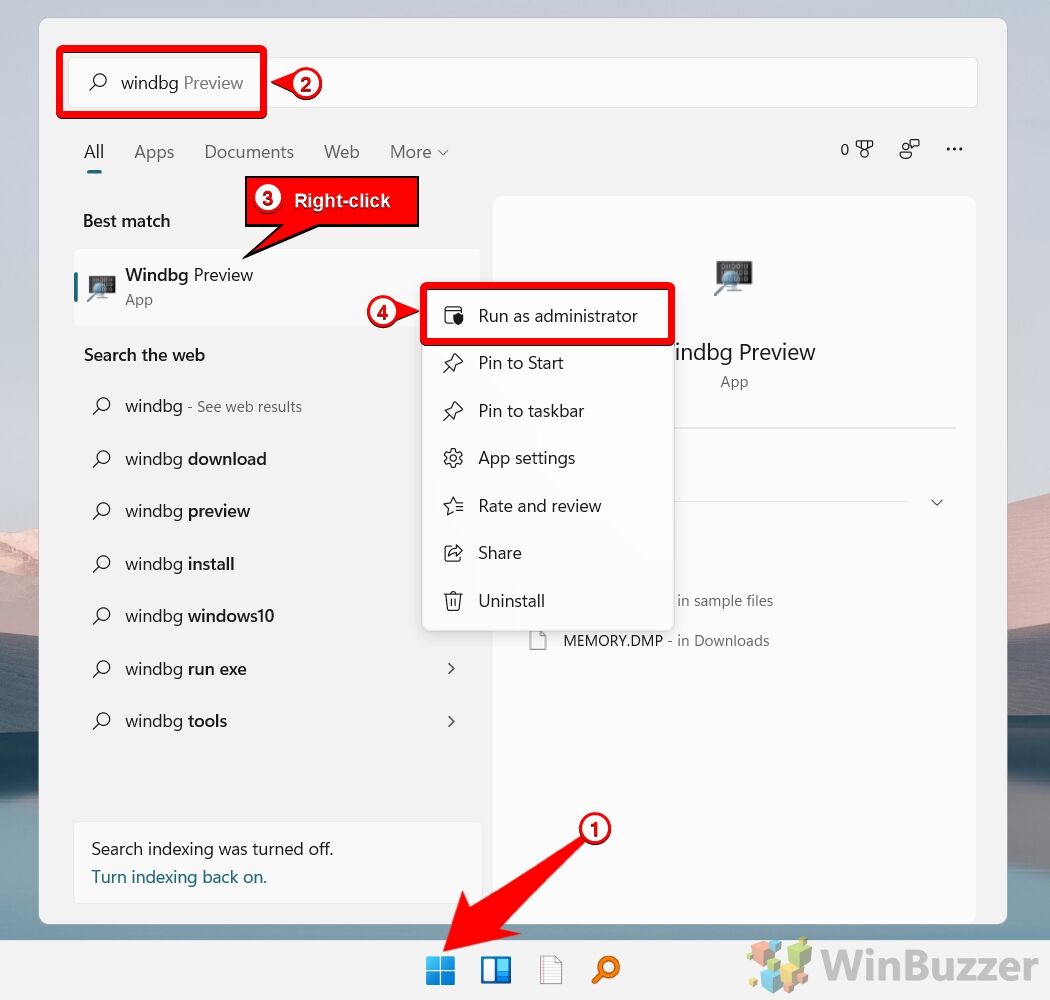
- Open WinDbg as AdministratorType “WinDbg” in the search bar, right-click the top result, and select “Run as administrator“.

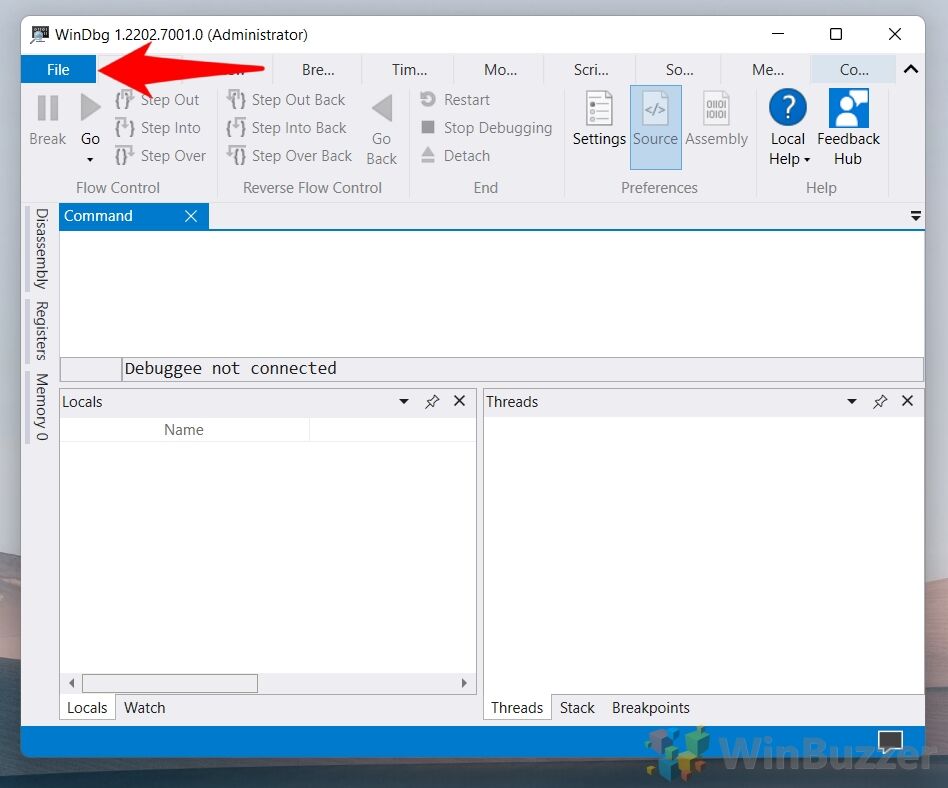
- Click the File menuIn WinDbg, click on the “File” menu.

- Start debugging and Open the dump fileClick on “Start debugging” from the dropdown menu and select the “Open dump file” option.

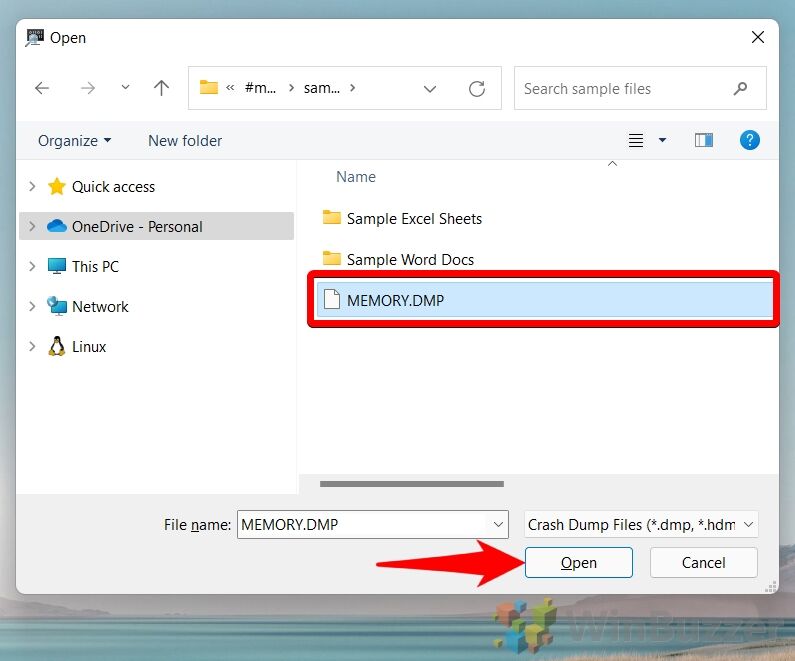
- Choose the dump fileNavigate to the dump file’s location, for example,
%SystemRoot%\Minidump, and select the file. Click the “Open” button to load the file.
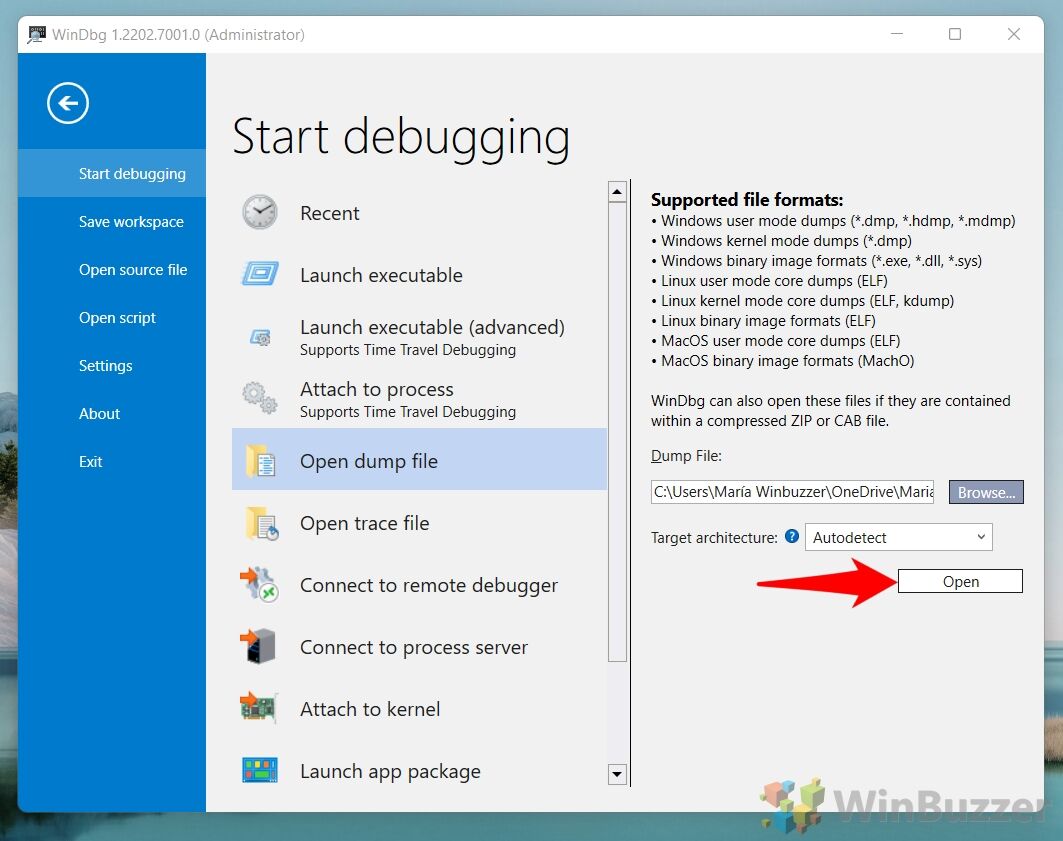
- Confirm the fileClick the “Open” button again to confirm. Wait for the progress bar to load the dump file (this may take some time).

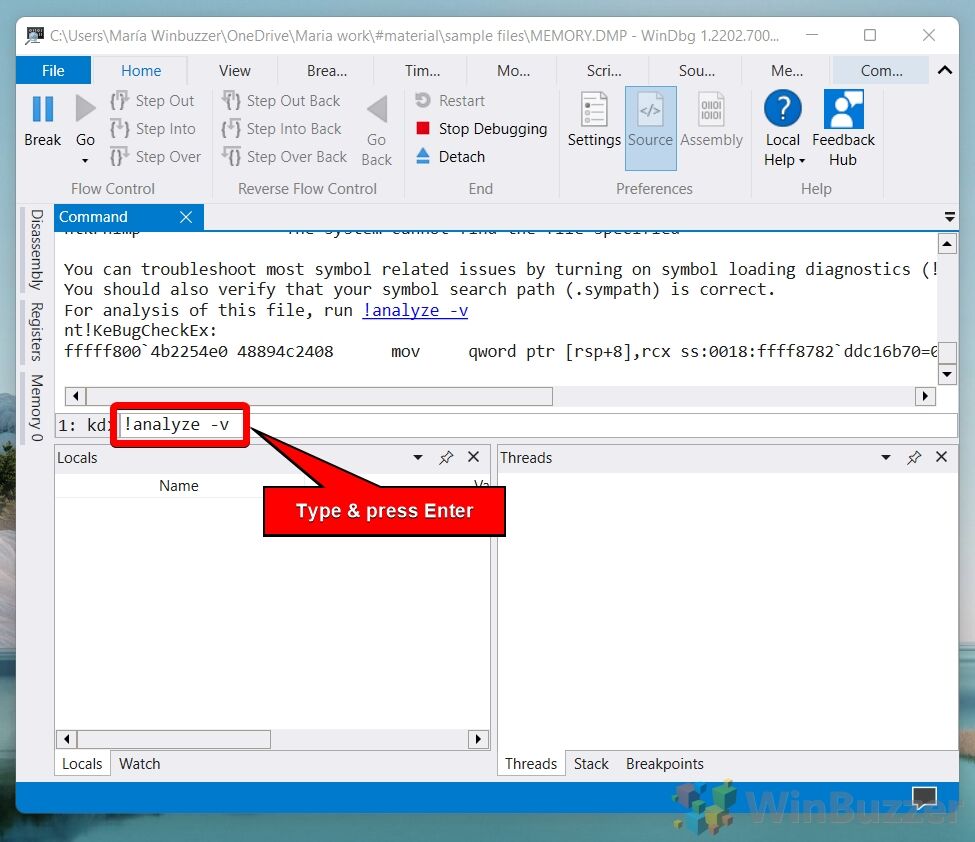
- Execute the analysis commandIn the command box, type
!analyze -vand press Enter. If available, you can also click the !analyze -v link from the main area after loading the dump file.
Wait for the progress bar to complete the analysis (this may take a while depending on the size of the data).
- Review the analysis results
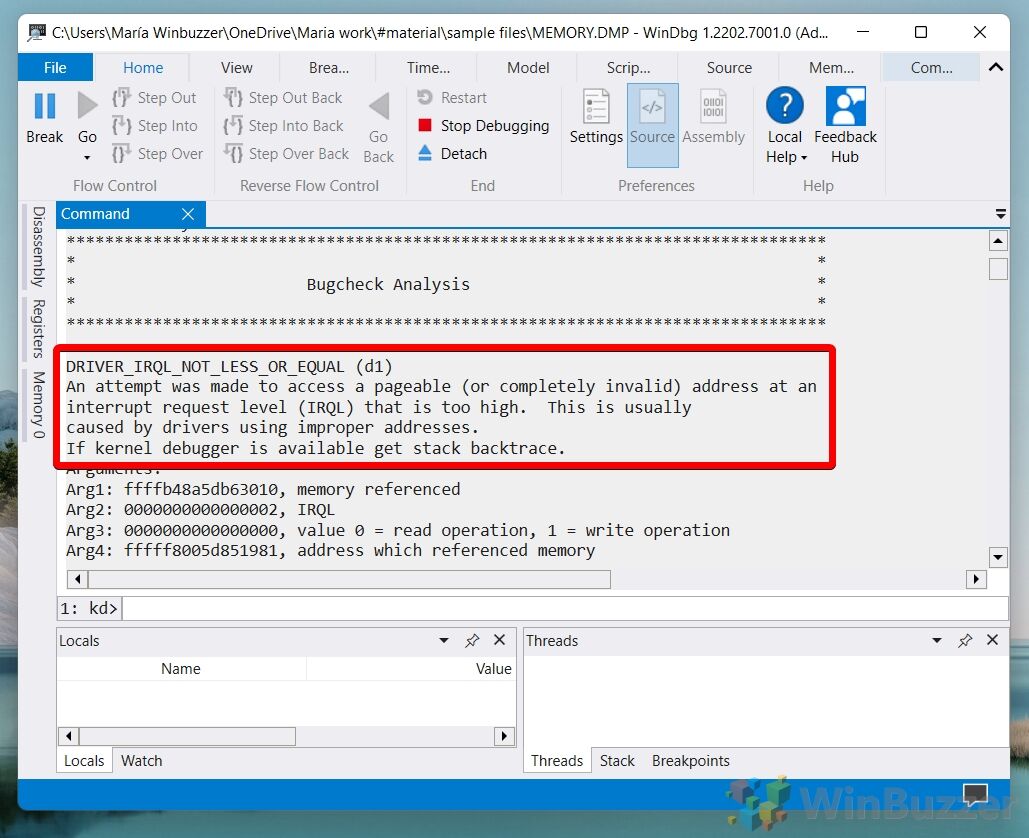
Once the analysis is complete, review the results to understand the cause of the crash. The output will display a summary of the crash, including key information such as the bug check code (also known as the stop code), parameters, and the likely cause of the crash.
-
Understand the Bug Check Code
- The bug check code is a hexadecimal number that identifies the type of error that occurred. For example, a bug check code of 0x0000001E indicates a “KMODE_EXCEPTION_NOT_HANDLED” error. You can look up the specific bug check code on the Microsoft Bug Check Code Reference to understand what it means.
-
Analyze the Parameters
- Each bug check code is followed by four parameters that provide additional information about the error. For instance, with a 0x0000001E error, the parameters may indicate the address of the exception and the type of exception that occurred.

-
-
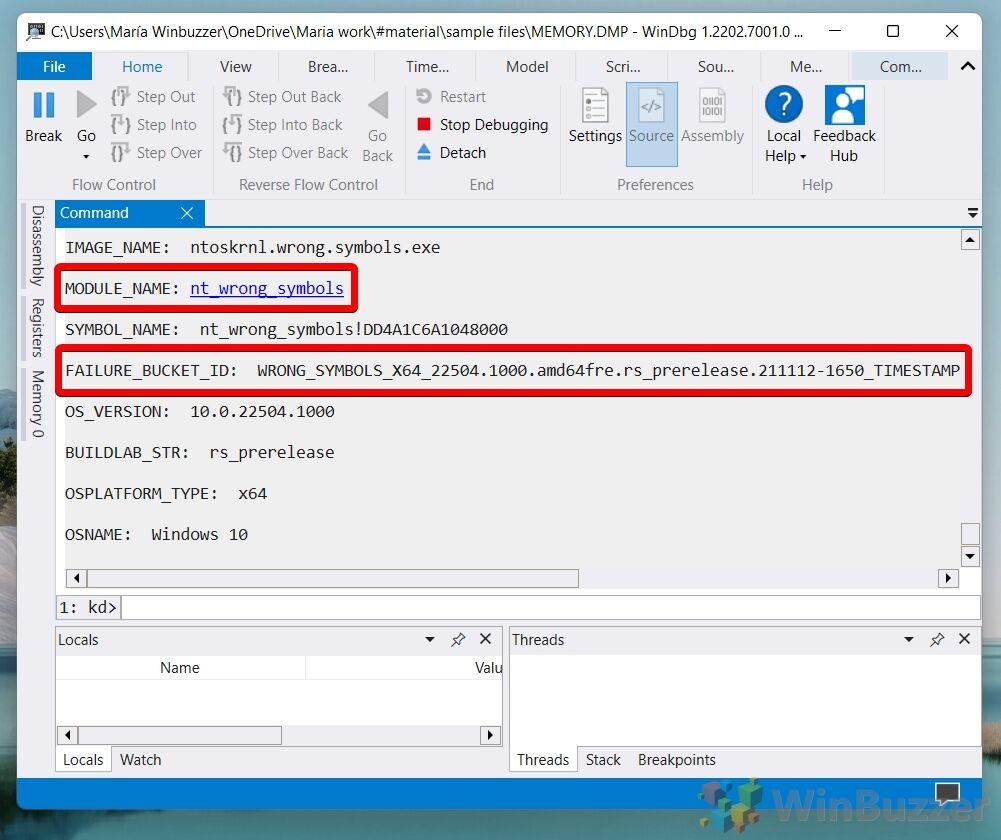
Identify the Faulting ModuleThe analysis will typically highlight the module (driver or system file) that is believed to have caused the crash. Look for lines that mention MODULE_NAME or FAULTING_MODULE. For example, if the output shows MODULE_NAME: ntoskrnl.exe, it suggests that the Windows kernel might be involved in the crash.
Examine the Call StackThe call stack provides a trace of function calls leading up to the crash. This can help you understand the sequence of events that triggered the error. The call stack is listed under STACK_TEXT. Each line represents a function call, with the most recent call at the top.
Review Additional InformationThe analysis might include other useful details, such as PROCESS_NAME (the name of the process running at the time of the crash) and BUGCHECK_STR (a string representation of the bug check code). These details can provide further context for diagnosing the issue.


Related: How to Do a Complete Memory Dump on Windows 11 or Windows 10
A memory dump is a copy of your computer’s memory at the time of a crash.To generate a complete memory dump in Windows 11 or Windows 10 you first need to modify your boot options to include the maximum memory option. You can then use the system properties menu to enable a complete memory dump, which will complete next time you experience a crash. In our other guide, we show you how to force a complete memory dump on Windows 11 or Windows 10 so that you can troubleshoot your bluescreen crashes.
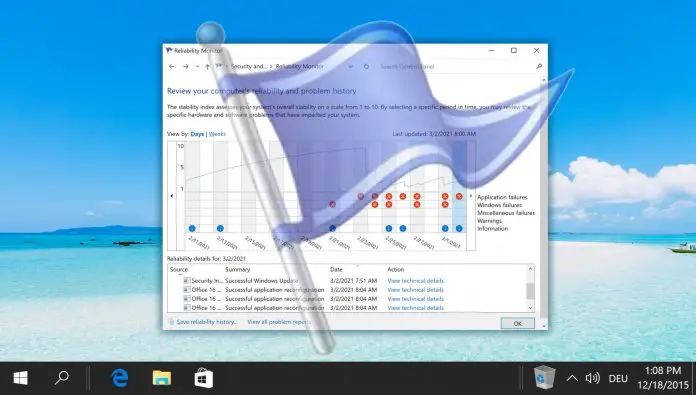
Related: How to Use Reliability Monitor to Analyze System Crashes and Freezes in Windows 11 or Windows 10
For users seeking alternative methods to diagnose system crashes, Windows also offers tools like the Reliability Monitor. This utility provides a timeline of system events, including crashes, which can help identify problematic software or drivers without delving into memory dumps. In our other guide, we show you how to use Reliability Monitor, including how you can view Reliability History in Windows 11 or Windows 10 and create a shortcut for easier access.
Related: How to Configure Blue Screen (BSOD) Dump Files in Windows 11 or Windows 10
A dump file, memory dump, or crash dump is a copy of your PC’s memory at the time it crashed. Knowing exactly what was in your computer’s memory before it departed to the blue realm is naturally useful to discover what caused it. In our other guide, we show you how to configure a BSOD dump file in Windows 11 or Windows 10 via the Control Panel/CMD, and where to find dump file locations.

FAQ – Frequently Asked Questions About Analyzing Crash Dump Files on Windows 11
What tools are available besides WinDbg for analyzing dump files on Windows 11?
In addition to WinDbg, tools like BlueScreenView from NirSoft and WhoCrashed from Resplendence offer intuitive interfaces for easy analysis of Windows dump files. These tools simplify the process by summarizing the important crash information and presenting it in a more accessible format, ideal for users who may not be experienced with in-depth debugging tools.
Can I open a .dmp file with a text editor?
.dmp files are binary and not designed to be read with text editors, as doing so will display unintelligible content. Instead, use specialized tools such as WinDbg, which can properly interpret and analyze the contents of dump files to give meaningful insights into the causes of system crashes.
What might cause Windows not to generate a dump file after a crash?
Several factors can prevent the creation of dump files: insufficient disk space, settings in System Properties > Startup and Recovery not configured to capture dump files, or an overwrite issue where existing dump files are not replaced. Always ensure that there is enough disk space and check system settings to confirm that dump generation is enabled and configured correctly.
Can analyzing a crash dump file tell me which software caused my system to crash?
Yes, analyzing crash dump files can often identify not only faulty software or drivers but also provide specific error messages and malfunctioning modules. The analysis highlights the ‘MODULE_NAME‘ or ‘FAULTING_MODULE‘, aiding in pinpointing the exact cause of the crash.
What should I do if WinDbg does not show any useful information after analyzing a dump file?
If WinDbg’s analysis appears inconclusive, double-check the memory dump type and settings. A complete memory dump may provide more details than a smaller one. Re-run the analysis with ‘!analyze -v‘ for a more verbose output. If issues persist, consider updating WinDbg or using an alternative analysis tool.
How long does it typically take to analyze a dump file with WinDbg?
The analysis time varies based on the dump file size and system performance. A minidump file can be analyzed in seconds, while a complete memory dump might take much longer, potentially hours for very large files on slower systems. Ensuring your system has sufficient processing power and memory can help reduce analysis time.
Can I automate the opening and initial analysis of dump files whenever a new file is created?
Automation of dump file analysis can be achieved through scripting using PowerShell or batch files that automatically trigger WinDbg with the appropriate commands upon the creation of new dump files. This requires some scripting knowledge to set up but can significantly streamline the process for frequent analysts.
How can I view the call stack in WinDbg?
To view the call stack in WinDbg, load the dump file, execute ‘!analyze -v‘, and look for the ‘STACK_TEXT‘ section in the output. This section lists the sequence of function calls leading up to the crash, providing valuable clues about the execution path and potential causes of the crash.
Is it possible to retrieve data from a crash dump file about the operating system version and hardware details?
Yes, crash dump files include a snapshot of the system state, which contains information about the operating system version, hardware configuration, and active processes at the crash time. Use the ‘!sysinfo‘ command in WinDbg to access comprehensive system information included in the dump.
What is the importance of knowing the bug check code after a system crash?
The bug check code (stop code) is crucial as it identifies the specific error or event that led to the system crash. This hexadecimal code helps in diagnosing the underlying issue by referencing it against known error codes documented by Microsoft, allowing for targeted troubleshooting steps.
How do I resolve errors when WinDbg fails to load a dump file?
If WinDbg fails to load a dump file, check for file corruption, ensure the file is not being accessed or locked by another process, and verify that the correct version of WinDbg is used. Update WinDbg to the latest version to support recent operating system changes and ensure maximum compatibility.
What are the security implications of storing complete memory dumps?
Complete memory dumps can contain sensitive data including passwords, open files, program data, and other personal information. Handle and store these files securely, use encryption if necessary, and follow organizational guidelines on data security when managing crash dumps.
Is there a way to reduce the size of a memory dump without switching to a minidump?
Opting for an ‘Active memory dump’ provides a middle ground by including more detailed information than a minidump while excluding less relevant memory sections, thus reducing the overall size. This is especially useful in environments where space is a concern but detailed analysis is needed.
Can dump files be shared securely for external analysis?
Dump files can be securely shared with experts for diagnostics by using secure transfer methods such as encrypted emails or secure cloud storage. Always ensure that the recipient is trustworthy and understands the confidentiality of the data contained in the dump files.
What preventative measures can be taken to minimize system crashes in Windows 11?
Regular maintenance such as updating Windows and drivers, checking for hardware issues, and eliminating malware can reduce system crashes. Utilize system monitoring tools to track system health and address warnings promptly to prevent crashes before they happen.
Last Updated on November 7, 2024 3:22 pm CET