
If your system has crashed and experienced a Blue Screen of Death (BSoD), or a program or Windows feature suddenly crashes, Windows automatically generates a record of the conditions and circumstances under which the error occurred. This information is stored in dump files with the extension “.dmp.”
These dump files can help troubleshoot the root cause of the error so that it does not occur again.
This article contains everything you need to know about these dump files and how they can be opened in Windows, since there is no native method, so they can be analyzed to determine the cause of the error.
Table of Contents
Windows Crash Dump Files
Crash dump files, also known as “mini-dump files,” are system-generated binary files that contain various information about a crash that may have occurred on your computer. Like Event Viewer, these files can be used to determine the cause of the error, and then use that data to fix it. Dump files can contain the following data in them, which can be helpful for the matter:
The list below highlights the content which can be found inside a mini-dump file.
- The Stop message (error code), its parameters, and other data.
- List of loaded drivers.
- The processor context (PRCB) for the processor that stopped.
- Process information and kernel context (EPROCESS) for the process stopped.
- Process information and kernel context (ETHREAD) for the thread stopped.
- Kernel-mode call stack for the thread that stopped.
Dump files are created by copying the data off the system memory and onto the computer’s storage. It uses the Windows Page File and requires at least 2MB of free space. With this information, you can understand how different dump files are created.
Windows can write debugging information in three types of dump files.
Types of Dump Files
Complete Memory Dump
Complete Memory Dump files are the largest of the dump files. In this case, the complete contents of the memory are written onto the dump file.
When generated by the system, all old Complete Memory Dump files are replaced and overwritten.
Complete Memory Dump files are saved to C:\Windows\MEMORY.DMP file.
Kernel Memory Dump
Kernel Memory Dump files only contain data from kernel memory, which is why they are relatively smaller in size. Such files do not contain data from any unused, unallocated memory or the memory used by user-mode programs.
When generated by the system, all old Kernel Memory Dump files are replaced and overwritten.
Kernel Memory Dump files are also saved to C:\Windows\MEMORY.DMP file, the same as Complete Memory Dump files. However, only one of these is saved at a time and is overwritten when another crash occurs.
Small Memory Dump/Mini Memory Dump
The minidump file, which we will discuss in this post, is the smallest kind of dump file. This file contains the information described above that can assist in determining the cause of the crash.
Minidump files generated by the system are not overwritten. Instead, a new one is generated.
Minidump files can be found at C:\Windows\Minidump. If you do not find a directory named “Minidump,” it is likely because a dump file has not been created yet.
When a minidump file is created, Windows automatically includes the date it was created on. For example, in Windows 11, if a file is named “020322-18890-01.dmp,” “02” indicates the month, “03” indicates the date, and “22” indicates the year the file was created. “-01” at the end indicates it was the first dump file created that day.
The same is true for a minidump file created in Windows 10, which is automatically named something like “mini020322-01.dmp.”
Now let’s move on to opening and analyzing a dump file.
How to Read and Analyze DMP Files
As we mentioned, Windows does not allow you to open dump files directly. However, you can use other tools available online to open and analyze them. One of the most common tools to do so is through the Windows Debugging (WinDbg) tool, which can be downloaded through Microsoft Store. Continue reading the given guide below to use this tool to open and analyze memory dump files in Windows.
Using WinDbg
We have divided this section into 2 parts: Downloading and installing the WinDbg tool and then using it to analyze a dump file.
Download and Install WinDbg
- Open the WinDbg Preview page in the Microsoft Store and click Get.

- The browser will prompted you to open the Microsoft Store app, click Open Microsoft Store.
- From the Store app, click Get again.


The WinDbg tool will now begin to download and then install. We are now done with the installation phase. Let us now use the tool to open and analyze dump files.
Open and Analyze dmp files using WinDbg
- Open the WinDbg tool with administrative rights by searching for it through the search box, right-clicking it, and then clicking Run as administrator from the context menu.

- From the WinDbg tool, click File from the top menu.
- In the Start Debugging tab, click Open dump file.

- Now click Browse from the right pane within the tool and select the dump file that you want to analyze by navigating to
C:\Windows\Minidump. When selected, click Open.
- The tool will now open the dump file, which can take a few minutes. When the dump file successfully opens, type in the following command in the text field in front of “0: kd>“:
!analyze -v
- WinDbg will now begin analyzing the dump file. This can take a few minutes to complete. Once completed, you should see the results in the top window.


In the example above, since we initiated a BSoD intentionally, it states “The user manually initiated this crash dump.” Otherwise, if it were an actual error, you would see different statements and information after performing the analysis of the dump file.
You can then use this information to troubleshoot the error that caused the crash.
Using WhoCrashed
Download WhoCrashed

WhoCrashed is available in both free and paid editions. However, the free edition is sufficient to open and analyze dump files. With this tool, you can obtain reports on the dump files with a single click. The tool will automatically scan your system files for any .dmp files and fetch the data within.
To do so, download WhoCrashed from the link given above, and run the .exe file to install in a few easy steps. Once installed, click Analyze from the ribbon menu at the top. The tool will then take a few seconds to scan any dump files and present the analysis. You can also view the .dmp files discovered from the Dump files tab.
Using BlueScreenView
Download BlueScreenView

BlueScreenView is a portable and small tool that can provide you with relevant information on minidump files. When you run this tool, it automatically picks up any .dmp files in the Minidump directory and displays the relevant information gathered from them. If there are multiple .dmp files, you can click on the one you want to analyze from the top field within the tool, and the information is presented in the bottom one.
Simply download the app from the link given above, extract the content and run the BlueScreenView application.
Final Thoughts
Dump files, regardless of their type, can be pretty useful when it comes to troubleshooting your operating system. However, the methods we have used above to analyze them may not be everyone’s cup of tea, as some of you may find them complex.
That said, there are more methods to analyze dump files using tools, but they involve using the Command prompt, not a Graphical User Interface (GUI). If you’d still like to learn more about it, you can read this detailed post by Microsoft on memory dump files.
Загрузить PDF
Загрузить PDF
Из этой статьи вы узнаете, как анализировать файлы дампа после сбоя Windows. В таких файлах, которые автоматически создаются после сбоя системы, содержится список программ, которые работали до сбоя; так можно выяснить, какие программы привели к сбою. Если вы ждете очередного сбоя или хотите протестировать программу, используйте бесплатную программу BlueScreenView, чтобы анализировать файлы дампа. Также можно воспользоваться бесплатным инструментом Windows 10 Drivers Kit (WDK), чтобы открыть файлы дампа.
-

Нажмите на логотип Windows в нижнем левом углу экрана.
-
Начнется поиск раздела «Просмотр расширенных параметров системы» Панели управления.
-
Этот значок в виде монитора с галочкой расположен в верхней части меню «Пуск». Откроется окно «Расширенные параметры системы».
-
Это вкладка в верхней части окна.
- Возможно, сначала нужно щелкнуть по значку в виде монитора, который находится в нижней части экрана, чтобы открыть окно «Расширенные параметры системы».
-
Эта кнопка находится в разделе «Загрузка и восстановление» в нижней части страницы. Откроется новое окно.
-
Вы найдете его посередине окна.
-
Эта опция находится в меню. В этом случае файлы дампа можно прочесть с помощью таких программ, как BlueScreenView.
-
Эта кнопка находится в нижней части окна. Вы вернетесь в окно «Расширенные параметры системы».
-
Изменения будут сохранены, а окно «Расширенные настройки системы» закрыто.
-
Перейдите на страницу https://www.nirsoft.net/utils/blue_screen_view.html в браузере. BlueScreenView — это программа, которая находит и анализирует файлы дампа, чтобы выяснить, какие программы работали до сбоя.
-
Прокрутите страницу вниз и нажмите «Download BlueScreenView with full install/uninstall support» (Скачать BlueScreenView с полной поддержкой); эта ссылка находится посередине страницы.
-
Дважды щелкните по файлу «bluescreenview_setup» в папке для загрузок.
-
Для этого:
- нажмите «Да», когда будет предложено;
- нажмите «Next» (Далее);
- нажмите «Next» (Далее);
- нажмите «Install» (Установить);
- дождитесь, когда BlueScreenView будет установлена.
-
Установите флажок у «Run NirSoft BlueScreenView» (Запустить NirSoft BlueScreenView), а затем нажмите «Finish» (Завершить) в нижней части окна. BlueScreenView откроется.
-
В BlueScreenView есть верхняя и нижняя панели; файл дампа отобразится на верхней панели, а на нижней появится список программ, которые работали до сбоя.
- Чтобы выбрать файл дампа, щелкните по нему на верхней панели.
- Скорее всего, как минимум одна программа, которая есть в файле дампа, ответственна за сбой.
Реклама


-
-
Прокрутите страницу вниз и нажмите «Download WDK for Windows 10, version 1803» (Скачать WDK для Windows 10, версия 1803); эта ссылка находится в разделе «Install WDK for Windows 10» (Установить WDK для Windows 10) в верхней части страницы.
-
Дважды щелкните по файлу «wdksetup» в папке для загрузок.
-
Для этого:
- нажмите «Next» (Далее) на первых 4 страницах;
- нажмите «Accept» (Принять);
- нажмите «Yes» (Да), когда будет предложено;
- дождитесь, когда WDK будет установлен.
-
Нажмите на логотип Windows в нижнем левом углу экрана.
-
Начнется поиск командной строки.
-
Это значок в виде черного квадрата в верхней части меню «Пуск». Раскроется меню.
-
Эта опция находится в меню.
- Вы не сможете выполнить этот шаг, если у вас нет учетной записи администратора.
-
Запустится командная строка (с правами администратора).
-
Введите следующий адрес, а затем нажмите ↵ Enter:
cd C:\Program Files (x86)\Windows Kits\10\Debuggers\x86
-
Введите
windbg.exe -IA, а затем нажмите ↵ Enter. -
Теперь WDK будет автоматически открывать файлы дампа.
-
Откройте меню «Пуск»

, введите windbg и нажмите «WinDbg (X86)» в результатах поиска. Откроется Отладчик Windows.
-
Путь к символу указывает отладчику Windows, какую информацию следует отобразить:[1]
- нажмите «File» (Файл) в верхнем левом углу;
- нажмите «Symbol File Path» (Путь к символу);
- введите
SRV*C:\SymCache*http://msdl.microsoft.com/download/symbols - нажмите «OK».
-
Для этого перейдите в корневой каталог системы:
- откройте меню «Пуск»;
- введите выполнить и нажмите ↵ Enter;
- введите %SystemRoot%;
- нажмите «OK»;
- перейдите на вкладку «Вид»;
- установите флажок у «Скрытые элементы»;
- прокрутите вниз и дважды щелкните по файлу «MEMORY.DMP».
-
Отобразится список программ, которые работали до сбоя — этот список поможет выяснить, какая программа(ы) привела к сбою.
Реклама


Советы
- BlueScreenView идеально подходит для тестирования различных программ (например, запустите программу и проверьте, произойдет ли сбой), так как она быстро устанавливается и запускается.
Реклама
Предупреждения
- Компьютерные сбои, особенно «синие экраны смерти» (BSOD), могут случиться по разным причинам — от неисправного приложения до сломанного процессора. Таким образом, даже если вы просмотрите содержимое файла дампа, не факт, что вы найдете причину сбоя.
Реклама
Об этой статье
Эту страницу просматривали 23 052 раза.
Была ли эта статья полезной?
Dear readers of our blog, we’d like to recommend you to visit the main page of our website, where you can learn about our product SQLS*Plus and its advantages.
SQLS*Plus — best SQL Server command line reporting and automation tool! SQLS*Plus is several orders of magnitude better than SQL Server sqlcmd and osql command line tools.
Enteros UpBeat offers a patented database performance management SaaS platform. It proactively identifies root causes of complex revenue-impacting database performance issues across a growing number of RDBMS, NoSQL, and deep/machine learning database platforms. We support Oracle, SQL Server, IBM DB2, MongoDB, Casandra, MySQL, Amazon Aurora, and other database systems.
20 August 2020
In Windows, when the operating system crashes, an emergency memory dump is automatically created and saved in the Windows system directory in the MEMORY.DMP file (%SystemRoot%\MEMORY.DMP).
This file helps to determine the cause of operating system failure and determine the process that may have caused the OS to shut down. The memory dump file can be several gigabytes in size, so special tools are required to analyze it.
The steps to be taken to analyze the MEMORY.DMP emergency memory dump file
To read the MEMORY.DMP file, you will need a special utility: Debugging Tools for Windows (WinDbg), which is part of Windows 10 SDK, you can download it here: Windows 10 SDK, both as an installer and as an ISO file.
The SDK (software development kit) is a development kit that allows software professionals to create applications for a specific software package, software basic development tools, hardware platform, computer system, game consoles, operating systems and other platforms.
1. Run the installation file on the computer where the MEMORY.DMP emergency memory dump analysis will be performed.
2. Select the installation path and press Next 2 times.
")
3. 3. Adopt license agreement
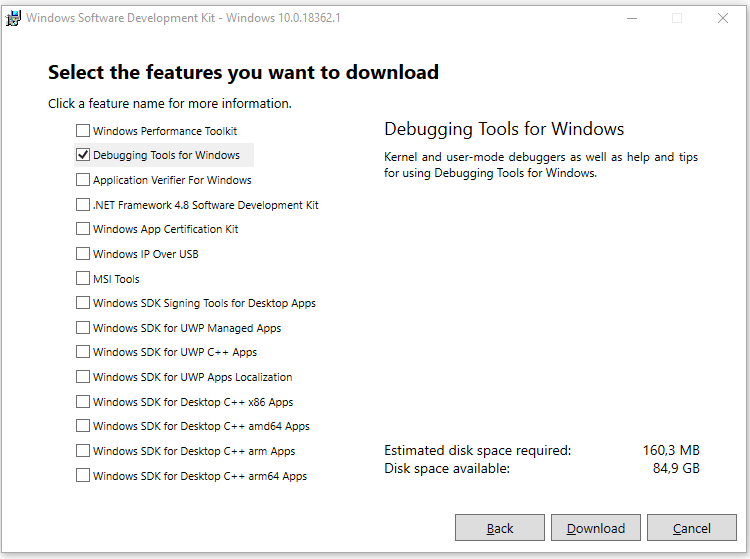
4. Select Debugging Tools for Windows in the window of selecting a set of utilities to be installed (you won’t need any other items to analyze the memory dump) and press Install
")
5. When the installation is complete, press Close
")
The Debugging Tools for Windows utility is installed.
1. Run the installed WinDbg utility and select Open Crash Dump in the File menu.
")
2. In the file opening window, go to the MEMORY.DMP file path and open it
3. After studying the headlines, click on the link: !analyze -v or enter this command manually
")
4. Waiting for some time for the utility to read the file and search for errors
5. Analyzing information about the process that caused Windows to crash
")
Using this information, you can understand which process caused the OS crash.
If the specified process belongs to the software manufacturer, you can refer to it with the corresponding case.
If your PC has recently crashed, you must have faced the Blue Screen of Death (BSOD), which lists the crash’s cause and then the PC shutdown abruptly. Now the BSOD screen is only shown for a few seconds, and it’s not possible to analyze the reason for the crash at that moment. Thankfully, when Windows crashes, a crash dump file (.dmp) or memory dump is created to save information about the crash just before the Windows shutdown.

As soon as the BSOD screen is displayed, Windows dumps the information about the crash from the memory to a small file called “MiniDump” which is generally saved in the Windows folder. And this .dmp files can help you troubleshoot the cause of the error, but you need to analyze the dump file. This is where it gets tricky, and Windows doesn’t use any pre-installed tool to analyze this memory dump file.
Now there is a various tool which can help you debug the .dmp file, but we are going to talk about two tools which are BlueScreenView and Windows Debugger tools. The BlueScreenView can analyze what went wrong with the PC quickly, and the Windows Debugger tool can be used to get more advanced information. So without wasting any time let’s see How to Read Memory Dump Files in Windows 10 with the help of the below-listed guide.
Make sure to create a restore point just in case something goes wrong.
Method 1: Analyze Memory Dump Files using BlueScreenView
1. From NirSoft Website downloads the latest version of BlueScreenView according to your version of Windows.
2. Extract the zip file you download and then double-click on BlueScreenView.exe to run the application.

3. The program will automatically search for the MiniDump files at the default location, which is C:\Windows\Minidump.
4. Now if you want to analyze a particular .dmp file, drag and drop that file to BlueScreenView application and the program will easily read the minidump file.

5. You will see the following information at the top of the BlueScreenView:
- The name of the Minidump file: 082516-12750-01.dmp. Here 08 is the month, 25 is the date, and 16 is the year of the dump file.
- Crash Time is when the crash happens: 26-08-2016 02:40:03
- Bug Check String is the error code: DRIVER_VERIFIER_IOMANAGER_VIOLATION
- Bug Check Code is the STOP error: 0x000000c9
- Then there will be Bug Check Code Parameters
- The most important section is Caused By Driver: VerifierExt.sys
6. In the lower part of the screen, the driver who caused the error will be highlighted.

7. Now you have all the information about the error you could easily search the web for the following:
Bug Check String + Caused by Driver, e.g., DRIVER_VERIFIER_IOMANAGER_VIOLATION VerifierExt.sys
Bug Check String + Bug Check Code eg: DRIVER_VERIFIER_IOMANAGER_VIOLATION 0x000000c9

8. Or you can right-click on the minidump file inside the BlueScreenView and click “Google Search – Bug Check + Driver“.

9. Use this information to troubleshoot the cause and fix the error. And this is the end of the guide How to Read Memory Dump Files in Windows 10 using BlueScreenView.
Method 2: Analyze Memory Dump Files Using Windows Debugger
1. Download Windows 10 SDK from here.
Note: This program contains WinDBG program that we will be using to analyze the .dmp files.
2. Run the sdksetup.exe file and specify the installation location or use default.

3. Accept License agreement then at “Select the features you want to install” screen select only the Debugging Tools for Windows option and then click Install.

4. The application will begin downloading the WinDBG program, so wait for it to be installed on your system.
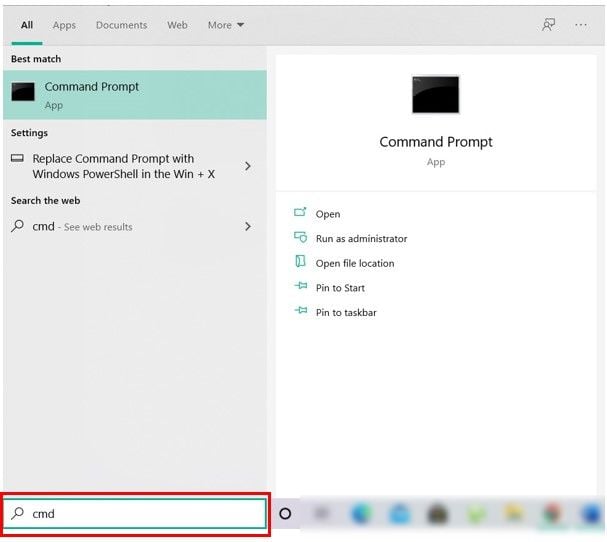
5. Open Command Prompt. The user can perform this step by searching for ‘cmd’ and then press Enter.
6. Type the following command into cmd and hit Enter:
cd\Program Files (x86)\Windows Kits\10\Debuggers\x64\
Note: Specify the correct installation of the WinDBG program.
7. Now once you’re inside the correct directory type the following command to associate WinDBG with .dmp files:
windbg.exe -IA

8. As soon as you enter the above command, a new blank instance of WinDBG will open with a confirmation notice which you can close.

9. Type windbg in Windows Search then click on WinDbg (X64).
10. In the WinDBG panel, click on File, then select Symbol File Path.
11. Copy and paste the following address into the Symbol Search Path box:
SRV*C:\SymCache*http://msdl.microsoft.com/download/symbols

12. Click OK and then save the symbol path by clicking File > Save Workspace.
13. Now find the dump file you want to analyze, you could either use the MiniDump file found in C:\Windows\Minidump or use the Memory dump file found in C:\Windows\MEMORY.DMP.

14. Double click the .dmp file and the WinDBG should launch and begin processing the file.

Note: Since this is the first .dmp file being read on your system, WinDBG appears to be slow but do not interrupt the process as these processes are being carried out in the background:
A folder called Symcache is being created in C:
Symbols are being downloaded and saved to C:\Symcache
Once the symbols have been downloaded, and the dump is ready to analyze, you will see the message Followup: MachineOwner at the dump text’s bottom.

15. Also, the next .dmp file is processed, it will be quicker as it will have already downloaded the required symbols. Over time the C:\Symcache folder will grow in size as more symbols are added.
16. Press Ctrl + F to open Find then type “Probably caused by” (without quotes) and hit Enter. This is the quickest way to find what caused the crash.

17. Above the Probably caused by line, you will see a BugCheck code, e.g., 0x9F. Use this code and visit Microsoft Bug Check Code Reference for verifying the bug check refer.
Recommended:
- Fix Windows can’t set up a HomeGroup on this computer
- Fix Computer Screen Turns Off Randomly
- How To Fix Right Click Not Working in Windows 10
- Fix The Registry editor has stopped working
That’s it you have successfully learned How to Read Memory Dump Files in Windows 10 but if you still have any queries regarding this post then feel free to ask them in the comment’s section.
В момент критического сбоя операционная система Windows прерывает работу и показывает синий экран смерти (BSOD). Содержимое оперативной памяти и вся информация о возникшей ошибке записывается в файл подкачки. При следующей загрузке Windows создается аварийный дамп c отладочной информацией на основе сохраненных данных. В системном журнале событий создается запись о критической ошибке.
Внимание! Аварийный дамп не создается, если отказала дисковая подсистема или критическая ошибка возникла на начальной стадии загрузки Windows.
Содержание:
- Типы аварийных дампов памяти Windows
- Как включить создание дампа памяти в Windows?
- Установка WinDBG в Windows
- Настройка ассоциации .dmp файлов с WinDBG
- Настройка сервера отладочных символов в WinDBG
- Анализ аварийного дампа памяти в WinDBG
Типы аварийных дампов памяти Windows
На примере актуальной операционной системы Windows 10 (Windows Server 2016) рассмотрим основные типы дампов памяти, которые может создавать система:
- Мини дамп памяти (Small memory dump) (256 КБ). Этот тип файла включает минимальный объем информации. Он содержит только сообщение об ошибке BSOD, информацию о драйверах, процессах, которые были активны в момент сбоя, а также какой процесс или поток ядра вызвал сбой.
- Дамп памяти ядра (Kernel memory dump). Как правило, небольшой по размеру — одна треть объема физической памяти. Дамп памяти ядра является более подробным, чем мини дамп. Он содержит информацию о драйверах и программах в режиме ядра, включает память, выделенную ядру Windows и аппаратному уровню абстракции (HAL), а также память, выделенную драйверам и другим программам в режиме ядра.
- Полный дамп памяти (Complete memory dump). Самый большой по объему и требует памяти, равной оперативной памяти вашей системы плюс 1MB, необходимый Windows для создания этого файла.
- Автоматический дамп памяти (Automatic memory dump). Соответствует дампу памяти ядра с точки зрения информации. Отличается только тем, сколько места он использует для создания файла дампа. Этот тип файлов не существовал в Windows 7. Он был добавлен в Windows 8.
- Активный дамп памяти (Active memory dump). Этот тип отсеивает элементы, которые не могут определить причину сбоя системы. Это было добавлено в Windows 10 и особенно полезно, если вы используете виртуальную машину, или если ваша система является хостом Hyper-V.
Как включить создание дампа памяти в Windows?
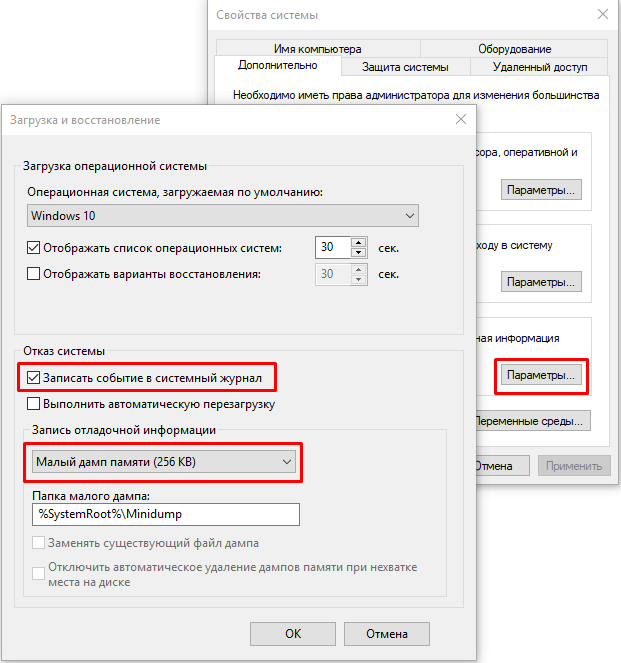
С помощью Win+Pause откройте окно с параметрами системы, выберите «Дополнительные параметры системы» (Advanced system settings). Во вкладке «Дополнительно» (Advanced), раздел «Загрузка и восстановление» (Startup and Recovery) нажмите кнопку «Параметры» (Settings). В открывшемся окне настройте действия при отказе системы. Поставьте галку в чек-боксе «Записать события в системный журнал» (Write an event to the system log), выберите тип дампа, который должен создаваться при сбое системы. Если в чек-боксе «Заменять существующий файл дампа» (Overwrite any existing file) поставить галку, то файл будет перезаписываться при каждом сбое. Лучше эту галку снять, тогда у вас будет больше информации для анализа. Отключите также автоматическую перезагрузку системы (Automatically restart).
В большинстве случаев для анализа причины BSOD вам будет достаточно малого дампа памяти.
Теперь при возникновении BSOD вы сможете проанализировать файл дампа и найти причину сбоев. Мини дамп по умолчанию сохраняется в папке %systemroot%\minidump. Для анализа файла дампа рекомендую воспользоваться программой WinDBG (Microsoft Kernel Debugger).
Установка WinDBG в Windows
Утилита WinDBG входит в «Пакет SDK для Windows 10» (Windows 10 SDK). Скачать можно здесь.
Файл называется winsdksetup.exe, размер 1,3 МБ.
WinDBG для Windows7 и более ранних систем включен в состав пакета «Microsoft Windows SDK for Windows 7 and .NET Framework 4». Скачать можно здесь.
Запустите установку и выберите, что именно нужно сделать – установить пакет на этот компьютер или загрузить для установки на другие компьютеры. Установим пакет на локальный компьютер.
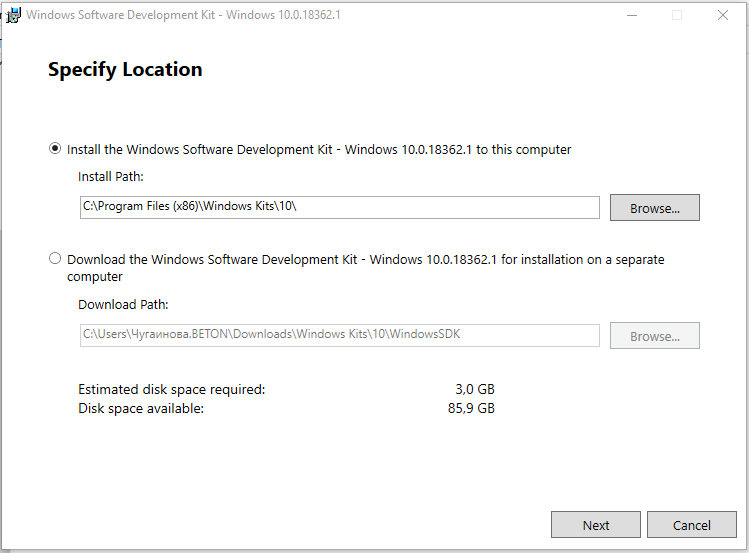
Можете установить весь пакет, но для установки только инструмента отладки выберите Debugging Tools for Windows.
После установки ярлыки WinDBG можно найти в стартовом меню.
Настройка ассоциации .dmp файлов с WinDBG
Для того, чтобы открывать файлы дампов простым кликом, сопоставьте расширение .dmp с утилитой WinDBG.
- Откройте командную строку от имени администратора и выполните команды для 64-разрядной системы:
cd C:\Program Files (x86)\Windows Kits\10\Debuggers\x64
windbg.exe –IA
для 32-разрядной системы:
C:\Program Files (x86)\Windows Kits\10\Debuggers\x86
windbg.exe –IA - В результате типы файлов: .DMP, .HDMP, .MDMP, .KDMP, .WEW – будут сопоставлены с WinDBG.
Настройка сервера отладочных символов в WinDBG
Отладочные символы (debug-символы или symbol files) – это блоки данных, генерируемые в процессе компиляции программы совместно с исполняемым файлом. В таких блоках данных содержится информация о именах переменных, вызываемых функциях, библиотеках и т.д. Эти данные не нужны при выполнении программы, но полезные при ее отладке. Компоненты Microsoft компилируются с символами, распространяемыми через Microsoft Symbol Server.
Настройте WinDBG на использование Microsoft Symbol Server:
- Откройте WinDBG;
- Перейдите в меню File –> Symbol File Path;
- Пропишите строку, содержащую URL для загрузки символов отладки с сайта Microsoft и папку для сохранения кэша:
SRV*E:\Sym_WinDBG*http://msdl.microsoft.com/download/symbols
В примере кэш загружается в папку E:\Sym_WinDBG, можете указать любую. - Не забывайте сохранить изменения в меню File –> Save WorkSpace;
WinDBG произведет поиск символов в локальной папке и, если не обнаружит в ней необходимых символов, то самостоятельно загрузит символы с указанного сайта. Если вы хотите добавить собственную папку с символами, то можно сделать это так:
SRV*E:\Sym_WinDBG*http://msdl.microsoft.com/download/symbols;c:\Symbols
Если подключение к интернету отсутствует, то загрузите предварительно пакет символов с ресурса Windows Symbol Packages.
Анализ аварийного дампа памяти в WinDBG
Отладчик WinDBG открывает файл дампа и загружает необходимые символы для отладки из локальной папки или из интернета. Во время этого процесса вы не можете использовать WinDBG. Внизу окна (в командной строке отладчика) появляется надпись Debugee not connected.
Команды вводятся в командную строку, расположенную внизу окна.
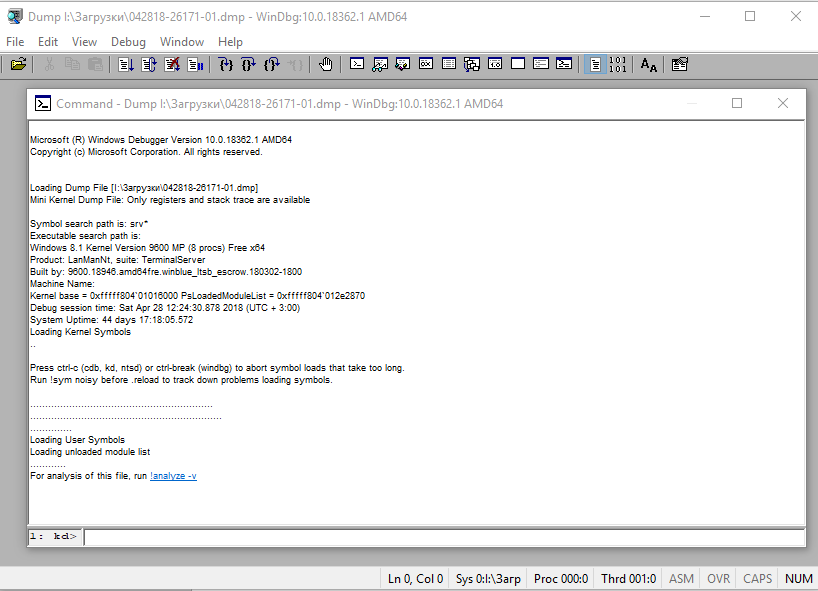
Самое главное, на что нужно обратить внимание – это код ошибки, который всегда указывается в шестнадцатеричном значении и имеет вид 0xXXXXXXXX (указываются в одном из вариантов — STOP: 0x0000007B, 02.07.2019 0008F, 0x8F). В нашем примере код ошибки 0х139.
Полный справочник ошибок можно посмотреть здесь.
Отладчик предлагает выполнить команду !analyze -v, достаточно навести указатель мыши на ссылку и кликнуть. Для чего нужна эта команда?
- Она выполняет предварительный анализ дампа памяти и предоставляет подробную информацию для начала анализа.
- Эта команда отобразит STOP-код и символическое имя ошибки.
- Она показывает стек вызовов команд, которые привели к аварийному завершению.
- Кроме того, здесь отображаются неисправности IP-адреса, процессов и регистров.
- Команда может предоставить готовые рекомендации по решению проблемы.
Основные моменты, на которые вы должны обратить внимание при анализе после выполнения команды !analyze –v (листинг неполный).
1: kd>
!analyze -v
*****************************************************************************
* *
* Bugcheck Analysis *
* *
*****************************************************************************
Символическое имя STOP-ошибки (BugCheck)
KERNEL_SECURITY_CHECK_FAILURE (139)
Описание ошибки (Компонент ядра повредил критическую структуру данных. Это повреждение потенциально может позволить злоумышленнику получить контроль над этой машиной):
A kernel component has corrupted a critical data structure. The corruption could potentially allow a malicious user to gain control of this machine.
Аргументы ошибки:
Arguments:
Arg1: 0000000000000003, A LIST_ENTRY has been corrupted (i.e. double remove).
Arg2: ffffd0003a20d5d0, Address of the trap frame for the exception that caused the bugcheck
Arg3: ffffd0003a20d528, Address of the exception record for the exception that caused the bugcheck
Arg4: 0000000000000000, Reserved
Debugging Details:
------------------
Счетчик показывает сколько раз система упала с аналогичной ошибкой:
CUSTOMER_CRASH_COUNT: 1
Основная категория текущего сбоя:
DEFAULT_BUCKET_ID: FAIL_FAST_CORRUPT_LIST_ENTRY
Код STOP-ошибки в сокращенном формате:
BUGCHECK_STR: 0x139
Процесс, во время исполнения которого произошел сбой (не обязательно причина ошибки, просто в момент сбоя в памяти выполнялся этот процесс):
PROCESS_NAME: sqlservr.exe
CURRENT_IRQL: 2
Расшифровка кода ошибки: В этом приложении система обнаружила переполнение буфера стека, что может позволить злоумышленнику получить контроль над этим приложением.
ERROR_CODE: (NTSTATUS) 0xc0000409 - The system detected an overrun of a stack-based buffer in this application. This overrun could potentially allow a malicious user to gain control of this application.
EXCEPTION_CODE: (NTSTATUS) 0xc0000409 - The system detected an overrun of a stack-based buffer in this application. This overrun could potentially allow a malicious user to gain control of this application.
Последний вызов в стеке:
LAST_CONTROL_TRANSFER: from fffff8040117d6a9 to fffff8040116b0a0
Стек вызовов в момент сбоя:
STACK_TEXT:
ffffd000`3a20d2a8 fffff804`0117d6a9 : 00000000`00000139 00000000`00000003 ffffd000`3a20d5d0 ffffd000`3a20d528 : nt!KeBugCheckEx
ffffd000`3a20d2b0 fffff804`0117da50 : ffffe000`f3ab9080 ffffe000`fc37e001 ffffd000`3a20d5d0 fffff804`0116e2a2 : nt!KiBugCheckDispatch+0x69
ffffd000`3a20d3f0 fffff804`0117c150 : 00000000`00000000 00000000`00000000 00000000`00000000 00000000`00000000 : nt!KiFastFailDispatch+0xd0
ffffd000`3a20d5d0 fffff804`01199482 : ffffc000`701ba270 ffffc000`00000001 000000ea`73f68040 fffff804`000006f9 : nt!KiRaiseSecurityCheckFailure+0x3d0
ffffd000`3a20d760 fffff804`014a455d : 00000000`00000001 ffffd000`3a20d941 ffffe000`fcacb000 ffffd000`3a20d951 : nt! ?? ::FNODOBFM::`string'+0x17252
ffffd000`3a20d8c0 fffff804`013a34ac : 00000000`00000004 00000000`00000000 ffffd000`3a20d9d8 ffffe001`0a34c600 : nt!IopSynchronousServiceTail+0x379
ffffd000`3a20d990 fffff804`0117d313 : ffffffff`fffffffe 00000000`00000000 00000000`00000000 000000eb`a0cf1380 : nt!NtWriteFile+0x694
ffffd000`3a20da90 00007ffb`475307da : 00000000`00000000 00000000`00000000 00000000`00000000 00000000`00000000 : nt!KiSystemServiceCopyEnd+0x13
000000ee`f25ed2b8 00000000`00000000 : 00000000`00000000 00000000`00000000 00000000`00000000 00000000`00000000 : 0x00007ffb`475307da
Участок кода, где возникла ошибка:
FOLLOWUP_IP:
nt!KiFastFailDispatch+d0
fffff804`0117da50 c644242000 mov byte ptr [rsp+20h],0
FAULT_INSTR_CODE: 202444c6
SYMBOL_STACK_INDEX: 2
SYMBOL_NAME: nt!KiFastFailDispatch+d0
FOLLOWUP_NAME: MachineOwner
Имя модуля в таблице объектов ядра. Если анализатору удалось обнаружить проблемный драйвер, имя отображается в полях MODULE_NAME и IMAGE_NAME:
MODULE_NAME: nt
IMAGE_NAME: ntkrnlmp.exe
Если кликнете по ссылке модуля (nt), то увидите подробную информацию о пути и других свойствах модуля. Находите указанный файл, и изучаете его свойства.
1: kd>
lmvm nt
Browse full module list
Loaded symbol image file: ntkrnlmp.exe
Mapped memory image file: C:\ProgramData\dbg\sym\ntoskrnl.exe\5A9A2147787000\ntoskrnl.exe
Image path: ntkrnlmp.exe
Image name: ntkrnlmp.exe
InternalName: ntkrnlmp.exe
OriginalFilename: ntkrnlmp.exe
ProductVersion: 6.3.9600.18946
FileVersion: 6.3.9600.18946 (winblue_ltsb_escrow.180302-1800)
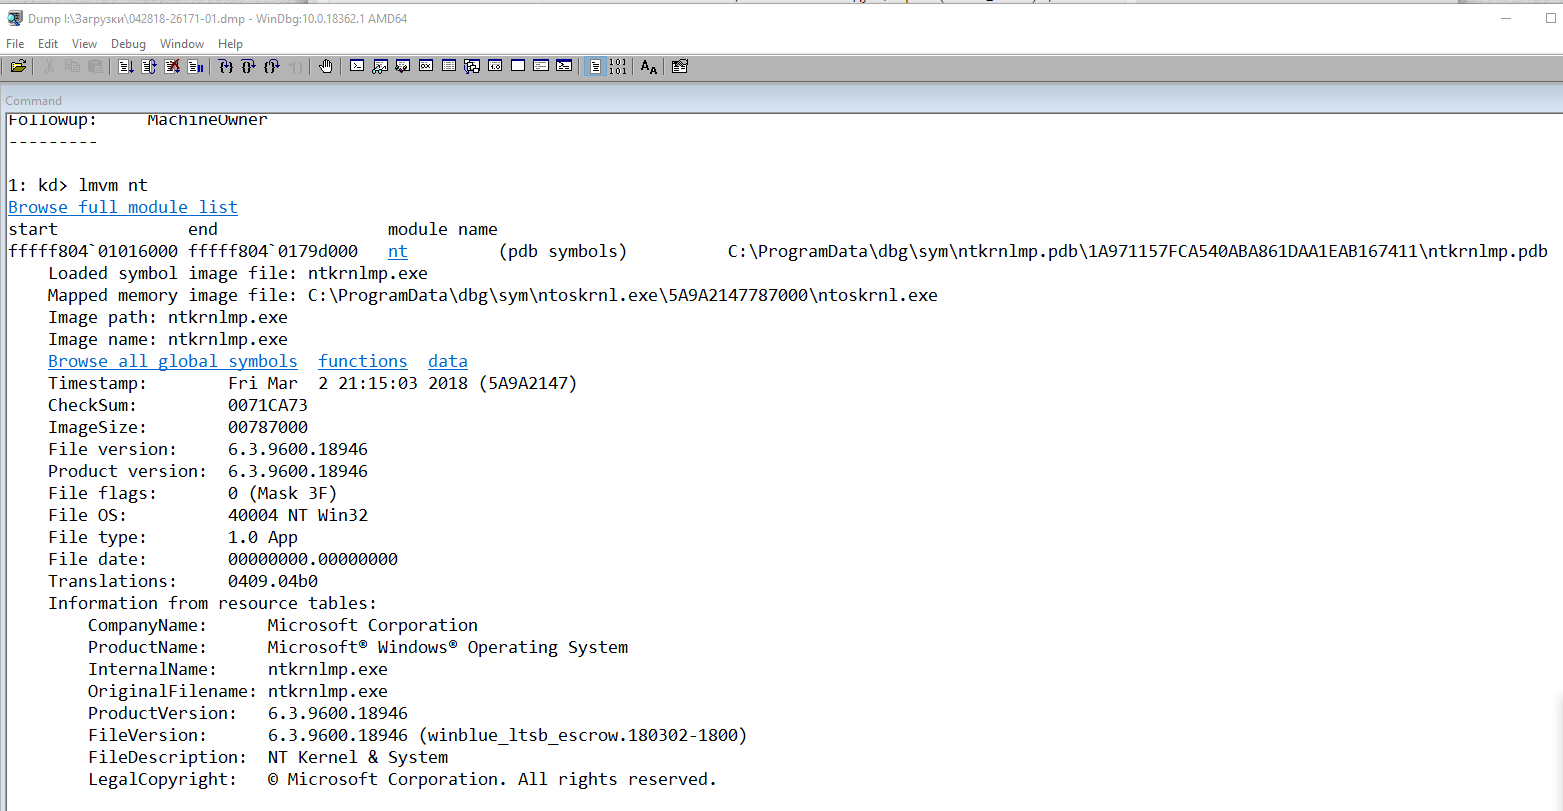
В приведенном примере анализ указал на файл ядра ntkrnlmp.exe. Когда анализ дампа памяти указывает на системный драйвер (например, win32k.sys) или файл ядра (как в нашем примере ntkrnlmp.exe), вероятнее всего данный файл не является причиной проблемы. Очень часто оказывается, что проблема кроется в драйвере устройства, настройках BIOS или в неисправности оборудования.
Если вы увидели, что BSOD возник из-за стороннего драйвера, его имя будет указано в значениях MODULE_NAME и IMAGE_NAME.
Например:
Image path: \SystemRoot\system32\drivers\cmudaxp.sys
Image name: cmudaxp.sys
Откройте свойсва файла драйвера и проверьте его версию. В большинстве случаев проблема с драйверами решается их обнвовлением.