
Уровень сложностиПростой
Время на прочтение5 мин
Количество просмотров43K
Немного расскажу про установку Grafana на windows и настройку базовых метрик системы.
Пару слов о самой Grafana и для чего она нужна.
Grafana – это платформа для мониторинга, анализа данных и визуализации собранных данных с открытым исходным кодом. По сути она используется для визуального представления собранных метрик для более комфортного слежения за состоянием системы.
В данной статье буду использовать:
-
Grafana
-
Prometheus
-
Windows_exporter
-
Blackbox_exporter
Для начала скачаем актуальный дистрибутив самой Grafana и установим его (Для скачивания, может потребоваться VPN).
Переходим по ссылке: https://grafana.com/grafana/download и выбираем необходимую версию для скачивания.

Затем скачаем и установим Prometheus.
Prometheus по сути является сборщиком метрик. Установив на один пк, который будет выступать в качестве сервера для Grafana, достаточно будет только запускать сбор метрик с других машин (вносить соответствующий блок в файл конфигурации Prometheus), а Prometheus в свою очередь подготовит метрики уже для самой Grafana.
Prometheus: https://prometheus.io/download
Для установки потребуется NSSM — это сервисный помощник, который помогает установить служебные вспомогательные программы.
Ссылка NSSM: https://www.nssm.cc/download
Приступим к установке Prometheus.
Переходим в CMD и вводим следующие команды (запускаем CMD от админа):
-
Переходим в директорию с пакетом NSSM:
cd C:\GrafanaSetup\nssm-2.24\win64 -
Выполняем установку сервиса Prometheus:
nssm.exe install prometheus C:\GrafanaSetup\prometheus-2.43.0.windows-amd64\prometheus.exe

На данном этапе служба Prometheus должны быть установлена, Далее установим службы для сбора метрик.
Установим Windows_exporter – сборщик метрик, который как раз собирает статистику с системы и составляет своего рода «логи».
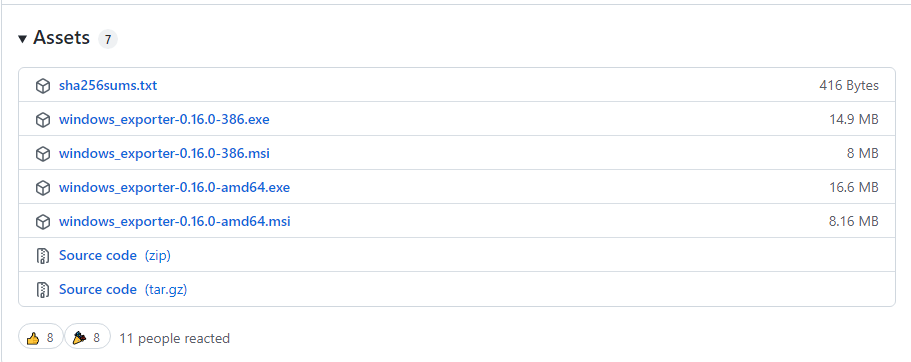
Ссылка для скачивания Windows exporter: https://github.com/prometheus-community/windows_exporter/releases
Выбираем подходящую нам версию и устанавливаем

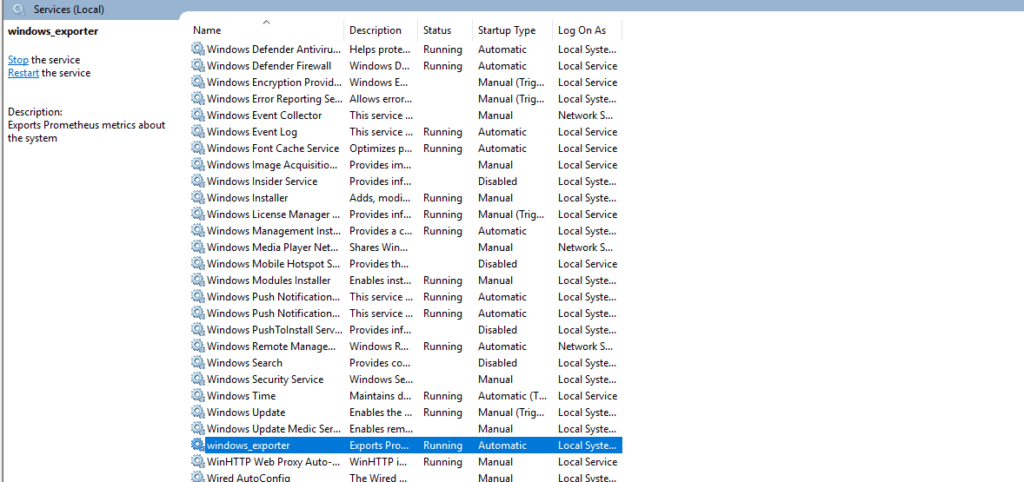
После установки, так же проверяем в службах, что установка прошла успешно и служба запущена (название службы по умолчанию windows_exporter).
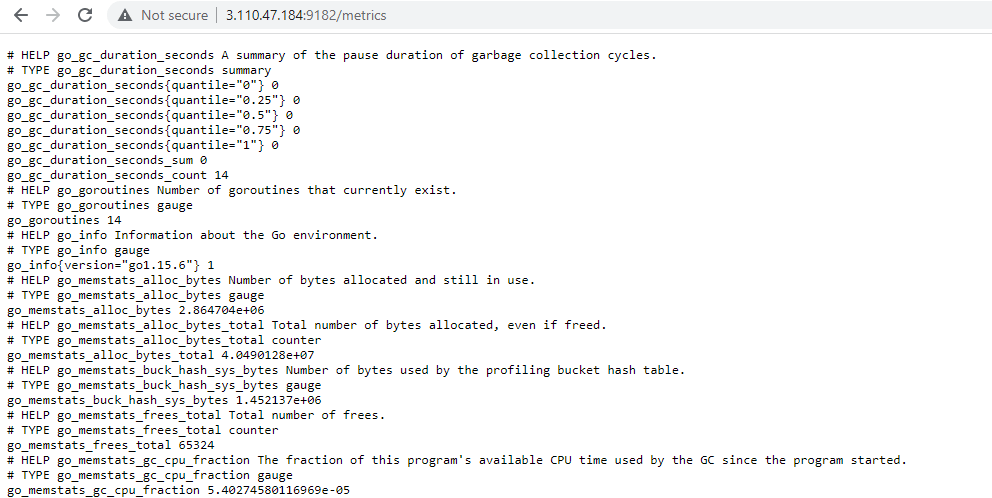
Теперь можно проверить сбор метрик по ссылке к порту службы: http://localhost:9182/metrics

На данном этапе можем установить Blackbock exporter — используется для мониторинга статуса доступности URL-ов. Переходим по ссылка и скачиваем нужную нам версию Blackbox: https://prometheus.io/download/ и устанавливаем.

Теперь приступим к настройке установленных сервисов.
Начинаем с Grafana:
Переходим в папку C:\Program Files\GrafanaLabs\grafana\conf и открываем файл defaults.ini при помощи текстового редактора и меняем значение в блоке smtp в поле enabled на true и сохраняем изменения. Запускаем службу Grafana, если она уже запущена, просто делаем перезапуск для вступления изменений в силу.

Перейдя по ссылке: http://localhost:3000 увидим активный интерфейс Grafana. Для входа по умолчанию используется комбинация admin / admin, затем попопросит Вас изменить пароль и направит на домашнюю страницу управления Grafana.
Далее приступаем к настройке Prometheus:Нам необходимо внести изменения в конфигурацию, включив метрики в конфиг. Для этого переходим в каталог prometheus») и открываем файл prometheus.yml и вносим следующие изменения:
Добавляем блок для подключения windows_exporter:
- job_name: "Любое комфортное имя"

      static_configs:

            #IP-адрес и порт, где собираются метрики window_exporter\

            - targets: ["localhost:9182”]
При добавлении нескольких машин, можно добавить блок lables, который изменит отображаемый IP-адрес на свое описание:
  static_configs:

      - targets: ["localhost:9182"]

        labels:

            instance: Server-1

      - targets: ["192.168.0.254:9182"]

        labels:

            instance: Server-2
Сразу добавим блок для blackbox_exporter:
- job_name: 'blackbox'

      metrics_path: /probe

      params:

            module: [http_2xx]  # Look for a HTTP 200 response.

    static_configs:

      - targets:

            -https://youtube.com

            -https://google.com

    relabel_configs:

      - source_labels: [__address__]

            target_label: __param_target

      - source_labels: [__param_target]

            target_label: instance

      - target_label: __address__

            replacement: localhost:9115  # The blackbox exporter's real hostname:port
В блоке targets перечисляем необходимые URL-адреса.
Только обратите внимание, для того, что бы блок корректно заработал и не было ошибок при запуске службы, необходимо строго соблюдать табуляцию строк.
Добавив необходимые блоки можем запускать prometheus.
Затем убедитесь, что все службы запущены:
-
Grafana
-
Prometheus
-
Windows_ exporter
-
Blackbox_exporter
и теперь проверяем статус сервисов по ссылке: http://localhost:9090/targets

В целом мы настроили базовые метрики, осталось включить отображение метрик в Grafana.
Переходим на главную страницу grafana ( По умолчанию: http://localhost:3000 ).
Подключаем источник данных Prometheus:
На главной странице, переходим в меню Data sources
Выбираем наш Prometheus

И указываем наш URL. В нашем случае, всё находится на одной локальной машине и можем прописывать через формат: http://localhost:port/

И нажимаем кнопку: Save & test
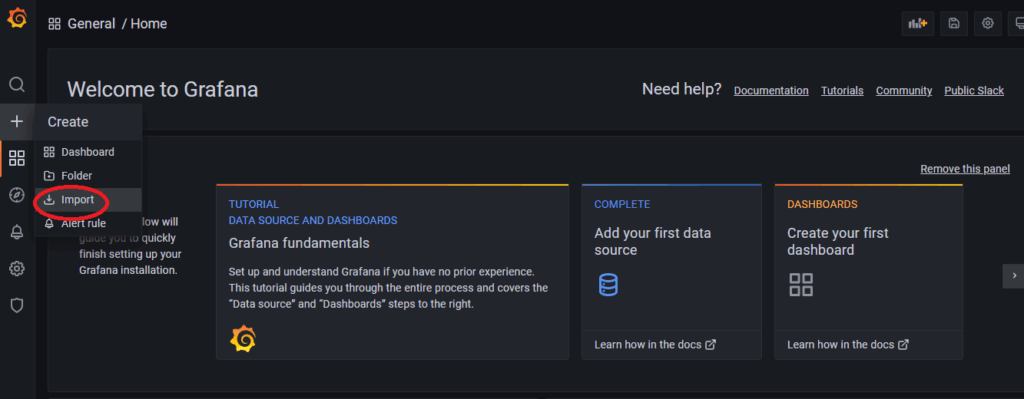
Теперь необходимо настроить панели мониторинга для метрик windows exporter. Для настройки переходим на главную страницу и добавляем панель:

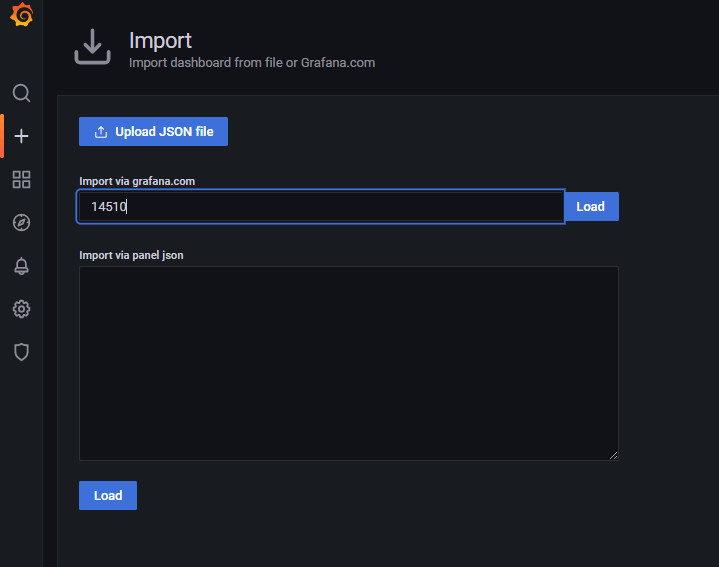
На момент написания статьи, нашёл два наиболее охватывающих Dashboard`а:
-
14510
-
14694
Можете использовать их или же настроить всё самостоятельно.
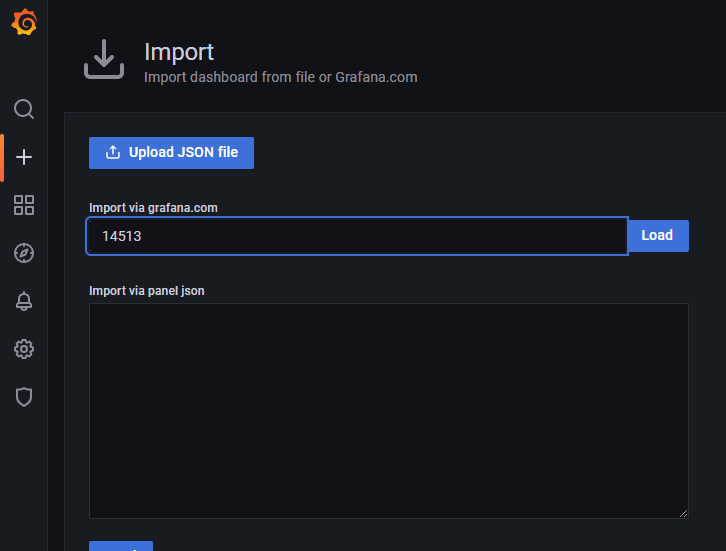
Для добавления Dashboard`а указываем в поле ID и нажимаем на кнопку Load.

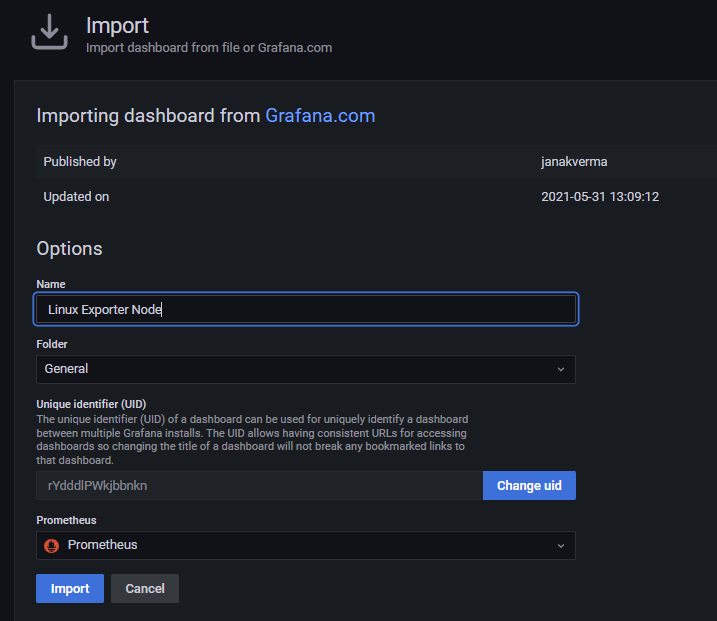
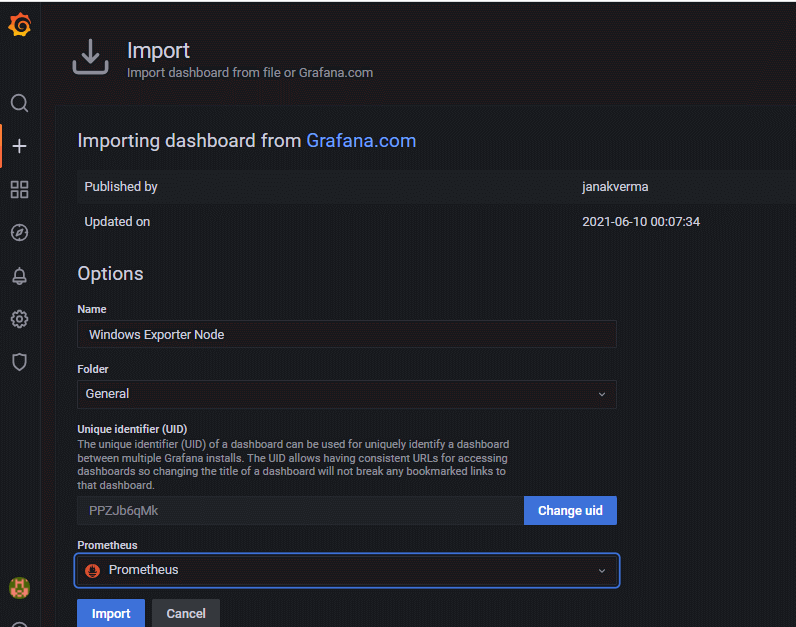
Затем нас направляет на панель настроек, где мы указываем источник данных Prometheus и можем изменить имя самой панели. Затем жмём кнопку Import
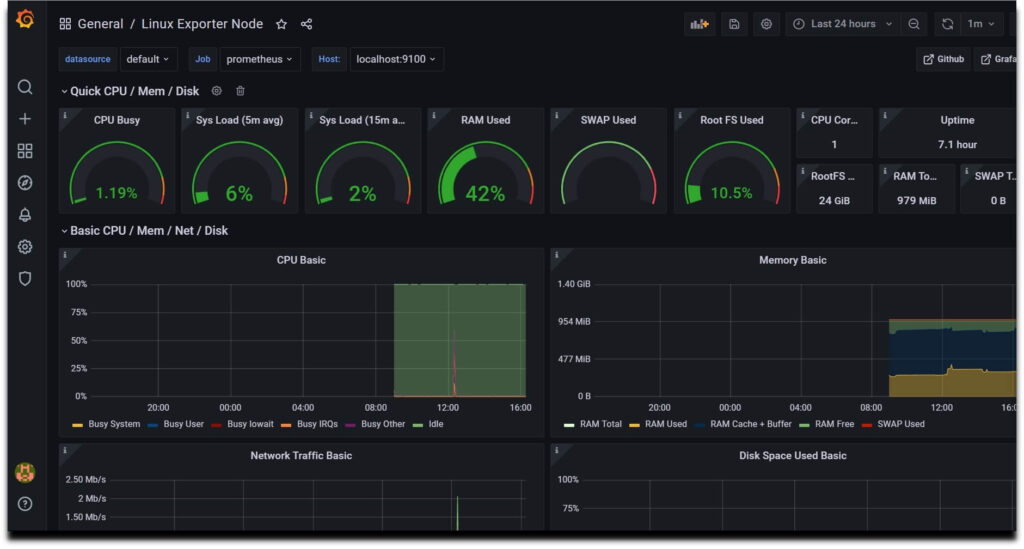
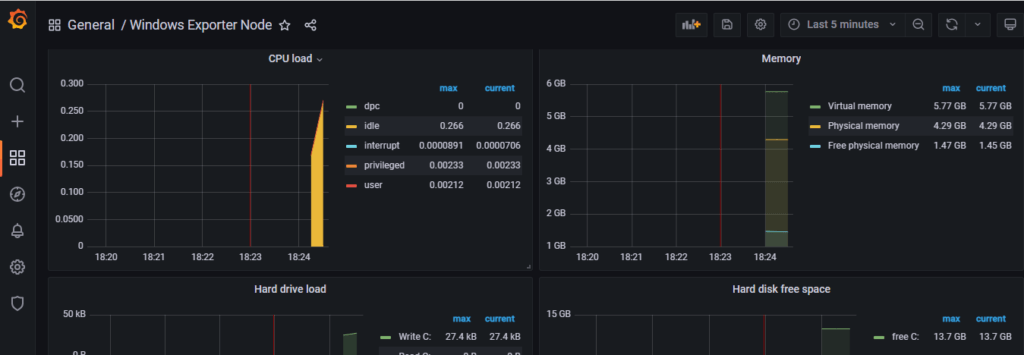
И у нас уже готовая, настроенная панель мониторинга, которую уже можно добавлять необходимым функционалом. Не нужные графики можно удалить или расставить в нужном для себя порядке.

При добавлении новых пк для мониторинга, достаточно внести строки в конфигурационный файл Prometheus.yml и перезапустить службу Prometheus. Служба самостоятельно разберёт метрики и добавить новый пк к мониторингу на уже готовый dashboard, где уже не составит труда переключаться между пк.
Далее уже можно поиграть с конкретными метриками, и отображением конкретных служб с различных машин. К примеру: На главном экране нажимаем ADD > Visualization и попадаем в меню создания панели. В поле Metrics browser вносим выбранную метрику и указываем параметры, которые хотим получить (ну или отобразить). Сделаем на примере службы windows:
-
Name — имя службы
-
State — вид статуса, который относится к метрике windows_service_state
-
Instance — с какой конкретной машины брать метрику.
windows_service_state{name="нужная служба", state="running", instance="Server-1"}
и в правом верхнем углу выбираем нужный вид панели, в моем случае это Stat:

В параметрах панели в меню Value mappings и меняем цифровые значения метрик на удобные для восприятия слова, к примеру: Ok/Bad Up/Down.

Сохраняем и получаем такую панель :
Ну и настроим метрику для получения статусов HTTP:
Используем метрику: probe_http_status_code и настроим Value mapping:
probe_http_status_code{instance="https://youtube.com"}

И в итоге получаем такую панель:
Далее можно самостоятельно зайти в http://localhost:9090/targets выбрать нужные для своих задач метрики и настроить нужные под свои задачи.
Думаю, на этом можно закончить. Базовая настройка не так сложна, но когда ты сталкиваешься с этим в первый раз, могут возникнуть трудности, поэтому хотел поделиться пошаговой настройкой. Надеюсь, кому-то это поможет и сократить достаточно времени на поиске информации и первичной настройки.
Introduction
Window Node exporter is agent that collect and send the window machine hardware utilization metrics to the Prometheus server by using HTTP protocol metric, It used port 9182 by default.
Prerequisites
Up and running Prometheus server, Grafana Server in your machine / network environment or you can use the given link to setup Prometheus and Grafana on ubuntu machine to perform this window machine monitoring.
To install Prometheus – https://www.devopstricks.in/install-prometheus-on-ubuntu-22-04/
To install Grafana – https://www.devopstricks.in/installing-grafana-10-on-ubuntu-22-04-lts/
In this post, We will show you how to install window exporter on window machine to get enable monitoring like CPU, Memory, Disk Space, processes and bandwidth etc.
Step 1: Download Window Exporter Package
We need to download the window exporter package by using given link.
https://github.com/prometheus-community/windows_exporter/releases
You can choose the package as per your architecture.
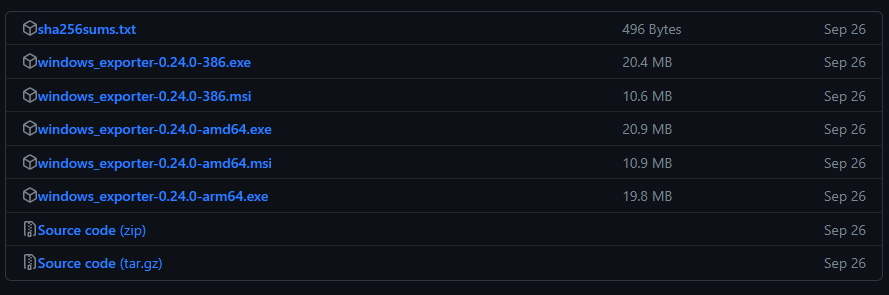
Click the download the right package, In my case i am using window 10 Prod 64 bit So then i can download windows_exporter-0.24.0-amd64.msi or windows_exporter-0.24.0-arm64.exe.
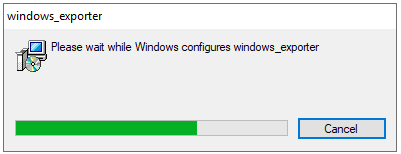
While downloading the package we should get pop-up like this, We need to click in Keep button and ignore warning that this time.

Step 2: Installing Window Exporter
After downloaded the window exporter, We need to run the package and allow the installation.
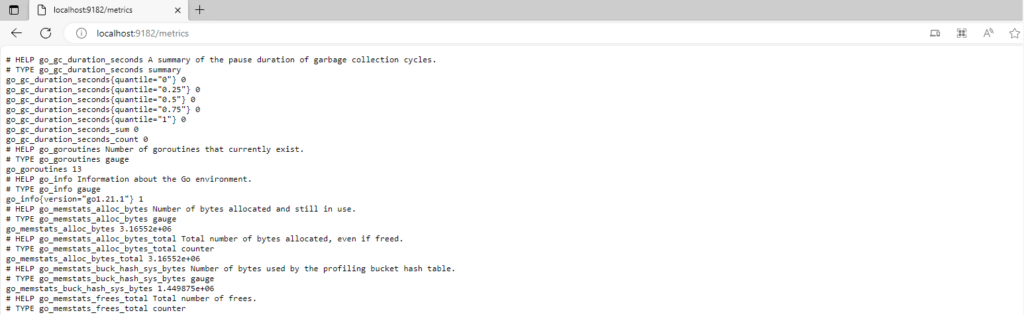
After installation of window exporter package, We need to check the followings endpoint to get window machine metrics like this.
Expose metric URL – localhost:9182/metrics
Step 3: Add Firewall Rules
We need to open the port 9182 port in your window machine and your cloud environment in order to fetch window metrics from Prometheus server.
Step 4: Configure Prometheus
We need to add the window machine endpoint to fetch metrics To do that we need to add the followings configure in Prometheus configuration file.
To open Prometheus configuration file.
sudo vim /etc/prometheus/prometheus.ymlAdd the in the last following config.
  - job_name: window
    # If prometheus-node-exporter is installed, grab stats about the local
    # machine by default.
    static_configs:
      - targets: ['Type-Window-IP-Here:9182']
This is my sample configuration file with window exporter.
# Sample config for Prometheus.

global:
  scrape_interval:     15s # Set the scrape interval to every 15 seconds. Default is every 1 minute.
  evaluation_interval: 15s # Evaluate rules every 15 seconds. The default is every 1 minute.
  # scrape_timeout is set to the global default (10s).

  # Attach these labels to any time series or alerts when communicating with
  # external systems (federation, remote storage, Alertmanager).
  external_labels:
      monitor: 'example'

# Alertmanager configuration
alerting:
  alertmanagers:
  - static_configs:
    - targets: ['localhost:9093']

# Load rules once and periodically evaluate them according to the global 'evaluation_interval'.
rule_files:
  # - "first_rules.yml"
  # - "second_rules.yml"

# A scrape configuration containing exactly one endpoint to scrape:
# Here it's Prometheus itself.
scrape_configs:
  # The job name is added as a label `job=<job_name>` to any timeseries scraped from this config.
  - job_name: 'prometheus'

    # Override the global default and scrape targets from this job every 5 seconds.
    scrape_interval: 5s
    scrape_timeout: 5s

    # metrics_path defaults to '/metrics'
    # scheme defaults to 'http'.

    static_configs:
      - targets: ['localhost:9090']

  - job_name: node
    # If prometheus-node-exporter is installed, grab stats about the local
    # machine by default.
    static_configs:
      - targets: ['localhost:9100']
  - job_name: window
    # If prometheus-node-exporter is installed, grab stats about the local
    # machine by default.
    static_configs:
      - targets: ['100.100.100.00:9182']
Save and exit from the vim text editor.
Step 5: Restart Prometheus Service
To get updated and new changes with Prometheus config file, We need to restart the Prometheus service.
To restart.
sudo systemctl restart prometheus.serviceTo check status.
sudo systemctl status prometheus.serviceWe are all good to here, Now we need to validate the window target metrics in Prometheus UI.
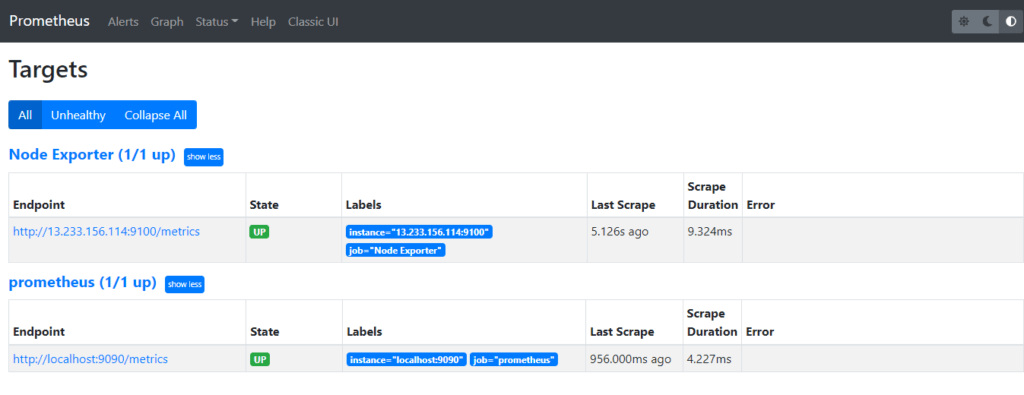
Step 6: Validate the Window Exporter with Prometheus
To validate the window exporter endpoint with Prometheus to know window Machin’s metric is showing with Prometheus or not.
Access to Prometheus endpoints with http://Prometheus-IP:9090
Click on status > targets
We should get output like this.
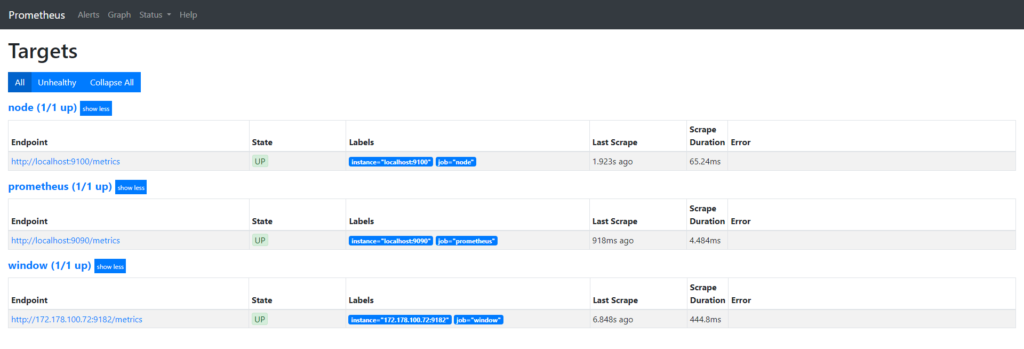
Here we can see that 1 window machine is showing that we just configured, Now we are good to use Grafana.
Step 7: Importing Window Node Exporter Grafana Dashboard
We use the following links to get predefine Window Node Exporter Grafana dashboard.
https://grafana.com/grafana/dashboards/14451-windows-exporter-for-prometheus-dashboard-en/ (Recommended )
https://grafana.com/grafana/dashboards/15620-windows-node-exporter/
https://grafana.com/grafana/dashboards/14694-windows-exporter-dashboard/
https://grafana.com/grafana/dashboards/18699-windows-node-exporter-full-1/
https://grafana.com/grafana/dashboards/14499-windows-node/
https://grafana.com/grafana/dashboards/14510-windows-exporter-node/
https://grafana.com/grafana/dashboards/6593-windows-node/
Conclusion
We have done successfully enabled window machine monitoring by using window node exporter, Still you are having any issue, So please leave a comment below.
-
Expertise in Linux, Git, Jenkins, Docker, Ansible, AWS/Azure, K8s, Terraform, and other DevOps tools.
View all posts
In this article we are going to cover Install Prometheus and Grafana on Ubuntu 20.04 LTS with Node Exporter and WMI Exporter | Windows and Linux Server Monitoring using Prometheus and Grafana
Table of Contents
What is prometheus?
- Prometheus is a open source Linux Server Monitoring tool mainly used for metrics monitoring, event monitoring, alert management, etc.
- Prometheus has changed the way of monitoring systems and that is why it has become the Top-Level project of Cloud Native Computing Foundation (CNCF).
- Prometheus uses a powerful query language i.e. “PromQL”.
- In Prometheus tabs are on and handles hundreds of services and micro services.
- Prometheus use multiple modes used for graphing and dashboarding support.
Why we used prometheus?
- A multi-dimensional data model with time series data identified by metric name and key/value pairs
- PromQL, a flexible query language to leverage this dimensionality
- Pushing time series is supported via an intermediary gateway
- Multiple modes of graphing and dashboarding support
Prometheus Architecture
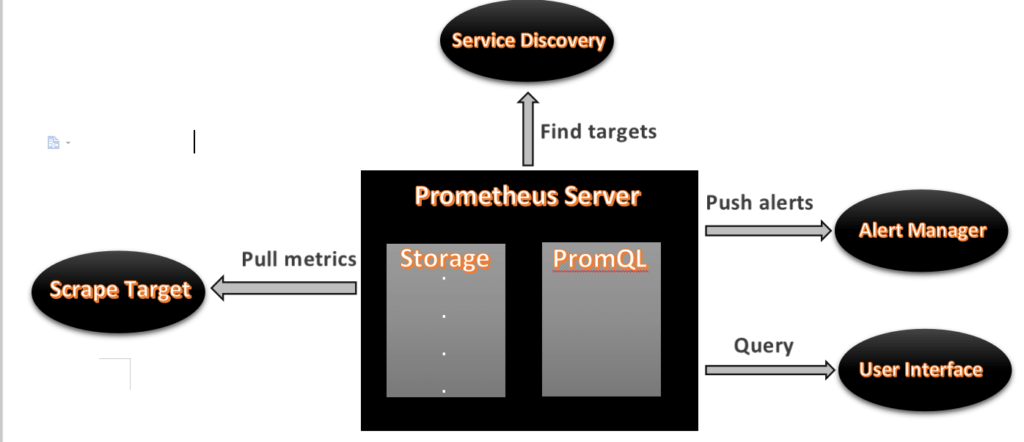
- As above we can see an architecture of Prometheus monitoring tool.
- We made a basic design to understand it easily for you people.
Now lets understand the Prometheus components one-by-one
Prometheus Components
- Prometheus server is a first component of Prometheus architecture.
- Prometheus server is a core of Prometheus architecture which is divided into several parts like Storage, PromQL, HTTP server, etc.
- In Prometheus server data is scraped from the target nodes and then stored in the database.
1.a. Storage
- Storage in Prometheus server has a local on disk storage.
- Prometheus has many interfaces that allow integrating with remote storage systems.
1.b. PromQL
- Prometheus uses its own query language i.e. PromQL which is a very powerful querying language.
- PromQL allows the user to select and aggregate the data.
2. Service Discovery
- Next and very important component of Prometheus Server is the Service Discovery.
- With the help of Service discovery the services are identified which need to be scraped.
- To Pull metrics, identification of services and finding the targets are compulsory needed.
- Through Service discovery we monitor the entities and can also locate its targets.
3. Scrape Target
- Once the services are identified and the targets are ready then we can pull metrics from it and can scrape the target.
- We can export the data of the end point using node exporters.
- Once the metrics or other data is pulled, Prometheus stores it in a local storage.
4. Alert Manager
- Alert Manager handles the alerts which may occurs during the session.
- Alert manager handles all the alerts which are sent by the Prometheus server.
- Alert manager is one of the very useful components of the Prometheus tool.
- If in case any big error or any issue occurs, alert manager manage those alerts and contact with human via E-mail, Text Messages, On-call, or any other chat application service.
5. User Interface
- User interface is also an important component as it builds a bridge between the user and the system.
- In Prometheus, user interfaces are note that much user friendly and can be used till graph queries.
- For good exclusive dashboards Prometheus works together with Grafana (visualization tool).
- Using Grafana over Prometheus to visualize properly we can use custom dashboards.
- Grafana dashboards display via pie charts, line charts, tables, good data graphs of CPU usage, RAM utilization, network load, etc with indicators.
- Grafana supports and run with Prometheus by querying language i.e. PromQL.
- To fetch data from Prometheus and to display the results on Grafana dashboards PromQL is used.
What is Grafana ?
- Grafana is a free and open source visualization tool mostly used with Prometheus to which monitor metrics.
- Grafana provides various dashboards, charts, graphs, alerts for the particular data source.
- Grafana allows us to query, visualize, explore metrics and set alerts for the data source which can be a system, server, nodes, cluster, etc.
- We can also create our own dynamic dashboard for visualization and monitoring.
- We can save the dashboard and can even share with our team members which is one of the main advantage of Grafana.
What is Node Exporter ?
- Node exporter is one of the Prometheus exporters which is used to expose servers or system OS metrics.
- With the help of Node exporter we can expose various resources of the system like RAM, CPU utilization, Memory Utilization, disk space.
- Node exporter runs as a system service which gathers the metrics of your system and that gathered metrics is displayed with the help of Grafana visualization tool.
What is WMI Exporter?
- It is same like Node Exporter but Node Exporter for Linux and WMI Exporter for Windows
- WMI Exporter is an exporter utilized for windows servers to collects metrics like CPU usage, memory, and Disk usage.
- It is open-source which can be installed on Windows servers using the .msi installer
Prerequisite:
Good internet connectivity
Security Groups Configured properly
Any web Browser
Security Groups Configured on EC2 Instances:
Port 9090 — Prometheus Server
Port 9100 — Prometheus Node Exporter
Port 9182—-WMI Exporter
Port 3000 — Grafana
We will update the system repository index by using the following command.
sudo apt update -yswitch to root user
sudo su -
#1. Creating Prometheus System Users and Directory
We will have to create a Prometheus user named Prometheus and a Prometheus directory named as Prometheus.
Using below commands we can create a user and directory.
sudo useradd --no-create-home --shell /bin/false prometheus
sudo useradd --no-create-home --shell /bin/false node_exporter
sudo mkdir /etc/prometheus
sudo mkdir /var/lib/prometheus
#2. Update Prometheus user
As user groups and directories are created successfully which store the Prometheus data and files.
Now we will have to update the group and user ownership on the newly created directories.
By using the below command we update the ownership.
sudo chown prometheus:prometheus /var/lib/prometheus
#3. Download Prometheus Binary File on Ubuntu
Now we will download the latest version of Prometheus. We can copy the download link as per our Operating System from Prometheus download page
Using the below command we can download Prometheus, here we are downloading Prometheus 2.31.1 version, you use the above link to download specific version.
Navigate to /tmp directory
cd /tmp/
Download the Prometheus setup using wget
wget https://github.com/prometheus/prometheus/releases/download/v2.31.1/prometheus-2.31.1.linux-amd64.tar.gz
Now we have successfully downloaded the Prometheus file and now we will extract that file.
#4. Install Prometheus and Grafana on Ubuntu 20.04 LTS
Extract the files using tar command :
tar -xvf prometheus-2.31.1.linux-amd64.tar.gz
#5. Move the configuration file and set the owner to the prometheus user:
cd prometheus-2.31.1.linux-amd64
sudo mv console* /etc/prometheus
sudo mv prometheus.yml /etc/prometheus
sudo chown -R prometheus:prometheus /etc/prometheus
#6. Update Prometheus user ownership on Binaries
Now we will update the user and group ownership on the binaries of Prometheus.
Using following commands we will update the user and group ownership.
sudo mv prometheus /usr/local/bin/
sudo chown prometheus:prometheus /usr/local/bin/prometheus
#7. Check Prometheus Version
Now the Prometheus is successfully installed on our system. We will check the version of Prometheus and to configure it.
Follow the commands to verify prometheus version.
prometheus --version

#8. Prometheus configuration file
We have already copied /tmp/prometheus-2.31.1.linux-amd64/prometheus.yml file /etc/prometheus directory, verify if it present and should look like below and modify it as per your requirement.
sudo nano /etc/prometheus/prometheus.yml
# my global config
global:
  scrape_interval: 15s # Set the scrape interval to every 15 seconds. Default is every 1 minute.
  evaluation_interval: 15s # Evaluate rules every 15 seconds. The default is every 1 minute.
  # scrape_timeout is set to the global default (10s).

# Alertmanager configuration
alerting:
  alertmanagers:
    - static_configs:
        - targets:
          # - alertmanager:9093

# Load rules once and periodically evaluate them according to the global 'evaluation_interval'.
rule_files:
  # - "first_rules.yml"
  # - "second_rules.yml"

# A scrape configuration containing exactly one endpoint to scrape:
# Here it's Prometheus itself.
scrape_configs:
  # The job name is added as a label `job=<job_name>` to any timeseries scraped from this config.
  - job_name: "prometheus"

    # metrics_path defaults to '/metrics'
    # scheme defaults to 'http'.

    static_configs:
      - targets: ["localhost:9090"]
#9. Creating Prometheus Systemd file
Now we will create a system service file in /etc/systemd/system location.
sudo nano /etc/systemd/system/prometheus.service
After creating file successfully, copy the below files and it to the newly created file. /etc/systemd/system/prometheus.service
[Unit]
Description=Prometheus
Wants=network-online.target
After=network-online.target

[Service]
User=prometheus
Group=prometheus
Type=simple
ExecStart=/usr/local/bin/prometheus \
    --config.file /etc/prometheus/prometheus.yml \
    --storage.tsdb.path /var/lib/prometheus/ \
    --web.console.templates=/etc/prometheus/consoles \
    --web.console.libraries=/etc/prometheus/console_libraries

[Install]
WantedBy=multi-user.target
After adding the program save the file with Ctrl+O and exit with Ctrl+X.
To use the newly created service we will have to reload the daemon services, Use the below command to reload daemon services.
sudo systemctl daemon-reload
start and enable prometheus service using below commands
sudo systemctl start prometheus
sudo systemctl enable prometheus
We will check the Prometheus status weather it is running or not
sudo systemctl status prometheus
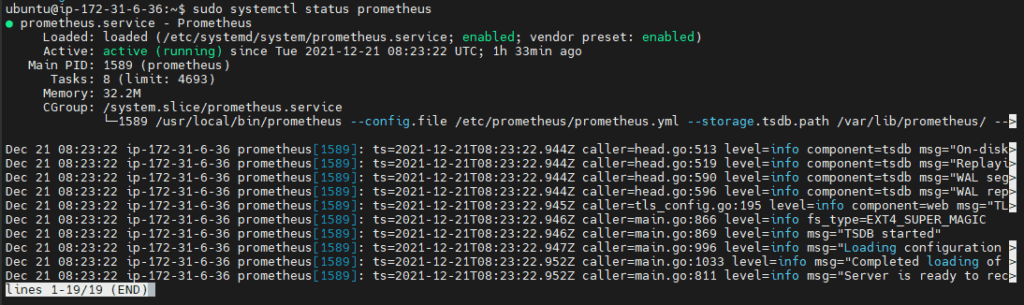
Prometheus installation and configuration is set up, We can see status Active: active(running)
#10. Accessing Prometheus on Browser
Now as Prometheus installation and configuration is set up and it is ready to use we can access its services via web interface.Also check weather port 9090 is UP in firewall.
Use below command to enable prometheus service in firewall
sudo ufw allow 9090/tcp
Now Prometheus service is ready to run and we can access it from any web browser.
http://server-IP-or-Hostname:9090.
As we can see the Prometheus dashboards, we can also check the target.As we can observe Current state is UP and we can also see the last scrape.
#11. Install Grafana on Ubuntu
Download the Grafana GPG key with wget, then pipe the output to apt-key. This will add the key to your APT installation’s list of trusted keys, which will allow you to download and verify the GPG-signed Grafana package:
wget -q -O - https://packages.grafana.com/gpg.key | sudo apt-key add -
In this command, the option -q turns off the status update message for wget, and -O outputs the file that you downloaded to the terminal. These two options ensure that only the contents of the downloaded file are pipelined to apt-key.
Next, add the Grafana repository to your APT sources:
sudo add-apt-repository "deb https://packages.grafana.com/oss/deb stable main"
Refresh your APT cache to update your package lists:
sudo apt update
You can now proceed with the installation:
sudo apt install grafana
Once Grafana is installed, use systemctl to start the Grafana server:
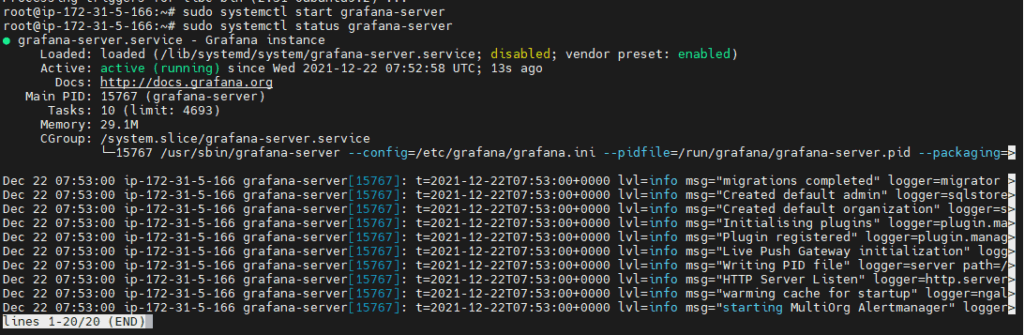
sudo systemctl start grafana-server
Next, verify that Grafana is running by checking the service’s status:
sudo systemctl status grafana-server
You will receive output similar to this:
Now finally enable the Grafana service which will automatically start the Grafana on boot
sudo systemctl enable grafana-server.service
To access Grafana Dashboard open your favorite browser, type server IP or Name followed by grafana default port 3000.
http://your_ip:3000
Here you can see Login page of Grafana now you will have to login with below Grafana default UserName and Password.
Username – admin
Password – admin
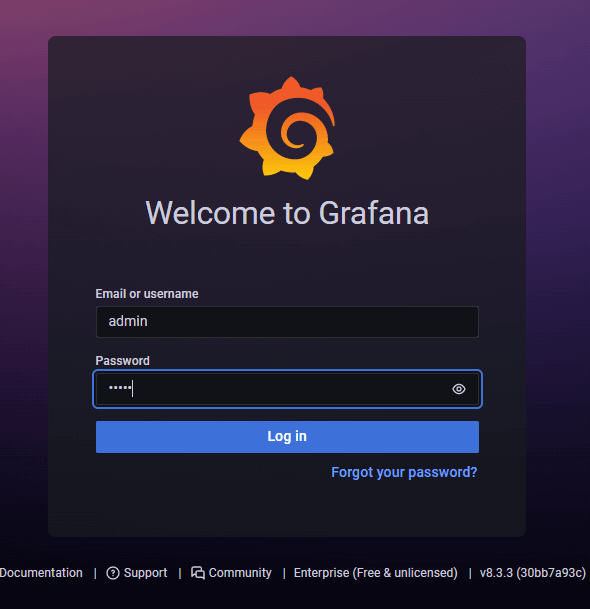
It is always a good practice to change your login credentials.
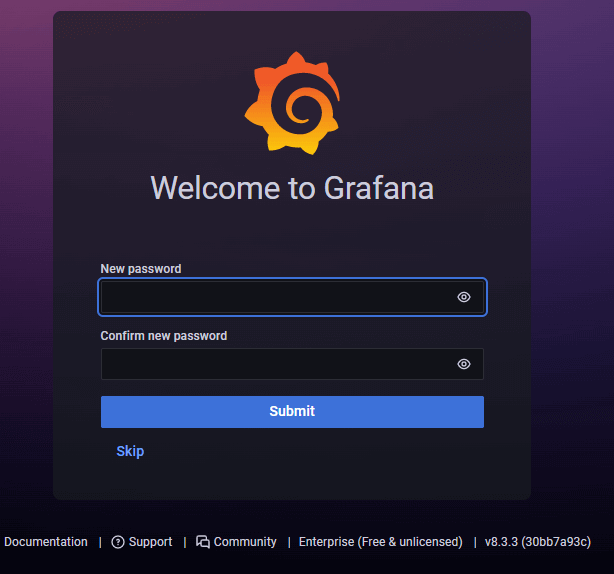
Provide your New Password and click on Change Password
Now here you can see Home Dashboard page of Grafana

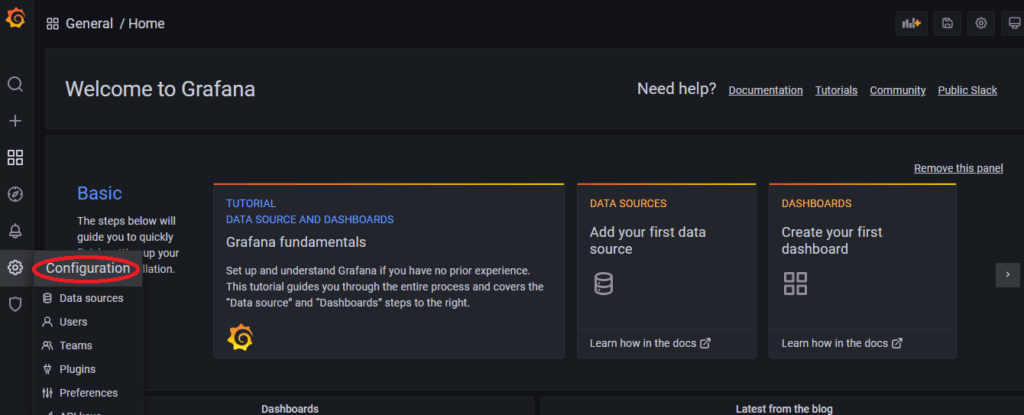
#12. Configure Prometheus as Grafana Data Source
Once you logged into Grafana Now first Navigate to Settings Icon ->> Configuration ->> data sources
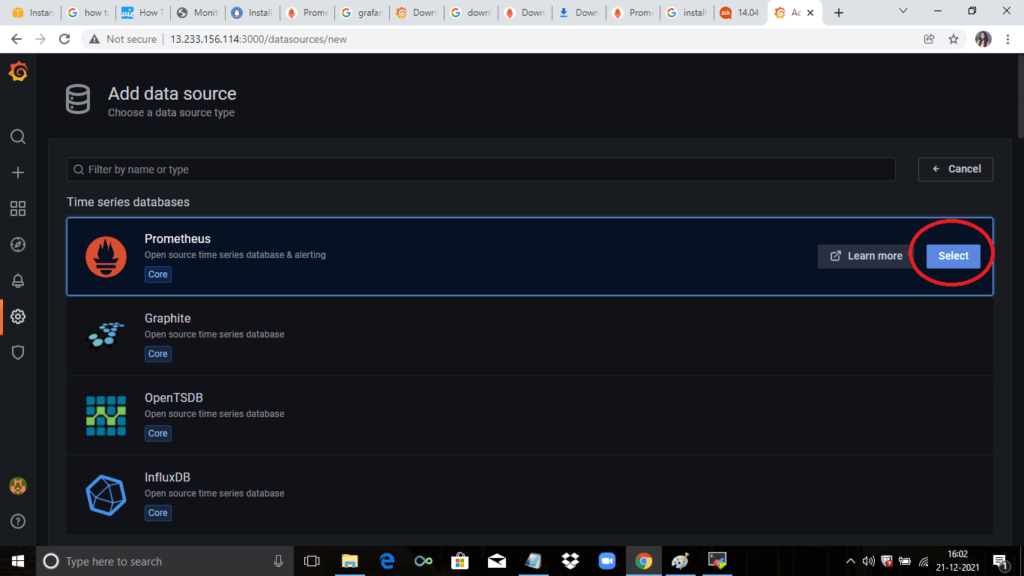
Now lets click on Add Data sources and select Prometheus
Now configure Prometheus data source by providing Prometheus URL
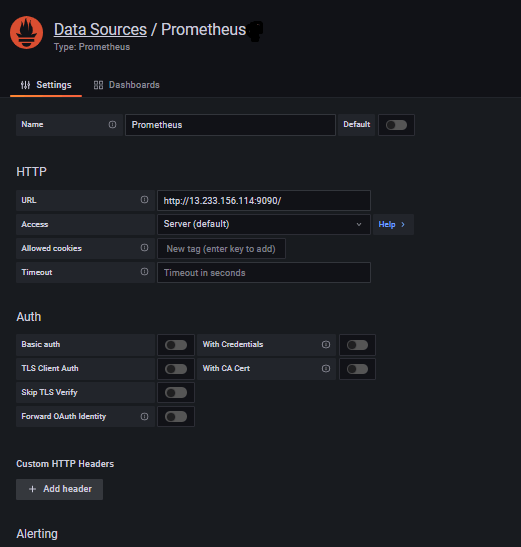
As per your requirement you can do other changes or you can also keep remaining configuration as default.
Now click on Save & test so it will prompt a message Data Source is working.

#13. Install Node Exporter on Ubuntu 20.04 LTS
Node Exporter collects the metrics of your system such as Memory usage, CPU usage, RAM, disk space, etc.
To install Node Exporter first navigate to Prometheus official download page, Scroll down and you will get node_exporter section and then select Linux OS for amd64.
Now right click on node exporter and copy link address
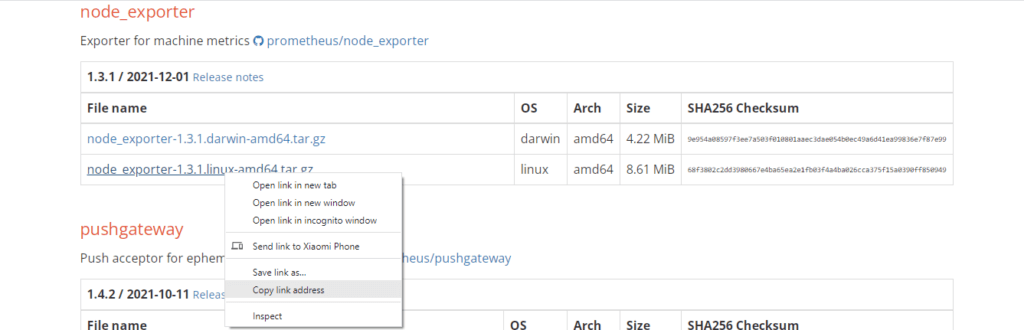
Now lets run the copied URL with wget command
cd /tmp
wget https://github.com/prometheus/node_exporter/releases/download/v0.18.1/node_exporter-0.18.1.linux-amd64.tar.g
Unzip the downloaded the file using below command
tar xvfz node_exporter-*.*-amd64.tar.gz
Move the binary file of node exporter to /usr/local/bin location.
sudo mv node_exporter-*.*-amd64/node_exporter /usr/local/bin/
Create a node_exporter user to run the node exporter service.
sudo useradd -rs /bin/false node_exporter
#14. Create a node_exporter service file in the /etc/systemd/system directory
sudo nano /etc/systemd/system/node_exporter.service
Paste the below content in your service file
[Unit]
Description=Node Exporter
After=network.target
[Service]
User=node_exporter
Group=node_exporter
Type=simple
ExecStart=/usr/local/bin/node_exporter
[Install]
WantedBy=multi-user.target
Now lets start and enable the node_exporter service using below commands
sudo systemctl daemon-reload
sudo systemctl enable node_exporter
sudo systemctl start node_exporter
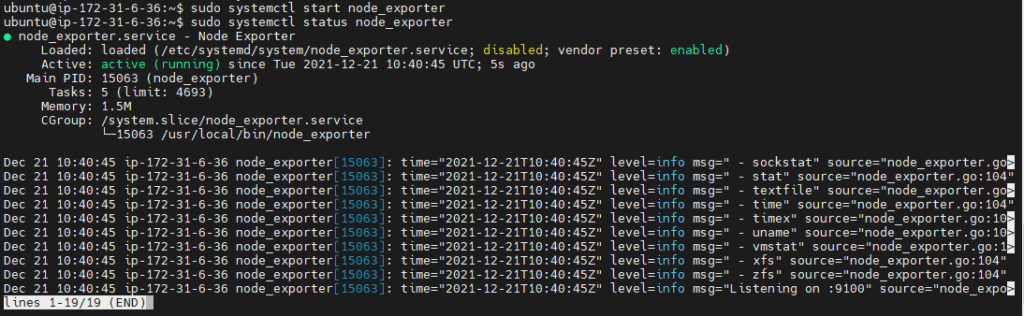
sudo systemctl status node_exporter
We have covered How to Install Prometheus and Grafana on Ubuntu 20.04 LTS with Node Exporter.
#15. Configure the Node Exporter as a Prometheus target
Now to scrape the node_exporter lets instruct the Prometheus by making a minor change in prometheus.yml file
sudo nano /etc/prometheus/prometheus.yml
-job_name: 'Node_Exporter'

    scrape_interval: 5s

    static_configs:

      - targets: ['<Server_IP_of_Node_Exporter_Machine>:9100']
After changing in config file you need to restart to prometheus
Now restart the Prometheus Service
sudo systemctl restart prometheus
Hit the URL in your web browser to check weather our target is successfully scraped by Prometheus or not
https://localhost:9100/targets
#16. Creating Grafana Dashboard to Monitor Linux Server
Now lets build a dashboard in Grafana so then it will able to reflect the metrics of the Linux system.So we will use 14513 to import Grafana.com, Lets come to Grafana Home page and you can see a “+” icon. Click on that and select “Import”

Now provide the Grafana.com Dashboard ID which is 14513 and click on Load
Now provide the name and select the Prometheus Datasource and click on Import.
There you are done with the setup. Now your Dashboard is running up!.
#17. Install WMI Exporter on Windows
For Windows hosts, you are going to use the Windows exporter.
You can download the latest version of windows installer from here
When the download is done, simply click on the MSI file and start running the installer.
After Installation of WMI Exporter lets check its sucessfully installed or not
So go to services and search windows exporter.
Make sure windows exporter service is running.
Now that your exporter is running, it should start exposing metrics on
http://localhost:9182/metrics
So let’s check
#18. Configure the WMI Exporter as a Prometheus Target
Now run the below command to update config file
sudo nano /etc/prometheus/prometheus.yml
Update config file with below code:
 - job_name: "WMI Exporter"

    # metrics_path defaults to '/metrics'
    # scheme defaults to 'http'.

    static_configs:
      - targets: ["Host_ip:9182"]
Now save the file nd exit
After changing in config file you need to restart prometheus server with below commands:
sudo systemctl restart prometheus
sudo systemctl status prometheus
Hit the URL in your web browser to check weather our target is successfully scraped by Prometheus or not
https://localhost:9182/targets

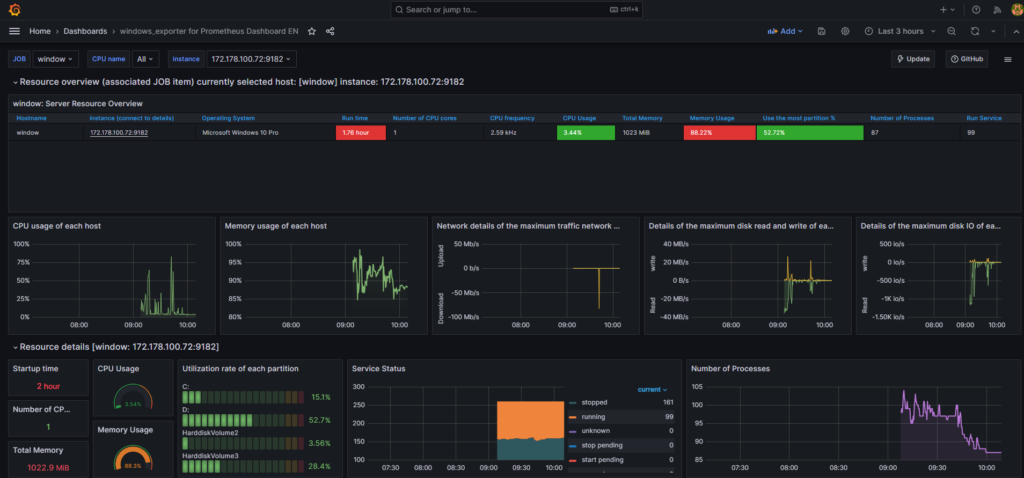
#19. Creating Grafana Dashboard to monitor Windows server
Now lets build a dashboard in Grafana so then it will able to reflect the metrics of the Windows system.
So we will use 14510 to import Grafana.com, Lets come to Grafana Home page and you can see a “+” icon. Click on that and select “Import”
On the next window, simply enter the dashboard ID in the corresponding field
Now provide the name and select the Prometheus Datasource and click on Import.
There you are done with the setup. Now your Dashboard is running up!
Conclusion:
In this article we have covered Install Prometheus and Grafana on Ubuntu 20.04 LTS with Node Exporter and WMI Exporter | Windows and Linux Server Monitoring using Prometheus and Grafana.
Related Articles:
Kubernetes cluster Monitoring with Prometheus and Grafana
Reference:
Prometheus official site
Grafana official site
Monitoring Performance with Prometheus and WMI Exporter on Grafana Dashboard
Required Tools for Performance Monitoring:
To monitor performance effectively, we need to install the following tools:
- WMI Exporter: WMI Exporter provides system metrics from Windows machines
- Prometheus: Prometheus handles data collection
- Grafana: Grafana creates customizable dashboards for visual analysis
These tools will allow us to collect, export, and visualize real-time performance metrics. This setup enables us to monitor, analyze, and troubleshoot system performance issues effectively.
Installing WMI Installer:
-
Download the MSI file from the GitHub repository linked below and proceed with the installation:
Windows Exporter Releases on GitHub
Download Link: windows_exporter-0.28.1-amd64.msi -
Open Windows PowerShell in administrator mode at the file location and run the following command to install the service.
windows_exporter.exe --collectors.enabled="cpu,cs,iis,logical_disk,net,os,service,system,textfile" --web.listen-address=":9182"
-
Open the Services management console and confirm that the WMI Exporter service is running on the machine.
-
Open your browser and navigate to the WMI Exporter URL:
http://localhost:9182/metrics
Installing Prometheus:
-
Download the latest version of Prometheus using the link below:
Prometheus Downloads
Download Link: prometheus-2.53.2.windows-amd64.zip
-
Extract the zip file, then open Windows PowerShell in the extracted directory to proceed with the setup.
-
Edit the prometheus.yml file to include the WMI Exporter URL for proper monitoring configuration:
- targets: ["localhost:9090", "localhost:9182"]
-
Run the following command to execute the application and start its processes:
.\prometheus.exe --config.file=prometheus.yml
-
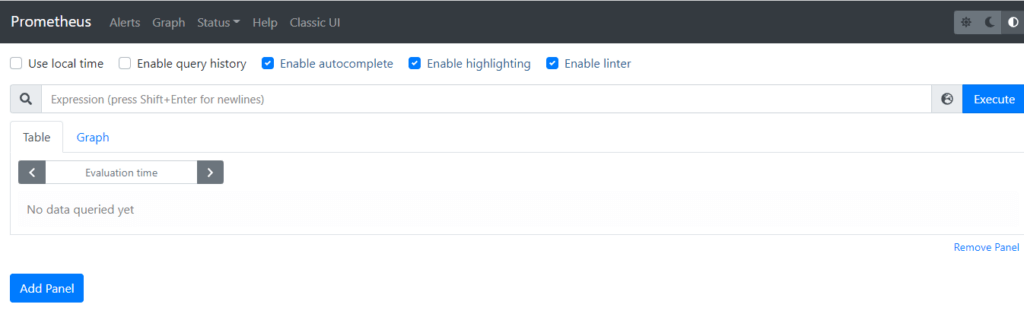
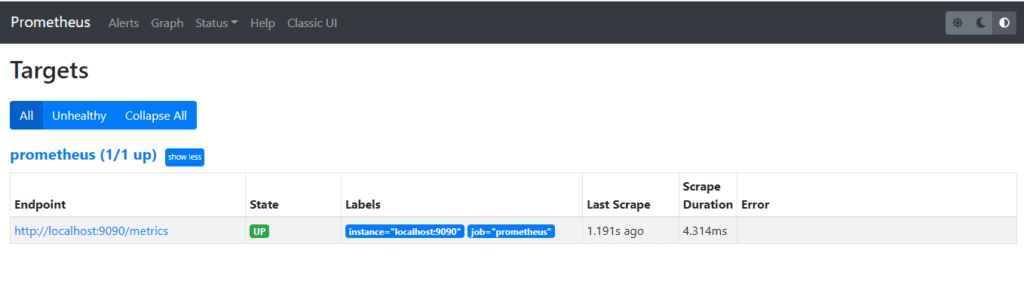
In your browser, navigate to the URL below. Click on Status and then Targets to verify that all endpoints are up and running:
http://localhost:9090/
Installing Grafana:
-
Download the Grafana installer from the link below and run it to complete the setup:
Grafana Download Page
Direct Download Link: grafana-enterprise-11.2.0.windows-amd64.msi
-
Install the application and verify that the service is running correctly.
-
Open your browser and go to the following URL to access Grafana:
http://localhost:3000
The default credentials for Grafana are username: admin and password: admin
-
Click on Data Sources under Connections, then select Add New Data Source.
-
Locate Prometheus in the list and click on it to select the data source.
-
Enter http://localhost:9090 in the Prometheus server URL field, then click Save & Test to verify the connection.
-
Click on Home and then select Import Dashboard to add a new dashboard.
-
Select Add Visualization to perform a query to get the performance metrics of the sites in IIS.
-
Select Prometheus in the data source section.
-
Now you can run the query in code mode to get the performance metrics of the sites hosted in IIS.
Example Query: windows_iis_current_connections{site=“BoldReports_EnterpriseReporting”}
-
You can save the dashboard by providing a name for it.
1. Install Windows Exporter on Your Nodes:
Download and Copy windows_exporter-0.16.0-amd64.msi to your nodes Desktop.
Open CMD As Administrator.
Change Directory to Desktop.
Run this Command:
msiexec /i windows_exporter-0.16.0-amd64.msi ENABLED_COLLECTORS="ad,adfs,cache,cpu,cpu_info,cs,container,dfsr,dhcp,dns,fsrmquota,iis,logical_disk,logon,memory,msmq,mssql,netframework_clrexceptions,netframework_clrinterop,netframework_clrjit,netframework_clrloading,netframework_clrlocksandthreads,netframework_clrmemory,netframework_clrremoting,netframework_clrsecurity,net,os,process,remote_fx,service,tcp,time,vmware" TEXTFILE_DIR="C:\custom_metrics" LISTEN_PORT="9115"
2. Add Node to Prometheus Targets:
Edit Prometheus.yml and add targets.