
Служба Windows Error Reporting (WER) служит для сбора и отправки отладочной информации о падении системных и сторонних приложений в Windows на сервера Microsoft. По задумке Microsoft, эта информация должна анализироваться и при наличии решения, вариант исправления проблемы должен отправляется пользователю через Windows Error Reporting Response. Но по факту мало кто пользуется этим функционалом, хотя Microsoft настойчиво оставляет службу сбора ошибок WER включенной по умолчанию во всех последних версиях Windows. В большинстве случае о службе WER вспоминают, когда каталог C:\ProgramData\Microsoft\Windows\WER\ReportQueue\ начинает занимать много места на системном диске (вплоть до нескольких десятков Гб), даже не смотря на то что на этом каталоге по умолчанию включена NTFS компрессия.
Содержание:
- Служба Windows Error Reporting
- Очистка папки WER\ReportQueue в Windows
- Отключение Window Error Reporting в Windows Server
- Отключаем сбор и отправки отчетов об ошибках в Windows 10
- Отключение Windows Error Reporting через GPO
Служба Windows Error Reporting
Служба Windows Error Reporting при появлении ошибки показывает диалоговое окно, предлагающее отправить отчет об ошибке в корпорацию Microsoft. Когда в Windows вы видите сообщение об ошибке
YourApp has stop working
, в это время в служба Windows Error Reporting запускает утилиту WerFault.exe для сбора отладочных данных (могут включать в себя дамп памяти).
Данные пользователя сохраняются в профиль пользователя:
%USERPROFILE%\AppData\Local\Microsoft\Windows\wer
Системные данные – в системный каталог:
%ALLUSERSPROFILE%\Microsoft\Windows\WER\
Служба Windows Error Reporting представляет собой отдельный сервис Windows. Вы можете проверить состояние службы командой PowerShell:
Get-Service WerSvc
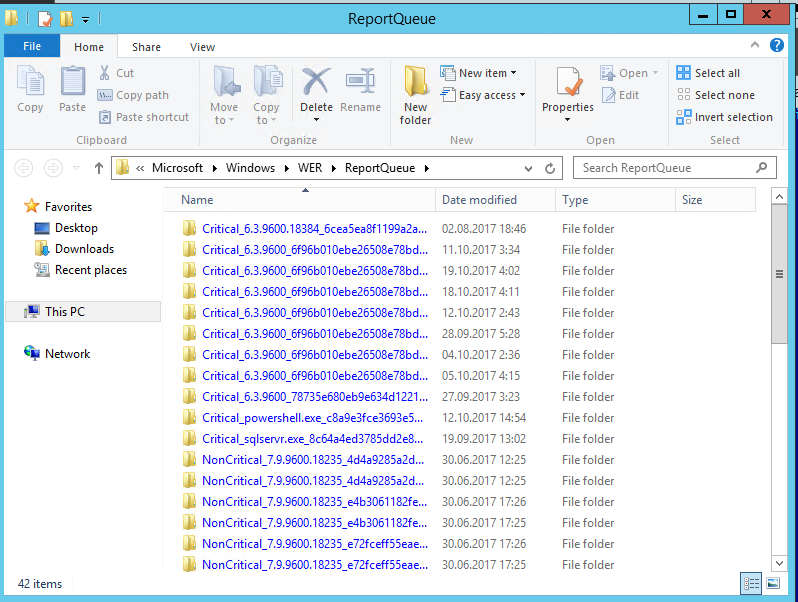
Внутри каталога WER\ReportQueue\ содержится множество каталогов, с именами в формате:
- Critical_6.3.9600.18384_{ID}_00000000_cab_3222bf78
- Critical_powershell.exe_{ID}_cab_271e13c0
- Critical_sqlservr.exe__{ID}_cab_b3a19651
- NonCritical_7.9.9600.18235__{ID}_0bfcb07a
- AppCrash_cmd.exe_{ID}_bda769bf_37d3b403
Как вы видите, имя каталога содержит степень критичности события и имя конкретного exe файла, который завершился аварийно. Во всех каталогах обязательно имеется файл Report.wer, который содержит описание ошибок и несколько файлов с дополнительной информацией.
Очистка папки WER\ReportQueue в Windows
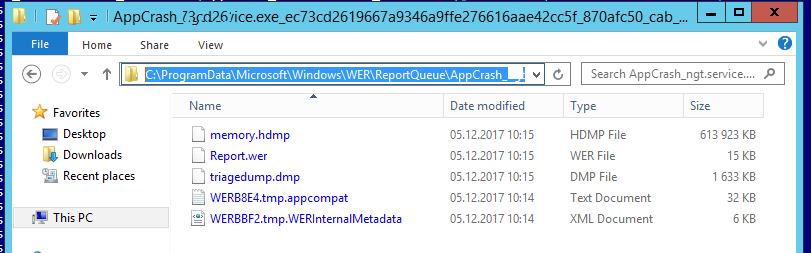
Как правило, размер каждой папки в WER незначителен, но в некоторых случаях для проблемного процесса генерируется дамп памяти, который занимает довольно много места. На скриншоте ниже видно, что размер файла дампа memory.hdmp составляет около 610 Мб. Парочка таким дампов – и на диске исчезло несколько свободных гигибайт.
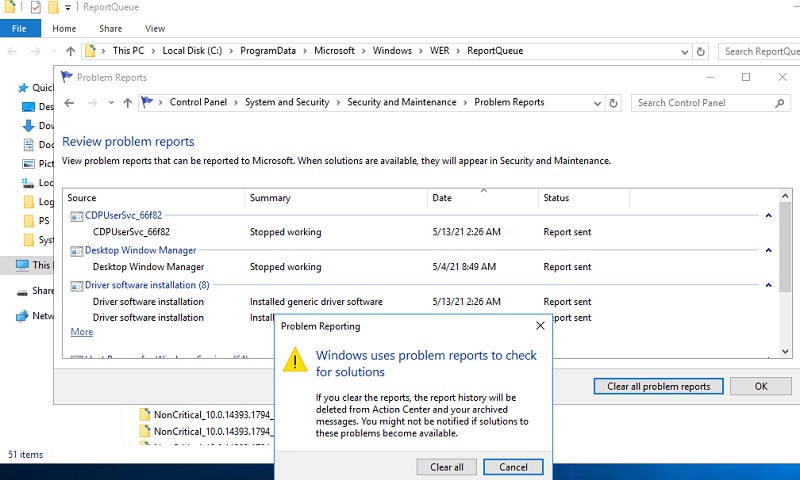
Чтобы очистить все эти ошибки и журналы штатными средствами, откройте панель управления и перейдите в раздел ControlPanel -> System and Security -> Security and Maintenance -> Maintenance -> View reliability history -> View all problem reports (Control Panel\System and Security\Security and Maintenance\Problem Reports) и нажмите на кнопку Clear all problem reports.
Для быстрого освобождения места на диске от файлов отладки, сгенерированных службой WER, содержимое следующих каталогов можно безболезненно очистить вручную.
- C:\ProgramData\Microsoft\Windows\WER\ReportArchive\
- C:\ProgramData\Microsoft\Windows\WER\ReportQueue\
Следующие команды PowerShell удалят из каталога каталогов WER все файлы, старше 15 дней:
Get-ChildItem -Path  'C:\ProgramData\Microsoft\Windows\WER\ReportArchive' -Recurse | Where-Object CreationTime -lt (Get-Date).AddDays(-15) | Remove-Item -force -Recurse
Get-ChildItem -Path  'C:\ProgramData\Microsoft\Windows\WER\ReportQueue' -Recurse | Where-Object CreationTime -lt (Get-Date).AddDays(-15) | Remove-Item -force –Recurse
Для очистки каталогов WER в пользовательских профилях используйте такой скрипт:
$users = Get-ChildItem c:\users|where{$_.name -notmatch 'Public|default'}
foreach ($user in $users){
Get-ChildItem "C:\Users\$User\AppData\Local\Microsoft\Windows\WER\ " –Recurse -ErrorAction SilentlyContinue | Remove-Item –force –Recurse
}
Отключение Window Error Reporting в Windows Server
В Windows Server 2019/2016/2012R2 вы можете управлять состоянием WER с помощью PowerShell. Вы можете отключить службу Windows Error Reporting:
Get-Service WerSvc| stop-service –passthru -force
Set-Service WerSvc –startuptype manual –passthru
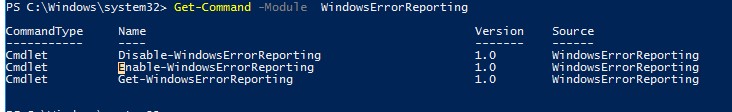
Но есть более корректные способы отключения WER в Windows. В версии PowerShell 4.0 добавлен отдельный модуль WindowsErrorReporting из трех командлетов:
Get-Command -Module WindowsErrorReporting
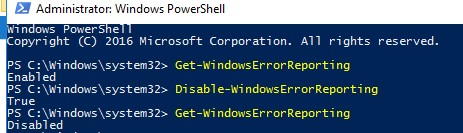
Проверить состояние службы Windows Error Reporting можно командой:
Get-WindowsErrorReporting
Для отключения WER, выполните:
Disable-WindowsErrorReporting
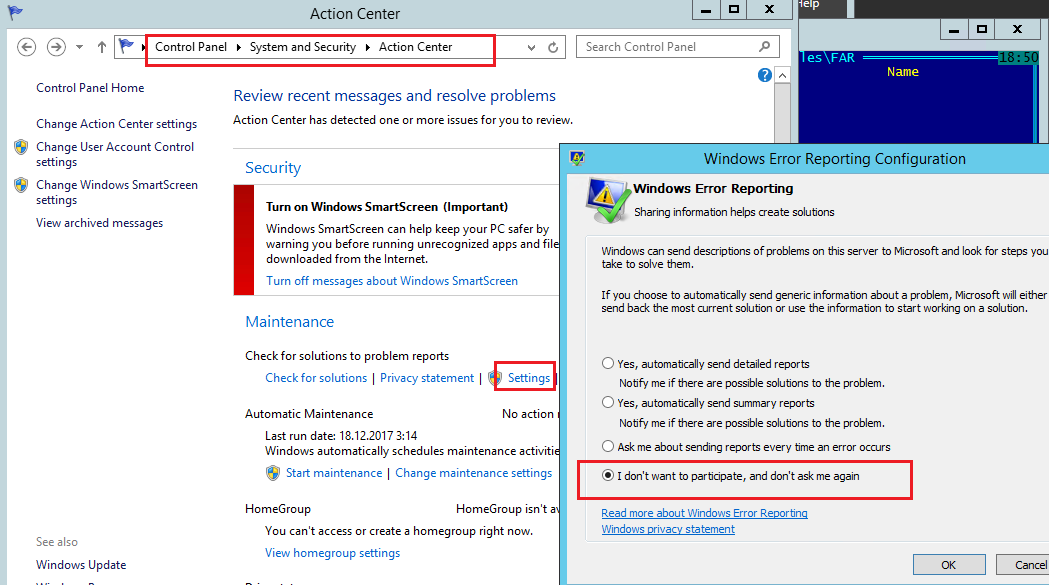
В Windows Server 2012 R2 можно отключить запись информации об ошибках Windows Error Reporting через панель управления (Control Panel -> System and Security -> Action Center -> раздел Maintenance -> Settings -> выберите опцию I don’t want to participate, and don’t ask me again
Отключаем сбор и отправки отчетов об ошибках в Windows 10
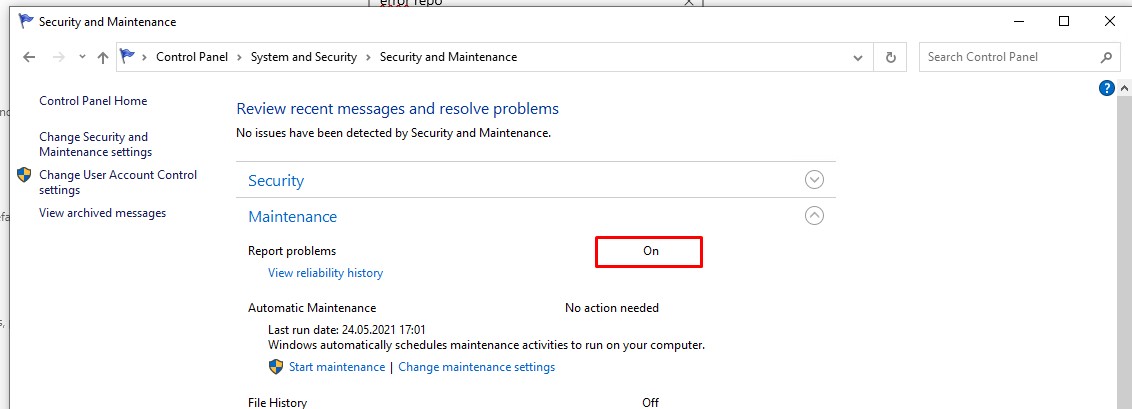
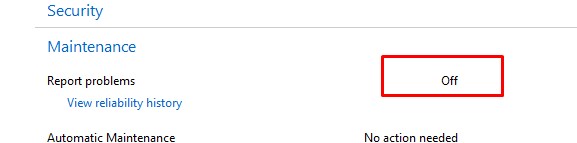
В Windows 10 нельзя отключить Error Reporting через панель управления. В графическогм интерфейсе можно только проверить ее статус (Система и безопасность ->Центр безопасности и обслуживания -> секция Обслуживание). Как вы видите, по умолчанию параметр Поиск решения для указанных в отчетах проблем включен (Control Panel -> System and Security -> Security and Maintenance -> Maintenance -> Report problems = On).
HKLM\SOFTWARE\Microsoft\Windows\Windows Error Reporting нужно создать новый параметр типа DWORD (32 бита) с именем Disabled и значением 1.
Можно отключить сбор ошибок WER для конкретных пользователей:
reg add "HKCU\Software\Microsoft\Windows\Windows Error Reporting" /v "Disabled" /t REG_DWORD /d "1" /f
Или отключить WER для всех:
reg add "HKLM\Software\Microsoft\Windows\Windows Error Reporting" /v "Disabled" /t REG_DWORD /d "1" /f
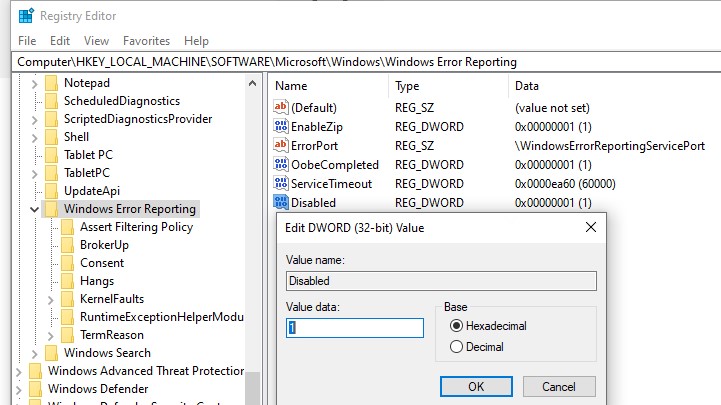
Измените параметр реестра и проверьте статус параметра Поиск решения для указанных в отчетах проблем в панели управления. Его статус должен изменится на Отключено.
Отключение Windows Error Reporting через GPO
Также вы можете управлять настройками службы Windows Error Reporting через групповые политики.
Запустите редактор локальной (
gpedit.msc
) или доменной GPO (
gpmc.msc
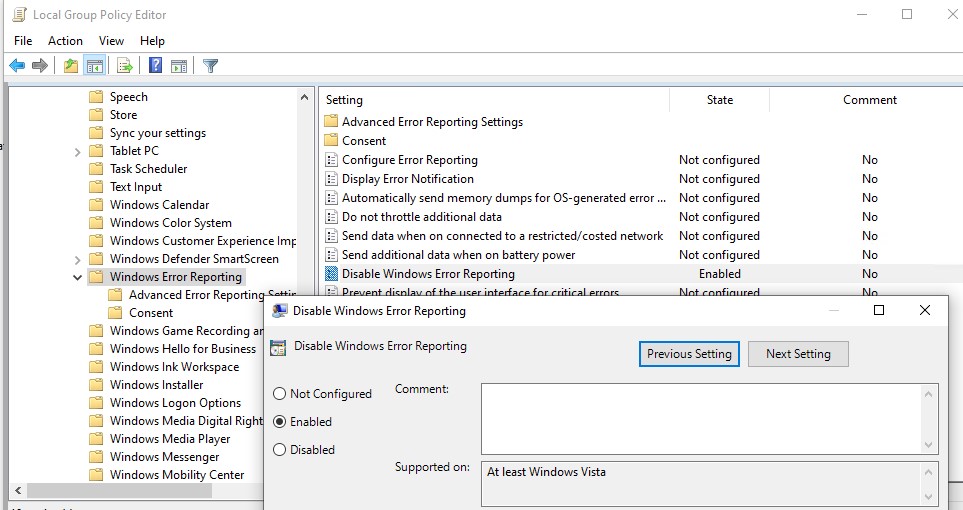
) и перейдите в ветку реестра Computer Configuration -> Administrative Templates -> Windows Components -> Windows Error Reporting (Компоненты Windows -> Отчеты об ошибках Windows). Для отключения сбора и отправки ошибок через WER включите политику Disable Windows Error Reporting (Отключить отчеты об ошибках Windows).
Аналогичная политика есть в пользовательском разделе политик (User Configuration).
Обновите GPO (перезагрузка не потребуется).
В результате в Windows перестанут формироваться сообщения об ошибках Windows и отправляться в Microsoft.
Provide feedback
Saved searches
Use saved searches to filter your results more quickly
Sign up
Appearance settings
As I was looking into collecting crash telemetry for Datadog, I started experimenting with WER. WER stands for Windows Error Reporting, and it’s an API designed to allow Microsoft and third-party vendors to collect information about… well, errors, and crashes. Unfortunately, this API is very poorly documented, and a large part of the documentation comes from open-source projects (such as crashpad) that had to discover its quirks through trial and error. This article aims to provide a quick-start for .NET developers who would be interested in using WER in their applications.
Note that this article focuses purely on one part of the WER API: the crash handler. There are many more features, such as the ability to manually create a report, that are not covered here.
How does it work?
First, let’s clarify what we’re going to do in this article. The goal is to automatically collect information when an application that we own crashes, either to be sent to a telemetry endpoint or just stored in the Windows event log. WER allows to do that through the use of a crash handler. The application has to explicitly register the crash handler (so you can’t use this mechanism to arbitrarilty monitor all applications on a machine). Then, when the process crashes, Windows is going to suspend it and spawn the WerFault.exe process. WerFault.exe will load the registered crash handlers and give them a chance to inspect the memory of the faulty process to collect all the information they need. After that, the process will be teared down like for a normal crash.
This has multiple advantages over a “manual” approach, where you’d try to catch all exceptions in your application. Since the mechanism is handled at the OS level, it supposedly works for all kinds of crashes (whereas, if you try to handle it manually, you may fail to invoke your code in some unrecoverable crash conditions such as a stack overflow). Also, the collection occurs out-of-process, so you don’t have to worry about your crash handler getting corrupted by whatever caused the crash.
Preparing the crash handler
The very first step is to build our crash handler. Normally you’d use C++ for that, but if you follow me then you probably know that I can’t resist an occasion to use NativeAOT. So we will build our crash handler in C#.
Create a new “Class Library” project targeting .NET 8+ and make sure to add <PublishAot>true</PublishAot> to the csproj (or check the NativeAOT checkbox in Visual Studio). Then we need to export three functions:
OutOfProcessExceptionEventCallback: this is the first function that will be called when the DLL is loaded byWerFault.exe. This is where we are given a chance to inspect the crashing process, and we must decide whether we want to “claim” the crash or not. If we claim it, thenWerFault.exewill call the next two functions.OutOfProcessExceptionEventSignatureCallback: this function is only called if we claimed the crash during the call toOutOfProcessExceptionEventCallback. This is our chance to add custom metadata that will be visible in the crash report in the event log. I believe that information can also be used to triage the crash if you registered to the “Windows Desktop Application Program”, but I haven’t looked into it.OutOfProcessExceptionEventDebuggerLaunchCallback: this function is only called if we claimed the crash during the call toOutOfProcessExceptionEventCallback. This gives you a chance to launch a custom debugger to debug the crash.
At this point, our code looks like:
internal class Wer
{
    [UnmanagedCallersOnly(EntryPoint = "OutOfProcessExceptionEventCallback")]
    private static unsafe int OutOfProcessExceptionEventCallback(nint context, WER_RUNTIME_EXCEPTION_INFORMATION* exceptionInformation, bool* ownershipClaimed, char* eventName, int* size, int* signatureCount)
    {
        Debug.WriteLine("OutOfProcessExceptionEventCallback");
        return 0;
    }

    [UnmanagedCallersOnly(EntryPoint = "OutOfProcessExceptionEventSignatureCallback")]
    private static unsafe int OutOfProcessExceptionEventSignatureCallback(nint context, WER_RUNTIME_EXCEPTION_INFORMATION* exceptionInformation, int index, char* name, int* nameLength, char* value, int* valueLength)
    {
        Debug.WriteLine("OutOfProcessExceptionEventSignatureCallback");
        return 0;
    }

    [UnmanagedCallersOnly(EntryPoint = "OutOfProcessExceptionEventDebuggerLaunchCallback")]
    private static unsafe int OutOfProcessExceptionEventDebuggerLaunchCallback(nint context, WER_RUNTIME_EXCEPTION_INFORMATION* exceptionInformation, int* isCustomDebugger, char* debuggerLaunch, int* debuggerLaunchLength, int* isDebuggerAutoLaunch)
    {
        Debug.WriteLine("OutOfProcessExceptionEventDebuggerLaunchCallback");
        return 0;
    }

    [StructLayout(LayoutKind.Sequential)]
    private unsafe struct EXCEPTION_RECORD
    {
        public const int EXCEPTION_MAXIMUM_PARAMETERS = 15;

        public int ExceptionCode;
        public int ExceptionFlags;
        public EXCEPTION_RECORD* ExceptionRecord;
        public nint ExceptionAddress;
        public int NumberParameters;
        public fixed ulong ExceptionInformation[EXCEPTION_MAXIMUM_PARAMETERS];
    }

    [StructLayout(LayoutKind.Sequential)]
    private unsafe struct WER_RUNTIME_EXCEPTION_INFORMATION
    {
        public int Size;
        public nint Process;
        public nint Thread;
        public EXCEPTION_RECORD ExceptionRecord;
        public nint Context;
        public char* ReportId;
        public int IsFatal;
        public int Reserved;
    }
}
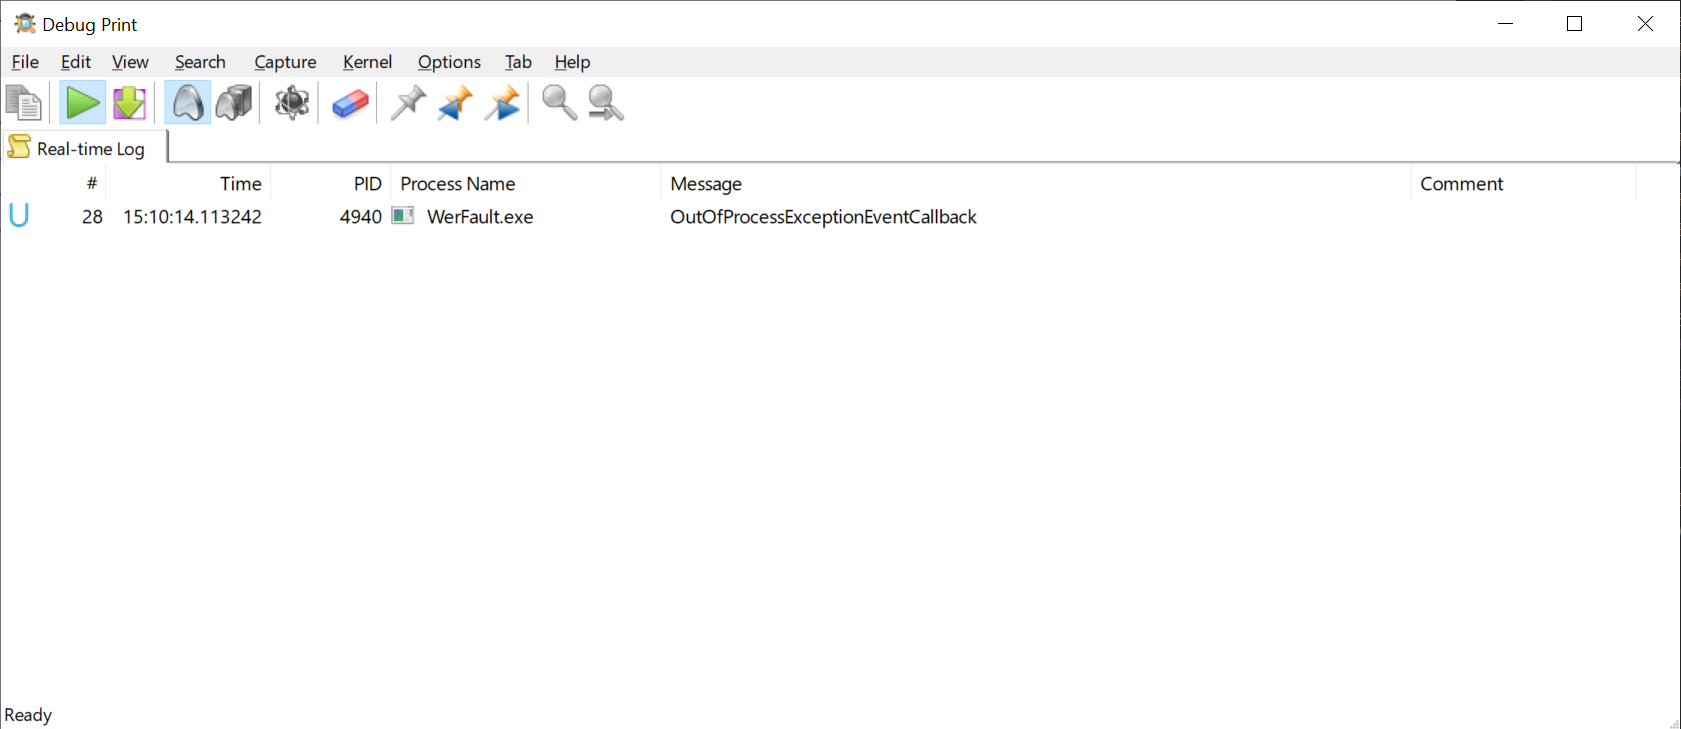
In a NativeAOT library, the UnmanagedCallersOnly exports the function with the given symbol, in addition to preparing it to be called directly from unmanaged code. Because WerFault.exe is not an interactive process, we use Debug.WriteLine to write some messages that we can then listen to by using Sysinternals DebugView or Pavel Yosifovich’s DbgPrint (which I prefer because it shows the process name).
We can then export the DLL using NativeAOT:
$ dotnet publish -r win-x64
Registering the crash handler
There are two more steps before we can see our debug messages: registering the crash handler, and… crashing.
The crash handler must first be registered in the registry. A DWORD value must be created, either in HKEY_LOCAL_MACHINE\SOFTWARE\Microsoft\Windows\Windows Error Reporting\RuntimeExceptionHelperModules or in HKEY_CURRENT_USER\SOFTWARE\Microsoft\Windows\Windows Error Reporting\RuntimeExceptionHelperModules. The actual value doesn’t matter, but the name must be the path to the crash handler DLL (for instance, C:\crash\wer.dll).
Ideally the value should be stored in HKEY_LOCAL_MACHINE, but this requires administrator permission (so it would typically be something you do during installation). Since Windows 10 20H1, the value can be stored in HKEY_LOCAL_USER instead, with one caveat: a crash handler that has been registered in HKCU instead of HKLM can’t claim the crash during OutOfProcessExceptionEventCallback (so OutOfProcessExceptionEventSignatureCallback and OutOfProcessExceptionEventDebuggerLaunchCallback won’t be called). This should however be enough for most use-cases.
After adding the crash handler to the registry, we still need to make a test application crash. Let’s create a new .NET 8 Console Application project (not .NET 9+, for reasons explained later). Inside, we need to call WerRegisterRuntimeExceptionModule to register the crash handler. It takes two arguments: the path to the crash handler DLL, and an arbitrary pointer-size value that will be given as-is to the crash handler (so you can use it to pass a custom context). Then, we trigger the crash:
class Program
{
    static unsafe void Main(string[] args)
    {
        int result = WerRegisterRuntimeExceptionModule(@"C:\crash\wer.dll", 0);

        if (result != 0)
        {
            Console.WriteLine($"Failed to register crash handler: {result}");
            return;
        }

        Console.WriteLine("Press return to crash");
        Console.ReadLine();

        throw new Exception("Crashing");
    }

    [DllImport("kernel32.dll")]
    public static extern int WerRegisterRuntimeExceptionModule([MarshalAs(UnmanagedType.LPWStr)] string callbackDll, nint context);
}
If you did everything properly, you should see the OutOfProcessExceptionEventCallback debug message in DbgPrint.
At this point, only OutOfProcessExceptionEventCallback is called because we don’t claim the crash.
So far, everything seems to work properly, but if you try the same thing in a .NET Framework application (or .NET 9+) you will see that the crash handler is not invoked. Why is that?
Too many cooks (the part with some debugging)
You may want to skip ahead if you’re only interested in WER, but since this is mainly a debugging blog I thought it would be nice to show how to debug WER registration issues.
To check if the handler is properly registered, I started the .NET Framework app (with the same code as the test app shown before) up until the Press return to crash point and attached Windbg to the process. From there, you can use !peb to dump the Process Environment Block.
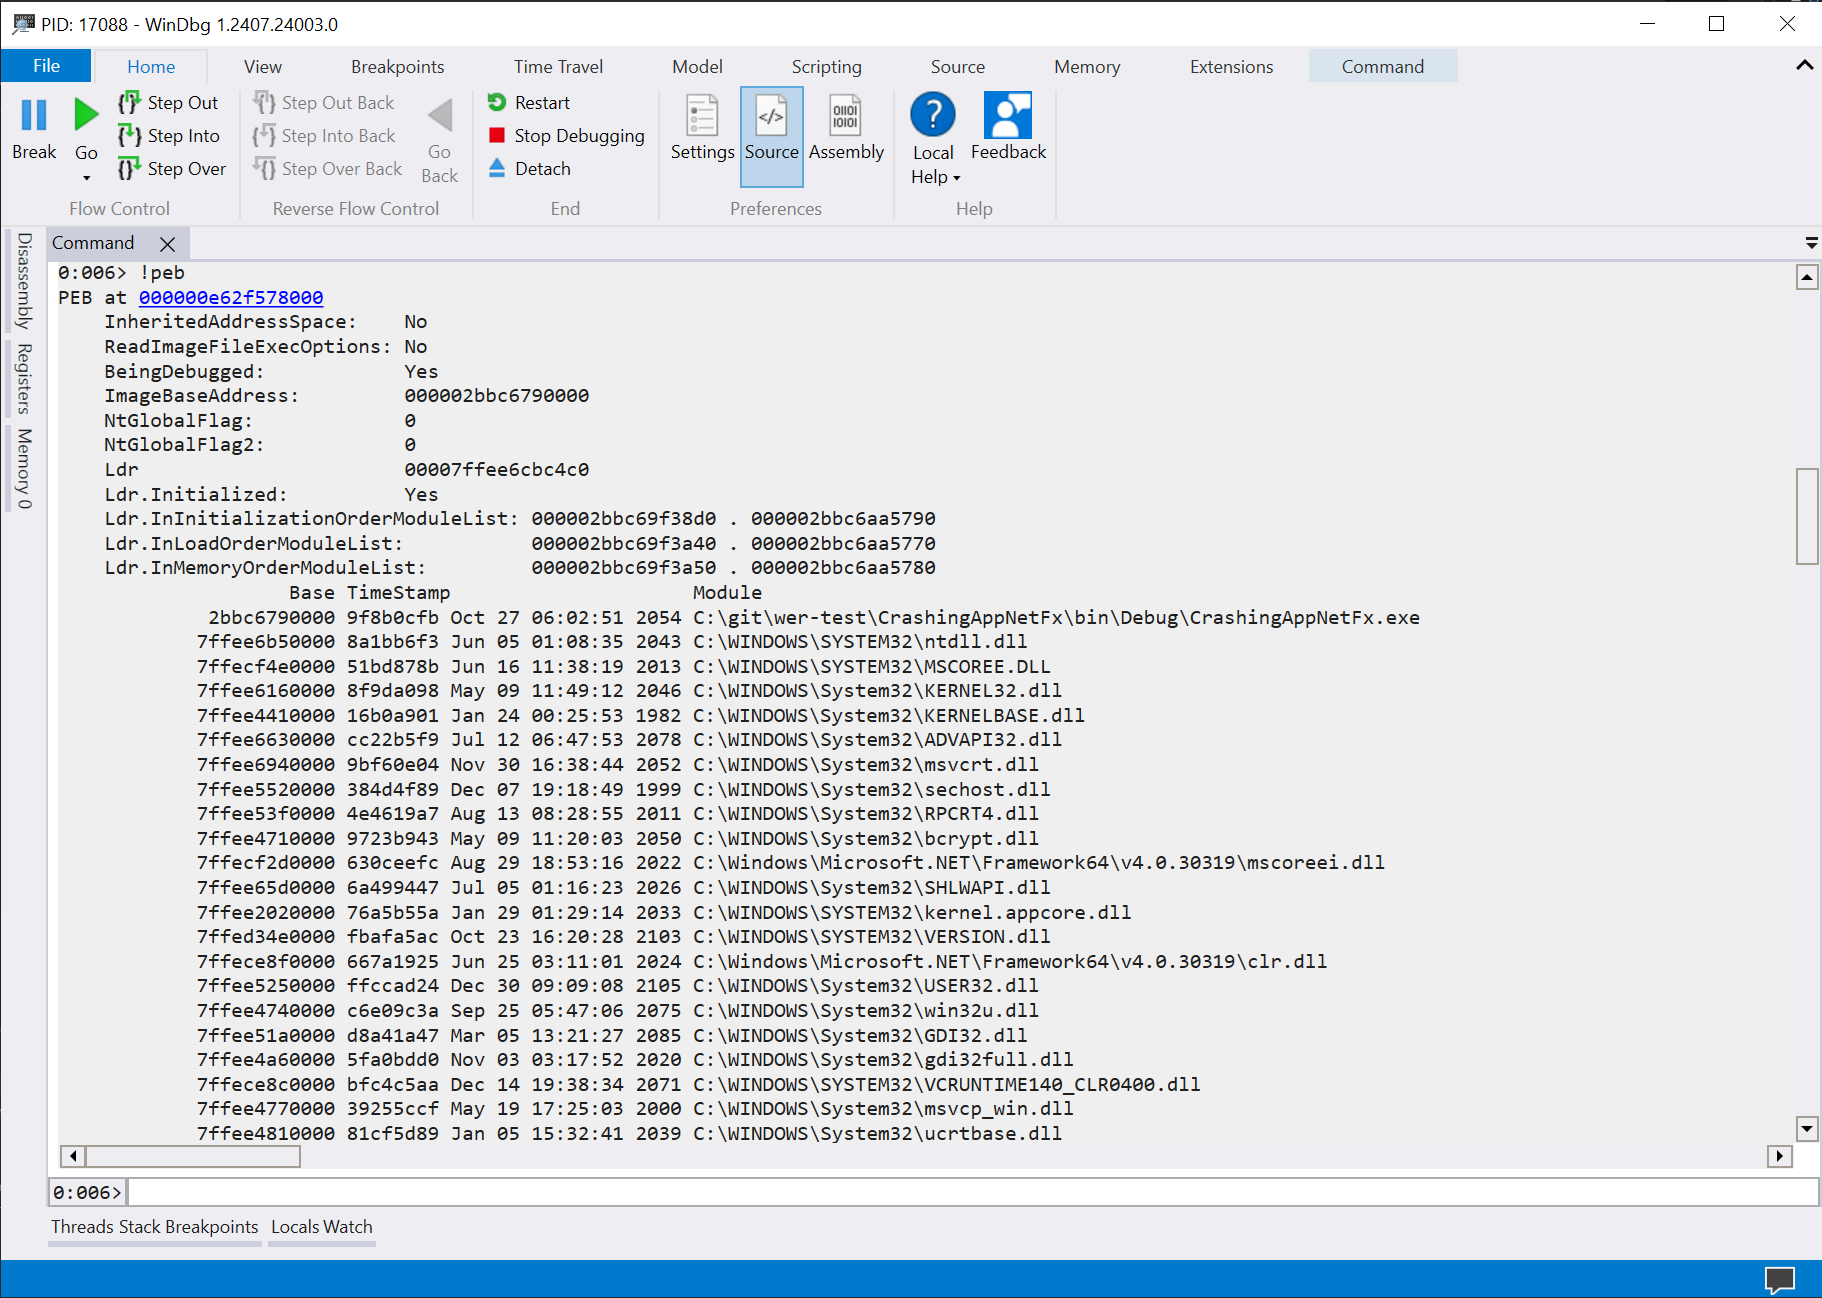
In the output, you should see PEB at 000000e62f578000 with the address underlined. By clicking on it, we can show the actual fields of the native _PEB object (or type the command dt 0x000000e62f578000 ntdll!_PEB). Then look for the value of the WerRegistrationData field (here, at the offset 0x358).
0:006> dt 0x000000e62f578000 ntdll!_PEB
+0x000 InheritedAddressSpace : 0 ''
+0x001 ReadImageFileExecOptions : 0 ''
+0x002 BeingDebugged : 0x1 ''
+0x003 BitField : 0 ''
[...]
+0x320 SparePointers : [4] (null)
+0x340 SpareUlongs : [5] 0
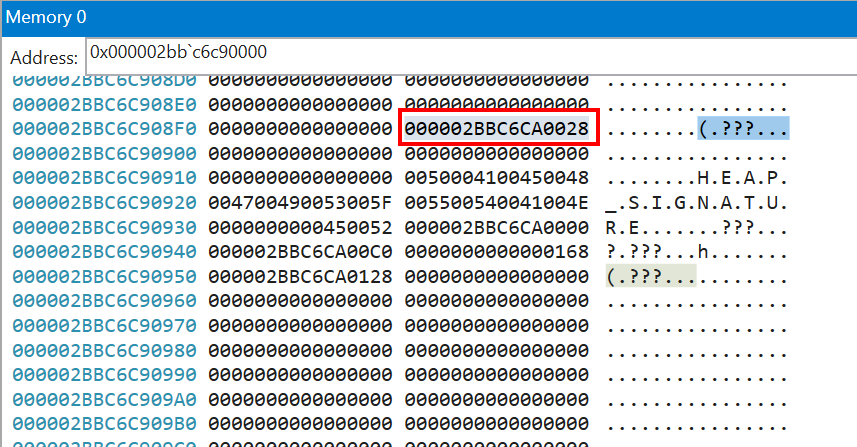
+0x358 WerRegistrationData : 0x000002bb`c6c90000 Void
+0x360 WerShipAssertPtr : (null)
[...]
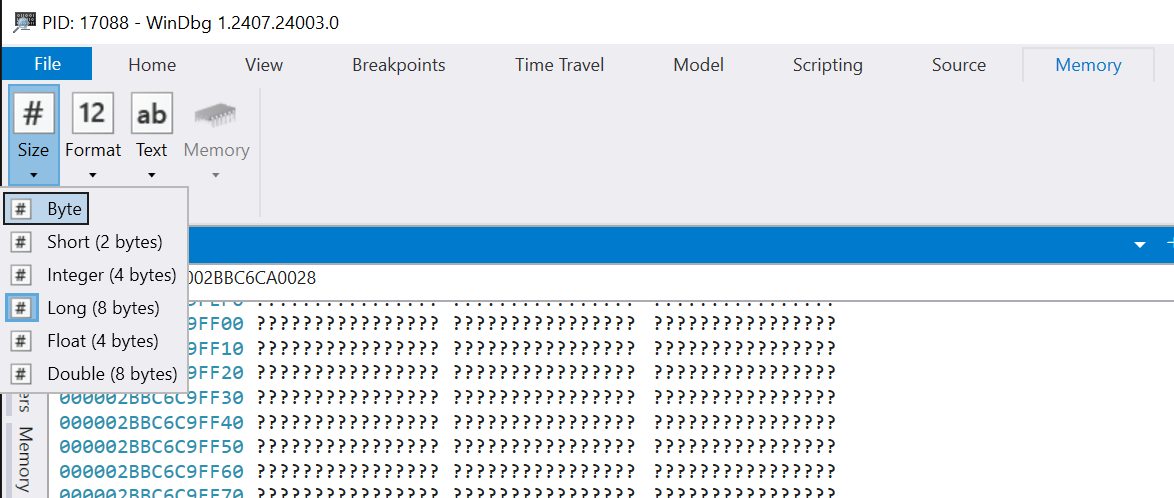
Open that address in the “Memory” panel in Windbg. In the ribbon, change “Size” to “Long” (or “Integer” if it’s a 32-bit process).
Scroll until you find the HEAP_SIGNATURE string, and take the only non-zero value before that string (it should be located 4 pointers before the string). That’s the address of the list of registered handlers.
If we inspect the memory at that address, we can see almost immediately the string C:\Windows\Microsoft.NET\Framework64\v4.0.30319\mscordacwks.dll, and our own crash handler a bit later (C:\crash\wer.dll). It turns out that .NET Framework registers its own crash handler, and they’re invoked in the same order they were registered. Because of that, it’s able to claim the crash before we have a chance to!
Changing the order of the crash handlers
Now that we know why our crash handler isn’t invoked, what can we do about it? Fortunately there is a WerUnregisterRuntimeExceptionModule API that we can use to unregister any crash handler. The plan is to unregister the .NET Framework crash handler, register our own, then re-register the .NET one. This way, we will be called first and get a chance to claim the crash, and the old one will still be called if we decide not to.
There’s one difficulty though. If you remember, WerRegisterRuntimeExceptionModule takes a second parameter, an arbitrary pointer-sized value used as context. When calling WerUnregisterRuntimeExceptionModule, you need to give the exact same value, so we have to figure out what .NET is using.
I often mention it in my articles, you can have a good approximation of the source code of .NET Framework by checking the first commit of the coreclr repository, before .NET Core diverged too much. Looking into it, we can see that .NET uses the variable g_pMSCorEE as context:
HRESULT hr = (*pFnWerRegisterRuntimeExceptionModule)(wszDACPath, (PDWORD)g_pMSCorEE);
g_pMSCorEE contains the address of the clr.dll module in memory. I assume this is because .NET Framework supports loading multiple versions of .NET side-by-side, so this is used to identify the right runtime.
This information can be retrieved fairly easily, so we can write some code to unregister the .NET crash handler, register our own, then re-register the .NET one:
class Program
{
    static unsafe void Main(string[] args)
    {
        // Locate the clr.dll module
        var clr = Process.GetCurrentProcess().Modules.Cast<ProcessModule>().First(m => m.ModuleName == "clr.dll");

        // Build the path to the crash handler (which lives in the DAC)
        var dac = Path.Combine(Path.GetDirectoryName(clr.FileName), "mscordacwks.dll");

        // Unregister the DAC
        var result = WerUnregisterRuntimeExceptionModule(dac, clr.BaseAddress);

        if (result != 0)
        {
            Console.WriteLine($"Failed to unregister {dac} with context {clr.BaseAddress:x2}");
            return;
        }

        // Register our crash handler
        result = WerRegisterRuntimeExceptionModule(@"C:\crash\wer.dll", 0);

        if (result != 0)
        {
            Console.WriteLine($"Failed to register crash handler: {result}");
            return;
        }

        // Re-register the DAC
        result = WerRegisterRuntimeExceptionModule(dac, clr.BaseAddress);

        if (result != 0)
        {
            Console.WriteLine($"Failed to re-register {dac} with context {clr.BaseAddress:x2}");
            return;
        }

        Console.WriteLine("Press return to crash");
        Console.ReadLine();

        throw new Exception("Crashing");
    }

    [DllImport("kernel32.dll")]
    public static extern int WerRegisterRuntimeExceptionModule([MarshalAs(UnmanagedType.LPWStr)] string callbackDll, nint context);

    [DllImport("kernel32.dll")]
    public static extern int WerUnregisterRuntimeExceptionModule([MarshalAs(UnmanagedType.LPWStr)] string callbackDll, nint context);
}
And with that, our crash handler should work even on .NET Framework.
But I mentioned .NET 9+ earlier, what was that about? Since I only needed to call WerUnregisterRuntimeExceptionModule on .NET Framework, I initially assumed that the WER crash handler had been removed in .NET Core. However, while debugging an unrelated registration issue in my code (using Windbg as I demonstrated before), I noticed that .NET Core was also registering its own handler! After further inspection, I discovered that the logic in WerRegisterRuntimeExceptionModule was broken, so the .NET Core handler never claimed the crash. I submitted a bug report and it has been fixed, so I expect that the WerUnregisterRuntimeExceptionModule workaround will be needed again in future versions of .NET. This is exactly the same logic as for .NET Framework, except that clr.dll is replaced with coreclr.dll, and mscordacwks.dll with mscordaccore.dll.
        // Locate the coreclr.dll module
        var coreclr = Process.GetCurrentProcess().Modules.Cast<ProcessModule>().First(m => m.ModuleName == "coreclr.dll");

        // Build the path to the crash handler (which lives in the DAC)
        var dac = Path.Combine(Path.GetDirectoryName(coreclr.FileName), "mscordaccore.dll");

        // Unregister the DAC
        var result = WerUnregisterRuntimeExceptionModule(dac, coreclr.BaseAddress);
Implementing a crash handler
Last but not least, we’re going to see what kind of logic we can put in the crash handler. You can do all kind of things, especially if you use ClrMD to inspect the memory, but for this article we’re only going to see how to use the context argument of WerRegisterRuntimeExceptionModule to share some information, and add that to the crash report metadata.
Let’s say that we want to store two things in the crash report: a version number, and a status message. It’s pretty obvious that all this information is not going to fit into the pointer-sized context argument, so instead we will give the address to that information.
First we declare the struct that will store the information. I put the status message in an inline fixed-size string because it makes things easier, but that’s not mandatory.
[StructLayout(LayoutKind.Sequential)]
struct Payload
{
    public int Version;
    public Message Status;

    [InlineArray(256)]
    public struct Message
    {
        private char _first;
    }
}
(we could also declare it as public fixed char Status[256], but I find inline arrays easier to manipulate)
The definition of that struct should be shared between the crashing app and the crash handler.
Then, in the crashing app, we allocate the struct (using some native memory because we don’t want it to be moved by the GC) and we store our information:
var ptr = NativeMemory.AllocZeroed((nuint)sizeof(Payload));
var payload = (Payload*)ptr;

payload->Version = 5;
"Hello world!".CopyTo(payload->Status);
Then we give the address of the struct to WerRegisterRuntimeExceptionModule:
result = WerRegisterRuntimeExceptionModule(@"C:\crash\wer.dll", (nint)ptr);
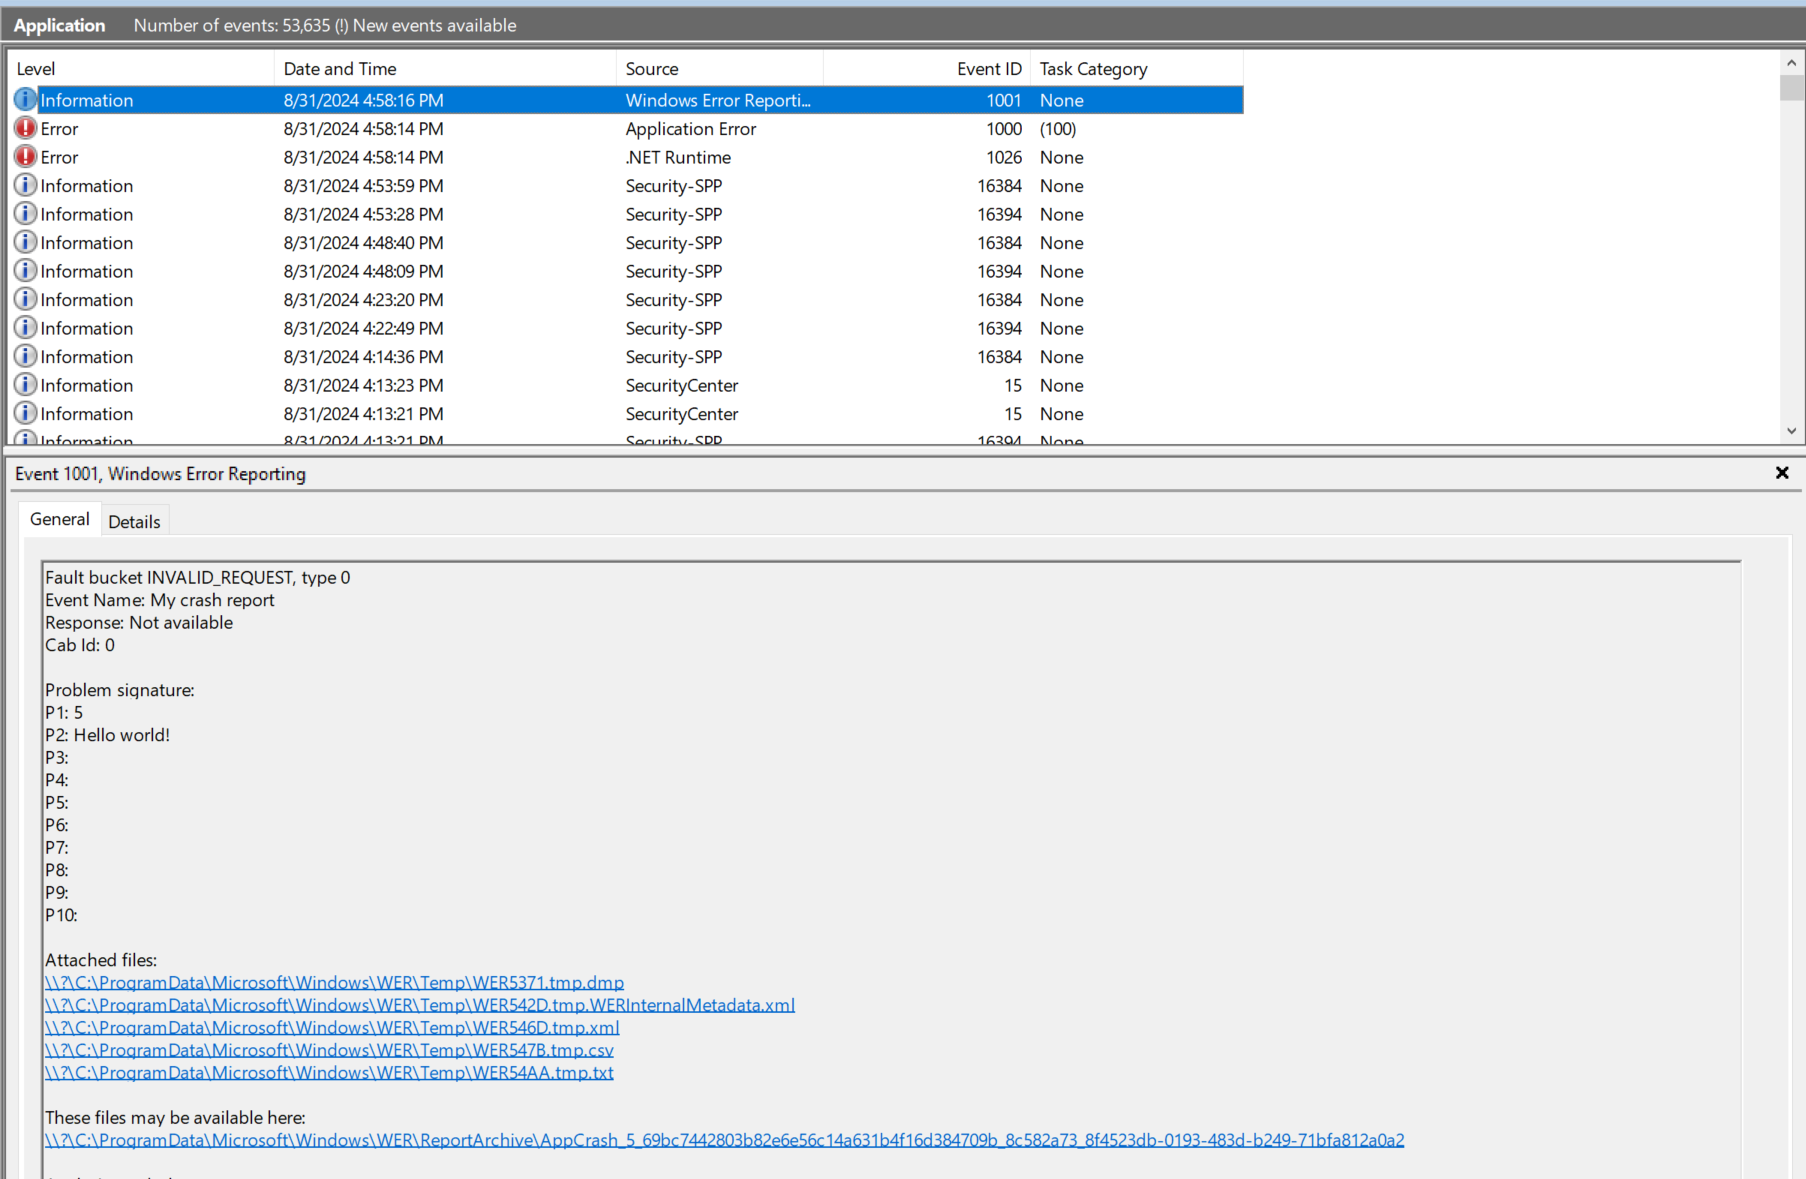
In OutOfProcessExceptionEventCallback, we use ReadProcessMemory to read the payload from the crashing process. We can find a handle to the crashing process in the exceptionInformation argument. If we successfully read the payload, we claim the crash and tell WER that we want to register two fields in the metadata. As a bonus, we give a custom name to our crash report (don’t forget the null terminator!).
private static Payload CrashPayload;

[UnmanagedCallersOnly(EntryPoint = "OutOfProcessExceptionEventCallback")]
private static unsafe int OutOfProcessExceptionEventCallback(nint context, WER_RUNTIME_EXCEPTION_INFORMATION* exceptionInformation, bool* ownershipClaimed, char* eventName, int* size, int* signatureCount)
{
    Debug.WriteLine("OutOfProcessExceptionEventCallback");
    Payload payload = default;

    Debug.WriteLine($"Reading memory at {context:x2}");

    var result = ReadProcessMemory(exceptionInformation->Process, context, &payload, (nuint)sizeof(Payload), out var bytesRead);

    if (result && bytesRead == (nuint)sizeof(Payload))
    {
        CrashPayload = payload; // Store the payload for later use
        Debug.WriteLine($"Payload: {payload.Version} {payload.Status}");
        *ownershipClaimed = true;

        var name = "My crash report\0";
        name.CopyTo(new Span<char>(eventName, *size));
        *size = name.Length;

        *signatureCount = 2;
    }
    else
    {
        Debug.WriteLine($"Failed to read memory: {Marshal.GetLastPInvokeError()}");
    }

    return 0;
}

[DllImport("kernel32.dll", SetLastError = true)]
public static extern unsafe bool ReadProcessMemory(nint hProcess, nint lpBaseAddress, void* lpBuffer, nuint nSize, out nuint lpNumberOfBytesRead);
Because we claimed the crash and set signatureCount to 2, OutOfProcessExceptionEventSignatureCallback will be called two times, once for each field.
[UnmanagedCallersOnly(EntryPoint = "OutOfProcessExceptionEventSignatureCallback")]
private static unsafe int OutOfProcessExceptionEventSignatureCallback(nint context, WER_RUNTIME_EXCEPTION_INFORMATION* exceptionInformation, int index, char* name, int* nameLength, char* value, int* valueLength)
{
    Debug.WriteLine("OutOfProcessExceptionEventSignatureCallback");

    string signatureKey;
    string signatureValue;

    if (index == 0)
    {
        signatureKey = "Version";
        signatureValue = CrashPayload.Version.ToString();
    }
    else if (index == 1)
    {
        signatureKey = "Status";
        signatureValue = new string(CrashPayload.Status);
    }
    else
    {
        return 0;
    }

    (signatureKey + "\0").CopyTo(new Span<char>(name, *nameLength));
    *nameLength = signatureKey.Length + 1;

    (signatureValue + "\0").CopyTo(new Span<char>(value, *valueLength));
    *valueLength = signatureValue.Length + 1;

    return 0;
}
If everything worked, the crash report with the custom metadata will be visible in the event log:
Wrapping it up
This article barely scratches the surface of what is possible to do with WER. This is a great way to automatically collect crash telemetry for your application, WER removes a lot of the complexity by detecting the crash and running your handler in a separate process. Of course, this is only useful for applications deployed to customers. If running in your own environment, you’ll probably want to collect a full memory dump instead, to be sure to have all the required information to diagnose the issue.

.
The last hope: Windows Error Reports
The “Windows Error Report” (WER) is automatically generated by Windows and can be seen in the Eventlog. In most cases, you might see some other — debugging friendlier — event logs. If there is a event log from with the source “.NET Runtime”, then use this first. Windows Error Reports are at first a bit strange to read.

Small, but important hint:
I strongly recommend that you should use some logging libraries inside your application as well.
If you still don’t have a clue where your application breaks or those other event logs are missing the WER can be used to see where the exception is thrown in your .NET application.
Windows Error Report for .NET Apps
A typical Windows Error Report could look like this:
Fault bucket 129047406839, type 5
Event Name: CLR20r3
Response: Not available
Cab Id: 0

Problem signature:
P1: BreakStuff.App.exe
P2: 1.0.0.0
P3: 56eb2416
P4: BreakStuff.App
P5: 1.0.0.0
P6: 56eb2416
P7: 5
P8: a
P9: FatalError
P10:

Attached files:
C:\Users\Robert\AppData\Local\Temp\WERE708.tmp.WERInternalMetadata.xml
C:\Users\Robert\AppData\Local\Temp\WERF4B5.tmp.appcompat.txt
C:\ProgramData\Microsoft\Windows\WER\Temp\WERF4D5.tmp.dmp
C:\Users\Robert\AppData\Local\Temp\WERF65D.tmp.WERDataCollectionFailure.txt
C:\ProgramData\Microsoft\Windows\WER\ReportQueue\AppCrash_BreakStuff.App.e_1952fbbdf8ecceaa6e9af5c44339210849f4774_b2bbc455_cab_7634f669\memory.hdmp
WERGenerationLog.txt
Each P holds some exception location information:
P1: “BreakStuff.App.exe” = App name or host process e.g. your.exe or Outlook.exe for a .NET addin.
P2: “1.0.0.0” = Version of the executabe
P3: “56eb2416” = Timestamp of the executable
P4: “BreakStuff.App” = Faulting assembly and module name
P5: “1.0.0.0” = Version of the faulting module
P6: “56eb2416” = Timestamp of the faulting module
P7: “5” = MethodDef – MethodDef token for the faulting method, after stripping off the high byte. This is the faulting method in your code. Super important!
P8: “a” = IL offset — in hex, in combination with P7 will it show you the exact position of the exception in your method.
P9: “FatalError” = Exception type
P1-P3 should be easy to understand and nothing new to you. If you have a bigger application P4 might lead to the correct namespace/assembly.
Most important to find the real source is P7 & P8 — I will show you how to read it.
P7: Finding the MethodDef token with ILDASM.exe
P7 tells you in which method the exception occurred. The number shown in P7 is the method token, which is the IL representation of your actual method in code. To see the real method name we need a tool.
As far as I know you could try to use WinDbg, but I was too stupid to use it correctly — ildasm.exe does also work for our use case. To get the method token you need “ildasm.exe”, which is included in the .NET SDK, which is part of the Windows SDK.
On a Windows 10 machine, with the SDK installed, you can use this version:
C:\Program Files (x86)\Microsoft SDKs\Windows\v10.0A\bin\NETFX 4.6 Tools\ildasm.exe
For ILDASM it is not important if the actual .NET app is using .NET 4.6 or any other version.
“ildasm.exe” itself is not a beauty, but works. Now open your assembly from P4 with this tool.

To see the tokens, press CTRL + M and search for P7.
In my case I see this:
Method #2 (06000005)
-------------------------------------------------------
	MethodName: ButtonBase_OnClick (06000005)
	Flags     : [Private] [HideBySig] [ReuseSlot]  (00000081)
	RVA       : 0x0000208c
	ImplFlags : [IL] [Managed]  (00000000)
	CallCnvntn: [DEFAULT]
	hasThis
	ReturnType: Void
	2 Arguments
		Argument #1:  Object
		Argument #2:  Class System.Windows.RoutedEventArgs
	2 Parameters
		(1) ParamToken : (08000001) Name : sender flags: [none] (00000000)
		(2) ParamToken : (08000002) Name : e flags: [none] (00000000)
Take a look at the method description: 0600000 5 — the 0600000 is the high byte (whatever that means… — just search for the number, I bet you will find something.)
BigBasti helped me in the comments to describe the high byte:
Big numbers which need more than one byte to store the value have high bytes (most significant bytes) and low bytes (least significant bytes) — you need to know this to make sure you load the sequence of bytes in the correct order. — Thanks!
Ok — now we know the actual method. The exception occurs in the ButtonBase_OnClick method!
P8: Finding the exact position of the faulting code with ILSpy
Now we need to look at the methods IL. You can use ILSpy or any other .NET decompiler (ildasm is not very comfortable, we only used it to get the method name).
If you choosed ILSpy make sure you switch from the C# view to IL view and go to the faulting method:

// Method begins at RVA 0x208c
// Code size 11 (0xb)
.maxstack 8

IL_0000: ldstr "I'm dead!"
IL_0005: call void [mscorlib]System.Environment::FailFast(string)
IL_000a: ret
} // end of method MainWindow::ButtonBase_OnClick
As you might remember — P8 pointed to “a”, which is the IL_000a instruction.
Mission accomplished: Exception source found! Yay!
Big picture
I never thought I had to read the internal IL, but we had one weird case where no log files were generated and we used this trick to get to the source of the exception.

My breaking Sample Code on GitHub
Hope this helps!
When an application crashes, the Windows Error Reporting utility will begin to send debugging information to Microsoft. You can choose whether to send this information or not, but Windows will prompt you if you don’t want to. It will send your IP address to a Microsoft server. The privacy statement also claims that this information is only used to generate aggregate statistics. However, you might want to disable the advanced error reporting functionality for privacy reasons.
The Windows Action Center contains a list of crash reports. You can find this tool under System, Security, Maintenance, and Control Panel. The error reporting toolset is a comprehensive collection of crash logs that provide detailed information on the cause of a system crash. Most error reports are categorized by call stacks, which allows developers to quickly diagnose the cause of an issue. Regardless of the cause, these reports can be helpful for troubleshooting.
When your computer encounters an error, it may be in the form of a file called a Windows error report. This file can contain vital information about your system, such as a crash or a failed task. You can read the contents of a Windows error report file, or you can delete it, depending on your preference. If you need to see your personal information in the Windows error report file, you must follow the guidelines set forth by Microsoft.
The Windows Error Reporting toolkit provides access to crash data and helps administrators diagnose the root cause of system crashes. These files are stored in different locations in the Windows system. You can open them with the WIN+R keyboard shortcut or by tapping on the service icon in the Start menu. If you want to view your Windows error reporting files, you can click on the “Custom” option under Windows Logs and events. Once you have the custom view, you can quickly scan the crash log by selecting a specific time period.
How Do I Read Windows Errors?
Several tools exist in Windows that let you examine the activity logs on your computer. The Event Viewer is one such tool. By clicking on the “Event Viewer” icon in the Start menu, you can open the logs of various system and application events. You can also select the “Save all events” option to export all the logs. This is an excellent way to keep an eye on what is going on with your computer.
The Event Viewer is a tool that lets you view logs of all the events that occur on your computer. This tool records important events such as the logon attempts, access to resources, and much more. You can also open this log with Notepad and view the information inside. If you are unsure about the cause of your computer’s problems, you can try using the Event Viewer to diagnose and repair the issue.
Does Windows Error Reporting Do Anything?
If you’re wondering whether Windows error reporting is useful, you can easily disable it. To disable it, open the Control Panel and navigate to Security and Maintenance. In the Security and Maintenance window, find the link Problem Reporting settings. In the Related settings section, click the Disabled checkbox and click OK to close the dialog box. Now, your computer will stop reporting error messages. You’ve effectively disabled Windows error reporting.
What does Windows Error Reporting actually do? The service collects important information about crashes in Windows and delivers it to Microsoft for analysis. It also generates a “bucket signature” file that identifies the crash. Microsoft then uses this information to update its software and deliver fixes to users. However, because of the privacy concerns that this data poses, you can’t trust Windows Error Reporting.
Once the Windows Error Reporting service has started reporting errors, you can disable it altogether. You can also disable it by selecting ‘Ask me before I check for solutions’. If you’re concerned about the privacy implications of such information, you can always choose to disable it. Otherwise, you can disable the service completely by using the Windows Registry Editor. Then, restart the computer.
Is Windows Problem Reporting a Virus?
Error reporting is a service in Windows that sends information about errors that occur on the computer to Microsoft servers. This information is used to prioritize bug fixes for users. In the past, it has been used by the NSA and other government agencies to gather detailed information and exploit a system. However, there is concern over the use of this service. Users should avoid clicking the “report” button and instead disable it to prevent the system from sending reports without user consent.
To disable error reporting in Windows, open the Action Center and click the Change Action Center settings link. You can also click the flag icon in the system tray to access this menu. To disable the feature, click the option that says “Never check for solutions.” Once you disable this option, you will not receive any error reporting messages from Windows. If you have a virus or other malicious software, disable your antivirus application before trying to disable this service.
How Do You Find Out What Crashed My Computer?
There are two ways to identify the cause of a crash. The first is to open the Task Manager by pressing Ctrl, Shift, and Esc shortcut keys together. The second way is to open the process in question and use the context menu to see the processes it must end before responding. The details will help you determine whether the process is the culprit or not. If you have to perform both of these tasks, you’ll need to download special software for Windows.
The first way to determine the cause of a crash is to use a software utility called WinDbg Preview. Download this software from the Microsoft Store and install it. Once you’ve done so, you can view crash files and find out the exact reason for the crash. Unlike a black screen error, which can indicate a hardware failure, BSoD is more recoverable. In some cases, the crash is caused by a corrupt Windows update, driver error, or some other program failure.
How Does Event Viewer Diagnose a Crash?
The event ID is a unique number for each application. For example, Event ID 122 means a nonsense error. While you may have encountered this error before, you should only use Event Viewer to diagnose known problems. This way, you will not waste your time searching for the wrong error in the Event Viewer. This program can be used to troubleshoot the problem, if you know exactly what it is.
You can also create a custom view in Event Viewer. This will enable you to quickly view crash logs. You can select the date range you want to view and the logs you wish to analyze. You can also save your settings so you can easily navigate between them. This tool is great for diagnosing recurring problems. You can also use this tool to track system errors. By default, it only displays Critical events.
The next step is to access the advanced system settings on your computer. To do so, press the Windows logo key to open the Run dialog box. Type advanced into the search box in the upper right corner of the window. Next, select Advanced, then click the View advanced system settings option. You will see a section called Startup and Recovery. If you see a crash, click on it and open it up.
How Do I View the Error Log?
To view a Windows error reporting log, you need to have administrative rights on your computer. You can access it from the Run command, or you can use the Power Menu to open Windows Control Panel. Another way to access this log is by using the Windows Run command. Then, navigate to the Windows Error Logs and click on the “Event Viewer” tab. You should see a list of logs containing the error message.
You can find various types of errors in the Windows error reporting log, including system crashes, hardware and software problems, and security events. The Application Logs are found under Windows Logs. While the System logs are stored in the same place as the Application log, they contain information about the shutdown error and other problems. Once you have accessed the logs, you can export them to the Desktop for further analysis. You can then use the information found in these windows logs to fix problems on your PC.
You can also find the underlying cause of a problem by examining the Windows error log. You can filter logs and create custom views by using various techniques. In addition to filtering logs, you can even create log files with specific information. However, you should note that the Event Viewer is not always sufficient to handle all error logs in Windows. If you are not familiar with the log format, you can refer to a reference guide to help you interpret the data in the log.
Learn More Here:
1.) Windows Help Center
2.) Windows – Wikipedia
3.) Windows Blog
4.) Windows Central