
1. Introduction
In this blog post, I will describe how to set up an environment for kernel debugging in Windows and provide a WinDbg command cheatsheet.
I will reference some commands in subsequent posts to avoid repeating explanations.
When it comes to kernel debugging, it is crucial to understand that when a breakpoint is reached during the debugging process of an operating system, the entire OS freezes. Consequently, it becomes impossible to utilize a debugger within the same OS environment. Instead, a separate system is required, which connects remotely to the target OS undergoing debugging. This setup enables communication between the debugger and the target OS, ensuring that when execution is paused, your current OS remains unaffected.
2. Configuring your VM (debugee)
I am using VMware Workstation but other hypervisors should have similar options.
Kernel debugging with network communication (Recommended)
2.1. Install a Windows VM and create a snapshot of its clean state
2.2. Make sure the VM is using NAT networking
2.3. Find your Host OS IP address
2.4. Run the following powershell command in the VM and check the output for the VMs network interface
Get-NetAdapterHardwareInfo -InterfaceDescription * | select Name, InterfaceDescription, DeviceType, Busnumber, Devicenumber, Functionnumber | FL
// Example output
Name                 : Wi-Fi
InterfaceDescription : Qualcomm Atheros QCA61x4A Wireless Network Adapter
DeviceType           : PCI Express treated as PCI
Busnumber            : 8
Devicenumber         : 0
Functionnumber       : 0
2.5. Start the VM and run the following commands in CMD as an Administrator
bcdedit /debug on
bcdedit /dbgsettings net hostip:w.x.y.z port:50001 key:1.2.3.4
2.6. In the same Admin CMD run the command below substituting b.d.f with the values from the powershell output
bcdedit /set "{dbgsettings}" busparams b.d.f
// Example command
bcdedit /set "{dbgsettings}" busparams 8.0.0
Kernel debugging with named pipes for communication (Slow)
2.1. Install a Windows VM and create a snapshot of its clean state
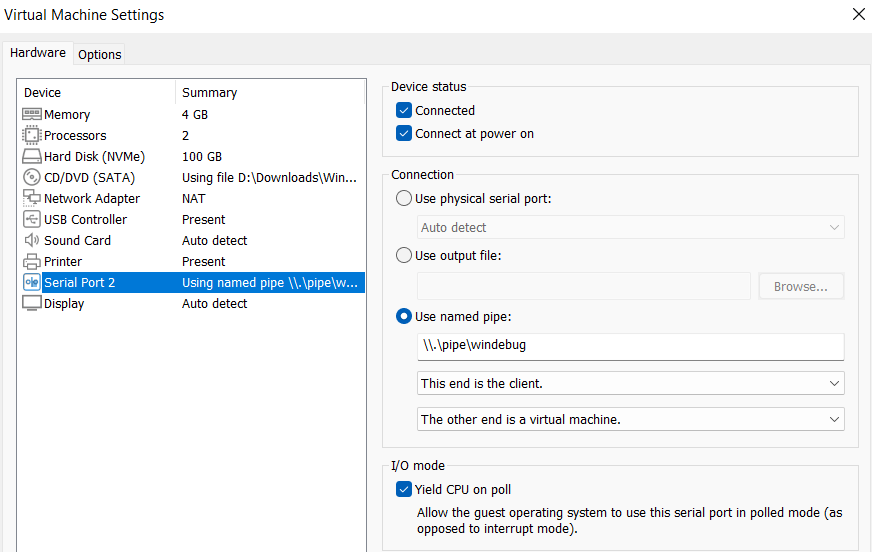
2.2. In VMware from the VM settings add a new Serial Port from Hardware > Add > Serial Port
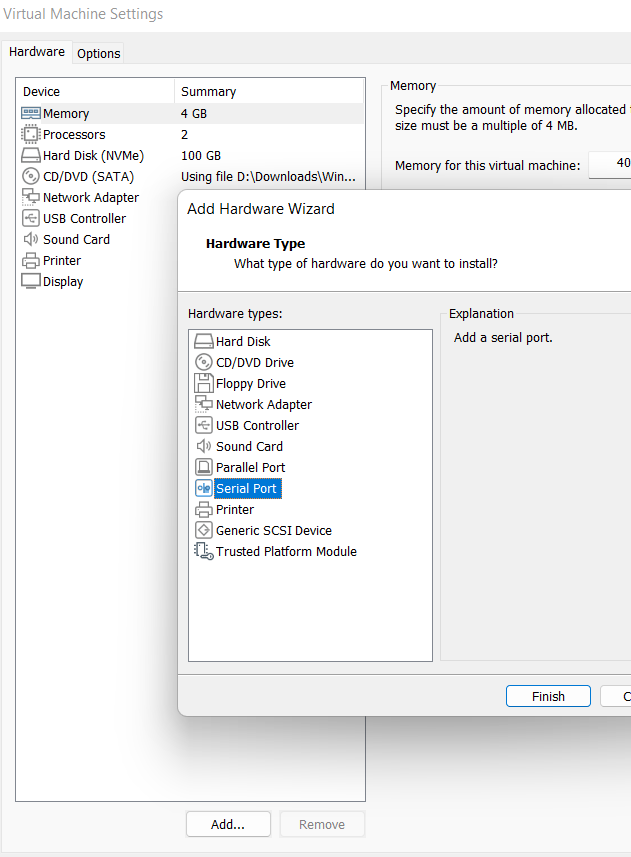
2.3. In the Serial Port configuration set the connection to use named pipe and choose a name for the pipe like \\.\pipe\windebug
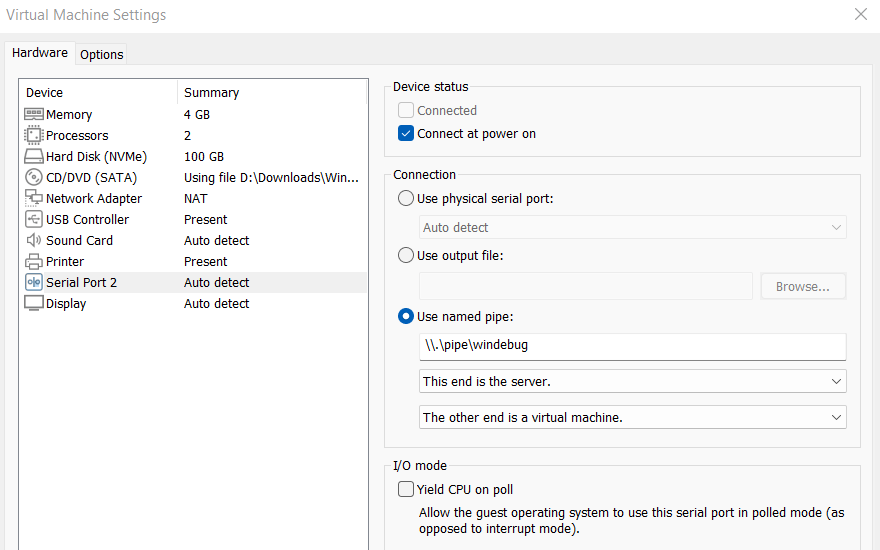
2.4. Take a note of the Serial Port number as you’ll need it later. In this case it’s 2
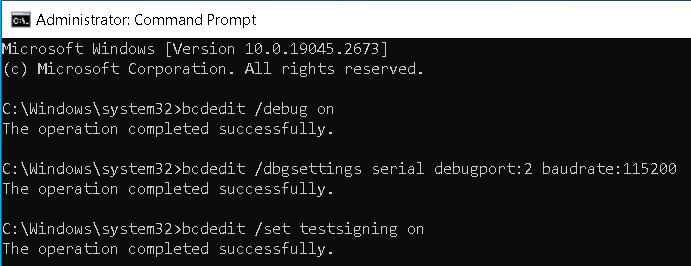
2.5. Start the VM and run the following commands in CMD as an Administrator
The debugport is the Serial Port number we saw from the VM settings.
bcdedit /debug on
bcdedit /dbgsettings serial debugport:2 baudrate:115200
The first command enables debugging in the boot configuration.
The second command specifies how the OS will communicate with the debugger.
If you plan to test your own drivers you can also execute:
bcdedit /set testsigning on
And if you want to disable driver integrity checks completely:
bcdedit /set nointegritychecks on
2.6 Power off the VM and create another snapshot
3. Configuring your dev/debugger environment
3.1. Install latest Visual Studio with the Desktop development with C++ workload
3.2. Install Windows 11 SDK
3.3. Install Windows 11 WDK
3.4. If WDK installation prompts you to install Visual Studio extension — agree and install it.
For all above-mentioned steps, head over to the following page and follow the steps:
https://learn.microsoft.com/en-us/windows-hardware/drivers/download-the-wdk
3.5.1. Go to this page to download and install the newest Windbg
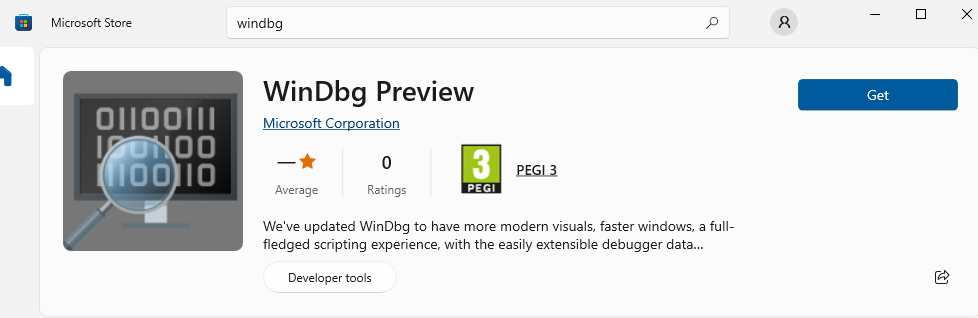
3.5.2. Another way is to go to the Windows store and install “Windbg Preview”, but this version won’t be supported anymore
This is the new Windbg with modern GUI and new features
3.6.1. If using network communication, go to File > Attach to kernel > Net and fill in the key and port number
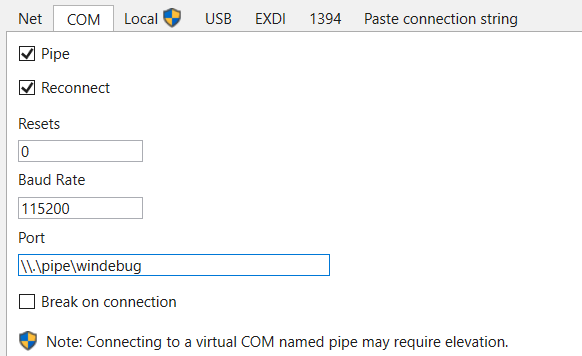
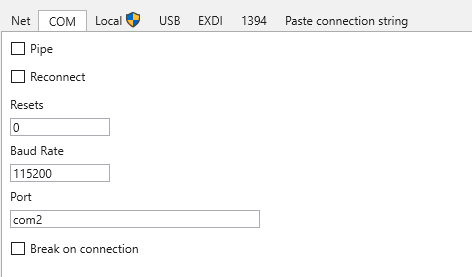
3.6.2. If using named pipes, go to File > Attach to kernel > COM, fill in the pipe name we chose for the Serial Port in the port filed and the same Baud Rate
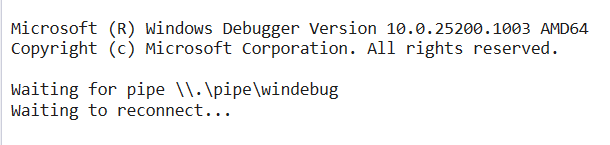
3.7. Click OK and Windbg should start waiting for connection
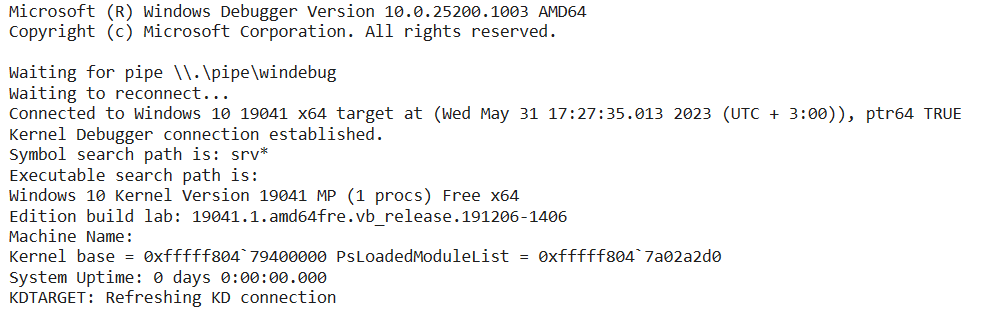
3.8. Start your VM and your debugger should connect
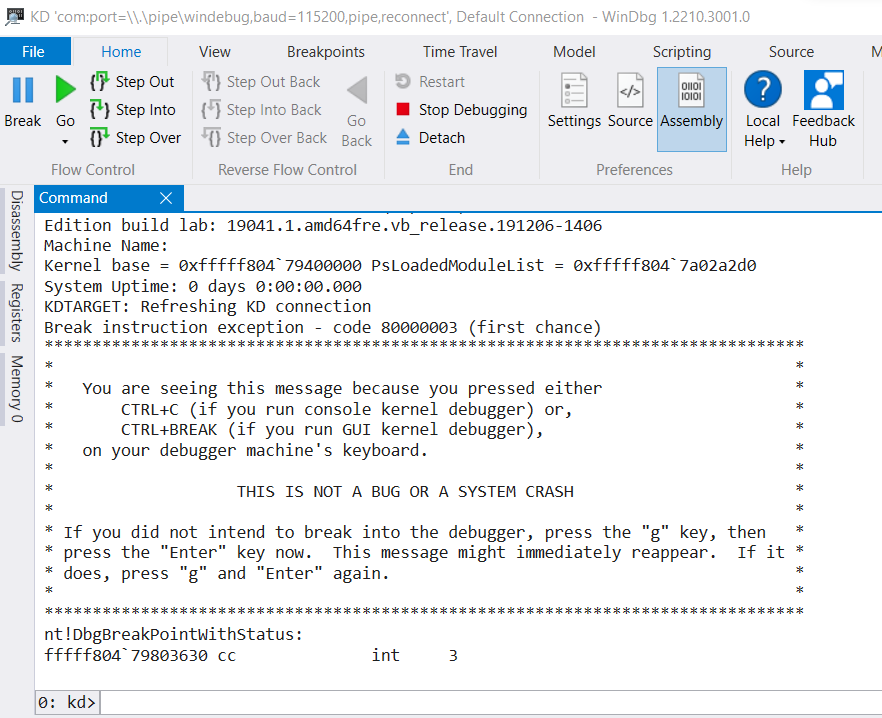
3.9. If you press the Break button, the debugger will break execution of the OS and you’ll be able to issue windbg commands
3.10. If your debugger environmnet is also in a VM, and you want to configure kernel debugging between two VMs you’ll need the same Serial Port VM settings for the debugger VM but with minor differences.
Set the Serial Port as client.
Run Windbg with default COM settings, but specifying the COM port number as the Serial Port number.
4. Windbg initial steps
After connecting to the debugged kernel, the first commands which are useful to use in windbg are:
!sym noisy // makes the symbol loading more verbose. Helps to troubleshoot any problems with the symbol loading
.symfix    // automatically sets the symbol path to point to the Microsoft symbol store
.reload    // deletes all symbol information and reloads the symbols as needed
5. Windbg command cheatsheet
Windbg has a lot of commands. Here I will list only those which might be useful for these blog posts.
Windbg commands can be separated in 3 categories:
- Regular commands (dd, dt, x). Used for debugging
- Meta (dot) commands. They are used to control the behavior of the debugger
- Extension commands. They start with ! (!analyze, !peb, !teb). Implemented as functions part of extension DLLs.
To abort long-running comand use Break button or Ctrl+Break.

Virtual pseudo-registers provided by windbg start with dollar sign $:
$ra - return addrs on stack
$ip - instruction pointer
$peb - address of PEB
$teb - address of TEB

Referencing registers in an expression should be preceded with @ sign.
eax is the same as @eax
@peb is the same as @$peb

poi(<addr/symbol>) - dereference a pointer
Each symbol is treated as an address (the value of a symbol is its memory address).
To get the value of the symbol held at its address it has to be dereferenced.

? - display regular commands
.help - display dot commands
.help a* - display dot commands starting with a
? <expression> - evaluate an expression
? 5+5
!Ext.help - list general extensions

ld <modulename> - load symbols for module
ld kernel32

x Module!Symbol - Examine symbols
x /t Module!Symbol - also show data type
x /v Module!Symbol - verbose (show type and size)
x *! - list all modules
x ntdll!*  - list all symbols of ntdll
x kernel23!*LoadLibrary* - list all symbols containing LoadLibrary

ln <address> - list symbols near that address. Also displays their addresses

lm[Option] - list modules
   v - verbose
   l - with symbols
   k - only kernel symbols
   u - only user symbols
   f - show image path
   m [pattern]

lm - list all loaded and unloaded modules, and their addresses
lmv m kernel32 - show information about kernel32 module
lm m nt - show information about the kernel (ntoskrnl.exe) module

!lmi - detailed info about a module
!lmi kernel32

!dh <address> - display PE headers at address
!dh -f <address> - file headers only
!dh -s <address> - section headers only
!dh -e <address> - exported functions

r - dump all registers
r eax, ebx,... - dump only specific registers
r $peb - dump address of PEB ($peb is pseudo-register)
r $teb - dump address of PEB ($peb is pseudo-register)

!peb - display formatted view of the PEB
!teb - display formatted view of the TEB

dt [Module!]SymbolName - dump variable info (local variable, function parameter, global variable or data type)
dt [Module!]Sym* - list symbols starting with Sym
dt [Module!]SymbolName -v - verbose (address and type)
dt ntdll!_PEB - show the PEB structure
dt ntdll!_PEB <address> - dump PEB structure found at specified address
dt ntdll!_PEB @$peb - dump PEB of current process
dt nt!_EPROCESS
dt nt!_EPROCESS poi(nt!PsInitialSystemProcess)
dt nt!_ex_fast_ref poi(PsInitialSystemProcess)+4b8

!address <address> - display information about the memory at the specified address
!address esp

d* <address> - display memory at address
db - byte
dw - word
dW - word + ascii
dd - dword
dc - dword + ascii
dq - qword
da - ascii
du - unicode
db <addr> - display 1 byte at specified address
dd <addr> L3 - display 3 dwords

dyb <addr> - binary + byte
dyd <addr> - bynary + dword

d*s <address> - display words and symbols at address; Address is assumed to be a series of addresses in symbol table
dds - dwords
dqs - qwords
ddp - display referenced memory

dx - Display C\C++ Expression
dx @$systemProc = *(nt!_EPROCESS**)&nt!PsInitialSystemProcess  - dereference and cast PsInitialSystemProcess as EPROCESS structure
dx (char*)@$systemProc->ImageFileName  - print ImageFileName field from systemProc structure

uf <address> - unassemble function
uf /c <address> - show only function calls
u <address> L300 - unassemble and limit to 300 assembly instructions

!process 0 <Flags> [ImageName] - list information about process
!process 0 0 - list all processes
!process 0 0 cmd.exe - show information about process cmd.exe
!process -1 0 - current process context
!process 0 1 cmd.exe - get more inforation about the process cmd.exe (including token address)
!process 0 1 system - get information about the system process

.process /i /p <address> - change context to the process at <address>

!token <address> - info about process token

!pte <VA> - convert Virtual Address to Physical Address

!vtop <DirectoryTableBase> <VirtualAddress> - translate VA to Physical address. Needs to be in the context of a process. Lowest 3 nibbles of DirectoryTableBase need to be zeroed-out

rdmsr <msr index> - read the value of MSR register

s -[option] <start_addr> <end_addr> <data_to_search> - search in memory
s -b - search bytes
s -a - search ascii
s-b <start addr> <endaddr> 4d 5a 90 00 - search MZ in a region
s -a @rsp L10000000 "B7"

Useful NTOSKRNL Symbols
nt!PsInitialSystemProcess - SYSTEM EPROCESS pointer
nt!PsLoadedModuleList - Loaded modules in kernel (_LIST_ENTRY)
nt!PspNotifyEnableMask - Flag which can disable kernel notify routines
5. References
- http://windbg.info/doc/1-common-cmds.html
- http://windbg.info/download/doc/pdf/WinDbg_A_to_Z_color.pdf
- https://github.com/hugsy/defcon_27_windbg_workshop/blob/master/windbg_cheatsheet.md
- https://github.com/repnz/windbg-cheat-sheet
- https://github.com/alex-ilgayev/windbg-kernel-debug-cheat-sheet
- https://juniper.github.io/contrail-windows-docs/For%20developers/Debugging/Kernel_Debugging/
- https://learn.microsoft.com/en-us/windows-hardware/drivers/debugger/setting-up-a-network-debugging-connection
- https://learn.microsoft.com/en-us/windows-hardware/drivers/debugger/
Provide feedback
Saved searches
Use saved searches to filter your results more quickly
Sign up
Recently when I was trying to debug a malicious Windows driver and I had to setup kernel debugging environment, there were various tutorial I found using various configuration VMware, network based. But I wanted something quick and dirty which is what my setup is.
In this post we will create a kernel debugging environment for Windows 7. To do Kernel debugging you need two machines, one is the machine from which you will issue the debugging command and other machine which is been debugged. I will be talking about very specific setting i.e. two Windows 7 virtual machine in VirtualBox and the host will be Linux. You need to install WinDbg in the debugger machine.
#Basic terminology
Since we are dealing with multiple machines we need to clear about their roles, which are as follows:
- Debugger Machine: Virtual machine with the standard version of Windows 7 that has WinDbg installed
- Debuggee Machine: Virtual machine with the Windows 7 Debug Checked build, following section shows you how to do that.
- Host Machine: Machine running the virtual machines, it could be Windows or Linux.
#Setting up the Debuggee
#Making the Boot Entry
There are some setting which needed to be done to make it kernel debuggeable. Start the command prompt with Administrator privilege otherwise you will get permission error, then execute the following command :
- Create Boot entry, there is a unique UUID for each Boot entry, you will need the newly created boot ID in the next few commands, so copy it.
1 |
C:\> bcdedit /copy {current} /d "Windows 7 with kernel debug via COM" |
- Turning on the debugger
1 |
C:\> bcdedit /debug {UUID-RETURNED-BY-FIRST-COMMAND} ON |
- Setting up the Baud rate and the COM port number to use
1 |
C:\> bcdedit /dbgsettings serial debugport:1 baudrate:115200 |
- Setting up the debug type as Serial COM port
1 |
C:\> bcdedit /set {UUID-RETURNED-BY-FIRST-COMMAND} DEBUGTYPE SERIAL |
-
Verify the settings : once you have done above configuration. Type
bcdeditcommand to get the list of all boot configuration. One of those several entry you should be able to see the settings as shown below.
To verify the port and baudrate setting issue
bcdedit /dbgsettingscommand which should give you following output.
-
Power down this machine


#VirtualBox Setting
Go to the setting of the VirtualBox Manager, click Settings -> Serial Ports -> Port 1.
- Check enable serial port.
- Port Number: COM1
- Port Mode: Host Pipe
- DO NOT CHECK connect to existing pipe/socket
- Port/Address: this is the path of the pipename where the file will be created, this value depends upon the host OS which is as follows
| OS | Value (pipename) |
|---|---|
| Windows | \.\pipe\pipename |
| Linux | /tmp/pipename |
the above settings should look something like this in VirtualBox.

#Setting up the Debugger
Go to the setting of the VirtualBox Manager, click Settings -> Serial Ports -> Port 1.
- Check enable serial port.
- Port Number: COM1
- Port Mode: Host Pipe
- CHECK connect to existing pipe/socket.
- Port/Address: this is the path of the pipename where the file will be created, this value depends upon the host OS which is as follows
| OS | Value (pipename) |
|---|---|
| Windows | \.\pipe\pipename |
| Linux | /tmp/pipename |
the above settings should look something like this in VirtualBox.

#Networking configuration
Network settings are also important, all the machines(Host and Guests) should be able to ping each other. For this setting you can use Host-only adapter which allows all the VM machine and the Host machines to communicate with each other, but not to external network, consequently there will be no internet access on guest machines. On the Debugger Machine you will need will need internet to download the Kernel symbols, to fix this you can add additional network adapter with NAT enabled, this should give you internet access.
#Start the Debugger Machine
First start the debugger machine, this will create the named serial port (pipename file). Debugger machine should be started first or else you will get error when starting the debuggee machine.
- Run WinDbg (GUI works fine, command line isn’t needed)
- Go to File -> Kernel Debug -> COM.
- configure the settings as shown below
- It should say Opened \.\com1 Waiting to reconnect…
#Starting the Debugee Machine
- Once you debugger has started and your WinDBG is setup with the kernel com port setting start the debuggee machine. Once you bootup the machine you should see the below boot menu.
boot with the debugging enabled option.
- If the debuggee machine is connect to the debugger machine it will boot extremely slowly and stop on the “Starting Windows” screen.
- WinDbg on the debugger machine should be connected at this point.
- When you get the message that says “Break repeatedly, break Once, Ignore, terminate Process, or terminate Thread.”
- Give WinDbg the command “g” and windows should continue to boot.

#Trouble shooting tips
#Verifing the Networking configuration
Network settings are also important, all the machines(Host and Guests) should be able to ping each other. For this setting you can use Host-only adapter which allows all the VM machine and the Host machines to communicate with each other, but not to external network, consequently there will be no internet access on guest machines. On the Debugger Machine you will need will need internet to download the Kernel symbols, to fix this you can add additional network adapter with NAT enabled, this should give you internet access.
#Verifing the Serial Port Settings
If you are facing issues with debuggee not connecting to the debugger then you can verify if there Serial port setting enabled on the machine. Go to Device Manager and check if there is serial port. If you can’t set the COM Port driver as below then you need to get it fixed somehow.

Introduction: How to Setup a Windows Kernel Debugger Over Your Network
Debugging is a popular tool used to get to the root cause of a bug. A bug can maninfest itself in many different ways. it can cause a system crash (blue screen/BSOD), it can cause an application crash, it can cause your system to freeze to name a few issues. The root cause can be in the OS, a device driver or even a hardware issue. This guide will provide details on how to setup a debugger using Debugging Tools For Windows and hence is only focused on debugging with the Windows OS. I will not go into how to analyze the issue captured in the debugger.
A couple things to take note of:
- This instruction set is designed for advanced computer users and the author has assumed that with these instructions.
- For privacy sake some information has been obscured.
First thing we will go over are the items you’ll need to setup your debugger.
Step 1: What You’ll Need
What You’ll Need
- 2 Windows Computers
- The Host computer which you’ll use for debugging. This computer must have Windows XP or newer installed
- The Target computer which you’ll be debugging. This computer must have Windows 8 or newer installed. It must also have one of the network adapters found in the list here. http://msdn.microsoft.com/en-us/library/windows/h…
- 1 Network Switch/Router (something that will assign IP addresses to the computers on the network)
- 2 Cat5 cables
- Debugging Tools for Windows which you need to install on the Host computer (http://msdn.microsoft.com/en-US/windows/desktop/bg162891)
Next we will go over what you’ll need to do to set your computers up.
Step 2: Preparing Your Computers
The Host Computer
- For the computer you’ll be debugging on you’ll need to install Debugging Tools for Windows which can be found here…
- http://msdn.microsoft.com/en-US/windows/desktop/bg…
- Connect the computer to your Switch/Router
The Target Computer
- Make sure you are using Windows 8 or newer
- Make sure you are using a network adapter from this list http://msdn.microsoft.com/en-us/library/windows/hardware/dn337009(v=vs.85).aspx
- Connect the computer to your Switch/Router
Now that we have the computers setup we’ll need to connect them, starting with the target computer.
Step 3: Setting Up the Target Computer
You need a couple things to get your target computer ready. You need the IP address of your Host computer. You can obtain this by using the ping tool. Here is how to do this…
- Open a command prompt
- Type «ping -4 HostComputerName.» You’ll get something like the following…
ping HostComputerName
Pinging HostComputerName [192.166.0.123] with 32 bytes of data:
Reply from 192.166.0.123: bytes=32 time=2268ms TTL=128
Reply from 192.166.0.123: bytes=32 time=10ms TTL=128
Reply from 192.166.0.123: bytes=32 time=19ms TTL=128
Reply from 192.166.0.123: bytes=32 time=1ms TTL=128Ping statistics for 192.166.0.123:
Packets: Sent = 4, Received = 4, Lost = 0 (0% loss),
Approximate round trip times in milli-seconds:
Minimum = 1ms, Maximum = 2268ms, Average = 574ms
*Keep this windows open. You’ll need it later.
Next you need to make some changes to the boot configuration. The changes to your boot configuration file will tell your target computer how to connect to the host computer. In order to do this you’ll need to open a command prompt with administrator (elevated) permissions. Here is how you do that.
- Right click on the command prompt on the taskbar
- Right click on command prompt again
- Click «Run As Administrator» (User Account Control will ask if you would like to allow this program to make changes on your computer, click Yes)
Now you need to set the boot configuration settings for network debugging. You will do this by using the bcdedit tool. This tool is built into the OS and can be run from any elevated command prompt. The following steps show how you make these setting changes
- In this new command window run the following…
- bcdedit /dbgsettings net hostip=192.166.0.123 port=XXXXX key=z.z.z.z
- where the hostip equals the IP address you obtained when you ran the ping command, XXXXX equals any number between 50000 and 50099, and z is any alphanumeric combination. Here is an example …
bcdedit /dbgsettings net hostip=192.166.0.123 port:50002 key=a1b.2c3.d4e.5f6
Remember the key that you created. You’ll need this when you set up your host computer.
Now you need to turn the debugger on. You can use the same elevated command prompt that you were using before or open a new one. To turn debugging on run the following bcdedit command
- bcdedit /debug on
- restart the computer
Please reference the picture above which shows examples of all of the commands in this step.
Now that we have the target computer set up we can prepare the host computer to look for our target computer on the network.
Step 4: Setting Up the Host Computer
If you haven’t already, the first thing you should do on the host computer is install «Debugging Tools For Windows» (http://msdn.microsoft.com/en-US/windows/desktop/bg… which was provided in an earlier step. Once this is installed you may proceed to the following steps.
To use the debugger from the command prompt.
- Open an elevated command prompt window
- Browse to the Debuggers directory where you installed the debugger. The default location looks like this. C:\Program Files (x86)\Windows Kits\8.0\Debuggers\
- If your host computer is running a 64 bit operating system, change directory to the x64 directory. If you are running a 32bit operating system on your host computer, change directory to the x86 directory.
- Type in the following command. kd — k net:port=XXXXX,key=z.z.z.z (Where XXXXX is the port you set on the target computer and z.z.z.z is the key you set on the target computer)
- Hit Enter
To run the debugger using windbg.
- run windbg from the directory you installed the debugger from. The default location looks like this. C:\Program Files (x86)\Windows Kits\8.0\Debuggers\.
- If your host computer is running a 64 bit operating system, change directory to the x64 directory. If you are running a 32bit operating system on your host computer, change directory to the x86 directory.
- Double click on windbg.exe
- Click on File
- Click Kernel Debug
- Select the Net tab
- Enter the port number you set on the target computer
- Enter the key you set on the target computer.
- Hit Okay
Please reference the pictures above which shows examples of all of the commands in this step.
Now that we have the host and target computers set up we can connect the two.
Step 5: Connecting to the Debugger
If everything is set up correctly this part is really easy. In fact after you set up the host computer you may have noticed a lot of text appear in the window. If so, you are done. If not, all you need to do is restart the target computer. As the target computer boots you’ll start to see a stream of text in your debugging window (kd or windbg depending on which you use) on the host computer. It will looks something like the pictures above.
Step 6: In Conclusion
Now that you have successfully connected your computers with a debugger you can begin to help solve all the worlds computer problems. This is only the first step in a long road to getting to the root cause of any computer issue. Look for more articles in the future where I tackle how to begin investigating the many different problems that you may encounter.
TL;DR; This blog post comes from an on-site pentest I did a long time ago. While waiting for some other testing to complete the customer was interested to see if I could get code execution on one of their Windows workstations (the reasons for this request are unimportant). Needless to say I had physical access to the workstation so it should be pretty simple thing to achieve. The solution I came up with abused the default Windows Kernel Debugging settings to get arbitrary code execution without needing to permanently modify the system configuration or open the case.
The advantage of this technique is it requires a minimum amount of kit which you could bring with you on a job, just in case. However it does require that the target has an enabled COM1 serial port which isn’t necessarily guaranteed, and the machine cannot be using TPM enforced Bitlocker or similar.
And before anyone complains I’m fully aware that physical access typically means that you’ve already won, this is why I’m not claiming this is some sort of world ending vulnerability against Windows machines. It’s not, but it’s a common default configuration which administrators probably don’t know to change. It also looks pretty awesome if the stars line up, let’s face it, from a customer’s perspective it makes you look like some bad-ass hacker. Bonus points for using the command line CDB instead of WinDBG 
With that said, let’s look at it in more detail.
You find yourself in a room filled with Windows workstations (hopefully legally) and you’re tasked with getting code execution on one of them. Your immediate thoughts to achieve this might be one or more of the following:
- Change boot settings to boot off a CD/USB device and modify HDD
- Crack open the case, pull the HDD, modify contents and put it back in.
- Abuse Firewire DMA access to read/write memory.
- Abuse the network connection coming out the back of the machine, either to try and PXE boot or MitM network/domain traffic on the machine.
Looking at the workstation though booting up you notice that the boot order is configured to boot off the HDD first but a BIOS password prevents you circumventing it (assuming no bug in the BIOS). The case actually has a physical lock on it, probably not something you couldn’t pick or crowbar but the customer probably wouldn’t be amused if I left the workstation in bits. And finally the workstation didn’t have Firewire or any external PCI bus to speak of to perform DMA attacks. I didn’t test the network connection, but it might not be easy to PXE boot or MitM’ing the traffic might encounter IPSec.
What these workstations did have though was a classic 9 pin serial port. This got me thinking, I knew that by default Windows configured kernel debugging on COM1, however kernel debugging isn’t enabled. Was there a way of enabling kernel debugging on a system without having administrator login rights? Turns out that yes there is, so lets see how you could exploit this scenario.
Coming Prepared
Before you can exploit this feature you’ll need a few things to hand:
- A serial port on your test machine (this is pretty obvious of course). A USB to Serial is sufficient with the right drivers
- A local installation of Windows. This is more for simplicity, perhaps there’s tools to do Windows Kernel Debugging available these days for Linux/macOS which support everything you need but I doubt it.
- Assuming you’re using Windows an installation of Debugging Tools for Windows, specifically WinDBG.
- A Null Modem cable, you’ll need this to connect your test machine’s serial port to the workstation serial port.
Now on your test machine ensure everything is installed and setup WinDBG to use your local COM port for kernel debugging. Using kernel debugging just requires you to open WinDBG then from the menu select File -> Kernel Debug or press CTRL + K. You should see a dialog which looks like the following:

Fill in the Port field to match the COM port your USB to Serial adapter was assigned. You shouldn’t need to change the Baud Rate as the Windows default is for 115200. You can verify this on another system using an administrator command prompt and running the command bcdedit /dbgsettings.

You could also do this via the following command line if you’re so inclined: windbg -k
com:port=COMX,baud=115200
Enabling Kernel Debugging on Windows 7
Enabling kernel debugging on Windows 7 is really easy (this should also work on Vista, but really who uses that anymore?). Reboot the workstation and after the BIOS POST screen has completed mash (the official technical term) the F8 key. If successful you’ll be greeted with the following screen:

Scroll down with the cursor keys, select Debugging Mode and hit Enter. Windows should start to boot. Hopefully if you look at WinDBG you should now see the boot information being displayed (full disclosure, I’m doing this using a VM ;-)).

If this doesn’t happen it’s possible that the COM port’s disabled, the kernel debugging configuration has changed or you’ve got a terrible USB to Serial adapter.
Enabling Kernel Debugging on Windows 8-10
So moving on to more modern versions of Windows, you can try the F8 trick again, but don’t be shocked when it does NOTHING. This was an intentional change Microsoft has made to boot process since Windows 8. With the prevalence of SSDs and various changes to Windows’ boot process there’s no longer enough time (in their opinion) for mashing the F8 key. Instead, while the option to enable kernel debugging is still present you need to configure it through the fancy UEFI alike menus.
This presents us with a problem. We’re assuming we don’t have access to the BIOS (through say a password) so it would seem we couldn’t access the UEFI configuration options and the main way you can configure this is going through the Settings App (at least on Windows 10) and choose to restart into Advanced Startup mode or you can pass the /r /o options to shutdown in the command prompt.

None of these options are going to help us. Fortunately there’s a «documented’ alternative way, if you hold the Shift key when selecting Restart from the start menu it will also reboot into the advanced startup options mode. This doesn’t immediately sound like it’s going to help you any more than the other options if you’ve got to login, fortunately on the login screen there’s an option to reboot the workstation, and it just so happens that the Shift trick also works here. So go to the power options (on the lower right corner of the login screen on Windows 10), hold left Shift and click Restart. If successful you’ll be greeted with the following screen.

Click the highlighted «Troubleshoot» and you’ll get to a new screen.

From here select «Advanced options», going to the *sigh* next screen:

At this screen you’ll want to click «Startup Settings» which will bring you the following screen. You might be inclined to think you could click «Command Prompt» to get a system command prompt but that’s going to require a password for a local administrator user anyway, which if you’ve got already you don’t need to do this. Also I’m not saying there’s no tricks you can’t play with recovery mode etc, I’m showing you this just for giggles 

After hitting «Restart» the workstation will reboot and you should be presented with the following:

Finally, you can hit F1 to enable kernel debugging. Phew… bring back F8. If all went according to plan you should see the boot messages again.

Getting Code Execution
You’ve now got a kernel debugger attached to the machine, the final step is to bypass the login screen. One common trick when using Firewire DMA attacks is to search for a particular pattern in memory which corresponds to LSASS’s password check and kill it. Now any login password will work, this is fine but not very sneaky (for example you’d end up with event log entries showing the login). Plus you’d need to know an appropriate user account, it’s possible the local Administrator account has been renamed.
Instead we’ll do a more targeted attack which is possible because we’ve got the kernel’s view of the system available, not a physical memory view. We’ll abuse the fact that the login screen has a button for launching Accessibility tools, this will execute a new process on the login desktop as SYSTEM. We can hijack this process creation to spawn a command prompt and do whatever we like.
First things first we’ll want to configure symbols for the machine we’re trying to attack. Without symbols we can’t enumerate the necessary kernel structures to find the bits of the system to attack. The simplest way to ensure symbols are configured correctly is to type the commands, !symfix+ then !reload into the debugger command window. Now to test issue the command !process 0 0 winlogon.exe which will find the process which is responsible for displaying the login window. If successful it should look something like the following:

The highlighted value is the kernel address of the EPROCESS structure. Copy that value value now to get an «Interactive» debugging session for that process using the command .process /i EPROCESS. Type g, then Enter (or hit F5) and you should see the following:

Now with this interactive session we can enumerate the user modules and load their symbols. Run the command !reload -user to do that. Then we can set a breakpoint on CreateProcessInternalW, which is what will be run whenever a new process is about to be created. Where this function is depends on the Windows version, on Windows 7 it’s in the kernel32 DLL, on Windows 8+ it’s in kernelbase DLL. So set the breakpoint using bp MODULE!CreateProcessInternalW replacing MODULE with the name appropriate for your system.
With the breakpoint set, click the Ease of Access button on the login screen and hopefully the breakpoint should hit. Now just to be sure issue the commands r and k to dump the current registers and show a back trace. It should look something like the following:

We can see in the stack trace that we’ve got calls to things like WlAccessibilityStartShortcutTool which seem to be related to accessibility. Now CreateProcessInternalW takes many parameters, but the only one we’re really interested in is the third parameter, which is a pointer a NUL terminated command line string. We can modify this string to instead refer to the command prompt and we should get out desired code execution. First just to be sure we’ll dump the string using the dU command, for x64 pass dU r8 (as the third parameter is stored in the r8 register), for x86 issue dU poi(@esp+c) (on 32 bit all parameters are passed on the stack). Hopefully you’ll see the following:
So WinLogon is trying to create an instance of utilman.exe, that’s good. Now this string must be writable (there’s a dumb behaviour of CreateProcess that if it’s not you’ll get a crash) so we can just overwrite it. Issue the command ezu r8 «cmd» or ezu poi(@esp+c) «cmd» depending on your bitness and then type g and enter to continue. Bathe in your awesomeness.

Downsides
So there are a number of downsides to this technique:
- The workstation MUST have a serial port on it, which isn’t a given at least these days, and it must be configured as COM1
- The workstation must be rebooted, this means that you can’t get access to any logged on user credentials or things left in memory. Another issue with this is if the workstation has a boot password you might not be able to reboot it anyway.
- The configuration of the kernel debugging must be the default.
- In the prescence of TPM enforced Bitlocker you shouldn’t be able to change the debugger configuration without also invalidating the boot measurement meaning Bitlocker won’t unlock the drive.
Still in the end the setup costs are so low, it wouldn’t take much to carry a USB to Serial adapter and a Null Modem cable in your travel bag if you’re going on site somewhere.
Mitigations
It’s all very well and good that you can do this, but is there anyway to prevent it? Well of course as many will point out if you’ve already got physical access it’s Game Over Man (R.I.P. Bill) but there are some configuration changes you can make to remove this attack vector:
- Change the default debugging settings to Local kernel debugging. This is a mode which means only a local debugger running as administrator can debug the kernel (and debugging must also be on). You can change it at an administrator command prompt with the command bcdedit /dbgsettings LOCAL. You could almost certainly automate this across your estate with a login script or GPO option.
- Don’t buy Workstations with serial ports. Sounds dumb, and you probably have little choice but don’t get things on your purchased devices which serve no useful purpose. Presumably some vendors still provide a configuration option for this.
- If you do have serial ports disable them in the BIOS or, if you can’t disable them outright change the default I/O port from 0x3F8. Legacy COM ports are not plug and play, Windows will use an explicit I/O port to talk to COM1, if your COM port isn’t configured as COM1 Windows can’t use it. This is also important if you’ve installed aftermarket COM port cards, while they tend not to be configured as COM1 they _could_ be.
- Finally use Bitlocker with a TPM, this is a good idea regardless as it would also block someone being able to pull the HDD out and modify it offline (or just up and stealing the thing for the information on the disk). Bitlocker + TPM would prevent someone enabling debugging on a system without knowing the Bitlocker recovery key. At least on Windows 8+ entering the System Settings option requires changing the boot configuration temporarily, which will cause the TPM boot measurement to fail. I’ve not tested this on Windows 7 though, hitting F8 might not change the boot measurement as I believe that menu is in the winload.exe boot process, at that point Bitlocker’s key has already been unsealed. If anyone has a Windows 7 machine with Bitlocker and TPM let me know the result of testing that
Another interesting thing is the latest version of Windows 10 available when I’m writing this (1607, Anniversary Edition) now configures kernel debugging to Local only by default. However it’s possible this isn’t changed during upgrades so you’d still want to take a look.
Conclusions
So this is a fun, but not particularly serious issue if someone’s got physical access to your machine and you’ve covered a number of the common attack vectors (like HDD access, BIOS, Firewire). Good advice is physical access a potential attack vector for external but also internal threats and it pays to do everything you can to lock your estate down. You should also consider deploying Bitlocker even if they device isn’t portable, it makes it more difficult to compromise a workstation through logical attacks on the boot process and also makes it harder to someone to extract sensitive data from a stolen machine.